Article

Utilizing Environmental DNA for Early Monitoring of Non-Indigenous Fish Species in Maritime Ballast Water

1
CAS Key Laboratory of Marine Ecology and Environmental Sciences, Institute of Oceanology, Chinese Academy of Sciences, Qingdao 266071, China
2
College of Marine Sciences, University of Chinese Academy of Sciences, Beijing 100049, China
3
School of Marine Sciences, Ningbo University, Ningbo 315823, China
*
Author to whom correspondence should be addressed.
Fishes 2025, 10(5), 241; https://doi.org/10.3390/fishes10050241
Submission received: 27 April 2025 / Revised: 16 May 2025 / Accepted: 19 May 2025 / Published: 21 May 2025
(This article belongs to the Section Fishery Economics, Policy, and Management)

Abstract

:
Ballast water has become a significant vector for the global spread of non-indigenous aquatic species. These species may cause severe ecological disruption and economic losses when introduced into new environments. Traditional monitoring techniques often lack the sensitivity and efficiency required for early monitoring, hindering timely and effective management. In this study, we used environmental DNA (eDNA) technology to assess fish diversity and identify non-indigenous fish species in ballast water samples collected from 14 international vessels entering Dongjiakou Port, China. Genetic evidence of five non-indigenous fish species was monitored, including two recognized invasive species (Lates calcarifer and Anguilla anguilla). Among all groups, samples from Group B (V2, V3, V6, V8) exhibited the highest diversity of non-indigenous species, suggesting regional differences in species composition that may reflect source port biodiversity. These findings highlight the utility of eDNA-based monitoring not only for early detection of potentially non-indigenous taxa but also for capturing biogeographic patterns associated with global maritime traffic. By demonstrating the effectiveness of this approach at an international port, this study contributes a scientific foundation for both local biodiversity conservation and broader ecological surveillance, offering valuable insights for the ongoing development of ballast water management strategies worldwide.
Key Contribution: This study provides the first comprehensive application of eDNA technology for monitoring non-indigenous fish species in ballast water from vessels at Dongjiakou Port, providing evidence that non-indigenous fish species can be introduced by ballast water, confirming its role as a vector of biological invasion, and proposing an integrated monitoring and management framework to mitigate invasion risks.

1. Introduction

Ballast water is routinely taken on board during cargo operations to maintain vessel stability and structural integrity during navigation [1]. While essential for safe maritime transport, the large-scale global transfer of ballast water has inadvertently become a major pathway for the dissemination of non-indigenous aquatic organisms [2,3]. During ballast water intake, a diverse array of organisms, including bacteria, phytoplankton, zooplankton, and invertebrates, can be simultaneously entrained into ballast tanks [4,5,6]. Despite the enclosed and often harsh conditions within these tanks, many of these organisms exhibit remarkable resilience and can remain viable throughout transoceanic voyages lasting several weeks [7]. Upon discharge into new environments at destination ports, these non-indigenous species may display strong ecological adaptability, enabling them to establish stable populations and substantially increasing the risk of biological invasions [8]. Invasive species can disrupt native ecosystems by preying on fish eggs and larvae, competing for food and habitat resources, or directly displacing indigenous species, ultimately altering community structures and leading to population declines [9]. Moreover, hybridization with native species may occur, reducing overall genetic diversity [10]. The management of invasive species, ecosystem restoration, and the implementation of rapid response measures impose significant financial burdens on society. Global estimates suggest that aquatic biological invasions have caused cumulative economic losses of up to USD 345 billion, with an annual impact reaching USD 23 billion in 2020 alone, highlighting the profound socioeconomic consequences associated with aquatic invasions [11]. In light of these challenges, the development of efficient, sensitive, and practical monitoring strategies for ballast water is critical for the early monitoring of potential invaders, accurate ecological risk assessment, and the implementation of effective biosecurity measures.
Conventional monitoring methods primarily rely on morphological identification, which presents significant limitations when dealing with rare species, early developmental stages, or morphologically similar taxa [12]. These approaches also require extensive taxonomic expertise, are time-consuming, and often lack the responsiveness necessary for modern ecological surveillance. With advances in molecular technologies, environmental DNA (eDNA) analysis has emerged as a powerful tool for aquatic biodiversity monitoring, owing to its non-invasive nature, high sensitivity, and broad taxonomic coverage. eDNA refers to genetic material released by organisms into their environment through mucus, feces, gametes, skin cells, blood, or decomposing tissues [13]. By extracting DNA from environmental samples such as water or sediment and analyzing it using molecular techniques, the presence of target species can be reliably monitored [14,15]. Compared to traditional methods, eDNA enables efficient monitoring of low-abundance, elusive, or cryptic species, making it particularly well-suited for large-scale and long-term ecological assessments [16]. This technology represents a significant advancement in the development of rapid, accurate, and effective tools for invasive species monitoring and aquatic ecosystem management.
Up to now, eDNA technology has been widely applied to assess the biodiversity of various taxonomic groups in ballast water, including bacteria, viruses, phytoplankton, zooplankton, protozoans, and metazoans [2,17,18,19,20,21]. However, although evidence suggests that fish can be transported across long distances via ballast water [22], studies specifically utilizing molecular techniques to systematically monitor fish assemblages remain limited. As functionally important components of aquatic ecosystems, invasive fish species can trigger cascading ecological effects, underscoring the critical importance of their early monitoring. Accurately identifying and characterizing fish communities in ballast water is therefore essential for understanding and mitigating the risks associated with species introductions. Against this background, the present study aims to systematically investigate the composition and diversity of fish species in ballast water using eDNA-based approaches.
The present study focused on ballast water samples collected from 14 internationally operated vessels docking at Dongjiakou Port. As a major component of Qingdao Port, Dongjiakou hosts China’s largest 400,000-ton iron ore terminal and is capable of accommodating regular calls from ultra-large vessels [23,24]. Between 2018 and 2021, the number of vessels visiting Dongjiakou Port increased steadily, reflecting its growing significance within the regional economy [25]. However, the high frequency of vessel traffic also substantially elevates the risk of biological invasions associated with ballast water discharge, posing a potential threat to local marine biodiversity and fisheries resources. Accordingly, pre-discharge monitoring and effective treatment of ballast water at ports are critical measures to minimize ecological risks and to safeguard native aquatic ecosystems.
This study conducted a systematic molecular assessment of fish communities and non-indigenous species in ballast water samples collected from international vessels arriving at Dongjiakou Port, using eDNA metabarcoding technology. The main objectives were (1) to rapidly detect fish species composition in ballast water from vessels via eDNA-based analysis, thereby demonstrating the effectiveness of this non-invasive method for biodiversity assessments at ports; (2) to analyze fish community structure across different vessels through taxonomic identification and diversity comparison in order to better understand variation in species assemblages transported via ballast water; and (3) to assess the occurrence of non-indigenous fish species, providing scientific evidence to inform early detection strategies and improve port-level management practices. Importantly, rather than directly confirming live species transport, the eDNA signals obtained from ballast tanks likely reflect the biological composition of source port communities. Therefore, this study not only provides technical support for controlling the risk of species dispersal through maritime activities, but also highlights the broader potential of ballast water as a unique medium for global-scale biodiversity surveillance. The findings contribute both theoretical insight and practical guidance for advancing marine biosecurity and ecological monitoring, with this case study offering valuable experience from China.

2. Materials and Methods

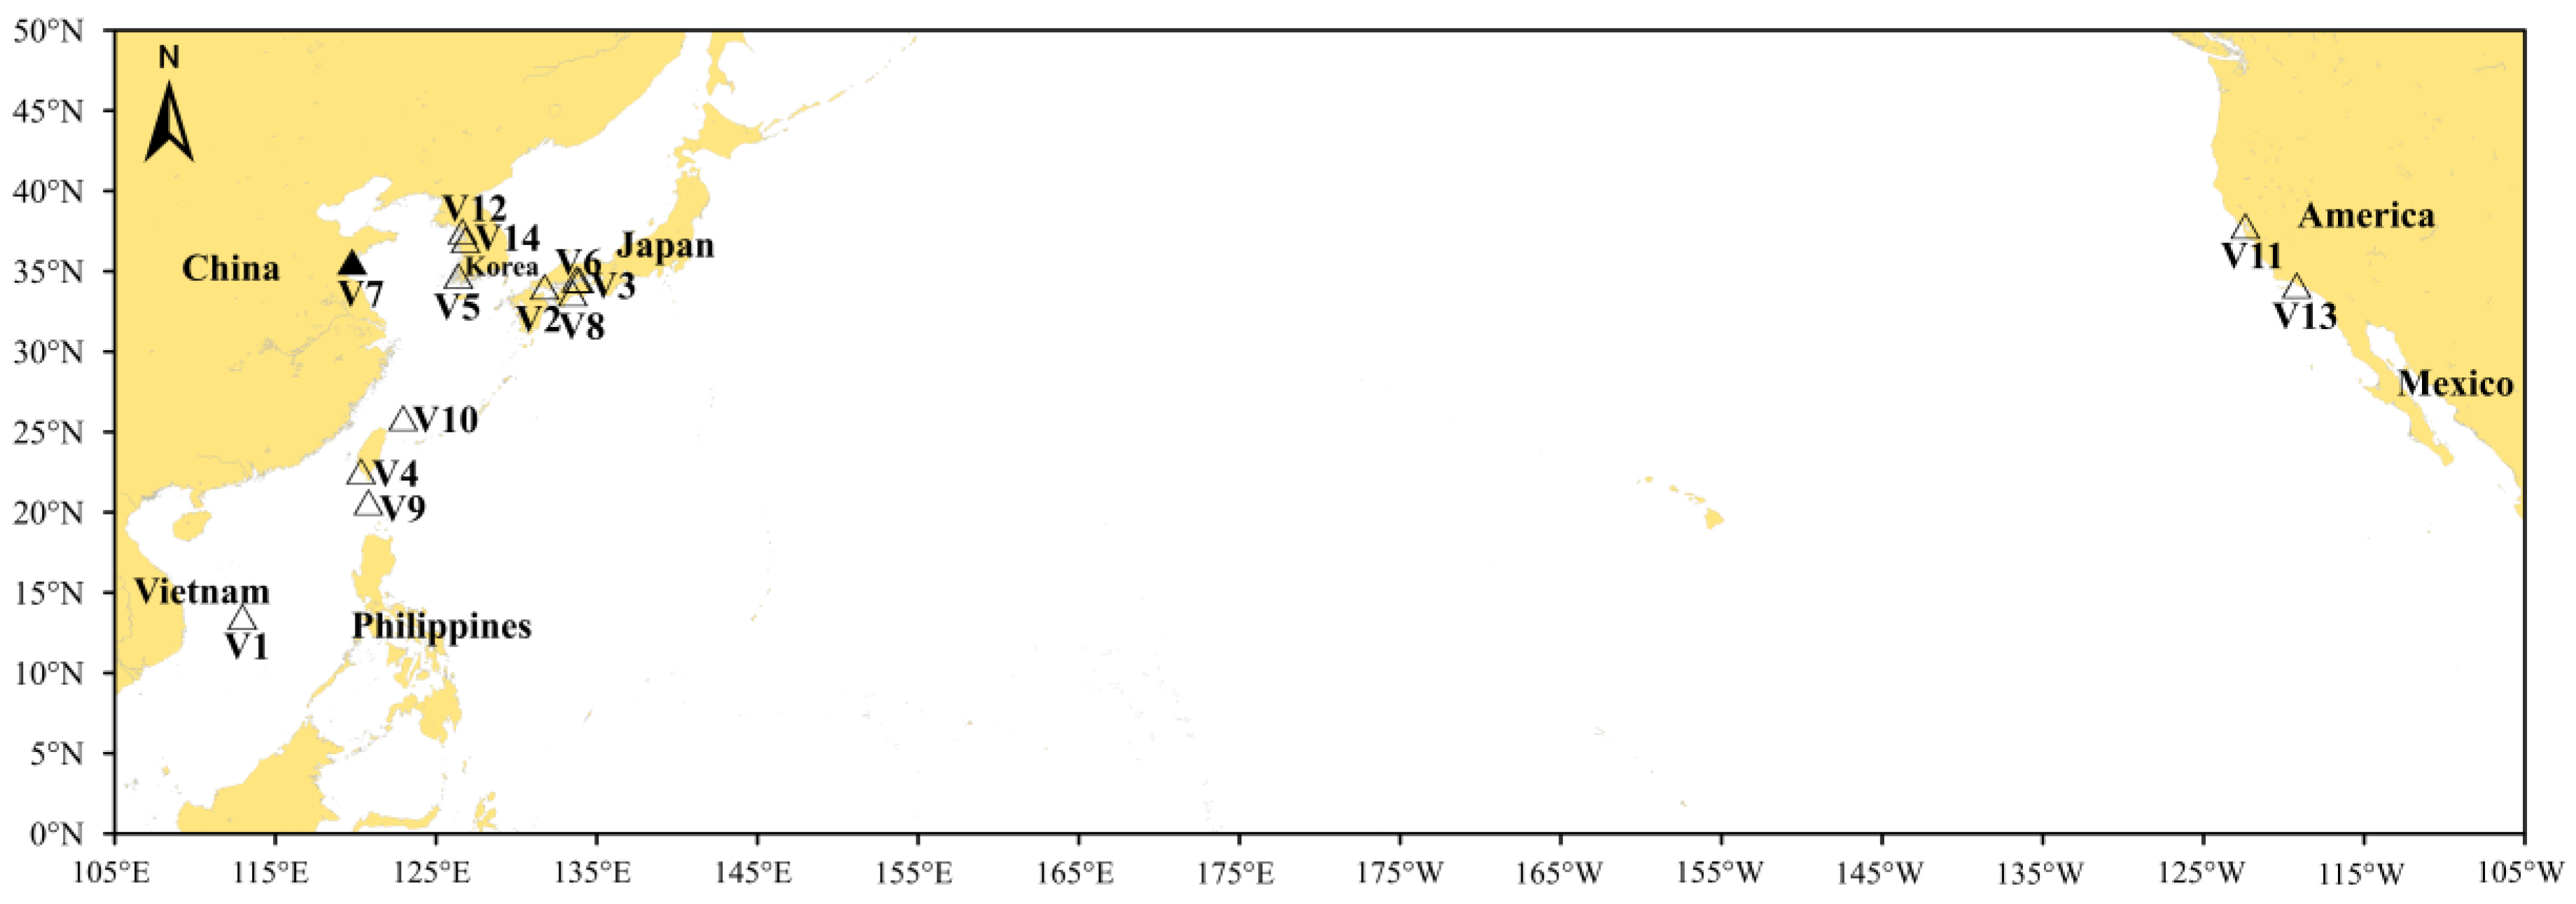
2.1. Sample Collection and Filtration

Between 11 March and 23 November 2024, ballast water samples were collected from 14 vessels docked at Dongjiakou Port. The specific ballast water intake locations for each vessel are shown in Figure 1. Notably, the ballast water intake for vessel V7 took place directly at Dongjiakou Port. Considering the geographical locations of the intake ports, the 14 sampling sites were categorized into six groups (A–F), as detailed in Table 1. Additionally, samples V51 and V52-collected from separate ballast tanks of vessel V5-were assigned to Group G, while samples V61, V62, and V63 from different tanks of vessel V6 were classified into Group H (Table 1). To assess intra-vessel variation in community composition, multiple ballast tanks from vessels V5 and V6 were sampled and compared. Except for vessels V5 and V6, from which ballast water was collected from multiple tanks, samples from all other vessels were taken from a single ballast tank. A total of 3 L of water was collected from each vessel. To minimize DNA degradation, 100 mL of DNA preservation solution (Tiandz Inc., Beijing, China) was added to each bottle prior to sample collection [26]. All sampling procedures were conducted in accordance with the International Maritime Organization (IMO) Guidelines for Ballast Water Sampling (G2) [27]. Comprehensive sampling details, including tank identifiers, sample volumes, and relevant vessel parameters, are presented in Table 2.
Following sample collection, filtration was conducted under controlled laboratory conditions using Sterivex™-GP filter cartridges (pore size: 0.22 μm; EMD Millipore Corp., Billerica, MA, USA). The filtration process was facilitated by a peristaltic pump (Masterflex, Vernon Hills, IL, USA) operating at a flow rate of 60 rpm. Upon completion of filtration, DNA preservation solution was added directly into the filter cartridges to stabilize the captured genetic material. The filters were then stored at −20 °C until subsequent eDNA extraction.
To construct a representative vessel-level dataset, a sample pooling strategy was employed in this study. Specifically, three independent samples collected from the same ballast tank were combined after filtration but prior to DNA extraction. In contrast, samples from different ballast tanks within the same vessel were processed independently to accurately assess inter-tank variation in community composition. In the final analysis, data from multiple ballast tanks within each vessel were aggregated to form a composite sample representing that vessel, which was subsequently used for inter-vessel comparisons. To minimize the risk of contamination, all equipment and instruments were first rinsed with ultrapure water and then thoroughly sterilized using 75% ethanol prior to use. Subsequently, each sampling tool was rinsed again with water collected near the corresponding sampling site to further reduce the potential for cross-contamination. In addition, ultrapure water was filtered and processed as a negative control alongside the samples to detect and monitor potential contamination during the experimental procedures.

2.2. DNA Extraction and PCR Amplification

Total DNA was extracted from all filter membranes using the DNeasy PowerSoil Pro Kit (Qiagen, Germany) following the manufacturer’s instructions. The concentration of extracted DNA was quantified using a NanoDrop spectrophotometer (Thermo Fisher Scientific, Waltham, MA, USA), and DNA quality was assessed by 0.8% agarose gel electrophoresis. Subsequently, PCR amplification was performed using the MiFish universal primers targeting the mitochondrial 12S rRNA gene region [28]. Each sample was amplified in triplicate, and the resulting PCR products were pooled in equal volumes prior to downstream processing. The 25 μL PCR reaction mixture contained 5 μL of 5× reaction buffer, 5 μL of 5× High GC buffer, 2 μL of dNTPs (10 mM each), 1 μL each of forward and reverse primers (10 μM), 2 μL of DNA template, 8.75 μL of nuclease-free water, and 0.25 μL of Q5 High-Fidelity DNA Polymerase (New England Biolabs, Ipswich, MA, USA). Thermal cycling was performed under the following conditions: an initial denaturation at 98 °C for 5 min, followed by 30 cycles of denaturation at 98 °C for 30 s, annealing at 58 °C for 30 s, and extension at 72 °C for 45 s, with a final extension at 72 °C for 5 min. Negative controls were included in all PCR experiments to monitor for potential contamination. Any sample exhibiting amplification in the corresponding negative control was excluded from further analysis to ensure the reliability of the results.

2.3. Sequencing and Sequence Analysis

Sequencing libraries were prepared using the KAPA DNA HyperPlus Library Preparation Kit (KAPA Biosystems, Boston, MA, USA) and subjected to paired-end sequencing on the Illumina NovaSeq platform. All raw sequence data were generated in FASTQ format for subsequent analysis. Reads were clustered into operational taxonomic units (OTUs) based on sequence similarity using the vsearch pipeline. Initially, primer sequences were trimmed using Cutadapt, and paired-end reads were merged with the fastq_mergepairs module in vsearch. Subsequent quality filtering was performed using fastq_filter. Dereplication was carried out using derep_fulllength, and sequences were clustered at 98% similarity using cluster_size. Chimeric sequences were identified and removed using uchime_denovo. The resulting high-quality sequences were then further clustered at 97% similarity to generate representative sequences and construct an OTU table. Singleton OTUs (i.e., OTUs represented by only a single sequence) were removed to improve data robustness [17]. OTUs monitored in negative controls were processed following previously published protocols to minimize the impact of potential contamination on the final dataset [29].

2.4. Species Composition Analysis

Taxonomic annotation of the 12S rRNA sequence data was conducted using the MitoFish database (https://mitofish.aori.u-tokyo.ac.jp/; accessed on 2 January 2025). To ensure taxonomic accuracy, annotation results were cross-validated against the World Register of Marine Species (WoRMS; http://www.marinespecies.org/; accessed on 15 January 2025). This study specifically focused on marine fishes; therefore, sequences assigned to irrelevant taxonomic groups were excluded from the analysis. These excluded groups included freshwater and terrestrial organisms, marine fungi, viruses, invertebrates, non-fish vertebrates, and entries labeled as “unclassified”, “uncultured”, “unidentified”, or “metagenome”. To further validate the accuracy and reliability of eDNA-based species identification, all monitored taxa were cross-checked using multiple databases and reference sources, including FishBase (https://www.fishbase.se/search.php; accessed on 15 January 2025), the Checklist of Marine Biota of China [30], and the Global Biodiversity Information Facility (GBIF; https://www.gbif.org/; accessed on 15 January 2025). Species not previously recorded in the geographic region corresponding to the ballast water uptake location were excluded from downstream analyses. To visualize species composition, histograms were generated using Origin 2021 to depict taxonomic differences at the species level across samples. Heatmaps illustrating species composition and relative abundance among sampling sites, including between different vessels and ballast tanks, were created using the “pheatmap” package in R version 4.2.3. Relative abundance of each species was calculated based on the number of OTUs assigned to that species, not by read count. Additionally, UpSet plots were generated using the “UpSetR” package to summarize total species richness, shared taxa among samples (both inter-vessel and inter-tank), and unique species, thereby highlighting patterns of species similarity and differentiation.

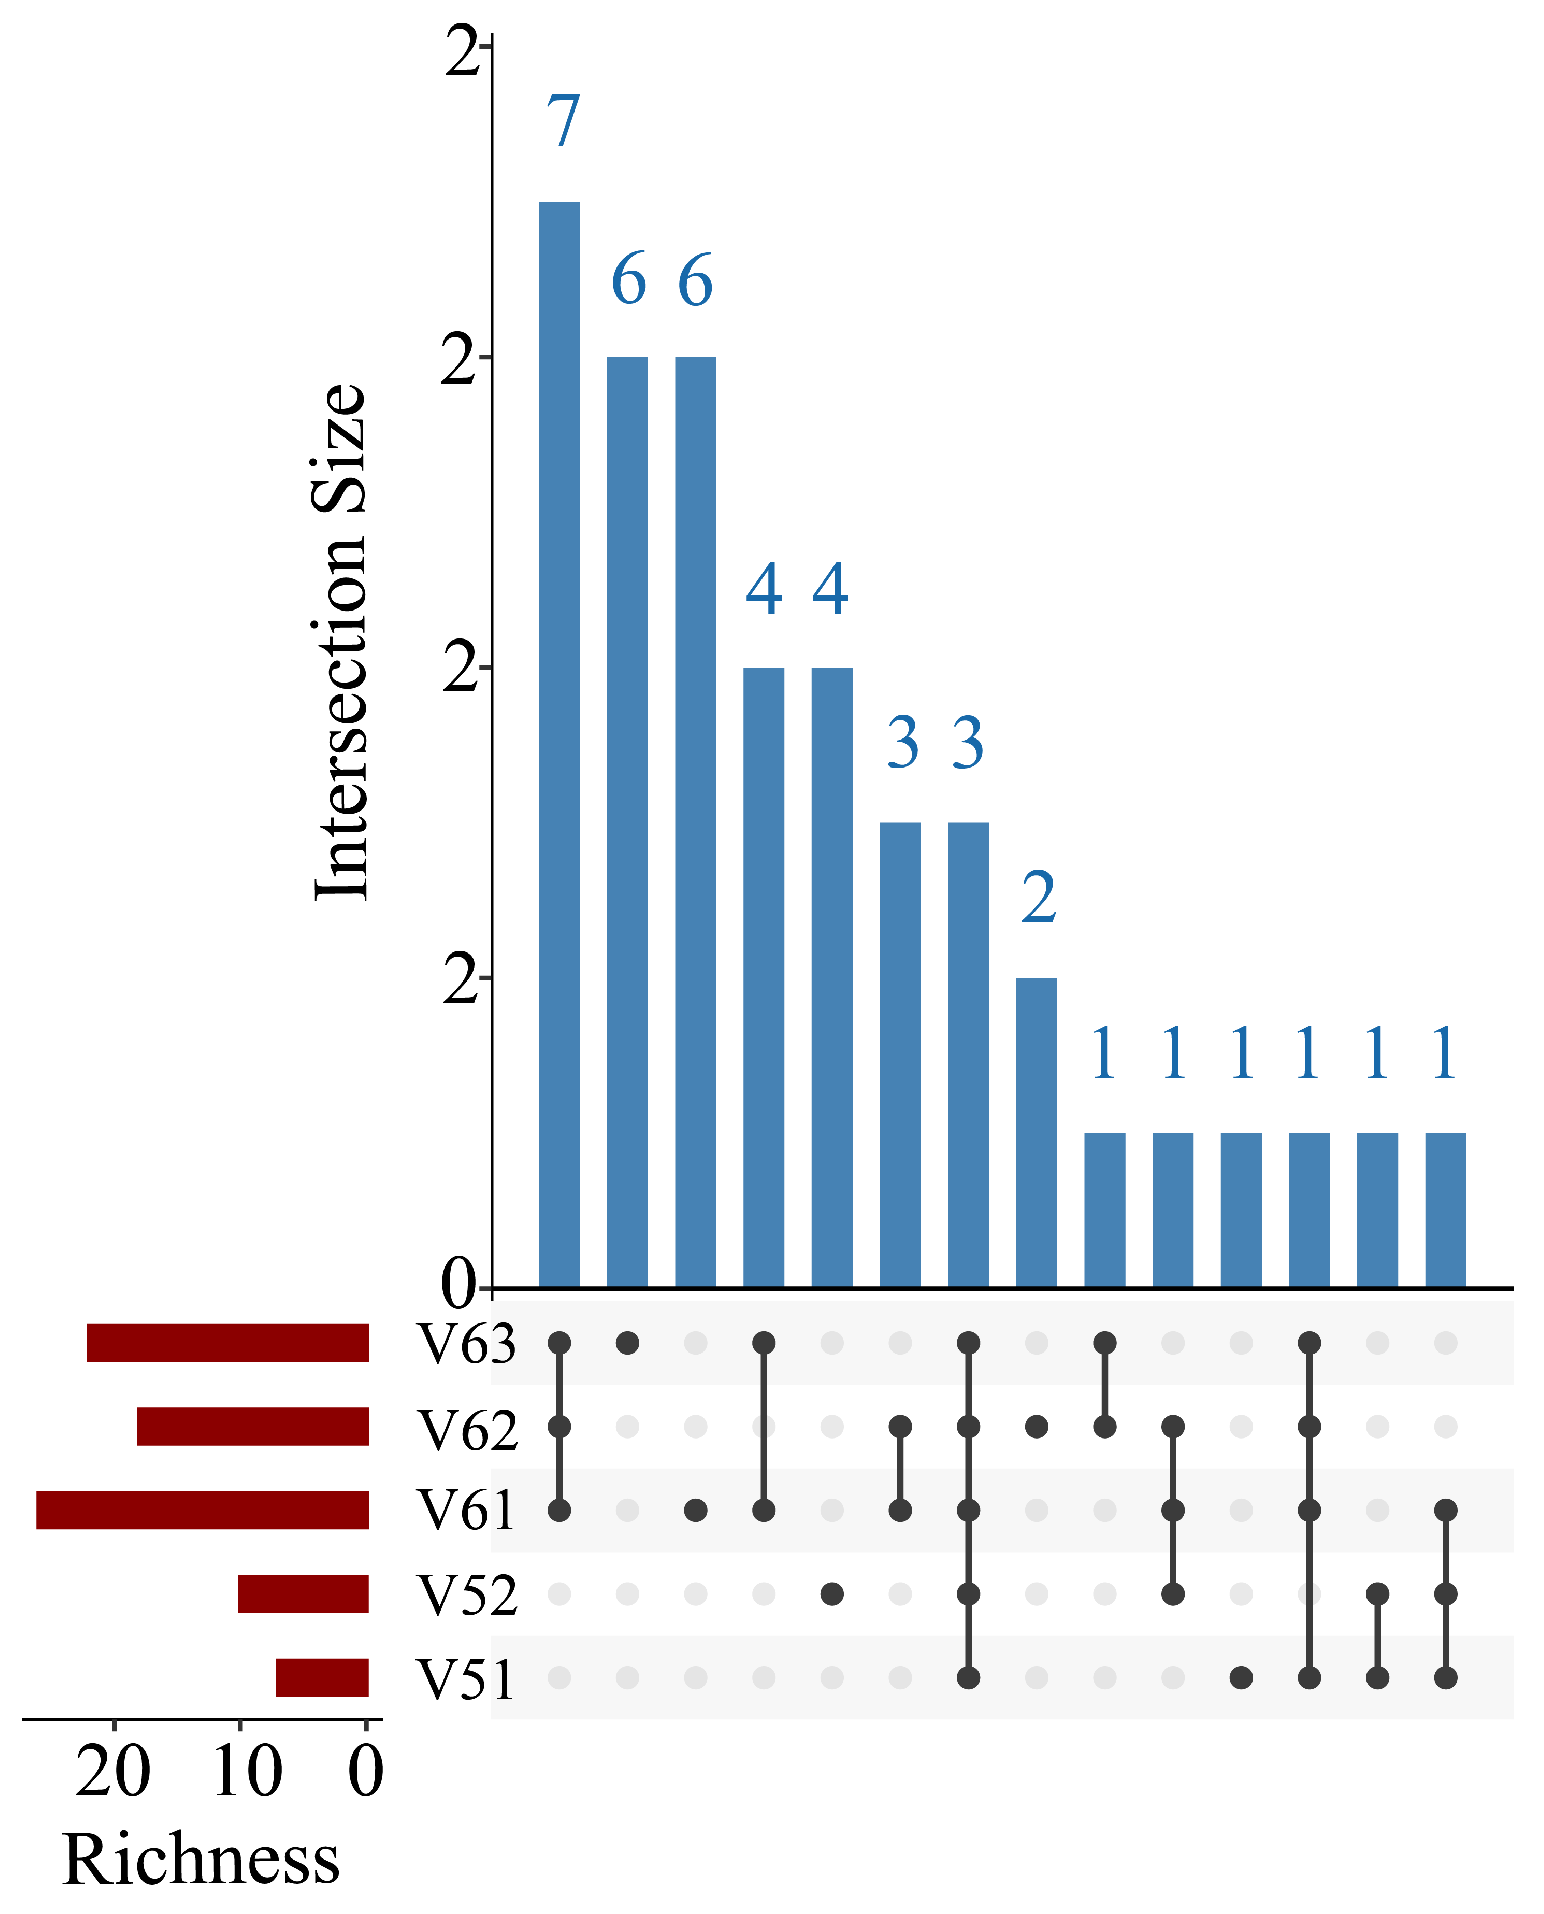
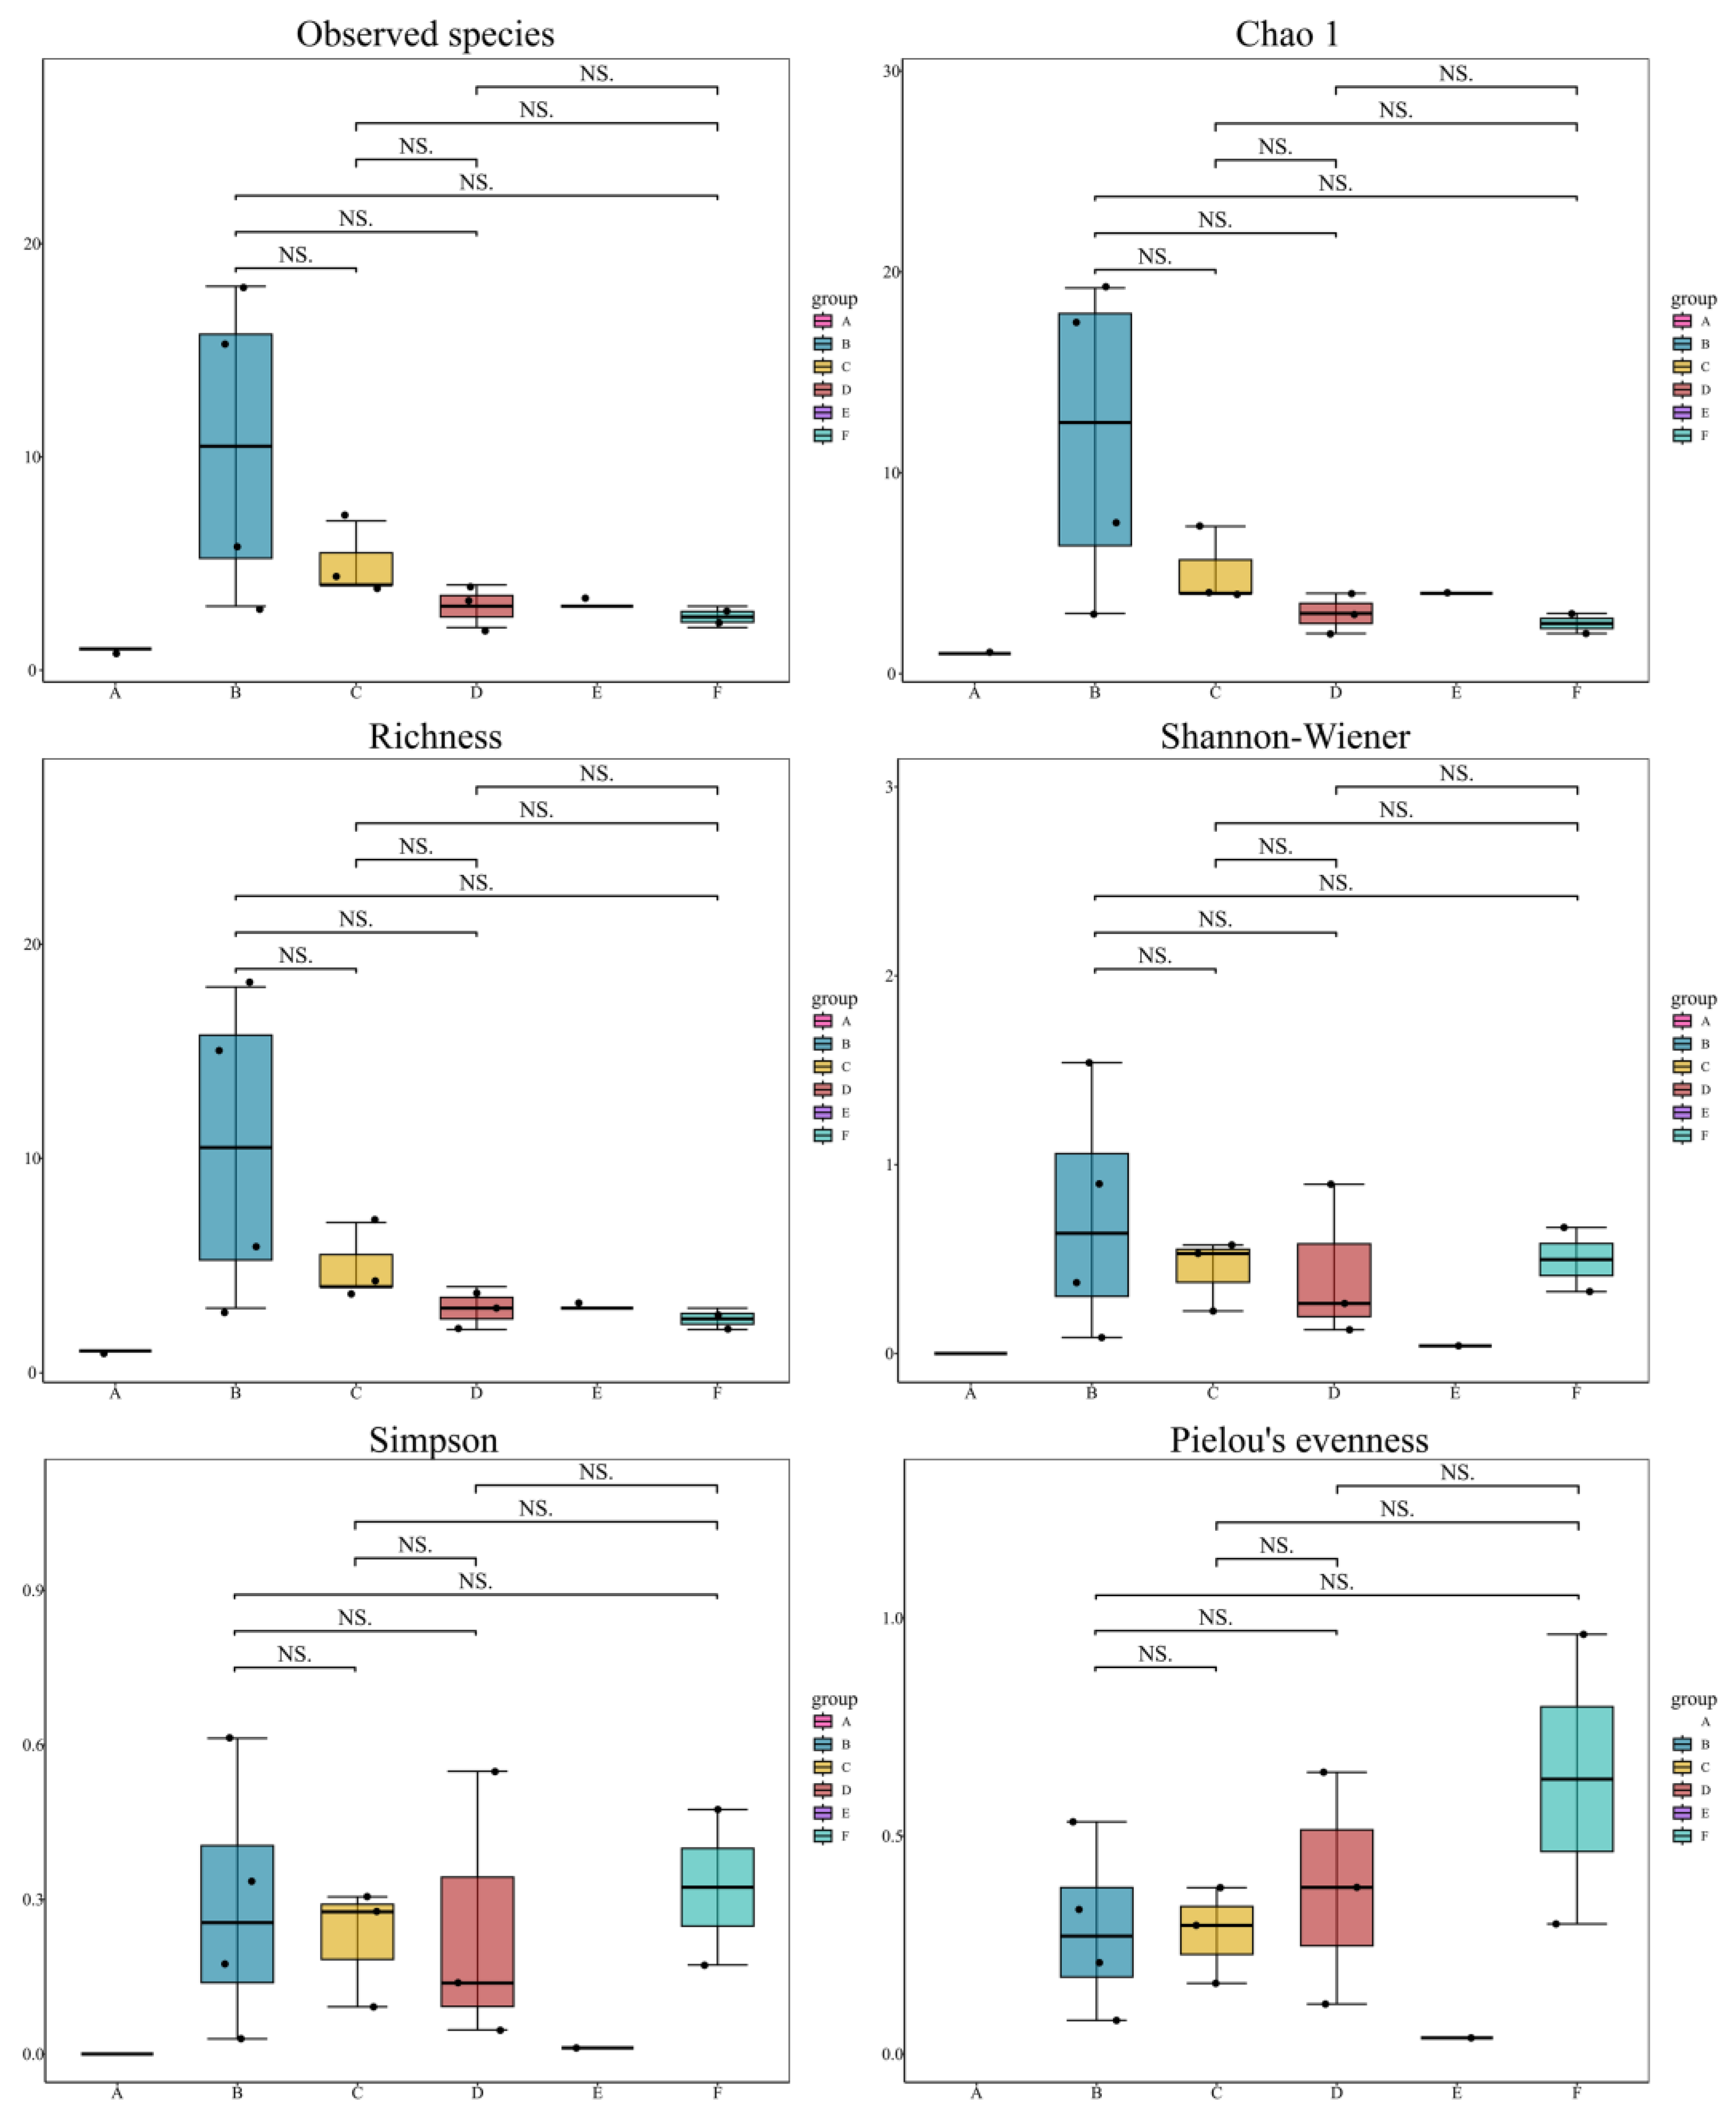
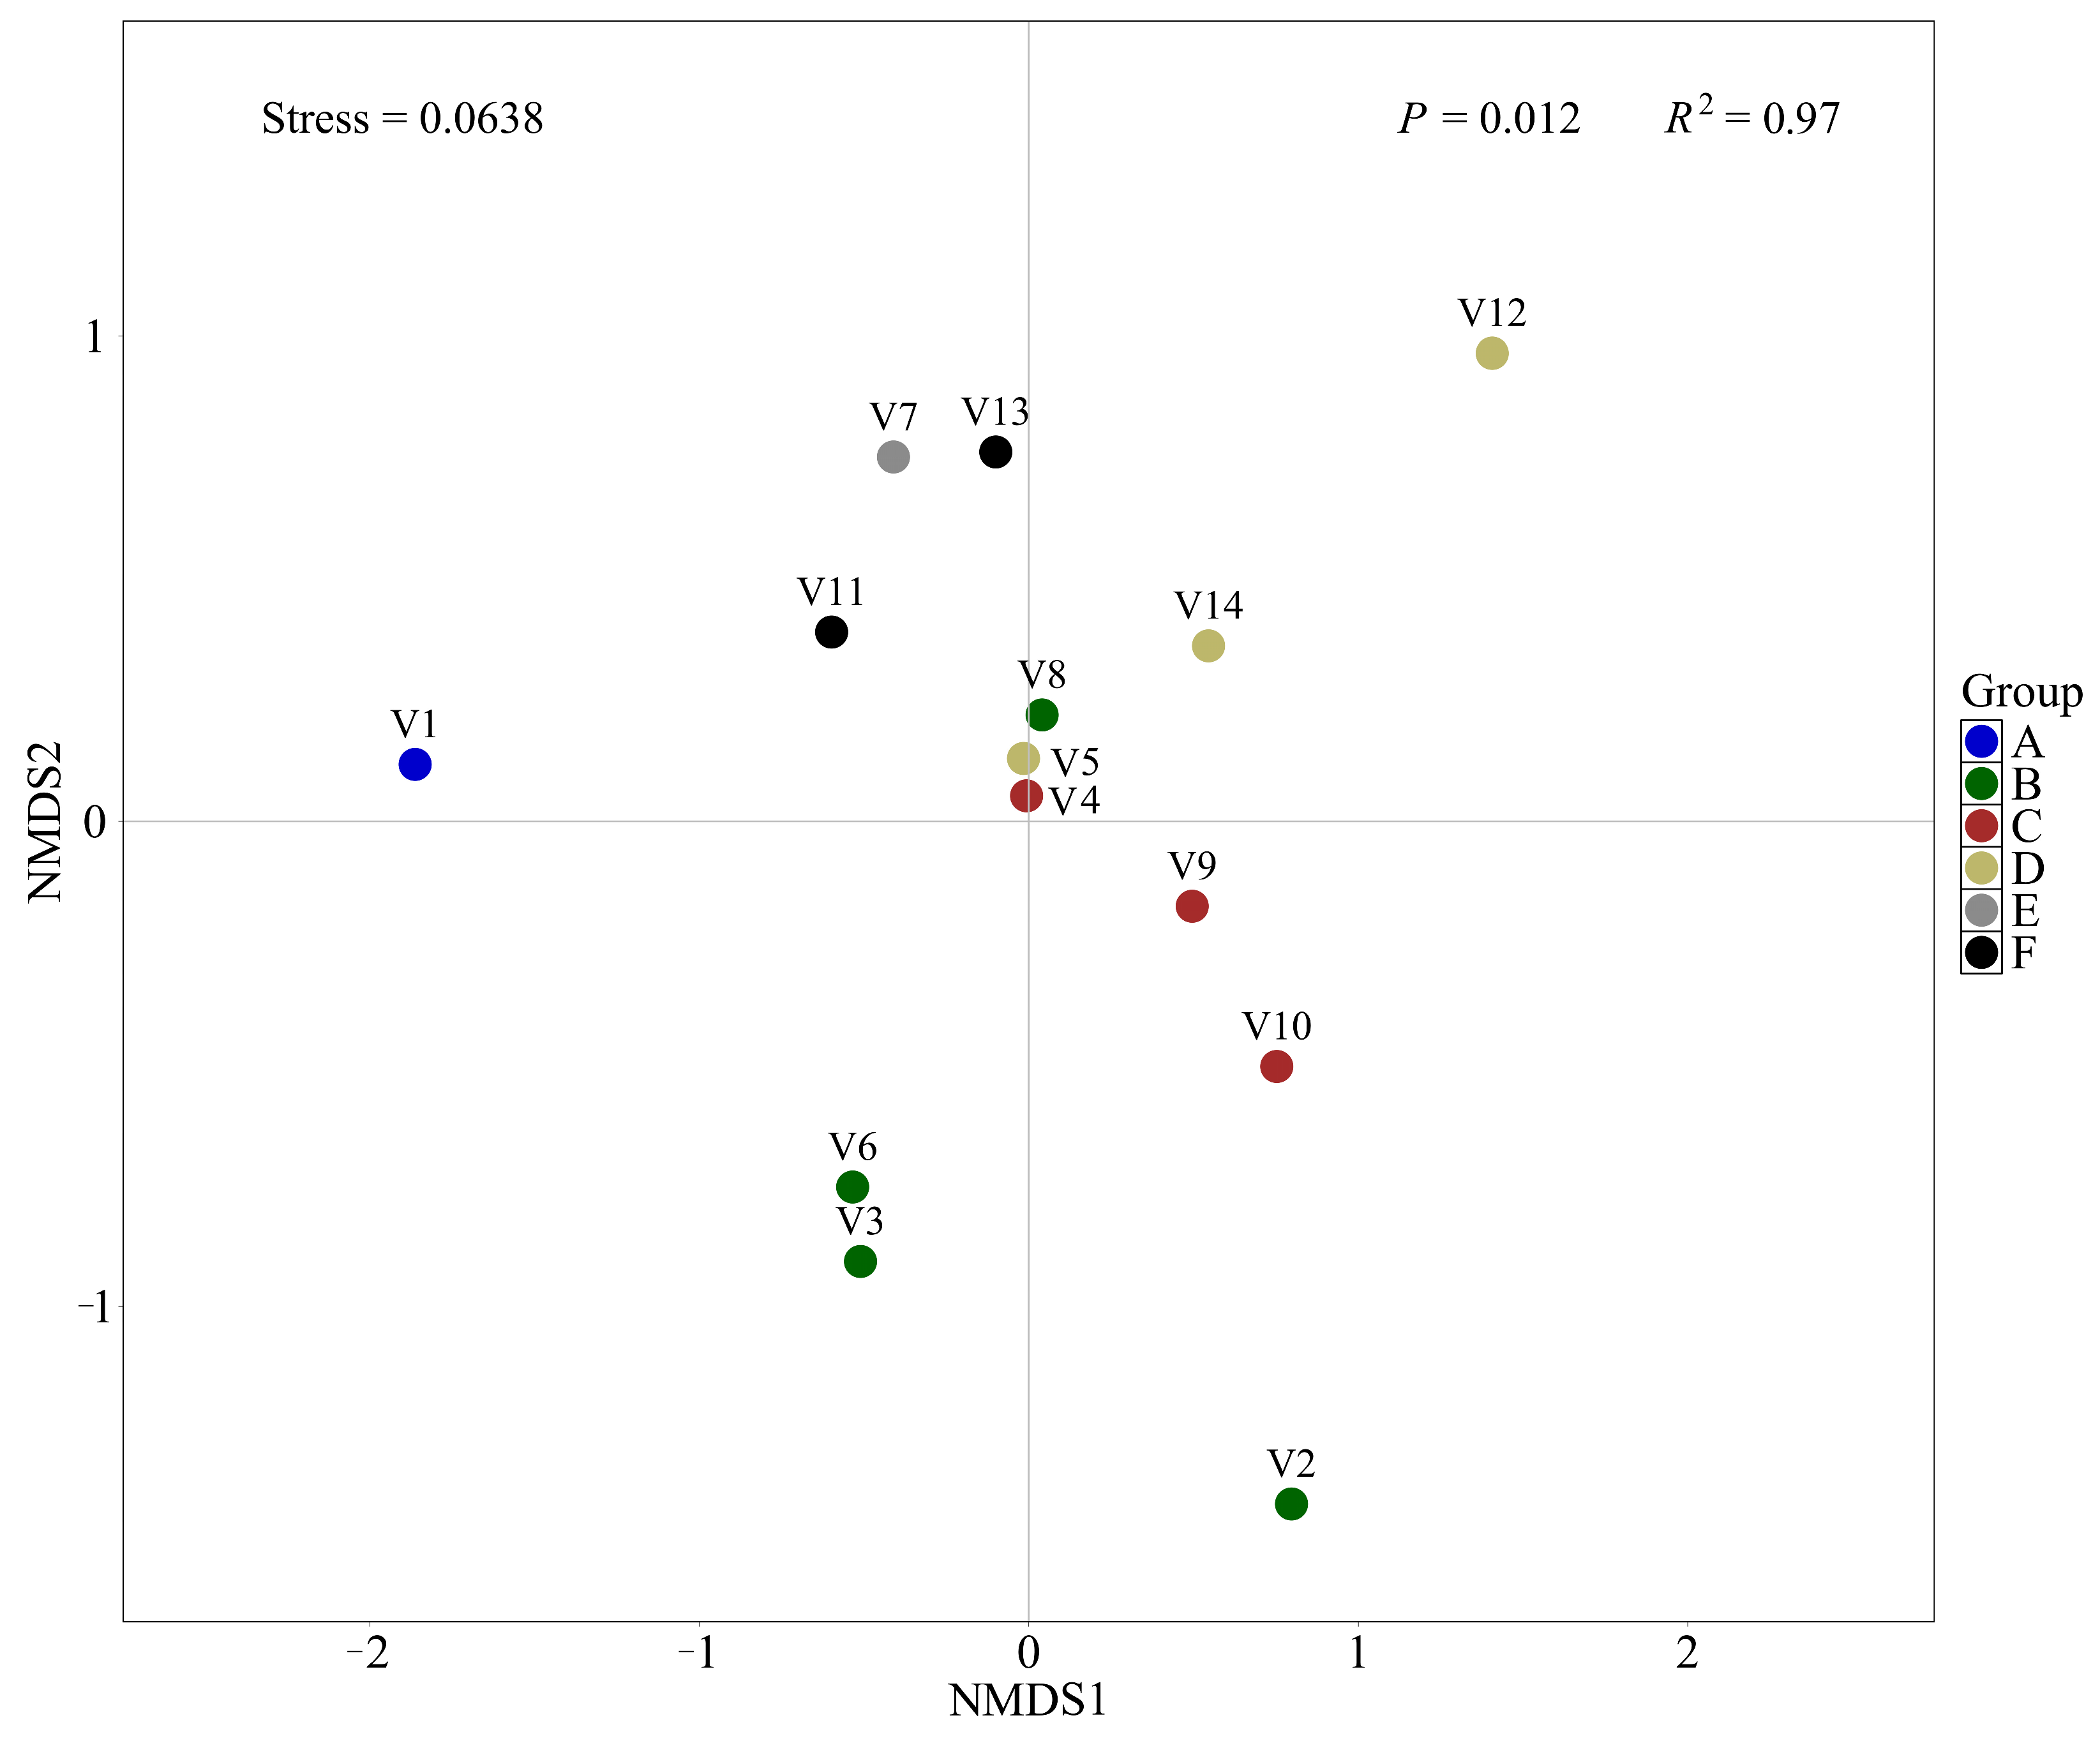
2.5. α- and β-Diversity Analysis

To assess differences in community composition among the six groups, both α-diversity and β-diversity indices were calculated and visualized. In addition, α-diversity indices were also calculated for samples from different ballast tanks within the same vessel to compare intra-vessel variation in community structure. All visualizations were generated using the “ggplot2” and “vegan” packages in R version 4.0.3. Due to variations in sequencing depth and species abundance across samples, OTU data were rarefied to ensure comparability of diversity metrics. Multiple commonly used indices were employed to comprehensively evaluate species diversity and distribution patterns. For α-diversity analysis, this study used Observed species, Chao1 index, and Richness index to estimate species richness, employed the Shannon-Wiener and Simpson indices to assess community diversity, and calculated Pielou’s evenness Index to measure the uniformity of species distribution within communities [31,32,33,34,35]. For β-diversity analysis, non-metric multidimensional scaling (NMDS) plots based on Bray–Curtis dissimilarity were generated to explore compositional differences among samples and between groups, providing a visual interpretation of community variation.

2.6. Non-Indigenous Fish Species Assessment

This study aimed to evaluate the potential risk of aquatic biological invasions associated with ballast water discharge from vessels operating at Dongjiakou Port, with a specific focus on non-indigenous fish species. The analysis centered on the abundance, distribution patterns, and potential invasion risks of non-indigenous species monitored in ballast water. Ballast water samples were collected from 14 vessels and categorized into six groups (Groups A–F) based on their geographic origin. eDNA metabarcoding was employed to assess fish species composition across all samples. Non-native species were identified through a comprehensive review of relevant literature and authoritative reference material [36,37]. Additionally, the invasive status of each species in China was verified using the reference “China’s Invasive Alien Species” [38]. For each identified non-indigenous species, the relative abundance within individual vessel samples was calculated. The richness, abundance, and frequency of occurrence of non-indigenous species were then quantified for each sample group to evaluate the extent of invasive species carriage among vessels from different regions.

3. Results

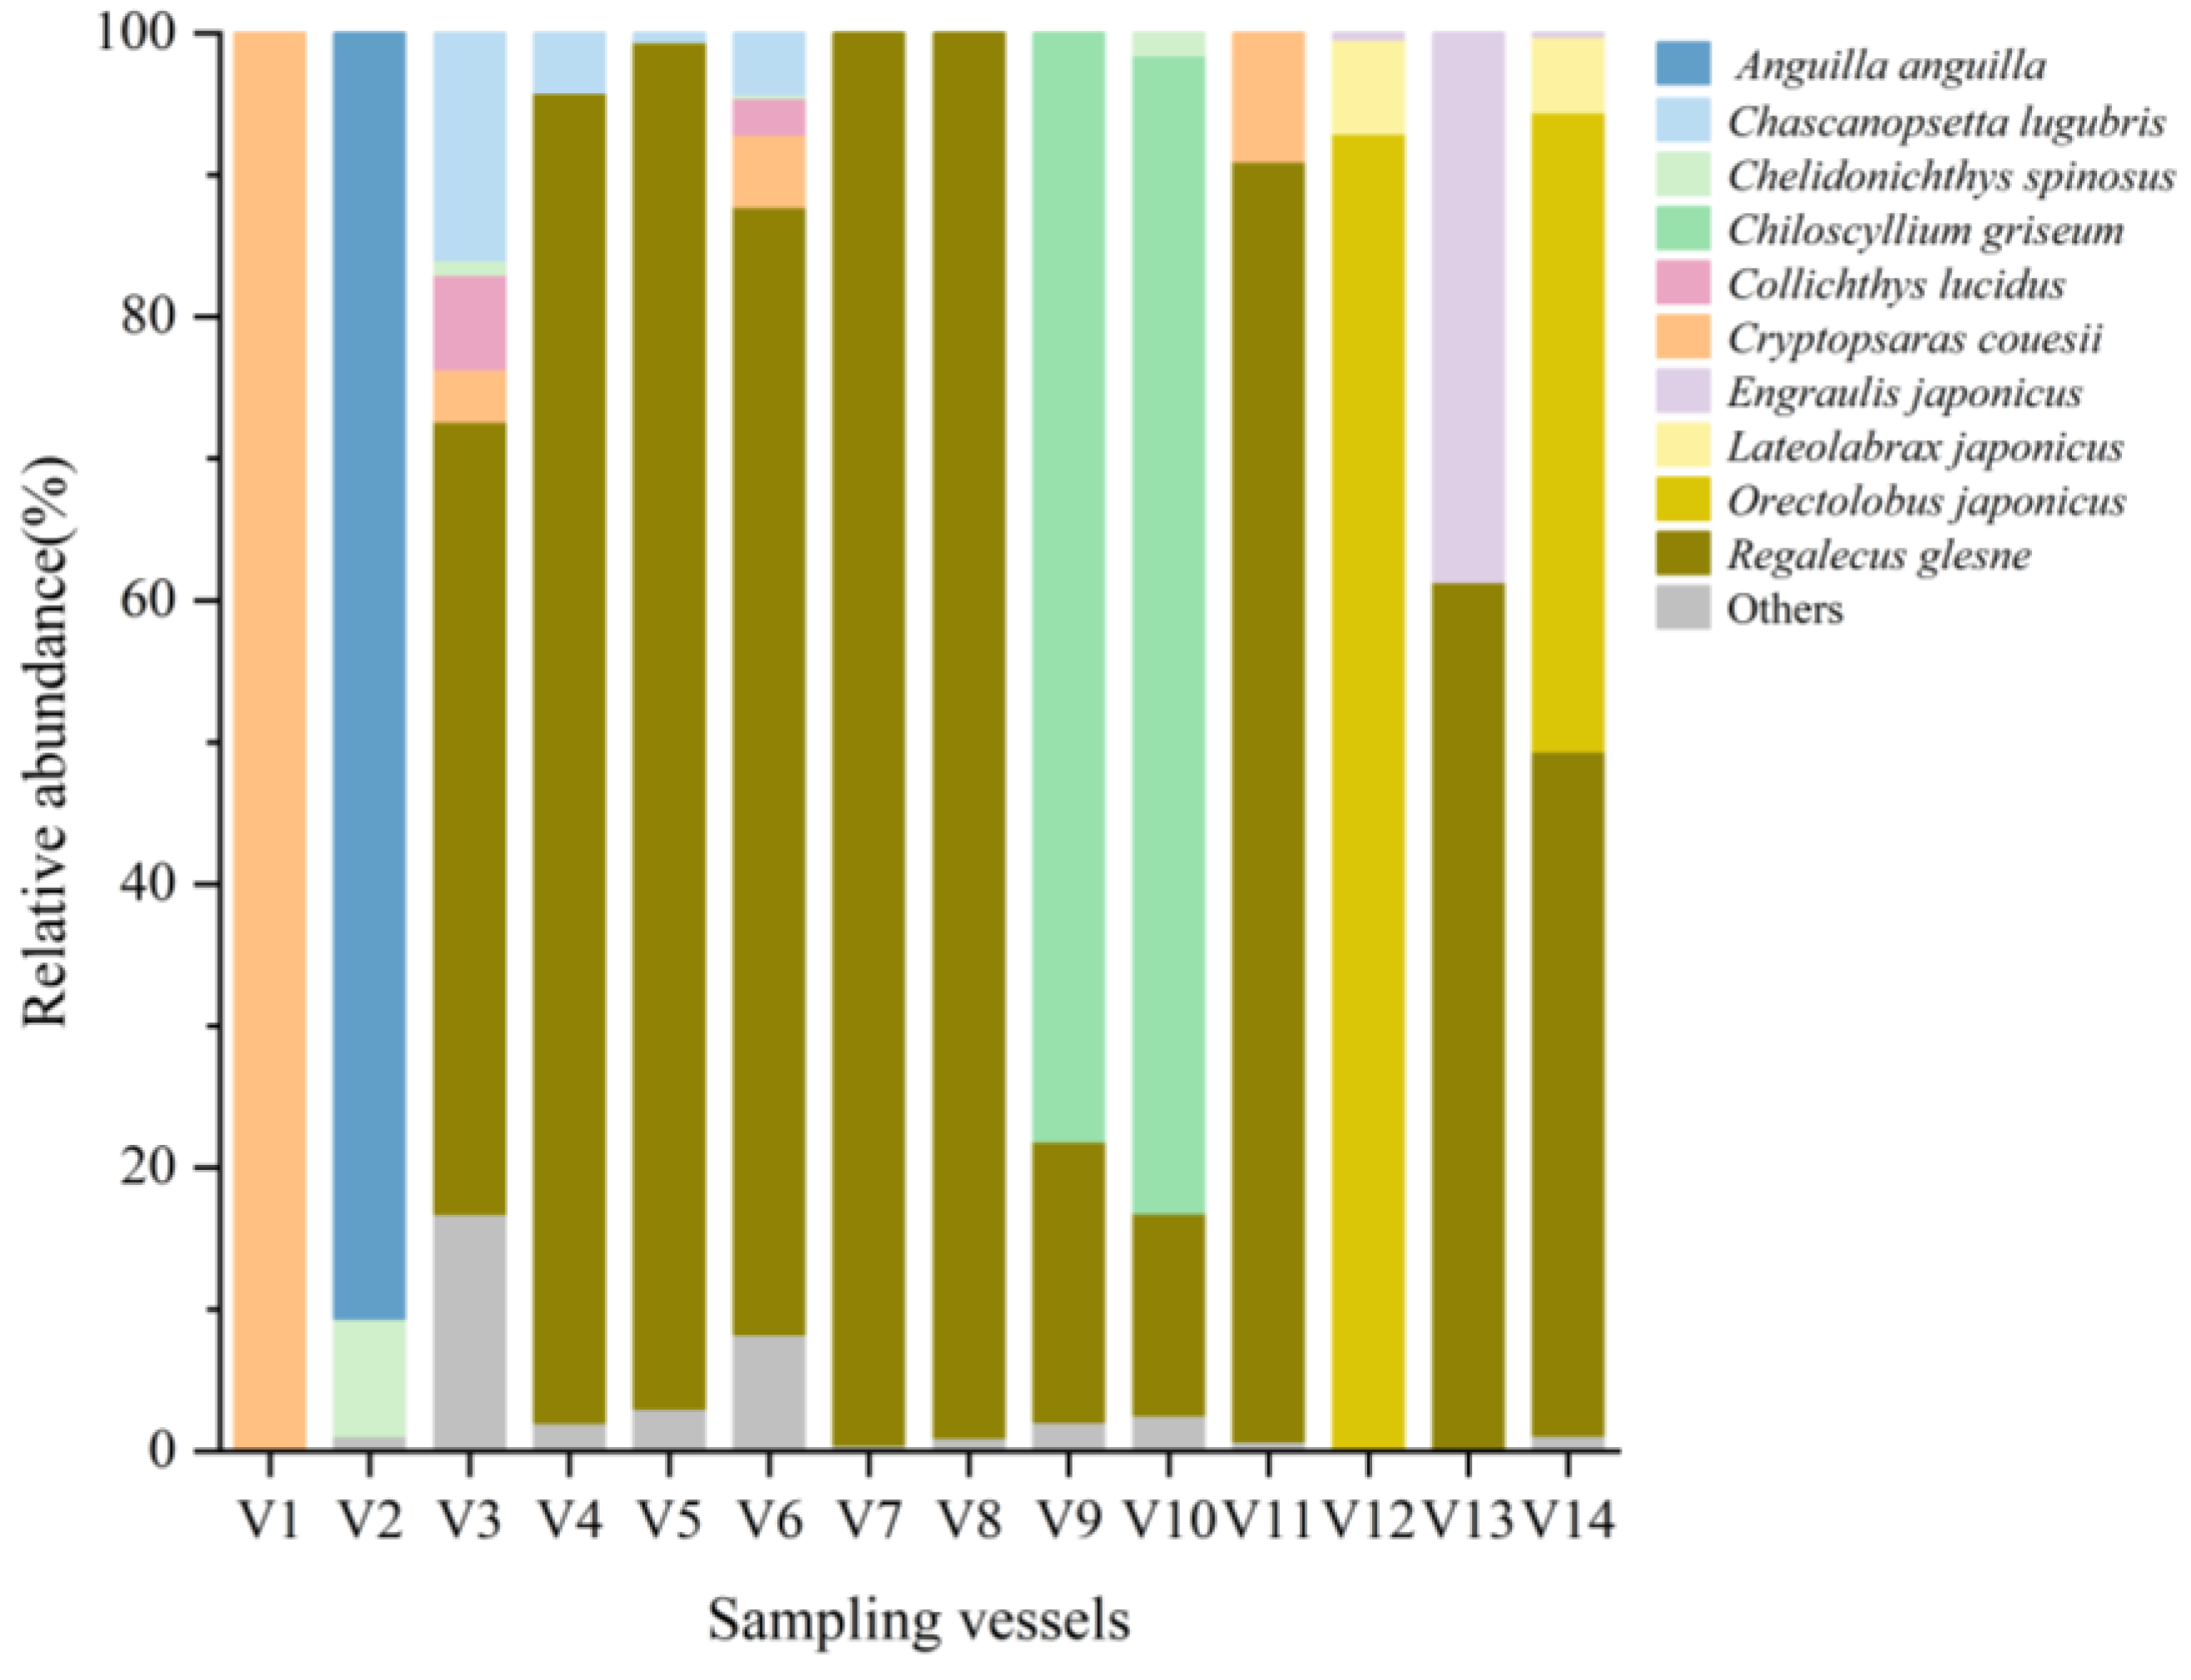
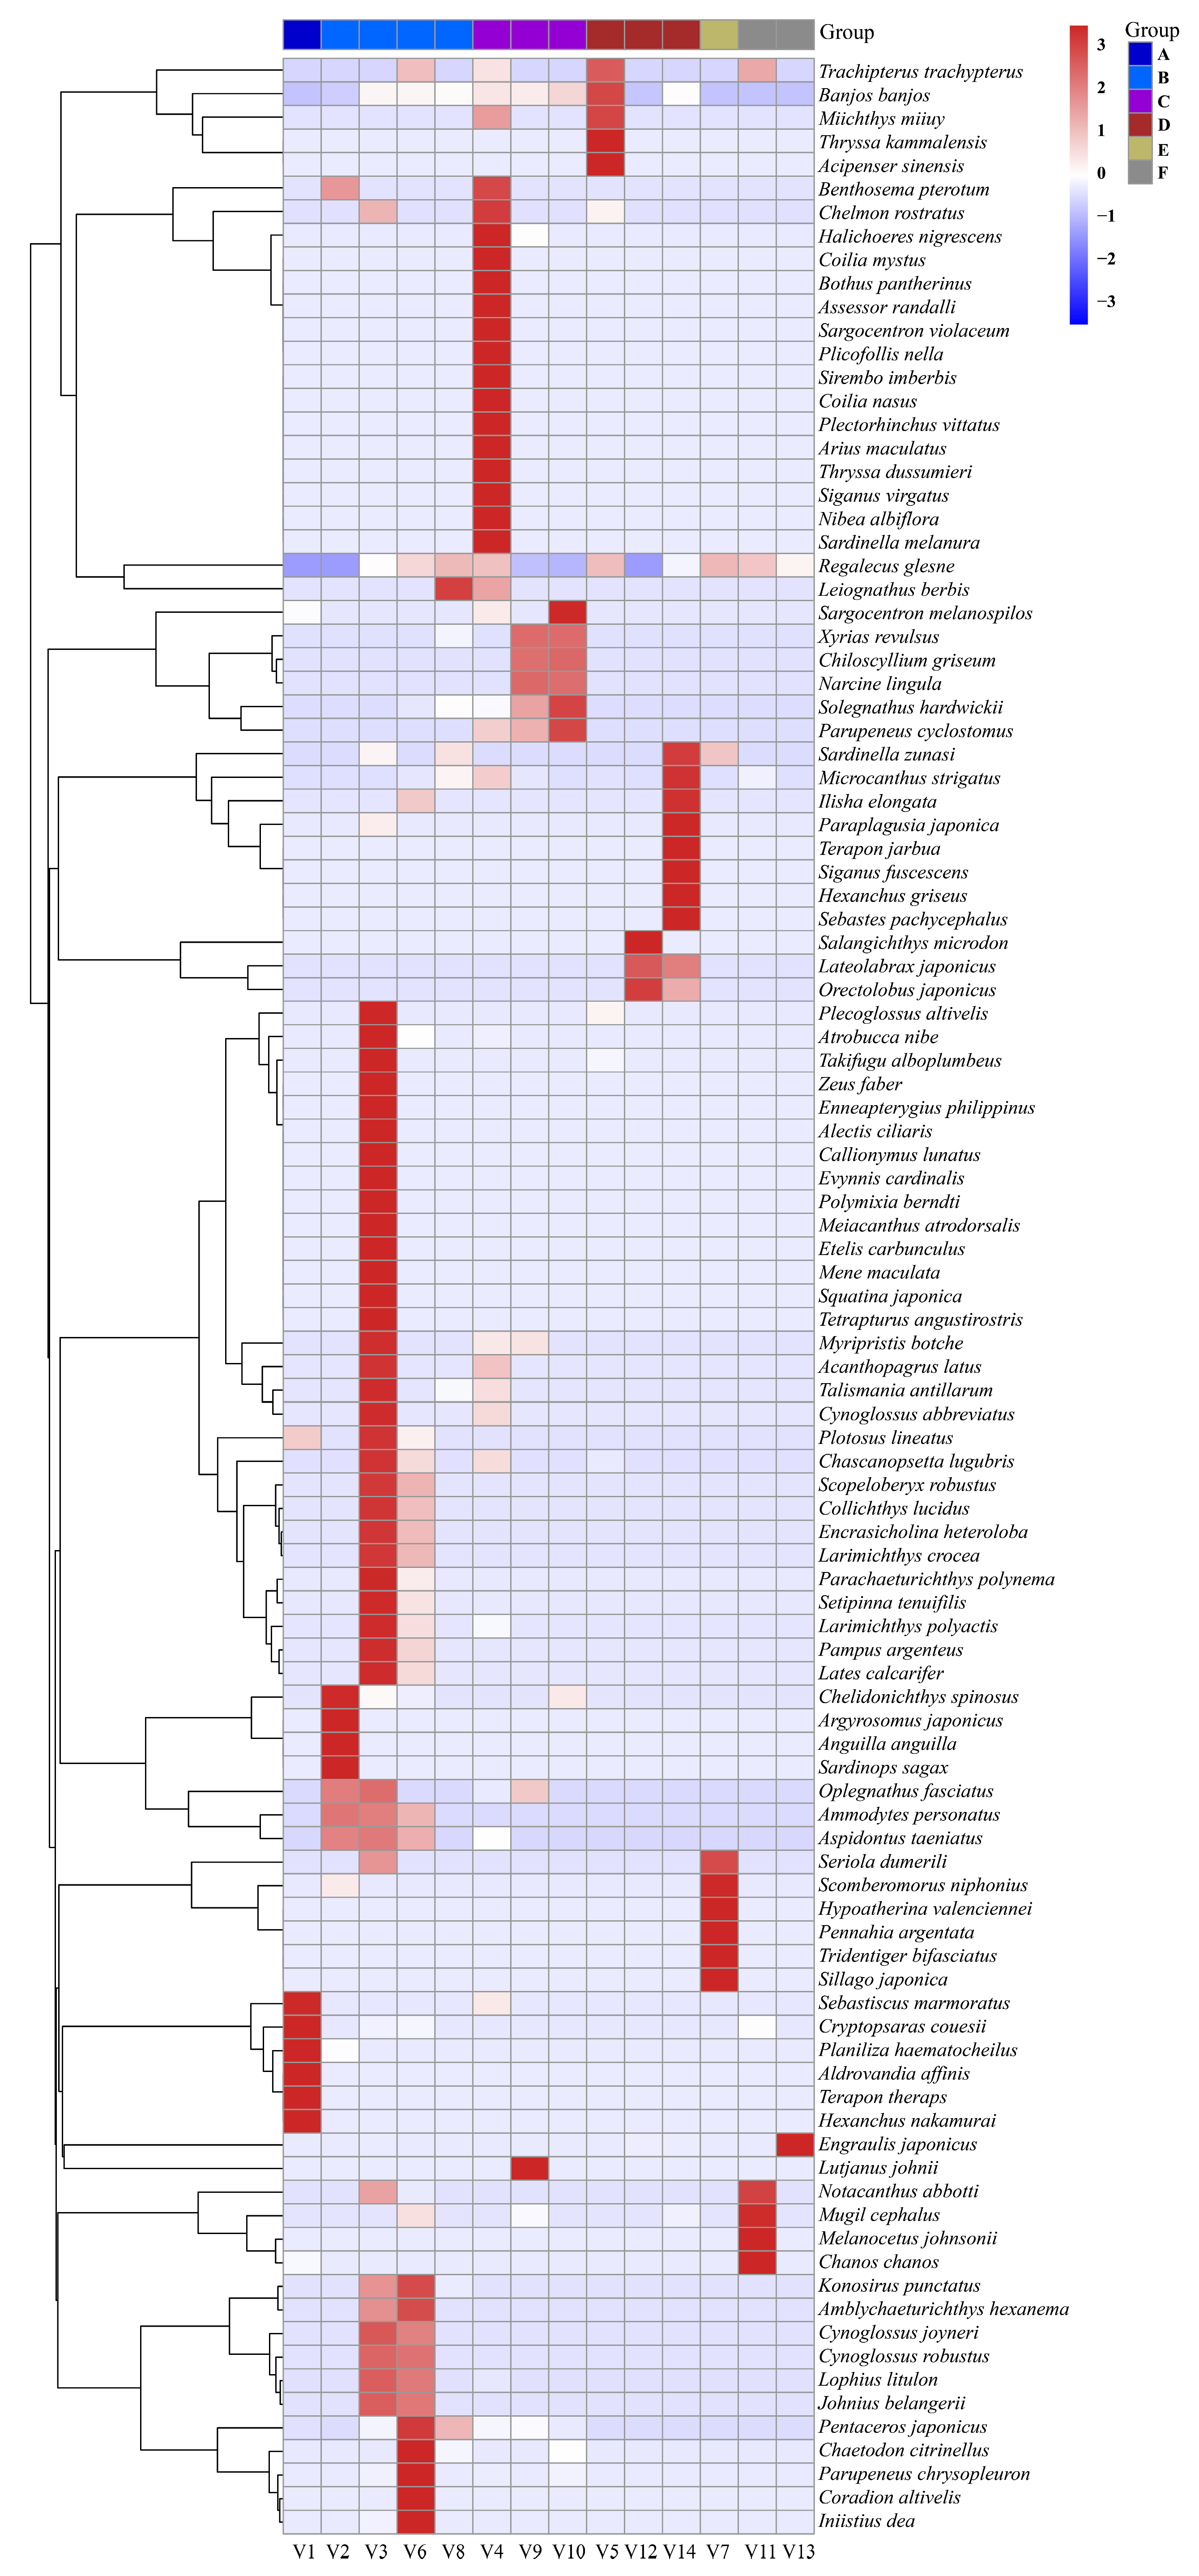
3.1. Fish Species Composition

A total of 1,811,924 raw reads were obtained across all ballast water samples, of which 1,341,713 high-quality reads remained following quality control filtering (Table S1). After removing non-fish taxa, sequences monitored in negative controls, and fish species whose known geographic distributions are inconsistent with the respective ballast water intake locations, a final set of OTUs corresponding to 105 fish species was retained. These species were taxonomically classified into 94 genera and 66 families (detailed in Table S2). It is worth noting that only 18.66% of OTUs could be annotated to the species level, which may reflect incomplete reference coverage in the MitoFish database (see Section 4 for details).
A bar chart illustrated the distribution of the top 10 most abundant fish species across ballast water samples from different vessels (Figure 2). Among the 105 identified species, the most abundant were Anguilla anguilla, Chascanopsetta lugubris, Chelidonichthys spinosus, Chiloscyllium griseum, Collichthys lucidus, Cryptopsaras couesii, Engraulis japonicus, Lateolabrax japonicus, Orectolobus japonicus, and Regalecus glesne. Notably, R. glesne was found to be a dominant species in the majority of samples. Heatmap visualizations of species composition and relative abundance revealed patterns of community similarity and variation among ballast water samples from different vessels and ballast tanks (Figure 3 and Figure 4). Samples within the same group generally exhibited similar species compositions, whereas samples collected from different ballast tanks on the same vessel displayed notable variability. UpSet plots (Figure 5 and Figure 6) summarized the total number of species, the shared species across samples, and species unique to individual samples. The results indicated a degree of taxonomic overlap among samples from the same group or ballast tank, alongside the presence of distinct taxa unique to particular samples.

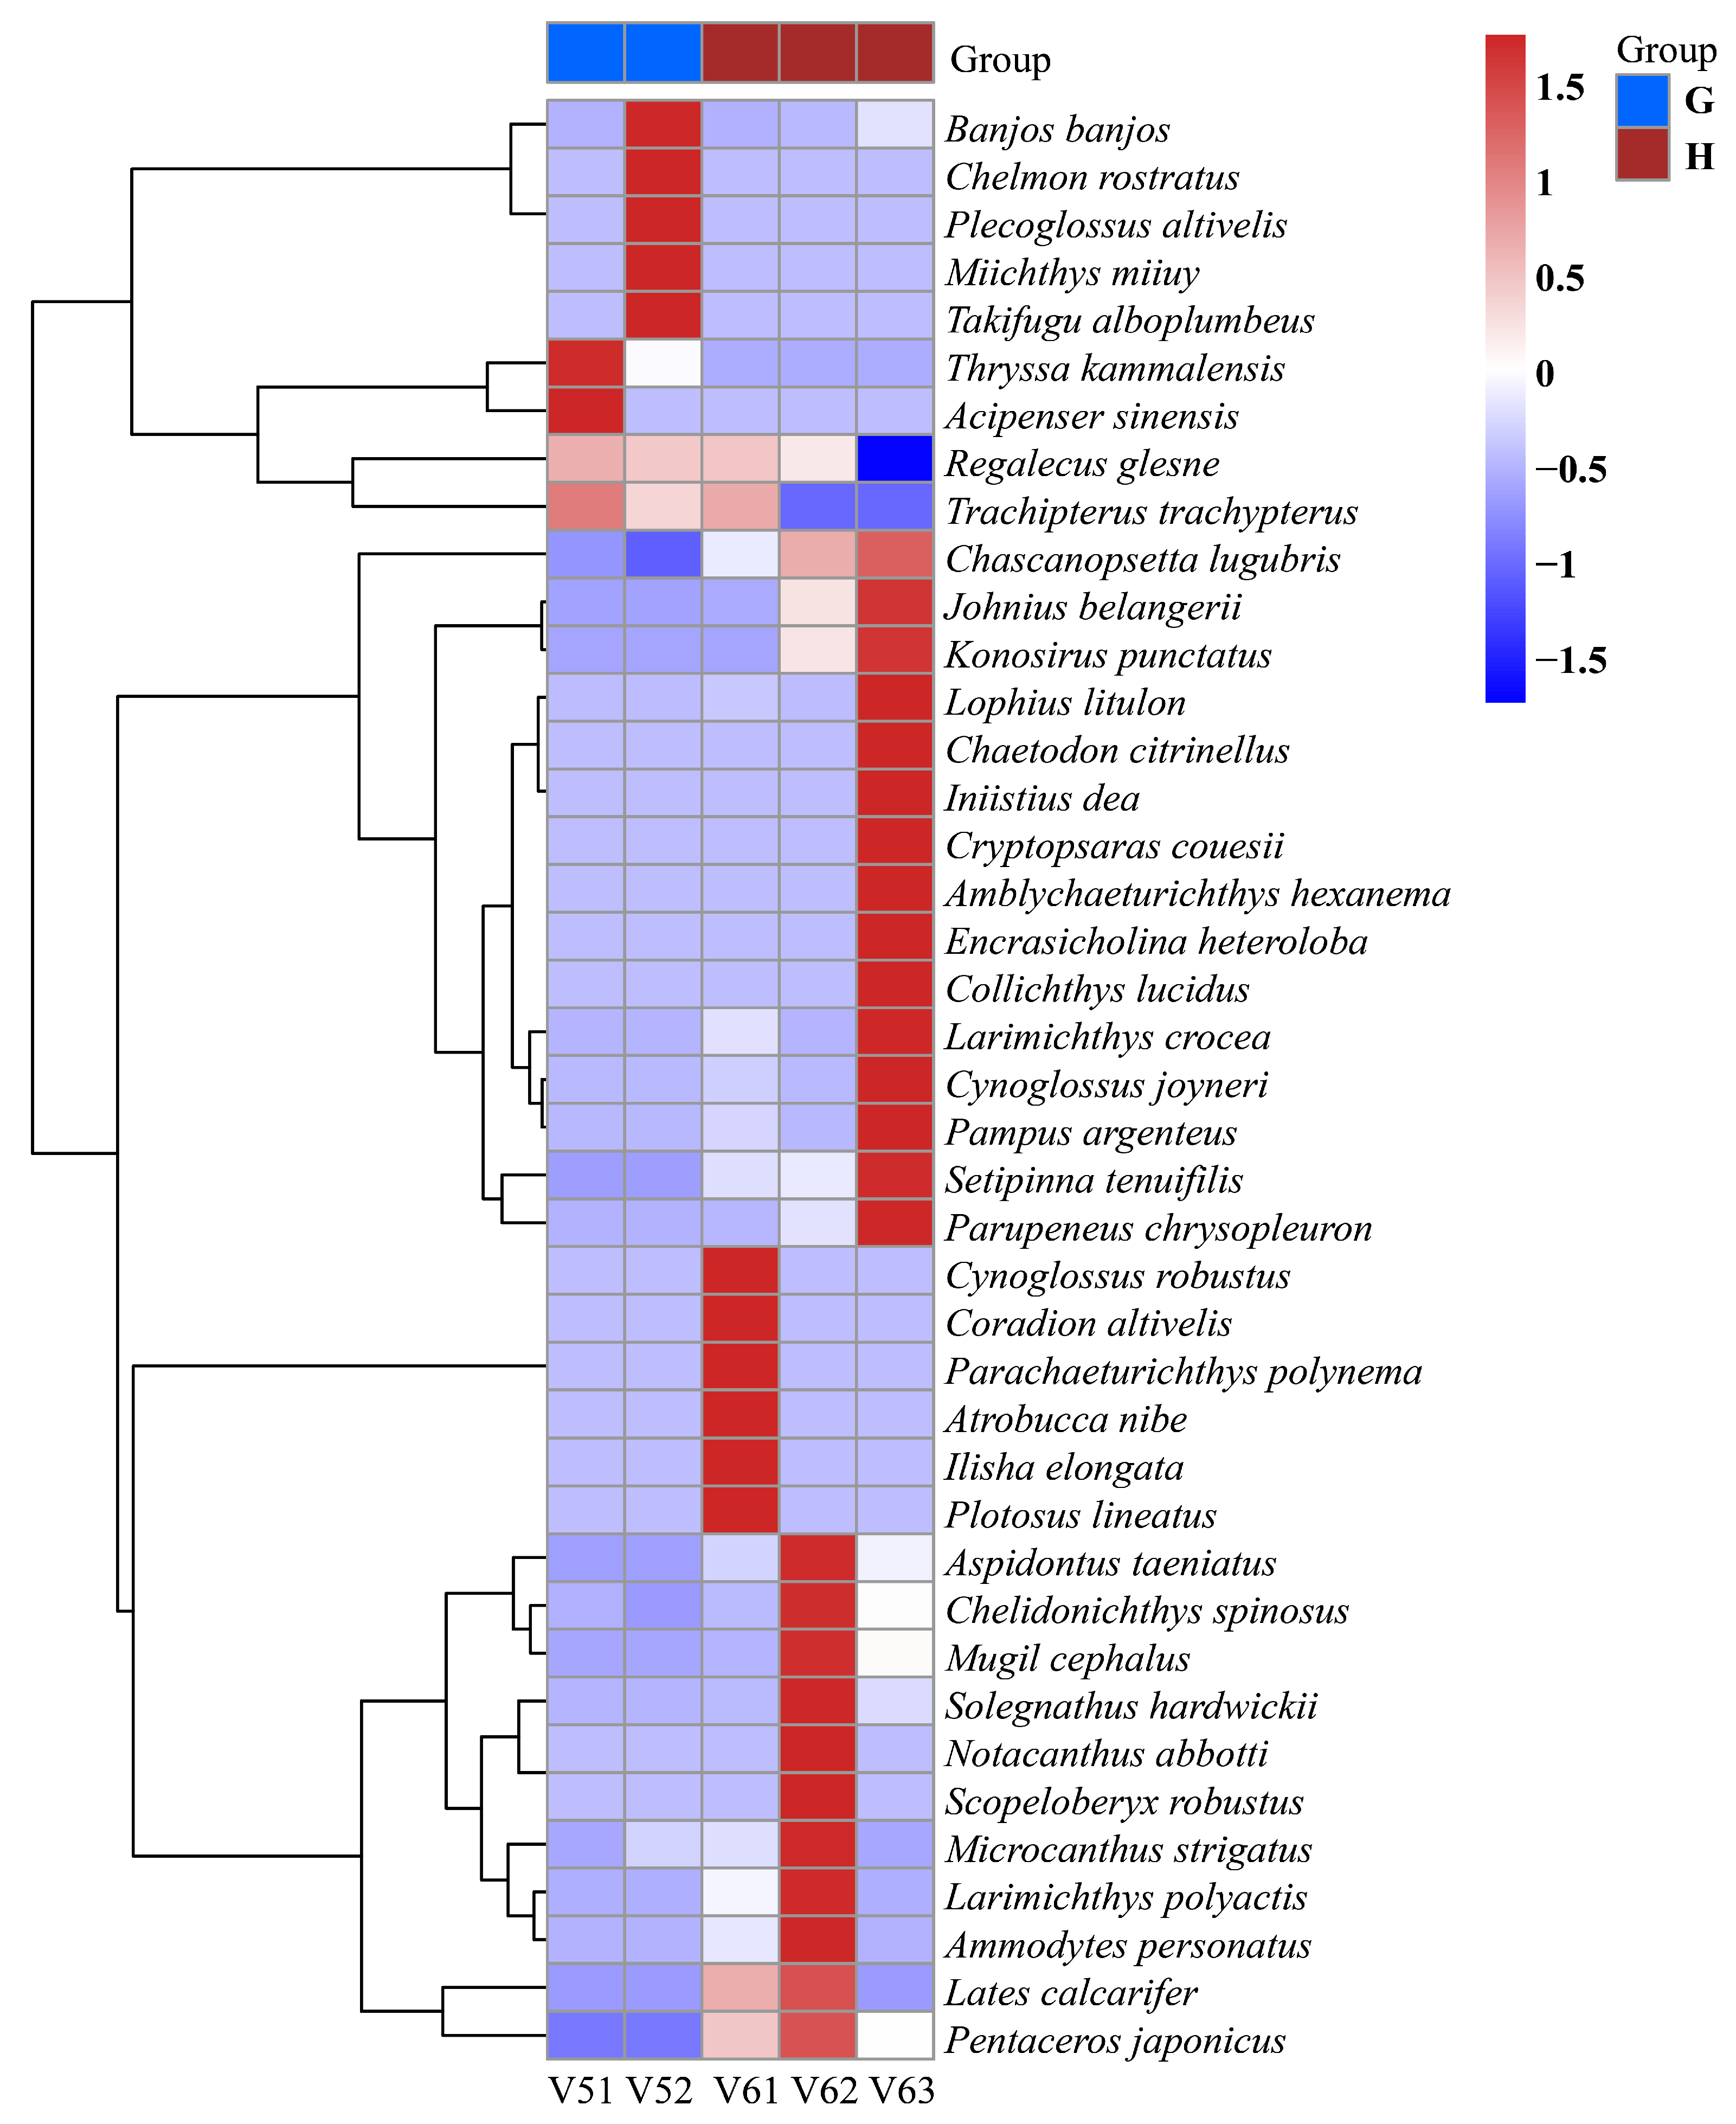
3.2. Results of Fish Diversity Analysis

α-diversity analysis based on eDNA data revealed differences in community diversity among the six groups (Figure 7). Group A (V1) exhibited the lowest levels of α-diversity. Group B (comprising V2, V3, V6, and V8) displayed the highest values for richness indices, and the community diversity indices but had lower values for the evenness index. Groups C (V4, V9, V10), D (V5, V12, V14), and E (V7) showed moderate values across all diversity indices. Group F (V11, V13) had the lowest species count and richness, intermediate overall diversity, and the highest evenness index. These findings show the variability in fish community composition and ecological structure among ballast water samples from different vessels.
In addition to the differences observed among the six vessel groups, α-diversity indices were also calculated for samples collected from different ballast tanks within the same vessel (Table 3). For vessel V5 (samples V51 and V52), both samples exhibited low diversity values across all indices, with Chao1 values of 7 and 10, respectively, and very low Shannon and Simpson indices. In contrast, the three ballast tank samples from vessel V6 (V61, V62, and V63) showed greater variability. V63 exhibited notably higher diversity, with a Chao1 value of 22, a Shannon index of 1.58, and the highest Simpson (0.63) and Pielou’s evenness (0.51) values among all intra-vessel samples. These results demonstrate that even within the same vessel, community diversity may vary significantly across ballast tanks.
The NMDS plot revealed distinct distribution patterns among sample groups, indicating notable differences in species composition across groups (Figure 8). Samples from Group A (V1) were positioned far from those of other groups, suggesting a unique species composition, potentially reflecting low diversity or extreme environmental conditions. Group B (V2, V3, V6, and V8) exhibited considerable heterogeneity in community composition. Notably, samples V3 and V6 clustered closely on the NMDS plot, likely due to their shared ballast water source and similar water age, suggesting comparable community structures. In contrast, V2 and V8 were more dispersed, with V2 showing a particularly distinct distribution pattern, indicating intra-group variability in species composition. Samples from Group C (V4, V9, and V10) were tightly clustered, suggesting relatively homogeneous communities and potentially stable ecological characteristics. Group D (V5, V12, and V14) showed partial clustering, although V12 deviated markedly from the others, possibly reflecting unique environmental influences or contamination affecting its species composition. Samples from Group F (V11 and V13) were relatively concentrated, indicating consistent species composition and a likely more uniform ecological environment. Interestingly, Group E (V7) clustered near Group F, implying a degree of compositional similarity between these two groups.

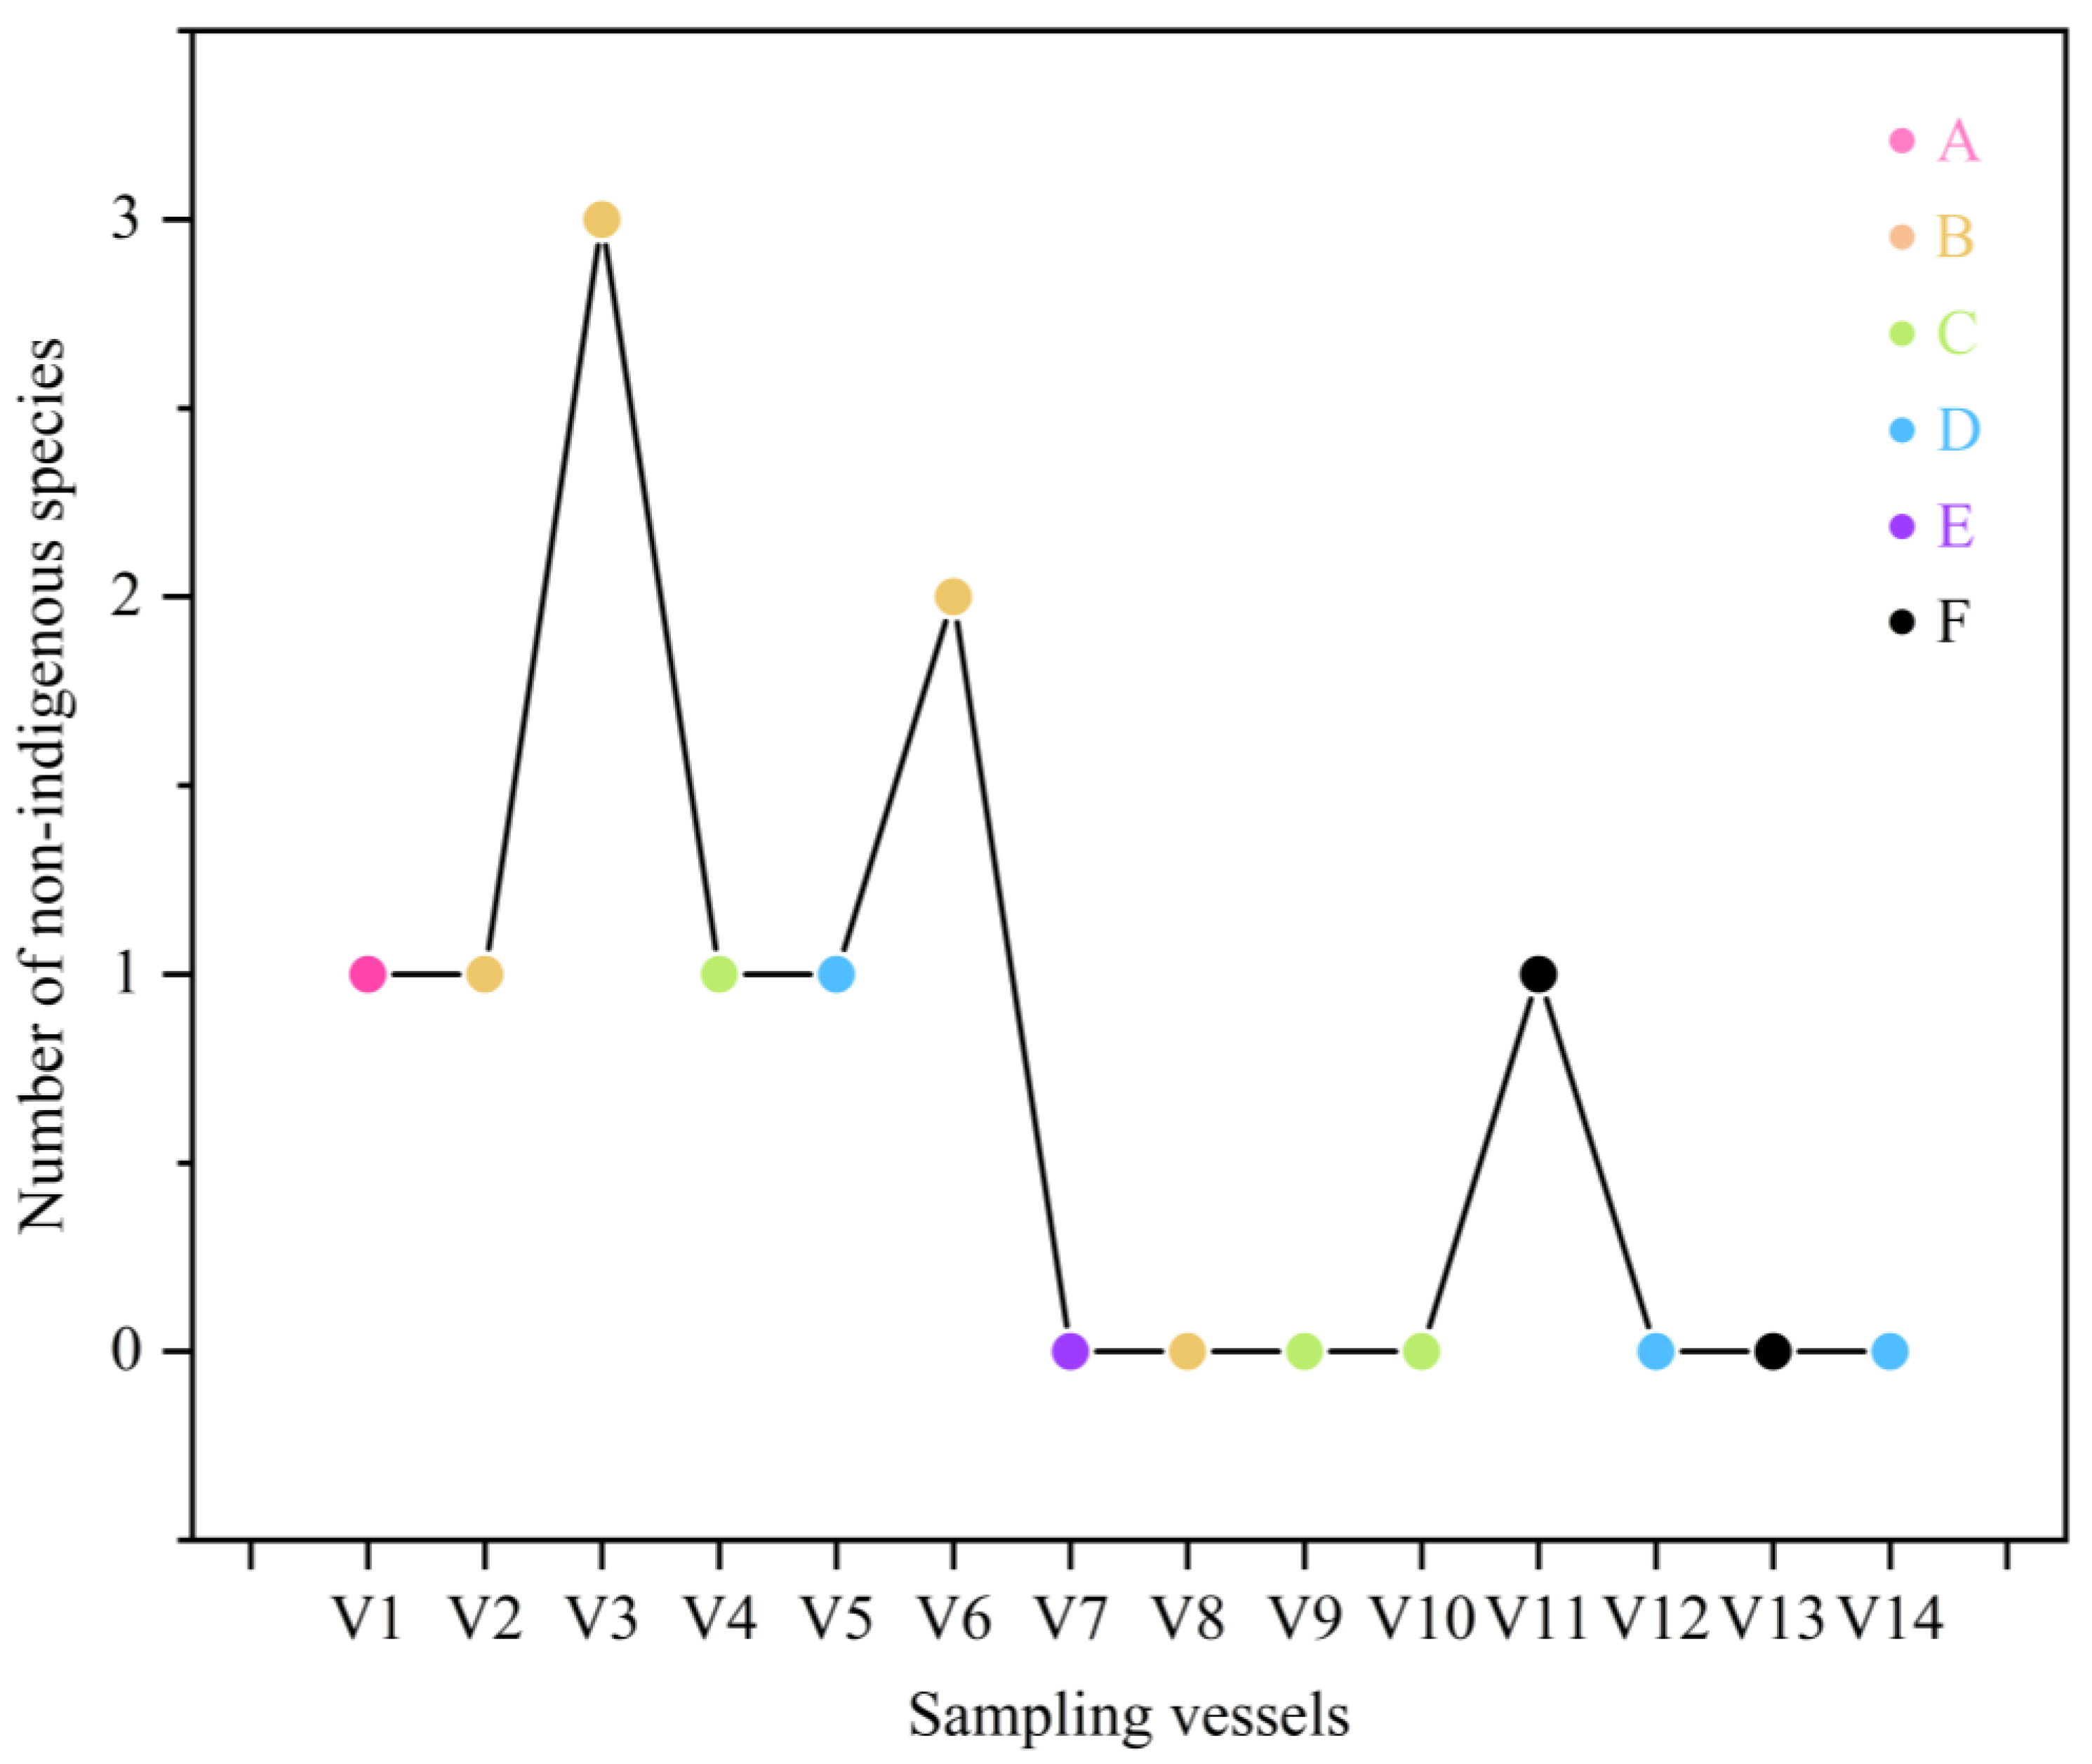
3.3. Non-Indigenous Fish Species Statistics

A total of five non-indigenous fish species were identified across the 14 ballast water samples based on eDNA analysis. Among these, A. anguilla exhibited the highest monitoring relative abundance, emerging as a dominant species in V2 (Figure 2). In contrast, species such as Chanos chanos, Lates calcarifer, Pampus argenteus, and Chelmon rostratus were monitored at relatively low eDNA concentrations. Notably, two recognized invasive fish species were monitored: A. anguilla and L. calcarifer. Anguilla anguilla was exclusively monitored in V2 at a relatively high abundance, while L. calcarifer was present in both V3 and V6 but only at low levels. At the group level, Group B (comprising V2, V3, V6, and V8) exhibited the highest diversity and occurrence frequency of non-indigenous fish species, with four species recorded a total of six times. In contrast, Group E (V7) showed the lowest incidence, with no non-indigenous species observed in any of the samples (Figure 9; Table S3). It is noteworthy that Group B samples originated from ports in Japan, suggesting that ballast water sourced from this region may pose a particularly high risk of introducing non-indigenous fish species. Accordingly, enhanced monitoring and management strategies are recommended for ballast water originating from such high-risk regions.

4. Discussion

4.1. Reliability and Effectiveness of eDNA Technology in Monitoring Non-Indigenous Fish Species

The present study applied eDNA metabarcoding to analyze ballast water samples collected from multiple ships scheduled to discharge at Dongjiakou Port. After excluding 52 species known to be absent from the sampling region, a total of 105 fish species were identified. Most of the monitored species showed strong concordance between their known geographic distributions and the sampling results, further supporting the accuracy of eDNA-based biodiversity assessments. Overall, the findings of this study reinforce the reliability and robustness of eDNA technology in monitoring fish biodiversity and highlight its promising potential for application in marine environmental management and the early monitoring of non-indigenous species introductions.
Among the identified species, five were classified as non-indigenous, including two well-known invasive taxa—A. anguilla and L. calcarifer—both of which are associated with significant ecological and economic impacts [39,40]. These results underscore the utility of eDNA technology in the monitoring of invasive fish species, particularly in complex and dynamic environments such as ballast water systems.
However, the limitations of current reference libraries remain an important constraint [41]. In our study, this limitation was clearly reflected in the taxonomic assignment results: out of 6474 OTUs generated, only 1208 (18.66%) could be confidently assigned to the species level, while 5266 OTUs (81.34%) remained unclassified at that resolution. This highlights a bottleneck in the current use of single-marker eDNA metabarcoding, as the MitoFish database, despite its curation and relevance for fish taxa, still lacks comprehensive coverage of all potential species present in marine ballast water communities. These gaps may result in the underrepresentation of true biodiversity and pose challenges for the accurate detection of rare, cryptic, or non-indigenous species. Therefore, strengthening the completeness of reference libraries is crucial for improving the reliability of future eDNA-based biodiversity assessments [41]. Notably, the detection of deep-sea taxa such as R. glesne—which are unlikely to occur in shallow ballast water—may be explained by the presence of decaying carcasses washed ashore or may further underscore the possibility of false positives resulting from degraded DNA, primer bias, or taxonomic misassignment. These findings highlight a broader challenge in eDNA-based assessments: the inability to determine the life stage or viability of the organisms from which the DNA originated. These cases highlight the potential for false-positive results in eDNA analyses, particularly when DNA persists in the environment long after the organism has died. In this context, the integration of environmental RNA (eRNA) offers a promising complementary approach. As eRNA is generally short-lived and degrades rapidly after cell death, it can serve as a more reliable indicator of metabolically active or recently living organisms, thereby helping to distinguish viable individuals from historical DNA traces and reducing the likelihood of false positives in future assessments [42,43].
While eDNA is highly effective for detecting species presence, it does not provide direct information about the life stage. In ballast water systems, DNA may originate from adult fish, juveniles, larvae, eggs, or even feces, but eDNA-based methods cannot differentiate among these sources. Previous studies have shown that ballast intake systems allow the passage of fish eggs and larvae due to filter mesh sizes ranging from 20 to 55 μm, while larger individuals are typically excluded [44]. Furthermore, Wonham et al. documented instances of larval and juvenile fish present in ballast tanks and emphasized the crevicolous behavior of gobies, which may allow them to exploit intake grate structures as entry pathways [45]. This suggests that under certain circumstances, even small adult fish could enter ballast tanks, especially if hull grates are damaged or inadequately sealed.
These findings further support the potential utility of eRNA in ballast water surveillance. By distinguishing between recent and historical biological material, the combined application of eDNA and eRNA could significantly improve the resolution and reliability of non-indigenous species detection, particularly for early life stages or cryptic taxa that are otherwise difficult to verify through morphological observation.
It is important to clarify that the detection of non-indigenous species DNA in ballast water does not necessarily indicate the presence of viable individuals or ongoing biological invasions. Instead, these eDNA signals may primarily reflect the biological communities present at the source ports at the time of ballast water intake. In this regard, ballast water serves not only as a potential vector for species dispersal but also as a unique and underutilized medium for global biodiversity sampling. The results of this study therefore underscore the value of eDNA metabarcoding as a tool for capturing large-scale biogeographic patterns and enhancing ecological surveillance, beyond its role in early detection of invasive species. Recognizing this broader perspective helps avoid overinterpretation of risk while highlighting the potential of eDNA data to inform both conservation and management efforts on a global scale.

4.2. Distribution of Non-Indigenous Species and High-Risk Populations

Based on eDNA metabarcoding analysis, this study revealed significant differences in the distribution of non-indigenous fish species among ballast water samples. The frequency and diversity of non-indigenous species varied markedly between sample groups, suggesting that ballast water from different source ports carries differing levels of risk for the introduction of non-indigenous species. Specifically, samples originating from Japanese ports exhibited the highest diversity and frequency of non-indigenous fish species. This finding may be attributed to the complex ecological conditions, high biodiversity, and intense shipping activities associated with Japanese ports. Such a pattern is consistent with previous studies, which have reported elevated invasion risks in areas with dense maritime traffic, further confirming the critical role of source ports in ballast water risk assessments [3].
Importantly, two invasive fish species were identified in this study: A. anguilla (monitored in V2) and L. calcarifer (monitored in V3 and V6). Both species pose significant threats to local ecosystems. A. anguilla, native to Europe and North Africa, has been introduced to various non-native regions. Studies have shown that this species can survive for over a decade in Japanese waters, with the monitoring of mature individuals further supporting its long-term establishment potential [46]. As an apex predator, A. anguilla competes with the native Japanese eel (Anguilla japonica) for food resources and may also introduce parasitic infections. Additionally, hybridization between the two species could lead to genetic contamination, with potentially far-reaching consequences for the native eel population and broader ecosystem health [46]. Similarly, L. calcarifer, native to Australia, is widely regarded as a highly invasive species and has been repeatedly reported in artificial lagoons in the northern Red Sea [47]. It preys on a broad range of native organisms, including fish, shrimp, crabs, mollusks, and worms. This broad dietary range, combined with niche competition, can suppress the growth and survival of native species, thereby disrupting local ecological balance [39]. Furthermore, although C. chanos, P. argenteus, and C. rostratus are not currently classified as invasive species in China, they were frequently detected across multiple ballast water samples. As noted by previous studies, species frequently monitored in ballast water often exhibit higher introduction potential and may pose greater invasion risks due to repeated input events [29]. Although the ecological impacts of these species in coastal systems remain unclear, their widespread occurrence suggests a potential for cross-regional dispersal. Therefore, enhanced monitoring efforts and further research on its ecological adaptability and invasion risk are strongly recommended.
The monitoring of invasive and potentially invasive species underscores the serious ecological risks posed by ballast water-mediated introductions. These findings emphasize the urgent need for targeted management actions to reduce the biological invasion risks associated with maritime transport.

4.3. Control Measures for Non-Indigenous Fish in Ballast Water

Previous studies have demonstrated that many fish species are capable of surviving in ballast tanks, primarily in the form of larvae and juveniles [45]. Species belonging to the families gobies and blennies are particularly notable for their ability to utilize structural crevices within ballast tanks for concealment and spawning, thereby enhancing their resilience under the harsh conditions of ballast water environments [45]. To address this issue, existing physical and chemical disinfection methods, such as ultraviolet (UV) irradiation and ozone treatment, have been widely applied to inactivate organisms in ballast water. However, there remains a critical need to explore and develop more effective treatment technologies, particularly those targeting early life stages such as fish eggs and larvae, to achieve thorough and reliable inactivation [48,49,50]. To effectively prevent the invasion of non-indigenous fish species, it is recommended that ballast water systems be equipped with fine-mesh filtration devices capable of physically blocking the entry of fish eggs and larvae. Intra-vessel α-diversity analysis revealed notable differences in community structure between ballast tanks within the same vessel. For instance, samples from vessel V6 showed considerable variation, with one tank (V63) exhibiting significantly higher diversity than the others. These findings underscore the importance of multi-tank sampling to improve the accuracy of biodiversity monitoring. In addition, regular inspection and maintenance of critical components such as intake screens and pump impellers should be conducted to ensure structural integrity and proper functioning. Together, these preventive measures can significantly reduce the likelihood of non-indigenous fish entering ballast tanks [51].
The integration of rapid monitoring and real-time monitoring technologies also represents a promising strategy for enhancing invasion prevention efforts. A previous study proposed combining eDNA analysis with light transmission spectroscopy (LTS) to rapidly identify target species during vessel transit [52]. This approach offers a practical solution for in situ monitoring of fish eggs and larvae in ballast water. Meanwhile, as previously discussed (Section 4.1), the integration of eRNA alongside eDNA offers a promising strategy to enhance detection accuracy. We recommend that this dual-molecular approach be incorporated into ballast water monitoring protocols to improve the identification of viable non-indigenous species. This dual approach can reduce false-positive monitoring, enhance the precision of invasive species identification, and broaden the taxonomic scope of monitoring [43,53]. In this context, it is recommended that vessel operators establish standardized ballast water sampling and molecular monitoring protocols that incorporate both eDNA and eRNA techniques. Such integration would allow for continuous assessment of community structure and invasion risk in ballast water. Upon monitoring of genetic signatures from non-indigenous fish species, immediate mitigation responses, such as onboard isolation, discharge restrictions, or alternative ballast water exchange strategies, should be implemented to prevent further spread.
In addition, regular training for vessel crew members and port personnel is essential for effectively preventing the spread of non-indigenous species. Such training enhances awareness of biological invasion risks, fosters a sense of responsibility, and ensures strict compliance with control standards established by international organizations such as the IMO. Training programs should include modules on species identification, ballast water management practices, relevant regulations and policies, and emergency response procedures. Particular attention should be given to vessels originating from Group B (Japan region), which exhibited higher diversity and frequency of non-indigenous fish species. For these high-risk vessels, stricter control measures are recommended, including enhanced ballast water treatment protocols, increased monitoring frequency, and mandatory pre-discharge screening and treatment. Furthermore, crew members operating vessels originating from the Japan region should receive specialized training to strengthen their ability to recognize, document, report, and respond to suspected non-indigenous species introductions. In parallel, the establishment of comprehensive record-keeping and reporting systems is crucial to ensure timely communication of monitoring data and the prompt activation of emergency response mechanisms. Such systems serve as the foundation for informed decision-making and coordinated management actions, supporting the continuity and effectiveness of long-term prevention strategies. The implementation of this integrated management framework, including targeted training, stricter monitoring protocols, and robust reporting mechanisms, will significantly contribute to containing the spread of invasive fish species and protecting the stability and ecological integrity of port and nearshore marine ecosystems.

5. Conclusions

In conclusion, this study represents the first application of eDNA metabarcoding technology to assess fish diversity and monitor non-indigenous species in ballast water from 14 vessels at Dongjiakou Port. A total of five non-indigenous fish species were identified, including two recognized invasive taxa, L. calcarifer and A. anguilla. The findings underscore the potential role of ballast water as a vector for species dispersal, with vessels from Group B exhibiting notably high levels of non-indigenous fish species diversity. These results demonstrate the utility of eDNA-based monitoring as a sensitive, efficient, and non-invasive approach for tracking biodiversity patterns and enabling the early detection of potentially non-indigenous species in port environments. Notably, the detected eDNA signals likely reflect the biological composition of source port communities, highlighting the value of ballast water as an informative medium for global biodiversity sampling. This perspective broadens the application of eDNA monitoring beyond traditional biosecurity assessments, offering new opportunities for large-scale ecological surveillance and marine ecosystem management.

Supplementary Materials

The following supporting information can be downloaded at https://www.mdpi.com/article/10.3390/fishes10050241/s1, Table S1: Sequencing reads of fish; Table S2: The composition of marine fish in ballast water; Table S3: The composition and relative abundance of invasive species in each vessel.

Author Contributions

Conceptualization, H.L. and H.Z.; methodology, H.L., H.J. and H.Z.; software, H.L. and H.J.; validation, H.L., H.J. and H.Z.; formal analysis, H.L., H.J. and H.Z.; investigation, H.L. and H.J.; resources, H.Z.; data curation, H.L. and H.J.; writing—original draft preparation, H.L.; writing—review and editing, H.L., H.J. and H.Z.; visualization, H.L.; supervision, H.Z.; project administration, H.J. and H.Z.; funding acquisition, H.Z. All authors have read and agreed to the published version of the manuscript.

Funding

This research was funded by the Taishan Scholars Program.

Institutional Review Board Statement

Not applicable.

Informed Consent Statement

Not applicable.

Data Availability Statement

Acknowledgments

We are grateful to the local authorities and crew for their assistance in collecting eDNA samples during the research investigation.

Conflicts of Interest

The authors declare no conflicts of interest.

References

  1. Salleh, N.A.; Rosli, F.N.; Akbar, M.A.; Yusof, A.; Sahrani, F.K.; Razak, S.A.; Ahmad, A.; Usup, G.; Bunawan, H. Pathogenic hitchhiker diversity on international ships’ ballast water at West Malaysia port. Mar. Pollut. Bull. 2021, 172, 112850. [Google Scholar] [CrossRef]
  2. Hwang, J.; Park, S.Y.; Lee, S.; Lee, T.K. High diversity and potential translocation of DNA viruses in ballast water. Mar. Pollut. Bull. 2018, 137, 449–455. [Google Scholar] [CrossRef] [PubMed]
  3. Cope, R.C.; Prowse, T.A.A.; Ross, J.V.; Wittmann, T.A.; Cassey, P. Temporal modelling of ballast water discharge and ship-mediated invasion risk to Australia. R. Soc. Open Sci. 2015, 2, 150039. [Google Scholar] [CrossRef] [PubMed]
  4. Marangoni, C.; Pienaar, R.N.; Sym, S.D. Possible introduction of alien phytoplankton via shipping ballast water: A South African perspective. S. Afr. J. Bot. 2001, 67, 465–474. [Google Scholar] [CrossRef]
  5. García-Garay, J.; Franco-Herrera, A.; Machuca-Martinez, F. Zooplankton sensitivity and phytoplankton regrowth for ballast water treatment with advanced oxidation processes. Environ. Sci. Pollut. Res. 2018, 25, 35008–35014. [Google Scholar] [CrossRef]
  6. Gavand, M.R.; McClintock, J.B.; Amsler, C.D.; Peters, R.W.; Angus, R.A. Effects of sonication and advanced chemical oxidants on the unicellular green alga Dunaliella tertiolecta and cysts, larvae and adults of the brine shrimp Artemia salina: A prospective treatment to eradicate invasive organisms from ballast water. Mar. Pollut. Bull. 2007, 54, 1777–1788. [Google Scholar] [CrossRef]
  7. Gollasch, S.; Lenz, J.; Dammer, M.; Andres, H.G. Survival of tropical ballast water organisms during a cruise from the Indian Ocean to the North Sea. J. Plankton Res. 2000, 22, 923–937. [Google Scholar] [CrossRef]
  8. Ardura, A.; Martinez, J.L.; Zaiko, A.; Garcia-Vazquez, E. Poorer diversity but tougher species in old ballast water: Biosecurity challenges explored from visual and molecular techniques. Mar. Pollut. Bull. 2021, 168, 112465. [Google Scholar] [CrossRef]
  9. Mandrak, N.E.; Cudmore, B. The fall of native fishes and the rise of non-native fishes in the Great Lakes Basin. Aquat. Ecosyst. Health 2010, 13, 255–268. [Google Scholar] [CrossRef]
  10. Inoue, K.; Odo, S.; Noda, T.; Nakao, S.; Takeyama, S.; Yamaha, E.; Yamazaki, F.; Harayama, S. A possible hybrid zone in the Mytilus edulis complex in Japan revealed by PCR markers. Mar. Biol. 1997, 128, 91–95. [Google Scholar] [CrossRef]
  11. Cuthbert, R.N.; Pattison, Z.; Taylor, N.G.; Verbrugge, L.; Diagne, C.; Ahmed, D.A.; Leroy, B.; Angulo, E.; Briski, E.; Capinha, C.; et al. Global economic costs of aquatic invasive alien species. Sci. Total Environ. 2021, 775, 145238. [Google Scholar] [CrossRef] [PubMed]
  12. Trebitz, A.S.; Hoffman, J.C.; Darling, J.A.; Pilgrim, E.M.; Kelly, J.R.; Brown, E.A.; Chadderton, W.L.; Egan, S.P.; Grey, E.K.; Hashsham, S.A.; et al. Early detection monitoring for aquatic non-indigenous species: Optimizing surveillance, incorporating advanced technologies, and identifying research needs. J. Environ. Manag. 2017, 202, 299–310. [Google Scholar] [CrossRef] [PubMed]
  13. Ruppert, K.M.; Kline, R.J.; Rahman, M.S. Past, present, and future perspectives of environmental DNA (eDNA) metabarcoding: A systematic review in methods, monitoring, and applications of global eDNA. Global Ecol. Conserv. 2019, 17, e00547. [Google Scholar] [CrossRef]
  14. Scriver, M.; Marinich, A.; Wilson, C.; Freeland, J. Development of species-specific environmental DNA (eDNA) markers for invasive aquatic plants. Aquat. Bot. 2015, 122, 27–31. [Google Scholar] [CrossRef]
  15. Tsuji, S.; Takahara, T.; Doi, H.; Shibata, N.; Yamanaka, H. The detection of aquatic macroorganisms using environmental DNA analysis-A review of methods for collection, extraction, and detection. Environ. DNA 2019, 1, 99–108. [Google Scholar] [CrossRef]
  16. Jannel, L.A.; Guilhaumon, F.; Valade, P.; Chabanet, P.; Borie, G.; Grondin, H.; Jourand, P. eDNA metabarcoding, a promising tool for monitoring aquatic biodiversity in the estuaries of Reunion Island (South-West Indian Ocean). Environ. DNA 2024, 6, e70044. [Google Scholar] [CrossRef]
  17. Lymperopoulou, D.S.; Dobbs, F.C. Bacterial diversity in ships’ ballast water, ballast-water exchange, and implications for ship-mediated dispersal of microorganisms. Environ. Sci. Technol. 2017, 51, 1962–1972. [Google Scholar] [CrossRef]
  18. Gerhard, W.A.; Gunsch, C.K. Metabarcoding and machine learning analysis of environmental DNA in ballast water arriving to hub ports. Environ. Int. 2019, 124, 312–319. [Google Scholar] [CrossRef]
  19. Shang, L.; Hu, Z.; Deng, Y.; Li, J.; Liu, Y.; Song, X.; Zhai, X.Y.; Zhan, Z.F.; Tian, W.; Xu, J.X.; et al. Transoceanic ships as a source of alien dinoflagellate invasions of inland freshwater ecosystems. Harmful Algae 2024, 135, 102630. [Google Scholar] [CrossRef]
  20. Ghabooli, S.; Zhan, A.; Paolucci, E.; Hernandez, M.R.; Briski, E.; Cristescu, M.E.; MacIsaac, H.J. Population attenuation in zooplankton communities during transoceanic transfer in ballast water. Ecol. Evol. 2016, 6, 6170–6177. [Google Scholar] [CrossRef]
  21. Zaiko, A.; Martinez, J.L.; Schmidt-Petersen, J.; Ribicic, D.; Samuiloviene, A.; Garcia-Vazquez, E. Metabarcoding approach for the ballast water surveillance—An advantageous solution or an awkward challenge? Mar. Pollut. Bull. 2015, 92, 25–34. [Google Scholar] [CrossRef] [PubMed]
  22. Stepien, C.A.; Neilson, M.E. What’s in a name? Taxonomy and nomenclature of invasive gobies in the Great Lakes and beyond. J. Great Lakes Res. 2013, 39, 555–559. [Google Scholar] [CrossRef]
  23. Yang, L. The role of new ports in port-related industries and urban development: A case study of Dongjiakou Port. J. Jinan Vocat. Coll. 2017, 95–96. [Google Scholar]
  24. Yu, Y.Q.; Zhang, B.M.; Teng, X.D.; Zhao, L. Surveillance on medical vectors at Qingdao Dongjiakou port. Chin. Front. Health Quar. 2017, 40, 173–176. [Google Scholar]
  25. Liu, J.W.; Yu, Z.X.; Zhu, C.B.; Hu, B.; Liu, Z. Determination of key factors for the moored operations of 400,000-DWT bulk carriers at Dongjiakou Port. Waterw. Eng. 2023, 72–77. [Google Scholar]
  26. Kumar, G.; Eble, J.E.; Gaither, M.R. A practical guide to sample preservation and pre-PCR processing of aquatic environmental DNA. Mol. Ecol. Resour. 2020, 20, 29–39. [Google Scholar] [CrossRef]
  27. IMO. International Convention for the Control and Management of Ship’s Ballast Water and Sediments; IMO: London, UK, 2004; Available online: https://www.imo.org/en/About/Conventions/Pages/International-Convention-for-the-Control-and-Management-of-Ships%27-Ballast-Water-and-Sediments-(BWM).aspx (accessed on 1 February 2024).
  28. Miya, M.; Sato, Y.; Fukunaga, T.; Sado, T.; Poulsen, J.Y.; Sato, K.; Minamoto, T.; Yamamoto, S.; Yamanaka, H.; Araki, H.; et al. MiFish, a set of universal PCR primers for metabarcoding environmental DNA from fishes: Detection of more than 230 subtropical marine species. R. Soc. Open Sci. 2015, 2, 150088. [Google Scholar] [CrossRef]
  29. Pagenkopp Lohan, K.M.; Fleischer, R.C.; Carney, K.J.; Holzer, K.K.; Ruiz, G.M. Amplicon-based pyrosequencing reveals high diversity of protistan parasites in ships’ ballast water: Implications for biogeography and infectious diseases. Microb. Ecol. 2016, 71, 530–542. [Google Scholar] [CrossRef] [PubMed]
  30. Liu, R.Y. The Checklist of Marine Biota of China Seas, 1st ed.; Science Press: Beijing, China, 2008. [Google Scholar]
  31. Shannon, C.E. A mathematical theory of communication. Bell Syst. Tech. J. 1948, 27, 379–423. [Google Scholar] [CrossRef]
  32. Shannon, C.E. A mathematical theory of communication. Bell Syst. Tech. J. 1948, 27, 623–656. [Google Scholar] [CrossRef]
  33. Simpson, E.H. Measurement of diversity. Nature 1949, 163, 688. [Google Scholar] [CrossRef]
  34. Pielou, E.C. The measurement of diversity in different types of biological collections. J. Theor. Biol. 1966, 13, 131–144. [Google Scholar] [CrossRef]
  35. Chao, A. Nonparametric estimation of the number of classes in a population. Scand. J. Stat. 1984, 11, 265–270. [Google Scholar]
  36. Xiong, W.; Shen, C.; Wu, Z.; Lu, H.; Yan, Y. A brief overview of known introductions of non-native marine and coastal species into China. Aquat. Invasions 2017, 12, 109–115. [Google Scholar] [CrossRef]
  37. Zhao, S.J.; Zhang, X.J.; Li, C.D.; Zhu, A.Y.; Wu, C.W. Alien fishes of mariculture in China. Mar. Sci. 2006, 30, 75–80. [Google Scholar]
  38. Xu, H.; Qiang, S. China’s Invasive Alien Species, Revised Edition; Science Press: Beijing, China, 2018. [Google Scholar]
  39. Pusey, B.; Burrows, D.; Arthington, A.; Kennard, M. Translocation and spread of piscivorous fishes in the Burdekin River, north-eastern Australia. Biol. Invasions 2006, 8, 965–977. [Google Scholar] [CrossRef]
  40. Çinar, M.E. The alien ascidian Styela clava now invading the Sea of Marmara (Tunicata: Ascidiacea). ZooKeys 2016, 563, 1–10. [Google Scholar] [CrossRef] [PubMed]
  41. Grammatiki, K.; de Jonge, N.; Nielsen, J.L.; Gómez-Gomez, S.C.; Avramidi, E.; Lymperaki, M.M.; Marcou, M.; Ioannou, G.; Papatheodoulou, M.; Dargent, O.; et al. eDNA metabarcoding of marine invertebrate communities at RO desalination plant outfalls in Cyprus. Mar. Pollut. Bull. 2025, 214, 117609. [Google Scholar] [CrossRef]
  42. Giroux, M.S.; Reichman, J.R.; Langknecht, T.; Burgess, R.M.; Ho, K.T. Environmental RNA as a tool for marine community biodiversity assessments. Sci. Rep. 2022, 12, 17782. [Google Scholar] [CrossRef]
  43. Fonseca, V.G.; Davison, P.I.; Creach, V.; Stone, D.; Bass, D.; Tidbury, H.J. The application of eDNA for monitoring aquatic non-indigenous species: Practical and policy considerations. Diversity 2023, 15, 631. [Google Scholar] [CrossRef]
  44. Outinen, O.; Bailey, S.A.; Casas-Monroy, O.; Delacroix, S.; Gorgula, S.; Griniene, E.; Kakkonen, J.E.; Srebaliene, G. Biological testing of ships’ ballast water indicates challenges for the implementation of the Ballast Water Management Convention. Front. Mar. Sci. 2024, 11, 1334286. [Google Scholar] [CrossRef]
  45. Wonham, M.J.; Carlton, J.T.; Ruiz, G.M.; Smith, L.D. Fish and ships: Relating dispersal frequency to success in biological invasions. Mar. Biol. 2000, 136, 1111–1121. [Google Scholar] [CrossRef]
  46. Arai, K.; Itakura, H.; Yoneta, A.; Yoshinaga, T.; Shirotori, F.; Kaifu, K.; Kimura, S. Discovering the dominance of the non-native European eel in the upper reaches of the Tone River system, Japan. Fish. Sci. 2017, 83, 735–742. [Google Scholar] [CrossRef]
  47. Stern, N.; Rothman, S.B.S. An alarming mariculture breach in a coral reef: Alien barramundi Lates calcarifer (Bloch, 1790) at the northern Red Sea. BioInvasions Rec. 2021, 10, 181–187. [Google Scholar] [CrossRef]
  48. Buley, R.P.; Hasler, C.T.; Tix, J.A.; Suski, C.D.; Hubert, T.D. Can ozone be used to control the spread of freshwater Aquatic Invasive Species? Manag. Biol. Invasion 2017, 8, 13–24. [Google Scholar] [CrossRef]
  49. Lakshmi, E.; Priya, M.; Achari, V.S. An overview on the treatment of ballast water in ships. Ocean Coast. Manag. 2021, 199, 105296. [Google Scholar] [CrossRef]
  50. Tsolaki, E.; Diamadopoulos, E. Technologies for ballast water treatment: A review. J. Chem. Technol. Biot 2010, 85, 19–32. [Google Scholar] [CrossRef]
  51. Liu, L.; Chen, Z.; Li, Y.; Fan, X. Fast detection technology for alien invasive fish in ship ballast water. J. Shandong Jiaotong Univ. 2023, 31, 110–118. [Google Scholar]
  52. Egan, S.P.; Grey, E.; Olds, B.; Feder, J.L.; Ruggiero, S.T.; Tanner, C.E.; Lodge, D.M. Rapid molecular detection of invasive species in ballast and harbor water by integrating environmental DNA and light transmission spectroscopy. Environ. Sci. Technol. 2015, 49, 4113–4121. [Google Scholar] [CrossRef] [PubMed]
  53. Inoue, Y.; Miyata, K.; Yamane, M.; Honda, H. Environmental nucleic acid pollution: Characterization of wastewater generating false positives in molecular ecological surveys. ACS ES T Water 2023, 3, 756–764. [Google Scholar] [CrossRef]
Figure 1. The locations where the ballast water was taken in by the sampled vessels. White triangles (△) indicate the ballast water intake locations of the vessels. The black triangle (▲) represents both the intake location of vessel V7 and the geographic location of Dongjiakou Port, China, where all ballast water samples were collected.
Fishes 10 00241 g001
Figure 2. Relative sequence abundance (%) of fish species identified in ballast water samples from 14 vessels (V1–V14). Each bar represents one vessel. The ten most abundant fish species across all samples are shown individually, while remaining low-abundance taxa are grouped as “Others”.
Fishes 10 00241 g002
Figure 3. Heatmap of relative abundance of fish species between different vessels. The samples are arranged according to groups rather than in sequential order for more intuitive viewing. The specific groupings are as follows: V1 belongs to Group A; V2, V3, V6, and V8 belong to Group B; V4, V9, and V10 belong to Group C; V5, V12, and V14 belong to Group D; V7 belongs to Group E; and V11 and V13 belong to Group F.
Fishes 10 00241 g003
Figure 4. Heatmap of relative abundance of fish species between different ballast tanks. V51 and V52 were collected from different ballast tanks of vessel V5, with sampling volumes of 2 L and 1 L, respectively, and are categorized as Group G. V61, V62, and V63 were collected from different ballast tanks of vessel V6, each with a sampling volume of 1 L, and are categorized as Group H.
Fishes 10 00241 g004
Figure 5. UpSet plot of fish in ballast water samples from different vessels. The red bars represent the number of species in each sample. Black dots in the matrix indicate individual samples, and interconnected black dots represent shared species among those samples. The blue bars indicate the corresponding number of shared species.
Fishes 10 00241 g005
Figure 6. UpSet plot of fish in ballast tank samples. The red bars represent the number of species in each sample. Black dots in the matrix indicate individual samples, and interconnected black dots represent shared species among those samples. The blue bars indicate the corresponding number of shared species.
Fishes 10 00241 g006
Figure 7. α-diversity of fish communities among different groups. NS indicates non-significant differences (p > 0.05) between groups. Black dots represent individual sample values.
Fishes 10 00241 g007
Figure 8. β-diversity of fish communities among different samples.
Fishes 10 00241 g008
Figure 9. Number of non-indigenous species in each vessel.
Fishes 10 00241 g009
Table 1. Summary of vessel groupings based on geographic intake locations and intra-vessel sampling design. Vessels were grouped according to two distinct criteria: (1) the geographic proximity of locations where ballast water was taken up (Groups A–F) and (2) intra-vessel sampling involving multiple ballast tanks within the same vessel (Groups G and H). For vessels with more than one ballast tank sampled, specific tank samples are listed to evaluate within-vessel variation in community composition.
GroupGrouping TypeVesselsBallast Tank Samples
AGeographic groupingV1-
BGeographic groupingV2, V3, V6, V8-
CGeographic groupingV4, V9, V10-
DGeographic groupingV5, V12, V14-
EGeographic groupingV7-
FGeographic groupingV11, V13-
GIntra-vessel samplingV5V51, V52
HIntra-vessel samplingV6V61, V62, V63
Table 2. Detailed information about the vessels.
StationIMO NumberVessel NameDate of UptakeSampling DateBallast Tank Number and Sampling VolumeLocation of UptakeSea Area 5Age of Ballast Water/Day 6
V19735945Orion2.213.11BWT 1 (3 L)13.516° N, 112.955° ECentral South China Sea19
V29485904Safeen al amal4.44.18BWT (3 L)34.050° N, 131.750° ESetoNaikai14
V39615042Friendly islands5.175.24DBT 2 (3 L)34.450° N, 133.927° ESetoNaikai7
V49146558Sea alice5.106.3BWT (3 L)22.562° N, 120.330° ETaiwan Strait24
V58747654Jin yang guan5.306.3FPT 3 (2 L), APT 4 (1 L)34.734° N, 126.379° ESouth Yellow Sea4
V69533335Mandarin river5.286.5FPT (1 L), APT (1 L), DBT (1 L)34.514° N, 133.737° ESetoNaikai8
V79362619Hong yang5.156.26BWT (3 L)35.6° N, 119.783° ELangyatai Bay42
V89815305Soc glory6.277.2BWT (3 L)33.643° N, 133.508° ETosa Bay5
V99919723Theresa dua7.247.29BWT (3 L)20.65° N, 120.8° ENortheastern South China Sea5
V109483293Sg foundation8.198.26BWT (3 L)25.883° N, 122.96° ESouthern East China Sea7
V119392377Argent sunrise8.259.19BWT (3 L)37.829° N, 122.393° WSan Francisco Bay25
V129488396Xin zhong rui 79.811.1BWT (3 L)37.504° N, 126.637° EGanghwa Bay54
V139288825Wenche victory10.2011.18BWT (3 L)34.147° N, 119.211° WSanta Barbara Channel29
V141020851Express star11.1911.23BWT (3 L)36.962° N, 126.838° EPyeongtaek Bay4
1 BWT = Ballast Water Tank, 2 DBT = Double Bottom Tank, 3 FPT = Fore Peak Tank, 4 APT = Aft Peak Tank. 5 Sea area denotes the location where the vessel took on ballast water, while 6 age of ballast water/day indicates the duration (in days) that the ballast water remained in the tank from intake until sampling, before discharge at Dongjiakou Port.
Table 3. α-diversity indices of fish communities in ballast water samples from different ballast tanks within vessels V5 and V6. Chao1, Shannon, Simpson, and Pielou’s evenness indices were calculated for each ballast tank sample. Samples V51 and V52 are from separate tanks of vessel V5, while V61, V62, and V63 are from vessel V6. The results indicate notable intra-vessel variability in community diversity and structure.
SampleChao1Shannon IndexSimpson IndexPielou Evenness
V5170.1046793990.0341405650.053794569
V52100.2144997530.0979282750.093156059
V61360.2794774630.0922363730.085779368
V62180.4895920950.1761085180.16938724
V63221.5767611150.625644920.510106587
Disclaimer/Publisher’s Note: The statements, opinions and data contained in all publications are solely those of the individual author(s) and contributor(s) and not of MDPI and/or the editor(s). MDPI and/or the editor(s) disclaim responsibility for any injury to people or property resulting from any ideas, methods, instructions or products referred to in the content.

