Article

Fick’s Diffusion Laws and Scaling of the Gill Surface Area and Oxygen Uptake in Fish

1
Institute for the Oceans and Fisheries, University of British Columbia, Vancouver, BC V6T 1Z4, Canada
2
Leiden University Centre for the Arts in Society, Leiden University, Arsenaalstraat 1, 2311CT Leiden, The Netherlands
*
Author to whom correspondence should be addressed.
Fishes 2025, 10(5), 233; https://doi.org/10.3390/fishes10050233
Submission received: 5 March 2025 / Revised: 9 May 2025 / Accepted: 11 May 2025 / Published: 16 May 2025

Abstract

The oxygen consumption of adult fish (Q) is proportional to their body weight (W) raised to a power, estimated as the slope (dQ) of a linear regression of log(Q) vs. log(W). Similarly, the gill surface area of adult fish (GSA) is proportional to W raised to the power dG, as also estimated via a log-log linear proportional to their surface area. Moreover, because of Fick’s laws of diffusion, dQ should be at least similar to dG. Recently, the claim has been made that non-zero differences between dQ and dG invalidate the Gill-Oxygen Limitation Theory (GOLT), which suggests that the O2 supplied by gills growing with dG <1 limits the growth of older and larger fish. We show here, based on 33 pairs of dG and dQ in 33 fish species and other information that (i) while individual differences between dQ and dG are observed in several cases, there is no significant overall difference across the 33 estimates and (ii) large differences between dQ and dG are primarily due to ontogenetic changes in scaling (OCS), likely ontogenetic changes in gills’ water–blood (or ‘diffusion’) distance and, as well, multiple sources of experimental variability and potential errors, leading to outliers and random differences.
Key Contribution: A comparison of the scaling exponents of gill surface area and respiration in 33 species of fish is presented, which establishes that (i) these exponents conform to Fick’s diffusion laws and (ii) their within-species differences do not invalidate the GOLT. Moreover, examples of ontogenetic changes in scaling (OCS) and increase with body size of the water–blood (or ‘diffusion’) distance are presented, which, if generalizable, suggest that in adult fish, gills are even more limiting than previously anticipated.

1. Introduction

The current debate about the impact of climate warming and ocean deoxygenation on fish and aquatic ecosystems has produced a vast literature that seeks to interpret older and newer data and evaluate different modeling approaches that might provide mechanistic explanations of the current trends [1,2,3]. One of these trends is the alteration of growth and maturation patterns in fish and other water-breathing ectotherms (hereafter WBEs) across phyla and taxa. This contribution attempts to clarify an issue concerning the respiration of WBEs that informs this debate and links the observed pattern of ‘shrinking fish’ [1] to processes of oxygen diffusion across respiratory surfaces in the case of fish gills. This limitation also explains why fish—particularly large/old individuals—and other WBEs are very sensitive to reduced dissolved oxygen (O2) in the water surrounding them and its temperature [4].
While oxygen limitation was proposed decades ago as a general mechanism behind temperature-induced decrease in final sizes and concomitant earlier maturation [5,6], many recent accounts still either focus on phenomenological descriptions of the effects of temperature on fish physiology—widely known as the temperature-size rule [7]—or present hypotheses that (i) are primarily taxon or locale specific, (ii) fail to consider ontogenetic changes in scaling (OCS; [8]), and (iii) lack any broader mechanistic explanatory power required for general scientific validity [9,10].
While rising temperatures do indeed impact species and ecosystems differentially, it is well established that the oxygen (O2) consumption of adult fish (Q) is proportional to their body weight (W) raised to a power, estimated as the slope (dQ) of a linear regression of log(Q) vs. log(W); similarly, the gill surface area of adults (GSA) is proportional to W raised to the power dG, as also estimated via a log-log linear regression (note that throughout this contribution, inspired by Ursin [11], who used ‘d’ rather than the commonly used ‘b’ for “[t]he power of weight with which the rate of oxygen consumption is proportional, disregarding the feeding condition of the fish”, we use dQ for the metabolism-related power and dG for the related power linking gill surface area and weight).
It is also well established (though contested by some authors; see below) that in late juvenile and adult fish (i.e., excluding air-breathing species), dQ and dG < 1, which implies a reduced O2 supply as body weight increases [8,12,13]. This forms the basis of the Gill-Oxygen Limitation Theory, or GOLT [5,14,15], which proposes that decreasing oxygen availability at greater body size (within a species) leads to a gradual decrease in growth rate, i.e., to asymptotic growth. Since higher temperatures (above 4–5 °C) increase the maintenance costs of fish and other WBEs [16], the GOLT identifies these increasing costs as the cause of reduced final body sizes.
The current debate about the GOLT has brought new attention to the question of the proportionality between oxygen uptake and gill surface area, i.e., the close similarity between dQ and dG [17,18,19]. In this contribution, we assembled data on both dQ and dG available in the literature for as many fish species as possible, and we discuss them in the context of oxygen diffusion processes through respiratory surfaces, i.e., gills. We then address the implications of the proportionality between oxygen uptake and gill surface area for growth processes and their sensitivity to temperature.
The diffusion of oxygen across biological membranes and its relevance for processes of organismic maintenance and growth has been theorized since the late 18th century and was given a mathematical form by Fick [20], whose two laws of diffusion are structurally similar to Fourier’s law of heat flow and Ohm’s law of charge flow. Fick’s law implies that the rate of diffusion of oxygen through a respiratory surface can be quantified by
Q = U∙GSA∙dP·WBD−1                             …
where Q is the oxygen uptake (=supply to the body, e.g., in mL·hour−1), U is Krogh’s diffusion constant (i.e., the amount of oxygen (in mL) that can diffuse through membranes with an area of 1 mm2 in one minute through a given type of material or tissue), GSA is the respiratory area (e.g., the sum of the lamellar area of fish gills), dP is the difference between the oxygen pressure on either side of the membrane in atm, and WBD is the water–blood distance, i.e., the thickness of the membrane in question [20,21].
With regard to WBD, De Jager and Dekker [21] asserted that “[i]t seems improbable that the thickness of the membrane is connected with the body weight. To our knowledge such a connection has never been suggested”. Indeed, in the literature, WBD, or diffusion distance, is generally treated as if it were constant within species, depending only on, e.g., the “abrasive content” of the water they inhabit [22]. However, the sparse literature that addresses ontogenetic changes in WBD reports an increase in membrane thickness; thus, diffusion distance increases with size [23,24,25,26,27]. It is therefore reasonable to assume either that (i) of the parameters in Equation (1), only GSA changes with the weight of fish, and oxygen uptake (Q) can be considered proportional to GSA, i.e., QGSA [21] or (ii) fish are additionally limited by an increase in water–blood barrier or diffusion distance with body size.
Scenario (i) implies that under ideal conditions, in a given species, dQ should be equal to dG. Since the earliest studies on metabolic scaling, this was the view of researchers who tried to establish inter- and intraspecific scaling patterns in fish and other water breathers. Both Pütter [28,29] and von Bertalanffy [12] stated that fish respiration—and thus also their growth—“depends on the surface” and thus on gills. While von Bertalanffy’s later work mainly focused on theoretical questions, fish physiologists who dedicated more effort to empirical research shared the view that oxygen consumption scaled proportionally to the growth respiratory surface area, most prominently Hughes [23]. This view was shared by most other contemporaries who studied fish respiration, notably De Jager and Dekker [21], who performed one of the first compilations of dQ and dG values. They found a slight difference in the mean values of dG and dQ but asserted “that the difference in the mean of the [dG]-value for the a-W relation (0.811) and [in the dQ-values] for the m-W relation (0.826) is sufficiently small to be accidental”.
The more recent literature is often based on similar assumptions, and studies on “high-energy demand teleosts” assume “a direct correlation of gill surface area with metabolic requirements” [30], while a summary of the literature up to the late 1980s [31] stated that “[s]tudies of scaling in juvenile and adult fish have shown that gill surface area and aerobic capacity expand at roughly the same rate as fish grow (Muir and Hughes [32]; Holeton [33]; Hughes [34,35]; Schmidt-Nielsen [36]. This is usually interpreted as indicating that aerobic capacity is effectively limited by gill surface area. Recent ablation studies tend to support this hypothesis (Duthie and Hughes [37])”.
Despite this relative consensus, the literature on the topic also contains data that seem to contradict the similarity of dG and dQ. A number of these outliers can be explained rather easily, e.g., the often-cited values of (standard) metabolic rate in large and active teleosts, e.g., tuna (Thunnus spp.) and dolphinfish (Coryphaena hippurus). To overcome experimental problems, researchers used neuromuscular blocking agents to measure oxygen consumption at rest [38,39,40]. Since the studied tuna species are ram ventilators and depend on continuous swimming to breathe, ‘resting’ under the influence of anesthetics represents a highly unnatural situation that can be expected to generate atypical values.
Another source of implausible values is faulty measurements of gill surface area, as outlined in detail by Hughes [23], who pointed out numerous sources of error leading to outliers in estimating GSA: “All [gill surface area] measurements depend on sampling, particularly with respect to the area of the ultimate exchange unit, the secondary lamella. Measurements of filament length and frequency of secondary lamellae are fairly certain, but the errors involved in obtaining a representative figure for the area of a single secondary lamella may be quite considerable. The use of weighted averages (Muir and Hughes [32] greatly reduces the errors”. In fact, given its importance, Hughes [41] devoted an entire article to this topic and to adequate measurement techniques. His recommendations might have solved some of these problems if they had been implemented and reduced the number of studies whose erroneous estimates found their way into the literature (see below).
While the general assumption of the proportionality between Q and GSA is supported by statistical evidence in interspecies comparisons, scenario (ii) implies that membrane thickness, and thus WBD, increases ontogenetically with body size, which must be assumed to impact the relationship between the scaling exponents of gill surface area and metabolic rate [25]. Therefore, it should be expected that this factor also impacts their relationship and cannot be evaluated without considering this component of Fick’s formula (Equation (1)).
Curiously, the relationship between dG and dQ has recently been used as an argument against surface area limitation of oxygen uptake as a factor that impacts fish growth [17,19]. These articles argued that the GOLT is invalidated if the difference of dQ from dG is ≥0 [17] or >0 [19]. The reasoning in [17] is based on the idea that if the scaling exponents of gill surface area are equal to (or exceed) those of oxygen consumption, supply would always meet demand. While it is obviously the case that supply has to meet demand, this argument must not overlook the differences in energy allocation between young and fast-growing individuals versus larger adults, with only the former being capable of devoting a substantial fraction of their energy to growth, as is also reflected in respirometric studies on the metabolism of growing juveniles [41]. In a slightly modified argument, the authors of [19]—probably because they recognized this problem—focused on scenarios where the differences between dQ and dG are >0.
In addition to ignoring the fact that the oxygen consumption of young fish includes their overhead costs of growth even when they are ‘starved’ for a day or two, the authors of these studies do not account for the fact that the scaling of both GSA and respiration changes in the ontogeny of fish and other WBEs, with both dQ and dG decreasing from the high values that they (must) have at the larval stage [42,43] to the value < 1 that they have when fully grown. Finally, we show how the non-consideration of ontogenetic changes in scaling (OCS) has led to several erroneous estimates of dQ and dG being published, which now confuse debates about the scaling of GSA and respiration in fish and other WBEs.

2. Materials and Methods

The literature dealing with comparisons between dG and dQ [17,21,44] was used first and complemented with studies covering either the gill morphology or the respiration of the same species. When several estimates of dG were available for the same species, we retained the midrange value. The same procedure was applied for dQ in order to reduce the number of erroneous or extreme values due to stressful or otherwise problematic conditions and to avoid a bias induced by the non-consideration of ontogenetic changes in scaling (OCS). While in their review of available data in the literature, Scheuffele et al. [17] indicated the range of weights of which values of dG and dQ were reported, most other authors did not. Also note that the data on dQ that we assembled include both values of standard and active metabolic rate, and we indicate which was used or that we took the average of the two.
We used 2 different approaches for describing the relationships between the dG- and dQ estimates that we assembled: (1) a linear regression of dQ vs. dG constrained by an intercept set at zero and (2) the method of Fieller [45] to estimate the confidence interval of the mean dG: dQ ratio (note that the approach in (1) does not assume a correlation between dG and dQ and/or the existence of values of dG and dQ close to zero). We then collected studies that reported ontogenetic changes in the water–blood distance (WBD) and gill membrane thickness, derived from linear regressions of WBD vs. body weight (W) or log(WBD) vs. log(W), and, for 3 species of thresher sharks, performed a multiple regression of WBD vs. W and a dummy variable to distinguish Alopias vulpinus from A. pelagicus and A. superciliosus. The literature on this topic provides far less data than the slopes of GSA and Q (and their respective ontogenetic changes), but the existing studies allow inferences on the impact of changes in WBD on the relationship between dQ and dG.

3. Results

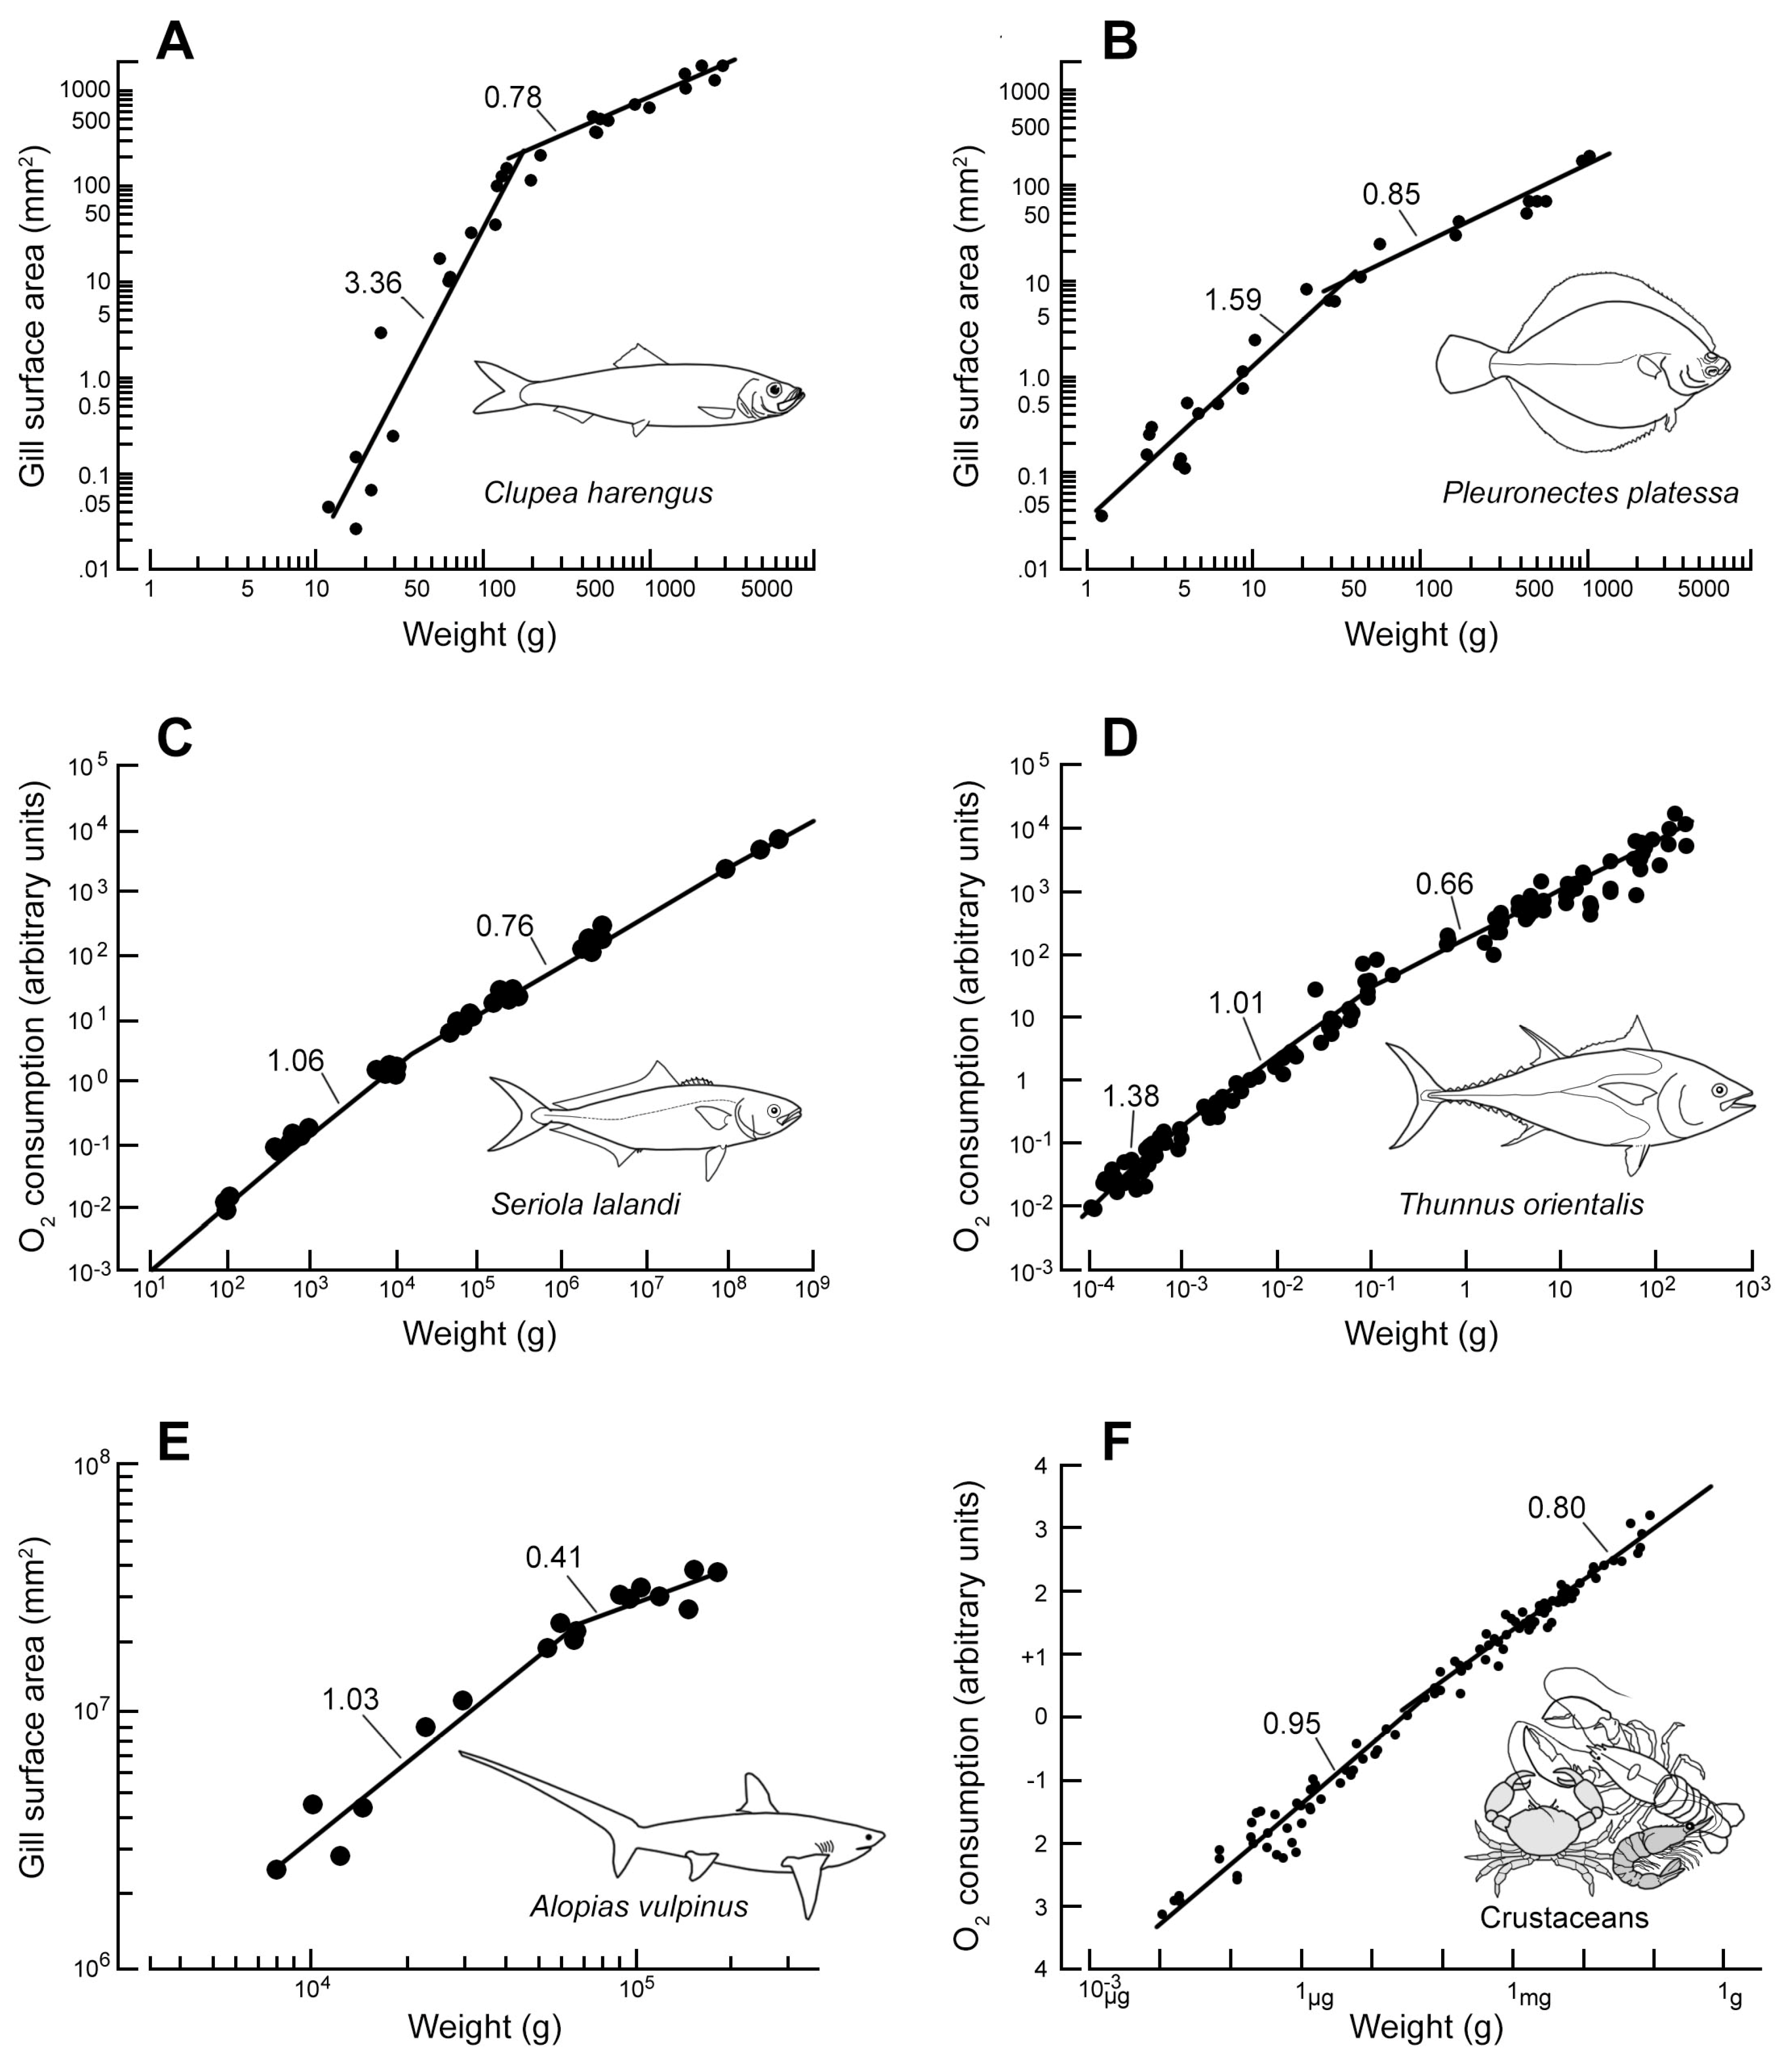
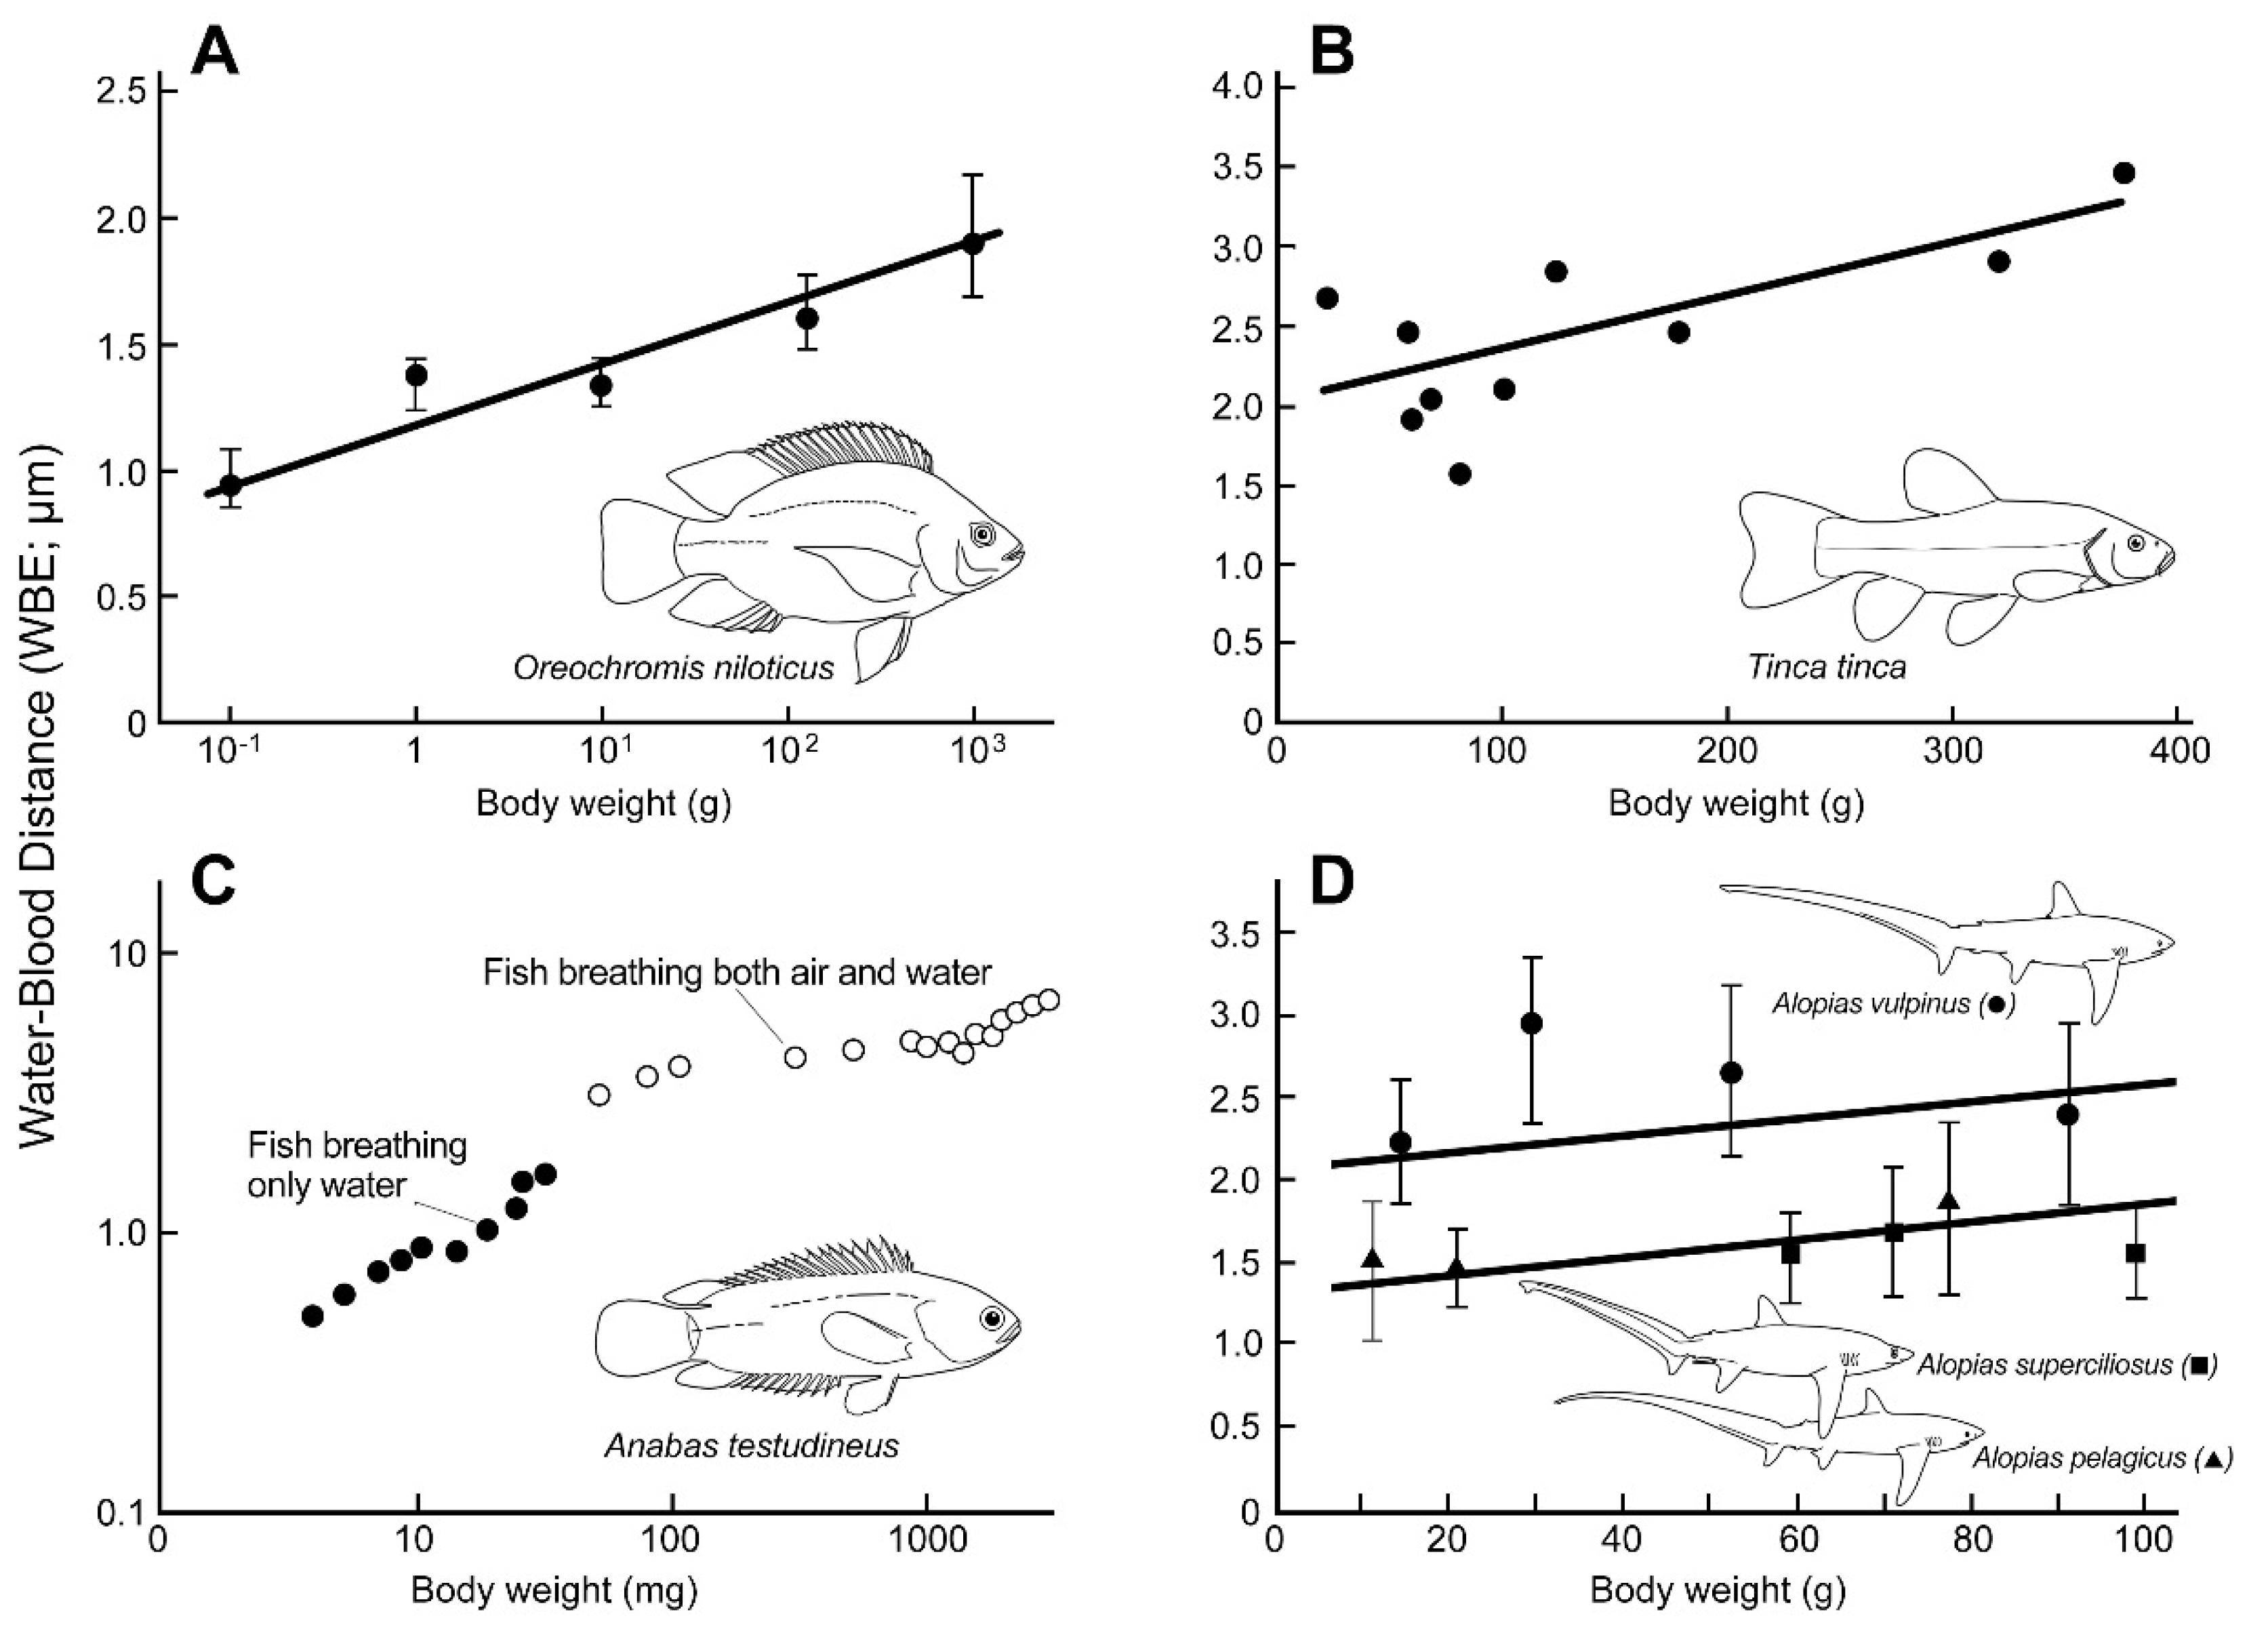
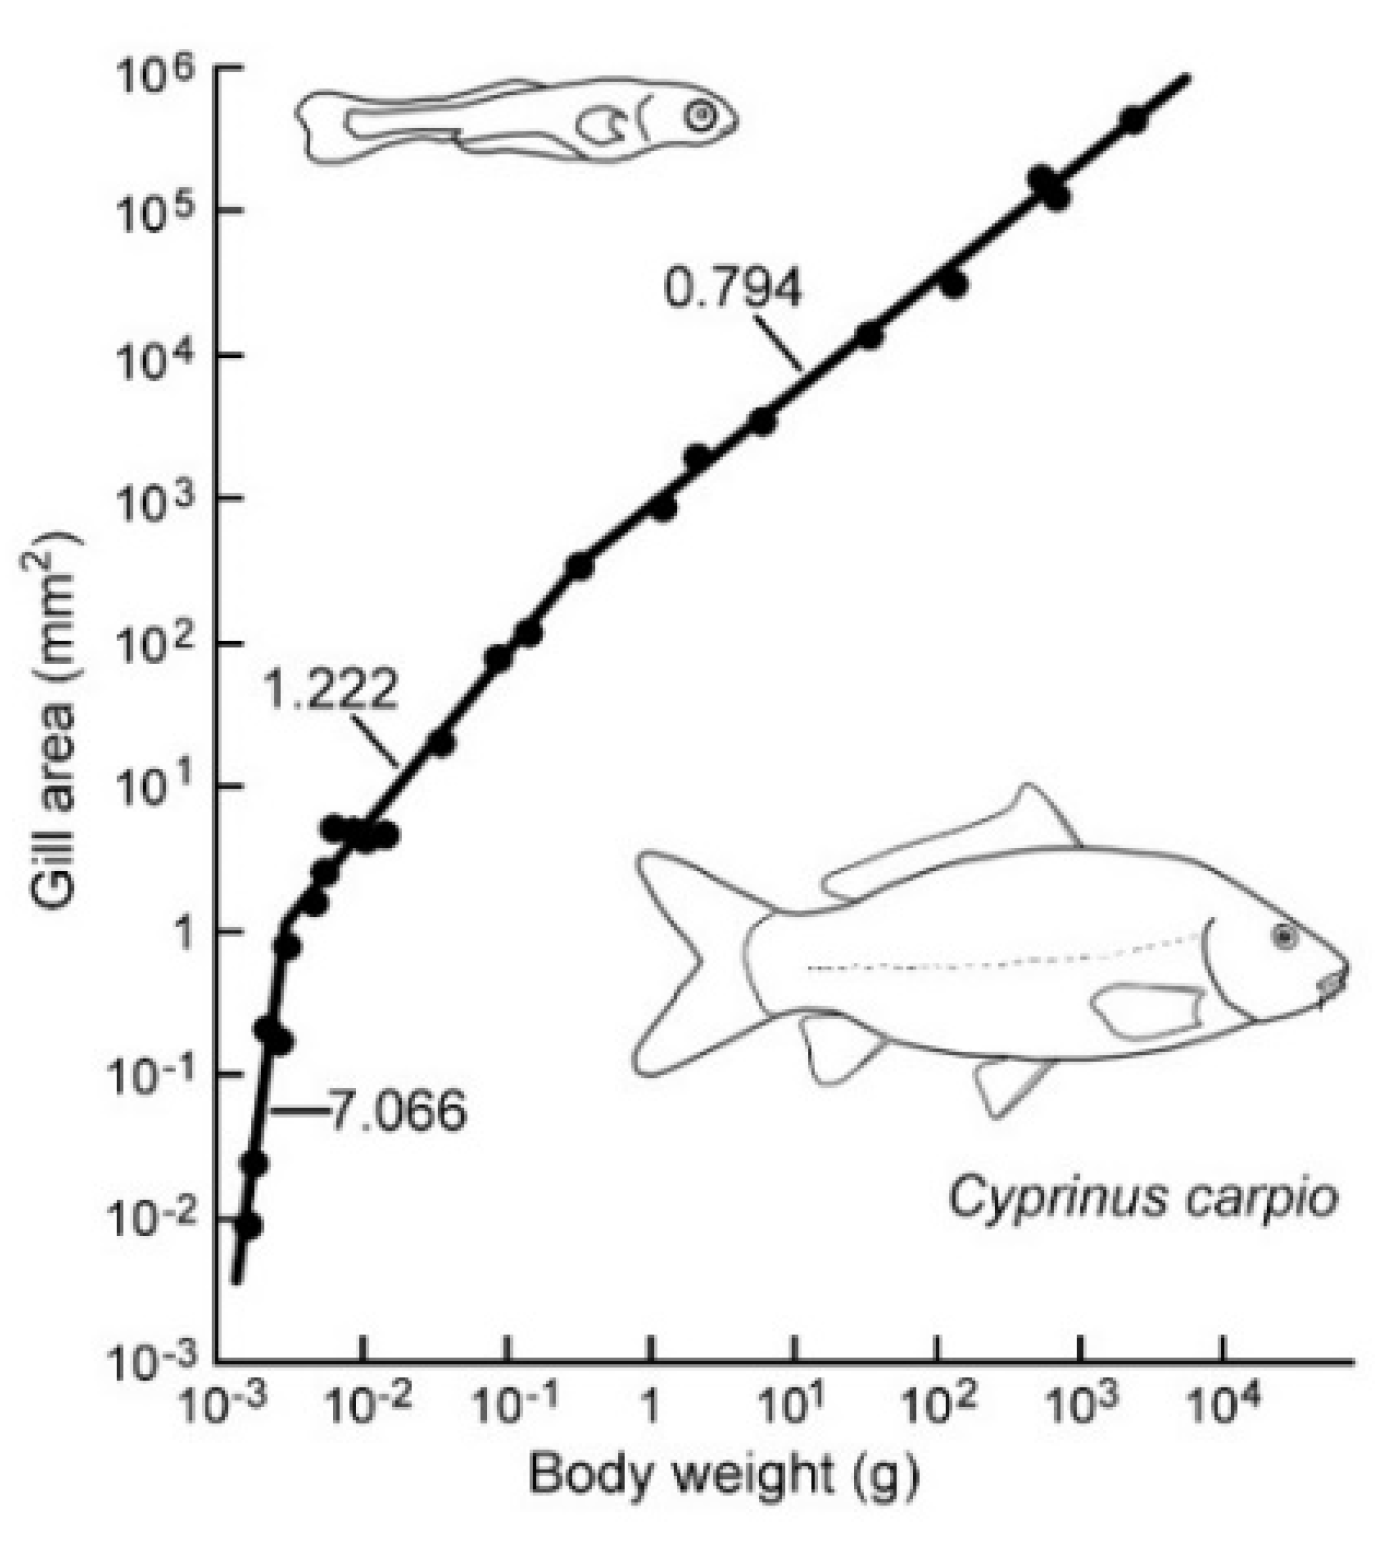
Ontogenetic Changes in Scaling and Diffusion Distance

Figure 1 illustrates five cases of ontogenetic changes (OCS) in fish (four teleosts and one shark) and in a group of WBEs, the crustaceans, to which the GOLT was previously shown to apply [46].
Figure 2 documents the ontogenetic increase in body weight of the water–blood distance (WBD, or diffusion distance) of the gills’ lamellae of six species of fish, which strengthens the effects of OCS if they illustrate a general trend in fish. The trend line in Figure 2B is a linear regression based on the harmonic means of WBD in Table 3 of Hughes [23], while the trend lines in Figure 2C are based on a multiple regression (R2 = 0.50) of the WBD vs. body weight data in Table 2 of Wootton [53] with a dummy as third variable, i.e., 0 for Alopias pelagicus and A. superciliosus (with similar WBD values) and 1 for A. vulpinus. Jointly, these six species suggest that the ontogenetic increase in WDB, which, for example, scales in adults with exponents of 0.077 in Nile tilapia and 0.086 in thresher sharks, would imply, when subtracted from dQ, a noticeable decrease in respiratory performance.
Our main exhibit is Table 1. It contains 33 species-specific pairs of dG- and dQ-values, whose averages are 0.836 and 0.810, with standard deviations of 0.130 and 0.143, respectively.
As the dots in Figure 3 illustrate, there is no correlation between the dG and dQ estimates in Table 1. However, a regression based on Fick’s Law, i.e., assuming a direct proportionality between dG and dQ, yields an estimate of 0.954 (95% C.I. = 0.886–1.022), which is statistically not different from 1 (p < 0.05). This is confirmed by the 95% confidence interval of the mean ratio of the 33 dG and dQ estimates, of 0.951–1.121, i.e., nearly symmetrical around the 1:1 ratio, which neatly conforms to the Law of Large Numbers (LLN; [89] (pp. 181–190)).
As can be seen in Table 1, the mean value of the difference between dG and dQ is only 0.026, despite our decision not to exclude obvious outliers from Table 1. The most implausible cases come from studies on dolphinfish (Coryphaena hippurus), skipjack (Katsuwonus pelamis), and yellowfin tuna (Thunnus albacares), with estimates of dQ of 0.384, 0.563, and 0.573 [38,40], as generated in respirometry experiments with fish immobilized by anesthetics and neuromuscular blocking agents. While the same procedure, earlier used for salmonids was stated not to have generated a significant decrease in measured metabolic rate [38], dQ estimates for Pacific bluefin tuna (Thunnus orientalis), either a close relative or a distinct population of Atlantic bluefin (T. thynnus), are higher, e.g., dQ = 0.71 [17], based on the mean of dQ = 0.66 [49] for large (and non-anesthetized) individuals and estimates in [90,91]. These values are somewhat more consistent with the physiological knowledge on large and active ram ventilators, depending on continuous swimming to take up oxygen.
These are not the only inconsistencies in the literature. Thus, for example, there are authors [92] who assert, based on the Schwarz Information Criteria, that dQ ≈ 0.89 represented a universal value in fish despite ample evidence of values near 0.6 in numerous small species [5,58]. Another example of a discrepancy may be found in [22], which reports an estimate of dG = 1.13 for Oncorhynchus mykiss based on [93], while well-founded estimates of dG = 0.90 for this species can be derived from GSA and W estimates in [94], as adopted here (see Table 1).

4. Discussion

4.1. Ontogenetic Changes in Scaling (OCS) of dG and dG and Their Effect

The scaling of dG and dQ depends on a variety of factors, and the slopes also differ between different life stages. Immediately upon hatching, fish larvae breathe through their skin, especially that of their finfold membrane [47,83,95]. Cutaneous respiration is first gradually and then (in most species) completely replaced by respiration through the gills. Multiple authors confirm earlier findings [43] that respiration scales in fish larvae with a power dQ >>1, which is consistent with their gills also growing with dG >> 1 (see, e.g., Figure 4, with dG = 7.066 in the larvae of common carp).
This rapid initial growth of fish gills is easy to understand, as gills, like their other organs must develop from a few cells (in this case within the head) of their embryos or larvae [95]; thus, the rapid relative growth of GSA must decline as more surface area is created, down to a lower level in fully grown adults. In these adults, the increase of the size and number of respiratory lamellae starts pushing against dimensional and physical constraints, i.e., the gills cannot invade the entire head, and more importantly, they must continue working as a surface, like a ‘sieve’ [96] that allows water to flow through. This implies that in adult fish and other WBEs, dG must remain < 1.
From this, we can conclude that (i) ontogenetic changes in scaling (OCS), i.e., in dG (and dQ, by extension), likely occur in all fish and other WBEs [8] and (ii) estimates of dG and/or dQ ≥ 1 can be assumed, by default, to have been based on an inappropriate range of weights, i.e., including individuals that were too small. An example is the estimate of dQ = 1.04 in spangled perch (Leiopotherapon unicolor) [97] that was used as an argument against the GOLT [98], but which was based on specimens whose weight ranged from 20 to 120 g, i.e., below 23% of the maximum weight reported for this species (531 g), as computed from its reported maximum (standard) length of 31 cm [99] and its length-weight relationship (SL = 0.0107·W3.15) [100]. Clearly, given OCS, estimates of dG or dQ that are ≥ 1 should be examined for the presence of juveniles impacting the linear regression, whose slope provided the estimate, and whose residuals may exhibit negative residuals for the smallest weights.
OCS in dG and dQ also explains the data of earlier authors [101], who reported values of dQ = 0.888 for the juveniles of tank goby (Glossogobius giuris), 0.632 for juveniles and adults, and 0.556 for adults only. If the generality of OCS is not accepted, these results do not make sense. Conversely, these results confirm the wide occurrence of OCS and suggest that published estimates of dQ and dG ≥ 1do not apply to adult fish.
Put differently: we assembled data (i) to demonstrate that dQ and dG are similar in the aggregate, even if they appear to be dissimilar in single cases, and thus cannot be used as single instances to ‘disprove’ the GOLT; (ii) to suggest that ontogenetic change of scale (OCS) appears to be a generalizable feature of fish gills; (iii) to suggest that the thickening of gill lamellae may also be a generalizable feature of fish gills; and (iv) to argue that items (i) to (iii) increase the likelihood that large/old fish and other WBEs are indeed oxygen limited, which results in their growth declining and ultimately stopping. We develop these points in the following sections.

4.2. Ontogenetic Changes in Scaling (OCS) of WBD

The limiting effects of OSC will be stronger if it turns out that the pattern of ontogenetic increase of diffusion distance, or the water–blood distance (WBD) of the gill lamellae documented in [23,25,53] and in Figure 2, applies to fish other than three species of teleosts and three species of sharks. More cases occur in the literature, where WBD value (which are difficult to estimate, hence their high variance, as illustrated in Figure 2D) are related to body weight. Several cases where the WBD increase is not obvious cover only a small fraction of the size range of the species in question, e.g., the WBD data on Arapaima gigas [27], flying barb (Esomus danricus) [102], or Japanese amberjack (Seriola quinqueradiata) [103], which are linked to weights reaching less than 15% of the 40 kg reached by this species. Thus, it is likely that the ontogenetic trend documented in Figure 2 is generalizable.
Indeed, it is straightforward to assume that growing fish need to strengthen the epithelium of their gill lamellae, which not only are vulnerable structures that can easily be damaged by abrasion, especially in turbid water [104,105], but must accommodate the strong water flows through the gills (whether through buccal pumping or ram ventilation), occurring in large individuals. An increase in WBD also occurs in many species where membrane thickness increases as a response to irritants, toxins, or changes in pH or water hardness [106,107,108]. This increase in the diffusion barrier can then be understood as a tradeoff between decreasing oxygen supply and physiological protection against harmful substances or intrusive particles in turbid water. The latter is likely a greater problem for larger fish with a higher water flow rate through the gills, requiring thicker membranes to protect the respiratory system. In addition, the larger buccal space provided by a larger body may allow larger particles to pass between the gill lamellae, which further increases the risk of abrasive damage.

4.3. Surface Area, Diffusion, and Ventilation Rates

As Table 1 shows and Figure 3 confirms, the literature provides ample evidence of the overall similarity of dG and dQ despite the inclusion of many questionable values, notably the ones derived from studies that involved anesthetics during respirometry and those due to the non-consideration of OCS (see above). However, this similarity is more than a statistical artifact, as it can be mechanistically predicted by the theoretical framework that underlies Fick’s laws of diffusion [20]. As Fick was able to show via his ‘first diffusion law,’ diffusion rates depend on the concentration gradients of a substance at two sides of a membrane: the higher the difference in concentration between the two sides, the higher the diffusion rate. The modified form, more often used in respiration studies (Equation (1)), relates this more explicitly to the role of surface area and membrane thickness.
While studies on fish respiration typically focus on surface area and permeability [21,22], the central idea behind the first diffusion law, i.e., the dependence of diffusion on the pressure (or concentration) gradient, seems to have received less attention from physiologists. While surface area and membrane thickness (WBD) do indeed play a limiting as well as an enabling role in diffusion processes in gills, the concentration or pressure gradient influences the diffusion rates from two directions: (i) through the countercurrent exchange of arterial blood through the gills and (ii) through the controlled movement of oxygenated water through the gills.
The impact of ventilation on diffusion rate Q (see Equation (1)) must, therefore, be understood as a modulation of the pressure gradient (dP in Equation (1)): with increased ventilation, the difference between the oxygen pressure in the water and the blood in the afferent arteries increases as well, which allows for more effective oxygenation of the arterial blood. Notably, it has been suggested that differences between dG and dQ can be explained by variations in ventilation frequency [44]. The authors of this study examined the scaling patterns of gill surface area, resting metabolic rate, and ventilation frequency in six cyprinid species and found that dG and dQ scaled very closely in five species. Still, one species, goldfish (Carassius auratus), showed a difference of 0.128 between dG and dQ, with gill surface area exceeding oxygen consumption. In contrast to the other species, the ventilation frequency in goldfish also showed a negative slope.
Comparing dG and dQ can be informative because a statistical correspondence between the two slopes is sufficient to assume a dependence of dQ on dG, but if the respective scaling exponents of ventilation cannot be defined or estimated, the absence of defined or estimated scaling exponents for ventilation limits the interpretability of individual values. Consequently, these metrics are more useful when analyzed within larger datasets, where they contribute to more meaningful and reliable results.
While active ventilation mediates the relationship between dG and dQ, it comes at immense costs in water breathers. It has been estimated that the energy needed for respiration can be higher than half the total energy budget at certain life stages in some species (Table 2). Thus, a temporary reduction of ventilation, as evidenced in the goldfish case [44], does not necessarily indicate that the gill surface is no longer a limiting factor. Instead, it could even be interpreted as a response to a limited energy budget and a strategy to save energy temporarily.
Additional costs and risks of increased ventilation involve an impairment of the ‘osmorespiratory compromise’ [109], which may lead to ion loss at higher breathing frequencies, increased exposure to toxic or xenobiotic substances [110], and higher risk of infection by gill parasites [110]. Studies on these disadvantages of increased ventilation highlight that the balance between sufficient oxygen uptake and exposure to harmful substances and parasites is a delicate one, requiring fish to optimize their respiratory strategies to meet metabolic demands while minimizing physiological and ecological risks.
Table 2. Energy for respiration (R) in several fish species and ages (in % of overall metabolism, rounded to the nearest integer [111]).
SpeciesR
Coregonus pollan57
Gadus morhua (9 years old)<49
Coregonus albula (different seasons)41–59
Micropterus salmoides40
Gadus morhua (3 years old)<37
Gasterosteus aculeatus (diff. seasons)36–52
Esox lucius (diff. seasons)16–50
Anguilla anguilla7
Mean~30

4.4. Active and Standard Metabolic Rates

As outlined above, virtually all early studies on the relative scaling of oxygen uptake and gill surface area in fish assumed a direct proportionality between the two parameters [12,21,28,32,33,37,61]. However, dG and dQ might not always scale identically, and in fact, slightly higher values of dG might be more common if dQ is based on resting metabolic rates. Evidence for this is available in an article [112] that reported the scaling exponents of both resting and active metabolic rates and showed that resting metabolism decreased with size while active metabolic rates remained virtually constant relative to body weight. The resulting difference between resting and active metabolic rates between small under-yearlings and adults of 1.4 kg was 720 and 673 mg O2/kg/h. While the amount of oxygen invested in activity remained similar per kg of fish, this finding was interpreted as evidence for an increased scope for activity [23], which is only correct if the parameter of interest was resting metabolic rate, which indeed significantly declined. Interestingly, the almost linear scaling of the exponent of activity rate also coincides with the observation that the largest fish were at the very limits of exhaustion and showed an oxygen debt after the experiments—in contrast to the younger individuals.
What follows from this is that resting metabolic rate might not always be the best parameter to be scaled relative to GSA. Especially in active fish, which critically depend on high levels of activity, a direct proportionality between dG and dQ at rest (but not at high levels of activity) would be rather implausible, as in [19], where the scaling exponents of maximum metabolic rate scale are closest to dG. Thus, cases where dG and dQ at rest strongly diverge should be checked with regard to the activity level that occurred during the respiratory experiment.
As ablation experiments have shown, the amount of removed gill surface closely correlates with the reduction in oxygen consumption [37]. The rainbow trout (Oncorhynchus mykiss) survived a procedure that removed 27% of their GSA, and their standard oxygen uptake rate did not differ from that of the control group. However, the maximum uptake capacity difference of 27–29% directly correlated with the ablated GSA.
Interestingly, exposure to hyperoxia did not increase uptake capacity, “suggesting a direct limit on oxygen uptake at the gills independent of environmental P0 when elevated above normoxia” [37]. As these results suggest, oxygen uptake at rest might not always utilize the entire surface area of the gills. Yet—and despite the capacity for gill remodeling under hypoxia in many fish species [113]—GSA remains an absolute limiting factor for oxygen uptake, and even intensive ventilation may not be able to compensate for a reduction in surface area at higher activity levels. The effects may differ between active and sluggish species. For salmonids, tuna, and other fish that swim continuously, the slopes of active metabolic rate are probably the more relevant parameter to relate to the gills’ surface area.
In a discussion of the GOLT [17], standard metabolic rate was interpreted as merely consisting of maintenance activities, excluding costs of growth. However, as shown in [41], overhead costs of growth significantly contribute to measured values of oxygen consumption and consequently shape the decreasing slope of metabolic rate relative to body mass. It is important to note that the GOLT does not structurally distinguish between maintenance costs at rest and activity but defines maintenance activities as including everything fish “normally do (forage, digest their food, escape predators, etc.) except grow” [15]. It can, therefore, be concluded that the results in [17] directly confirm the predictions of the GOLT.

5. Conclusions

As Table 1 shows, reported data on the relationship between dG and dQ vary widely, but they are not significantly different from each other in the aggregate. The causes for the outliers in Table 1 are issues with respirometry [38,40] and other experimental procedures, errors in GSA measurements [35], and non-consideration of ontogenetic changes in scaling and WBD. This challenges the recent argument that gill surface area and, hence, oxygen limitation can be excluded as factors that impact fish physiology in cases where dGdQ [17,19]. Instead, it should be noted that (i) respirometry data commonly interpreted as ‘standard metabolic rate’ typically include the overhead costs of growth [41], which contribute to the observed scaling patterns. We further argue that (ii) despite outliers and a trend of ontogenetic increase in WBD with size, the mean values of dG and dQ in the literature are, in fact, very similar and statistically identical, and (iii) in fish that do not use ram-ventilation, the relationship between dG and dQ is mediated by ventilation frequency, and thus it is only if identical breathing frequencies at different sizes occur [44] that we can expect dG and dQ to be equal or at least similar. Finally, and in line with [50,114], we believe that increased ventilation cannot overcome the limiting effects of dG and dQ being <1 on the growth of fish and other WBEs because a high respiratory rate has a high cost in overall fitness and is deployed only when in mortal danger, e.g., to escape a predator.

Author Contributions

D.P. and J.M. contributed equally to all aspects of this contribution. All authors have read and agreed to the published version of the manuscript.

Funding

This research received no external funding.

Institutional Review Board Statement

This study does not involve live fish, It is conducted solely using published data.

Informed Consent Statement

Not applicable.

Data Availability Statement

All the data considered in this contribution are presented in its text, tables, or figures.

Acknowledgments

We thank Rachel Atanacio for drafting Figure 1, Figure 2, and Figure 4 and Elaine Chu for Figure 3. Also, we thank S.S. Killen and D.S. Glazier for kindly providing the missing references for the Supplementary Information from their 2010 article.

Conflicts of Interest

The authors declare no conflicts of interest.

Abbreviations

The following abbreviations are used in this manuscript:
GOLTGill-Oxygen Limitation Theory
OCSOntogenetic changes in scaling
WBEsWater-breathing ectotherms
GSAGill surface area (of adult WBE)
WBDWater–Blood Distance, or diffusion distance
AMRActive metabolic rate
SMRStandard metabolic rate

References

  1. Cheung, W.W.L.; Sarmiento, J.L.; Dunne, J.; Fröhlicher, T.L.; Lam, V.W.Y.; Palomares, M.L.D.; Watson, R.; Pauly, D. Shrinking of fishes exacerbates impacts of global ocean changes on marine ecosystems. Nat. Clim. Change 2013, 3, 254–258. [Google Scholar] [CrossRef]
  2. Rubalcaba, J.G.; Verberk, W.C.; Hendriks, A.J.; Saris, B.; Woods, H.A. Oxygen limitation may affect the temperature and size dependence of metabolism in aquatic ectotherms. Proc. Natl. Acad. Sci. USA 2020, 117, 31963–31968. [Google Scholar] [CrossRef] [PubMed]
  3. Verberk, W.C.; Atkinson, D.; Hoefnagel, K.N.; Hirst, H.G.; Horne, C.R.; Siepel, H. Shrinking body sizes in response to warming: Explanations for the temperature–size rule with special emphasis on the role of oxygen. Biol. Rev. 2021, 96, 247–268. [Google Scholar] [CrossRef] [PubMed]
  4. Müller, J.; Houben, N.; Pauly, D. On being the wrong size: What is the role of body size in fish kills and hypoxia exposure? Environ. Biol. Fishes 2023, 106, 1651–1667. [Google Scholar] [CrossRef]
  5. Pauly, D. The relationships between gill surface area and growth performance in fish: A generalization of von Bertalanffy’s theory of growth. Berichte Dtsch. Wiss. Komm. Meeresforsch. 1981, 28, 251–282. [Google Scholar]
  6. Pauly, D. A mechanism for the juvenile-to-adult transition in fishes. J. Cons. Int. l’Explor. Mer 1984, 41, 280–284. [Google Scholar] [CrossRef]
  7. Atkinson, D. Temperature and organism size—A biological law for ectotherms? Adv. Ecol. Res. 1994, 25, 1–58. [Google Scholar] [CrossRef]
  8. Glazier, D.S. Multiphasic allometry: The reality and significance of ontogenetic shifts in the body-mass scaling of metabolic rate. Acad. Biol. 2024, 2, AcadBiol7411. [Google Scholar] [CrossRef]
  9. Glennan, S. Rethinking mechanistic explanation. Philos. Sci. 2002, 69, S342–S353. [Google Scholar] [CrossRef]
  10. Bechtel, W.; Bich, L. Organisms Need Mechanisms; Mechanisms Need Organisms. New Mechanism. Explan. Emerg. Reduct. 2024, 35, 85–108. [Google Scholar] [CrossRef]
  11. Ursin, E. A mathematical model of some aspects of fish growth, respiration, and mortality. J. Fish. Res. Bd. Can. 1967, 24, 2355–2453. [Google Scholar] [CrossRef]
  12. Von Bertalanffy, L. Theoretische Biologie. Zweiter Band: Stoffwechsel, Wachstum; A. Francke Verlag: Bern, Switzerland, 1951. [Google Scholar]
  13. Hemmingsen, A.M. Energy metabolism as related to body size and respiratory surfaces, and its evolution. Rep. Steno Mem. Hosp. Nord. Insul. Lab. 1960, 9, 1–110. [Google Scholar]
  14. Pauly, D. The Gill-Oxygen Limitation Theory (GOLT) and its critics. Sci. Adv. 2021, 7, eabc6050. [Google Scholar] [CrossRef] [PubMed]
  15. Müller, J.; Pauly, D. Fishes in Warming Waters, the Gill-Oxygen Limitation Theory and the Debate around Mechanistic Growth Models. Fishes 2024, 9, 430. [Google Scholar] [CrossRef]
  16. Pauly, D.; Lam, M.E. Too hot or too cold: The biochemical basis of temperature-size rules for fish and other ectotherms. Environ. Biol. Fishes 2023, 106, 1519–1527. [Google Scholar] [CrossRef]
  17. Scheuffele, H.; Jutfelt, F.; Clark, T.D. Investigating the gill-oxygen limitation hypothesis in fishes: Intraspecific scaling relationships of metabolic rate and gill surface area. Conserv. Physiol. 2021, 9, coab040. [Google Scholar] [CrossRef]
  18. Jutfelt, F.; Ern, R.; Leeuwis, R.H.J.; Clark, T.D. Effects of climate warming. In Encyclopedia of Fish Physiology, 2nd ed.; Aldemann, S.L., Gillis, T.E., Eds.; Academic Press: New York, NY, USA, 2024; Volume 3, pp. 14–31. [Google Scholar] [CrossRef]
  19. Lonthair, J.K.; Wegner, N.C.; Cheng, B.S.; Fangue, N.A.; O’Donnell, M.J.; Regish, A.M.; Swenson, J.D.; Argueta, E.; McCormick, S.D.; Letcher, B.H.; et al. Smaller body size under warming is not due to gill-oxygen limitation in a cold-water salmonid. J. Exp. Biol. 2024, 227, jeb246477. [Google Scholar] [CrossRef]
  20. Fick, A. On liquid diffusion. Lond. Edinb. Dublin Philos. Mag. J. Sci. 1855, 10, 30–39. [Google Scholar] [CrossRef]
  21. De Jager, S.; Dekkers, W.J. Relations between gill structure and activity in fish. Netherl. J. Zool. 1974, 25, 276–308. [Google Scholar] [CrossRef]
  22. Palzenberger, M.; Pohla, H. Gill surface area of water-breathing freshwater fish. Rev. Fish Biol. Fish. 1992, 2, 187–216. [Google Scholar] [CrossRef]
  23. Hughes, G.M. Morphometrics of fish gills. Respir. Physiol. 1972, 14, 1–25. [Google Scholar] [CrossRef]
  24. Prasad, M.S.; Prasad, P. Blood-water diffusion barrier at the secondary gill lamellae in Anabas testudineus (Bloch) during early ontogenesis. Curr. Sci. 1984, 53, 156–158. [Google Scholar]
  25. Kisia, S.; Hughes, G.M. Estimation of oxygen-diffusing capacity in the gills of different sizes of a tilapia, Oreochromis niloticus. J. Zool. 1992, 227, 405–415. [Google Scholar] [CrossRef]
  26. Wootton, T.P.; Sepulveda, C.A.; Wegner, N.C. Gill morphometrics of the thresher sharks (Genus Alopias): Correlation of gill dimensions with aerobic demand and environmental oxygen. J. Morph. 2015, 276, 589–600. [Google Scholar] [CrossRef] [PubMed]
  27. Frommel, A.Y.; Kwan, G.T.; Prime, K.J.; Tresguerres, M.; Lauridsen, H.; Val, A.L.; Gonçalves, L.U.; Brauner, C.J. Changes in gill and air-breathing organ characteristics during the transition from water-to air-breathing in juvenile Arapaima gigas. J. Exp. Zool. Part A Ecol. Integr. Physiol. 2021, 335, 801–813. [Google Scholar] [CrossRef] [PubMed]
  28. Pütter, A. Vergleichende Physiologie; Georg Fischer: Jena, Germany, 1911. [Google Scholar]
  29. Pütter, A. Studien über physiologische Ähnlichkeit VI. Wachstumsähnlichkeiten. Pflügers Arch. Gesamte Physiol. Menschen Tiere 1920, 180, 298–340. [Google Scholar] [CrossRef]
  30. Wegner, N.C.; Sepulveda, C.A.; Bull, K.B.; Graham, J.B. Gill morphometrics in relation to gas transfer and ram ventilation in high-energy demand teleosts: Scombrids and billfishes. J. Morph. 2010, 271, 36–49. [Google Scholar] [CrossRef]
  31. Rombough, P.; Moroz, B. The scaling and potential importance of cutaneous and branchial surfaces in respiratory gas exchange in young chinook salmon (Oncorhynchus tshawytscha). J. Exp. Biol. 1990, 154, 1–12. [Google Scholar] [CrossRef]
  32. Muir, B.S.; Hughes, G.M. Dimensions for three species of tunny. J. Exp. Biol. 1969, 51, 271–285. [Google Scholar] [CrossRef]
  33. Holeton, G.F. Respiratory morphometrics of white and red-blooded Antarctic fish. Comp. Biochem. Physiol. 1976, 54, 215–220. [Google Scholar] [CrossRef]
  34. Hughes, G.M. Morphometry of fish gas exchange in relation to their respiratory function. In Environmental Physiology of Fishes; Ali, M.E., Ed.; Plenum: New York, NY, USA, 1981; pp. 33–56. [Google Scholar]
  35. Hughes, G.M. Measurement of gill area in fishes: Practices and problems. J. Mar. Biol. Assoc. UK 1984, 64, 637–655. [Google Scholar] [CrossRef]
  36. Schmidt-Nielsen, K. Scaling: Why is Animal Size So Important; Cambridge University Press: Cambridge, UK, 1984. [Google Scholar]
  37. Duthie, G.G.; Hughes, G.M. The effects of reduced gill area and hyperoxia on the oxygen consumption and swimming speed of rainbow trout. J. Exp. Biol. 1987, 127, 349–354. [Google Scholar] [CrossRef]
  38. Brill, R.W. On the standard metabolic rates of tropical tunas, including the effect of body size and acute temperature change. Fish. Bull. 1987, 85, 25–35. [Google Scholar]
  39. Dewar, H.; Graham, J.B. Studies of tropical tuna swimming performance in a large water tunnel: I. Energetics. J. Exp. Biol. 1994, 192, 13–31. [Google Scholar] [CrossRef]
  40. Benetti, D.D.; Brill, R.W.; Kraul, S.A. The standard metabolic rate of dolphin fish. J. Fish Biol. 1995, 46, 987–996. [Google Scholar] [CrossRef]
  41. Rosenfeld, J.; Van Leeuwen, T.; Richards, J.; Allen, D. Relationship between growth and standard metabolic rate: Measurement artifacts and implications for habitat use and life-history adaptation in salmonids. J. Anim. Ecol. 2015, 84, 4–20. [Google Scholar] [CrossRef]
  42. Oikawa, S.; Itazawa, Y. Gill and body surface areas of the carp in relation to body mass, with special reference to the metabolism-size relationship. J. Exp. Biol. 1985, 117, 1–14. [Google Scholar] [CrossRef]
  43. Bochdansky, A.B.; Leggett, W.C. Winberg revisited: Convergence of routine metabolism in larval and juvenile fish. Can. J. Fish. Aquat. Sci. 2001, 58, 220–230. [Google Scholar] [CrossRef]
  44. Luo, Y.; Li, Q.; Zhu, X.; Zhou, J.; Shen, C.; Xia, D.; Djiba, P.K.; Xie, H.; Lv, X.; Jia, J.; et al. Ventilation frequency reveals the roles of exchange surface areas in metabolic scaling. Physiol. Biochem. Zool. 2020, 93, 13–22. [Google Scholar] [CrossRef]
  45. Fieller, E.C. The biological standardization of insulin. Suppl. J. R. Stat. Soc. 1940, 7, 1–64. [Google Scholar] [CrossRef]
  46. Pauly, D.; Amarasinghe, U.S.; Chu, E.; Freire, K.M.F.; Vasquez, E.; Butler, M.J. The growth, respiration, and reproduction of crustaceans: A synthesis through the Gill- Oxygen Limitation Theory (GOLT). J. Crustac. Biol. 2022, 42, 1–13. [Google Scholar] [CrossRef]
  47. De Silva, D.P. Development of the Respiratory System in Herring and Plaice Larvae. In The Early Life History of Fishes; Blaxter, J.H., Ed.; Springer: Berlin, Germany; New York, NY, USA, 1974; pp. 465–485. [Google Scholar]
  48. Moran, D.; Wells, R.M. Ontogenetic scaling of fish metabolism in the mouse-to-elephant mass magnitude range. Comp. Biochem. Physiol. Part A Mol. Integr. Physiol. 2007, 148, 611–620. [Google Scholar] [CrossRef] [PubMed]
  49. Miyashita, S.; Hattori, N.; Sawada, Y.; Ishibashi, Y.; Nakatsukasa, H.; Okada, T.; Murata, O.; Kumai, H. Ontogenetic change in oxygen consumption of bluefin tuna, Thunnus thynnus. Aquacult. Sci. 1999, 47, 269–275. [Google Scholar]
  50. Pauly, D.; Cheung, W.W.L. Sound physiological knowledge and principles in modelling shrinking of fishes under climate change. Glob. Change Biol. 2018, 24, e15–e26. [Google Scholar] [CrossRef]
  51. Wegner, N.C. Elasmobranch gill structure. In Physiology of Elasmobranch Fishes: Structure and Interaction with Environment; Shadwick, R.E., Farrell, A.P., Brauner, C.J., Eds.; Academic Press: London, UK, 2016; pp. 102–153. [Google Scholar]
  52. Zeuthen, E. Oxygen Uptake as Related to Body Size in Organisms. Q. Rev. Biol. 1953, 28, 1–12. [Google Scholar] [CrossRef]
  53. Wootton, T.P. Gill Morphometrics of Thresher Sharks (Genus Alopias): An Investigation of the Evolutionary Pressures Influencing Gill Morphology. Ph.D. Thesis, University of California, San Diego, CA, USA, 2011. [Google Scholar]
  54. Satora, L.; Wegner, N.C. Reexamination of the Byczkowska-Smyk gill surface area data for European teleosts, with new measurements on the pikeperch, Sander lucioperca. Rev. Fish Biol. Fish. 2012, 22, 1–9. [Google Scholar] [CrossRef]
  55. Bennett, M. Morphometric analysis of the gills of the European eel, Anguilla anguilla. J. Zool. 1988, 215, 549–560. [Google Scholar] [CrossRef]
  56. Degani, G.; Gallagher, M.L.; Meltzer, A. The influence of body size and temperature on oxygen consumption of the European eel, Anguilla anguilla. J. Fish Biol. 1989, 34, 19–24. [Google Scholar] [CrossRef]
  57. Li, G.; Lv, X.; Zhou, J.; Shen, C.; Xia, D.; Xie, H.; Luo, Y. Are the surface areas of the gills and body involved with changing metabolic scaling with temperature? J. Exp. Biol. 2018, 221, jeb174474. [Google Scholar] [CrossRef]
  58. Killen, S.S.; Atkinson, D.S.; Glazier, D.S. The intraspecific scaling of metabolic rate with body mass in fishes depends on lifestyle and temperature. Ecol. Lett. 2010, 13, 184–193. [Google Scholar] [CrossRef]
  59. Beamish, F.W.H. Respiration of fishes with special emphasis on standard oxygen consumption. II. Influence of weight and temperature on respiration of several species. Can. J. Zool. 1964, 42, 177–188. [Google Scholar] [CrossRef]
  60. Roy, P.K.; Munshi, J.S.D. Oxygen uptake in relation to body weight and respiratory surface area in Cirrhinus mrigala (Ham.) at two different seasonal temperatures. Proc. Indian Natl. Sci. Acad. 1984, B50, 387–394. [Google Scholar]
  61. Hughes, G.M. Morphological measurements on the gills of fishes in relation to their respiratory function. Folia Morphol. 1970, 18, 78–95. [Google Scholar]
  62. Winberg, G.G. Rate of Metabolism and Food Requirements of Fishes; Minsk, USSR. Fisheries Research Board of Canada, Translation Series No. 194; Fisheries Research Board of Canada, Biological Station: Nanaimo, BC, Canada, 1960. [Google Scholar]
  63. Jakubowski, M. Reexamination of the gill respiratory surface area in the pike, Esox lucius, and remarks on the other fish species. Acta Biol. Cracov. Ser. Zool. 1992, 34, 25–32. [Google Scholar]
  64. Diana, J.S. An experimental analysis of the metabolic rate and food utilization of northern pike. Comp. Biochem. Physiol. 1982, 71A, 395–399. [Google Scholar] [CrossRef]
  65. Armstrong, J.D.; Priede, I.G.; Lucas, M.C. The link between respiratory capacity and changing metabolic demands during growth of northern pike, Esox lucius L. J. Fish Biol. 1992, 41 (Suppl. B), 65–75. [Google Scholar] [CrossRef]
  66. Skeeles, M.R.; Clark, T.D. Fish gill surface area can keep pace with metabolic oxygen requirements across body mass and temperature. Funct. Ecol. 2024, 38, 755–764. [Google Scholar] [CrossRef]
  67. Hölker, F.; Thiel, R. Biology of ruffe (Gymnocephalus cernuus (L.))—A review of selected aspects from European literature. J. Great Lakes Res. 1998, 24, 186–204. [Google Scholar] [CrossRef]
  68. Tátrai, I. Feeding Habits and Energy Utilization by Ruffe (Acerina cernua L.) in Lake Balaton. Ph.D. Thesis, Balaton Limnological Research Institute, Tihany, Hungary, 1977. [Google Scholar]
  69. Xiong, W.; Zhu, Y.; Zhang, P.; Xu, Y.; Zhou, J.; Zhang, J.; Luo, Y. Effects of temperature on metabolic scaling in silver carp. J. Exp. Zool. Part A 2022, 337, 141–149. [Google Scholar] [CrossRef]
  70. Brill, R.W. The effect of body size on the standard metabolic rate of skipjack tuna, Katsuwonus pelamis (L.). Fish Bull. US 1979, 77, 494–498. [Google Scholar]
  71. Davies, R.; Moyes, C.D. Allometric scaling in centrarchid fish: Origins of intra-and inter-specific variation in oxidative and glycolytic enzyme levels in muscle. J. Exp. Biol. 2007, 210, 3798–3804. [Google Scholar] [CrossRef] [PubMed]
  72. Ojha, J.; Singh, R. Oxygen uptake in relation to body weight of the freshwater catfish, Mystus cavasius (Ham.). Indian J. Exp. Biol. 1981, 19, 126–129. [Google Scholar]
  73. Somo, D.A.; Chu, K.; Richards, J.G. Gill surface area allometry does not constrain the body mass scaling of maximum oxygen uptake rate in the tidepool sculpin, Oligocottus maculosus. J. Comp. Physiol. B 2023, 193, 425–438. [Google Scholar] [CrossRef] [PubMed]
  74. Killen, S.S.; Costa, I.; Brown, J.A.; Gamperl, A.K. Little left in the tank: Metabolic scaling in marine teleosts and its implications for aerobic scope. Proc. R. Soc. B. 2007, 274, 431–438. [Google Scholar] [CrossRef]
  75. Blasco, F.R.; Taylor, E.W.; Leite, C.A.C.; Monteiro, D.A.; Rantin, F.T.; McKenzie, D.J. Tolerance of an acute warming challenge declines with body mass in Nile tilapia: Evidence of a link to capacity for oxygen uptake. J. Exp. Biol. 2022, 225, jeb244287. [Google Scholar] [CrossRef]
  76. Ken-Ichi, Y. Relationship of respiration to body weight in the tilapia Oreochromis niloticus under resting and normoxic conditions. Comp. Biochem. Physiol. Part A Mol. Integr. Physiol. 1992, 103, 81–83. [Google Scholar] [CrossRef]
  77. Christensen, E.A.F.; Svendsen, M.B.S.; Steffensen, J.F. The combined effect of body size and temperature on oxygen consumption rates and the size-dependency of preferred temperature in European perch Perca fluviatilis. J. Fish Biol. 2020, 97, 794–803. [Google Scholar] [CrossRef]
  78. Al-Kadhomiy, N.K. Gill Development, Growth and Respiration of the Flounder, Platichthys flesus (L.). Ph.D. Thesis, Bristol University, Bristol, UK, 1985. [Google Scholar]
  79. Fonds, M.; Cronie, R.; Vethaak, A.D.; Van der Puyl, P. Metabolism, food consumption and growth of plaice (Pleuronectes platessa) and flounder (Platichthys flesus) in relation to fish size and temperature. Neth. J. Sea Res. 1992, 29, 127–143. [Google Scholar] [CrossRef]
  80. Koch, F.; Wieser, W.; Niederstätter, H. Interactive effects of season and temperature on enzyme activities, tissue and whole animal respiration in roach, Rutilus rutilus. Environ. Biol. Fishes 1992, 33, 73–85. [Google Scholar] [CrossRef]
  81. Hölker, F. The metabolic rate of roach in relation to body size and temperature. J. Fish Biol. 2003, 62, 565–579. [Google Scholar] [CrossRef]
  82. Mel’nichuk, G.L. Metabolic rate in young commercial fishes of Kremenchug reservoir. Hydrobiol. J. 1969, 5, 41–45. [Google Scholar]
  83. Wells, P.; Pinder, A. The respiratory development of Atlantic salmon. I. Morphometry of gills, yolk sac and body surface. J. Exp. Biol. 1996, 199, 2725–2736. [Google Scholar] [CrossRef] [PubMed]
  84. Bihun, C.J.; Murphy, M.K.; Johnson, T.B.; Fisk, A.T.; Guzzo, M.M.; Madenjian, C.P.; Raby, G.D. Effects of temperature, body size, and sex on the standard metabolic rates of a sexually dimorphic freshwater piscivore, walleye (Sander vitreus). Can. J. Fish. Aquat. Sci. 2024, 81, 879–886. [Google Scholar] [CrossRef]
  85. Hughes, G.M. On the respiration of Torpedo marmorata. J. Exp. Biol. 1978, 73, 85–105. [Google Scholar] [CrossRef]
  86. Hughes, G.M. The dimensions of fish gills in relation to their function. J. Exp. Biol. 1966, 45, 177–195. [Google Scholar] [CrossRef]
  87. Herrmann, J.P.; Enders, E. Effect of body size on the standard metabolism of horse mackerel. J. Fish Biol. 2000, 57, 746–760. [Google Scholar] [CrossRef]
  88. Fonds, M.; Jaworski, A.; Iedema, A.; Puyl, P.V.D. Metabolism, Food Consumption, Growth, and Food Conversion of Shorthorn Sculpin (Myoxocephalus scorpius) and Eelpout (Zoarces viviparus). International Council for the Exploration of the Seas, Copenhagen, I.C.E.S. Demersal Fish Committee, C.M. 1989, 31, 19 p. Available online: https://www.ices.dk/sites/pub/CM%20Doccuments/1989/G/1989_G31.pdf (accessed on 5 January 2025).
  89. Dekking, M.; Kraaikamp, C.; Lopuhaä, H.P.; Meester, L.E. A Modern Introduction to Probability and Statistics: Understanding Why and How; Springer: London, UK, 2005. [Google Scholar]
  90. Clark, T.D.; Brandt, W.T.; Nogueira, J.; Rodriguez, L.E.; Price, M.; Farwell, C.J.; Block, B.A. Postprandial metabolism of Pacific bluefin tuna (Thunnus orientalis). J. Exp. Biol. 2010, 213, 2379–2385. [Google Scholar] [CrossRef]
  91. Clark, T.D.; Farwell, C.J.; Rodriguez, L.E.; Brandt, W.T.; Block, B.A. Heart rate responses to temperature in free-swimming Pacific bluefin tuna (Thunnus orientalis). J. Exp. Biol. 2013, 216, 3208–3214. [Google Scholar] [CrossRef]
  92. Jerde, C.L.; Kraskura, K.; Eliason, E.J.; Csik, S.R.; Stier, A.C.; Taper, M.L. Strong evidence for an intraspecific metabolic scaling coefficient near 0.89 in fish. Front. Physiol. 2019, 10, 1166. [Google Scholar] [CrossRef]
  93. Niimi, A.J.; Morgan, S.L. Morphometric examination of the gills of walleye, Stizostedion vitreum vitreum (Mitchill) and rainbow trout, Salmo gairdneri Richardson. J. Fish Biol. 1980, 16, 685–692. [Google Scholar] [CrossRef]
  94. Morgan, M. Fill Development, Growth, and Respiration in the Trout, Salmo gairdneri (Richardson). Ph.D. Thesis, Bristol University, Bristol, UK, 1971. [Google Scholar]
  95. Teletchea, F.; Pauly, D. Why do fish larvae hatch when they do? Environ. Biol. Fishes 2024, 107, 583–591. [Google Scholar] [CrossRef]
  96. Hughes, G.M. A comparative approach to fish respiration. Experientia 1970, 26, 113–122. [Google Scholar] [CrossRef] [PubMed]
  97. Gehrke, P.C. Cardio-respiratory morphometrics of spangled perch, Leiopotherapon unicolor (Günther, 1859), (Percoidei, Teraponidae). J. Fish Biol. 1987, 31, 617–623. [Google Scholar] [CrossRef]
  98. Lefevre, S.; McKenzie, D.J.; Nilsson, G.E. Models projecting the fate of fish populations under climate change need to be based on valid physiological mechanisms. Global Change Biol. 2017, 23, 3449–3459. [Google Scholar] [CrossRef]
  99. Allen, G.R. Freshwater Fishes of Australia; T.F.H. Publications: Neptune City, NJ, USA, 1989. [Google Scholar]
  100. Sternberg, D.; Cockayne, B. Length–length and length–weight relationships of fish species from the Lake Eyre Basin, Australia. J. Appl. Ichthyol. 2015, 31, 1168–1170. [Google Scholar] [CrossRef]
  101. Singh, O.N.; Munshi, J.S.D. Oxygen uptake in relation to body weight, respiratory surface area and group size in a freshwater goby, Glossogobiu giuris (Ham.). Proc. Indian Natl. Sci. Acad. 1985, B51, 33–40. [Google Scholar]
  102. Prasad, M.S. Oxygen uptake during early life in the freshwater fish, Esomus danricus (Ham) (Pisces, Cypriniformes). Acta Physiol. Hung. 1984, 67, 367–376. [Google Scholar]
  103. Kobayashi, H.; Murata, O.; Harada, T. Some aspects of gill measurements in relation to growth of the yellowtail Seriola quinqueradiata. Nippon Suisan Gakkaishi 1988, 54, 49–54. [Google Scholar] [CrossRef]
  104. Mallatt, J. Fish gill structural changes induced by toxicants and other irritants: A statistical review. Can. J. Fish. Aquat. Sci. 1985, 42, 630–648. [Google Scholar] [CrossRef]
  105. Cumming, H.; Herbert, N.A. Gill structural change in response to turbidity has no effect on the oxygen uptake of a juvenile sparid fish. Conserv. Physiol. 2016, 4, cow033. [Google Scholar] [CrossRef]
  106. Greco, A.M.; Fenwick, J.C.; Perry, S.F. The effects of soft-water acclimation on gill structure in the rainbow trout Oncorhynchus mykiss. Cell Tissue Res. 1996, 285, 75–82. [Google Scholar] [CrossRef] [PubMed]
  107. Waser, W.; Bausheva, O.; Nikinmaa, N. The copper-induced reduction of critical swimming speed in rainbow trout (Oncorhynchus mykiss) is not caused by changes in gill structure. Aquat. Toxicol. 2009, 94, 77–79. [Google Scholar] [CrossRef] [PubMed]
  108. Wood, C.M.; Eom, J. The osmorespiratory compromise in the fish gill. Comp. Biochem. Physiol. Part A Mol. Integr. Physiol. 2021, 254, 110895. [Google Scholar] [CrossRef] [PubMed]
  109. Mikheev, V.N.; Pasternak, A.F.; Valtonen, E.T.; Taskinen, J. Increased ventilation by fish leads to a higher risk of parasitism. Parasit. Vectors 2014, 7, 281. [Google Scholar] [CrossRef]
  110. McKim, J.M.; Erickson, R.J. Environmental impacts on the physiological mechanisms controlling xenobiotic transfer across fish gills. Physiol. Zool. 1991, 64, 39–67. [Google Scholar] [CrossRef]
  111. Dabrowski, K.R. Energy budget of coregonid (Coregonus spp.) fish growth, metabolism and reproduction. Oikos 1985, 45, 358–364. [Google Scholar] [CrossRef]
  112. Brett, J.R. The relation of size to rate of oxygen consumption and sustained swimming speed of sockeye salmon (Oncorhynchus nerka). J. Fish. Res. Bd. Can. 1965, 22, 1491–1501. [Google Scholar] [CrossRef]
  113. Gilmour, K.M.; Turko, A.J. Effects of structural remodelling on gill physiology. J. Comp. Physiol. B 2024, 194, 595–609. [Google Scholar] [CrossRef]
  114. Priede, I.G. Metabolic scope in fishes. In Fish Energetics: New Perspectives; Tyler, P., Calow, P., Eds.; Croom: London, UK, 1985; pp. 33–64. [Google Scholar]
Figure 1. Illustration of ontogenetic changes in the scaling (OCS) of gill surface area or GSA (i.e., changes in dG) and metabolic rate in fish and crustaceans (i.e., changes in dQ). (A) Development of GSA in Atlantic herring [47]. (B) Development of GSA in plaice [47]. (C) Increase in specific O2 consumption in yellowtail amberjack [48]. (D) Increase in specific O2 consumption with weight in Pacific bluefin tuna [49]. (E) Development of GSA in the thresher shark [26,50,51]. (F) Increase in the specific O2 consumption of miscellaneous crustaceans [52].
Fishes 10 00233 g001
Figure 2. Increase of the water–blood distance (WBD, or diffusion distance) of the gills’ lamellae in six fish species. (A) Nile tilapia [25]; (B) Tench, based on Hughes (1972 [23]); (C): Climbing perch [24]; and (D) three species of thresher sharks [54]. The average rate of WBD increases corresponds to a decrease in GSA scaling of ~0.08 (see text).
Fishes 10 00233 g002
Figure 3. Bivariate plot of the dQ vs. dG in Table 1, documenting the non-occurrence of a correlation between dQ and dG (r = 0.073). However, a regression with the intercept set at zero produces a slope of 0.954 (95% C.I. = 0.886–1.022), i.e., not statistically different from unity.
Fishes 10 00233 g003
Figure 4. Ontogenetic development of the gills of common carp (Cyprinus carpio) [42]. Note the very high value of dG > 7 in the larvae, declining to <0.8 in the adults.
Fishes 10 00233 g004
Table 1. Within-species comparisons of estimates of the exponent in the relationship GSAWdG or QWdQ, where GSA is the gill surface of fish, Q is their metabolic rate (=oxygen consumption), and W is their body weight. SMR = standard metabolic rate and AMR = active metabolic rate.
SpeciesdGdQRemarks and Reference(s)
Anguilla anguilla0.810.83dG: mean of 0.715 [54] and 0.9 [17], based on [55]; dQ: [17] based on [56]
Carassius auratus0.80.85dG: mean of 0.74 (15 °C) and 0.87 (25 °C) [57]; dQ: mean of 0.87 (15 °C) [57] and 0.83 (25 °C) [17]
Catostomus commersoni0.6390.903dG: [21]; dQ: [58] based on [59]
Cirrhinus mrigala0.820.796dG: [22]: dQ: [58] based on [60]
Coryphaena hippurus0.7130.384dG: [61]; dQ: [58] based on [40] (a)
Ctenopharyngodon idella0.8480.823Both: [44], but not accounting for ventilation frequency
Cyprinus carpio0.794 0.825dG: [42]; dQ: mean of 0.85 [62] and 0.8 [57]
Esox lucius0.6510.815dG: [54] based on [63]; dQ: mean of 0.81 [64] and 0.82 [65]
Galaxias maculatus0.880.77Both: [66]; ‘warm normoxia’ and SMR
Gymnocephalus cernua0.7210.735 dG: [54]; dQ: mean of 0.72 [67] and 0.75 [68]
Hypophthalmichthys molitrix0.856 0.782dG: mean of 0.801 [44] and 0.921 [69]; dQ: mean of 0.792 [44] and 0.772 [69]
Hypophthalmichthys nobilis0.8570.829Both: [44]; not accounting for ventilation frequency
Ictalurus nebulosus0.8450.994dG: [21]; dQ: [58] based on [59]
Katsuwonus pelamis0.850.563 dG: [32]; dQ: [58] based on [70] (a)
Micropterus dolomieu0.80.96dG: mean of 0.79 [22] and 0.82 [21]; dQ: [71]
Mystus cavasius0.920.662dG: [22]; dQ: [58] based on [72]
Mylopharyngodon piceus0.8770.854Both: [44], not accounting for ventilation frequency
Oligocottus maculosus0.950.93Both: [73]; dQ: mean of SMR (0.68) and AMR (1.18)
Oncorhynchus mykiss0.9000.789dG: [21]; dQ: [58] based on [74]
Oreochromis niloticus0.670.64 dG: [17] based on [25]; dQ: [17] based on [75,76]
Perca fluviatilis0.6670.863dG: [54]; dQ: [77]
Platichthys flesus0.7620.781dG: mean of 0.7 [78] and 0.824 [54]; dQ: mean of ‘fasting’ (0.739) and ‘well-fed’ (0.831) [79]
Pleuronectes platessa0.850.782dG: [47]; dQ: [58] based on [79]
Rutilus rutilus0.87 0.80dG: mean of 0.85 and 0.90 [22]; dQ: mean of 0.76 [80], 0.87 [81], and 0.72 [82]
Salmo salar0.971.07dG: [17] based on [83]; dQ: mean SMR, 4 different sources
Salvelinus fontinalis0.9690.99 dG: [19]; dQ: mean of 0.943 [19] and 1.036 [58] based on [59]
Sander vitreus1.131.03dG: [22]; dQ: [84]
Tinca tinca0.670.79dG: [21]; dQ: [62]
Thunnus albacares0.8750.573dG [32], but combined w/T. thynnus; dQ: [58] based on [70] (a)
Thunnus thynnus0.9010.66dG: [32]; dQ: [49], with T. thynnus = T. orientalis
Torpedo marmorata0.650.97Both: [17] based on [85]
Trachurus trachurus1.230.89dG: [17] based on [86]; dQ: based on [87]
Zoarces viviparus0.830.8dG: [11]; dQ: [88]
Mean of the 33 species0.8360.810dG: standard deviation = 0.130; dQ: 0.143
(a) The low value of dQ resulted from the methodology used in [40, 70], which involved, as written by the former, that the fish in question “were prevented from swimming with neuromuscular blocking agents and force ventilated. Heart rates were determined simultaneously”.
Disclaimer/Publisher’s Note: The statements, opinions and data contained in all publications are solely those of the individual author(s) and contributor(s) and not of MDPI and/or the editor(s). MDPI and/or the editor(s) disclaim responsibility for any injury to people or property resulting from any ideas, methods, instructions or products referred to in the content.

