Article

Assessing Diadromous Fish Populations in the Lima River, Northwest Iberian Peninsula

1
CESAM-Centre for Environmental and Marine Studies & Department of Biology, University of Aveiro, 3810-193 Aveiro, Portugal
2
Interdisciplinary Centre of Marine and Environmental Research (CIIMAR), University of Porto, Terminal de Cruzeiros de Leixões, Av. General Norton de Matos s/n, 4450-208 Matosinhos, Portugal
3
Aquamuseu do Rio Minho, Parque do Castelinho, 4920-290 Vila Nova de Cerveira, Portugal
*
Author to whom correspondence should be addressed.
Fishes 2025, 10(5), 230; https://doi.org/10.3390/fishes10050230
Submission received: 25 March 2025 / Revised: 6 May 2025 / Accepted: 10 May 2025 / Published: 15 May 2025
(This article belongs to the Section Biology and Ecology)

Abstract

The Lima River in northern Portugal serves as a vital habitat for diadromous fish species, yet it remains one of the least studied aquatic systems in the region. This study investigates the ecology and biology of key diadromous fish populations, including sea lamprey (Petromyzon marinus), shads (Alosa alosa and Alosa fallax), trout (Salmo trutta), and European eel (Anguilla anguilla), during their reproductive migration and riverine periods. A total of 3242 individuals from 15 species were sampled, with native species accounting for 51.1% of the catch. Results revealed significant differences in size and weight of lampreys, with individuals from the Lima River being significantly smaller than those from regional rivers such as the Minho and Mondego. Shad populations showed a high proportion of hybrids (33.8%), suggesting extensive hybridization between A. alosa and A. fallax. Analysis of trout stomach contents revealed a diverse diet dominated by insects (66.9%), crustaceans (6.8%), and fish (6.8%), but also an alarming presence of plastic debris (1.1%), highlighting potential pollution problems. For European eels, this study marks the first record of the invasive swim bladder parasite Anguillicola crassus in the Lima River, with 84.8% of eels sampled showing moderate to severe swim bladder damage. These findings contribute to a deeper understanding of diadromous fish ecology and emphasize the importance of conservation efforts in estuarine systems worldwide.
Key Contribution: This study reveals smaller sea lampreys in Lima River, high shad hybridization (33.8%), the first record of Anguillicola crassus in European eel, and plastic debris in trout stomachs, highlighting ecological impacts of habitat fragmentation and pollution.

1. Introduction

Around the world, numerous studies have documented dramatic changes in the structure and diversity of fish assemblages as a result of human-induced habitat alteration [1,2]. These changes include fragmentation of rivers through damming, with consequent loss of habitat, chemical and organic pollution, destruction of riparian vegetation, sand extraction, introduction of exotic species, and overfishing. Fish represent a significant proportion of the total biomass in aquatic ecosystems. They account for more than half of the total number of species of vertebrates and play a crucial role in enhancing the diversity and functionality of aquatic ecosystems [3]. In addition, their presence has a significant impact on the overall health, wealth, and economies of societies in different geographical regions [4]. However, it is important to note that a significant number of marine and freshwater fish species are currently facing critical population declines. These declines have placed many fish populations at an increasing risk of either local or global extinction [5,6]. The Lima River represents a critical habitat for diadromous fish, serving as a crossroad where their complex life histories unfold. Despite its ecological importance, it is one of the least studied aquatic systems in Portugal for these fish populations due to limited research funding and sparse historical data. This lack of study persists despite its potential as the southern limit of the distribution of salmon. For example, the number of French rivers inhabited by Atlantic salmon (Salmo salar) has declined since the 19th century as a result of the construction of large dams [7]. In fact, since the second half of the 20th century, the species has suffered alarming population declines, not only because of pressure on freshwater ecosystems, but also because of possible ecosystem changes with reduced feeding opportunities, such as what occurred in the North Atlantic in 2005. As a result, production has been reduced, with smaller, slower growing and later maturing salmon making populations in southern Europe more vulnerable [8]. For eel (Anguilla anguilla), a greater influence of anthropogenic pressures correlates with a decrease in abundance [9]. Infection with the nematode Anguillicola crassus significantly impairs the function of the swim bladder as a buoyancy organ, a function optimised in the transition from yellow eel to silver eel, which is essential for oceanic migration for reproduction [10]. In the Minho River, catches of allis shad (Alosa alosa) have decreased since the 1950s, by 90% of the 200 tonnes recorded in the first half of the 20th century [11], with a correlation between the abrupt decrease in catches and the progressive construction of dams in the main course of this river [12].
Understanding the biology and ecology of these species is essential not only for knowing their unique life histories, but also for developing effective conservation and management strategies. In addition, a thorough understanding of the challenges and threats facing diadromous fish populations in the Lima River estuary is paramount. Anthropogenic activities, habitat degradation, climate change, and other stressors pose significant risks to these species [13,14]. Therefore, the development of sustainable management practices is essential to effectively mitigate these impacts [15]. Given the lack of research in this area, this work aims to characterize the ecology and biological aspects of diadromous fish. Studies in the Lima basin concern local adaptation, morphological and physiological differences in sea lamprey ammocoetes [16], the impact of hydroelectric power stations and a weir on the catch of allis shad by professional fishermen [17], the trout as a local recreational fishing resource [18,19], with few stock assessment studies [18,20], focusing on the lift installed at the Touvedo dam [21,22,23].
In this study, we aimed to investigate the biological and ecological parameters of diadromous species from the Lima River, Northwest Portugal, namely, sea lamprey, trout, allis shad, twaite shad, and eel, which still represent an economic resource for the local population. Given the scarcity of scientific information on migratory fish in the Lima basin, and taking into account the specificity of each species at this stage of its life cycle, information on fish biometry, reproductive migration, hybridization, age structure, feeding regime, and prevalence of parasitic nematodes is intended to be a starting point for future, more in-depth studies aimed at supporting better management of this fish community in this river.

2. Materials and Methods

2.1. Study Area

The Lima River system is located in the Green Coast region of northern Portugal, is an international river that rises at an altitude of 950 m on Talariño Mountain in the Sierra S. Mamede, province of Ourense, Galicia, Spain. It flows in a NE–SW direction over a length of 108 km, divided between Spanish (41 km) and Portuguese (67 km) territories, draining into the Atlantic Ocean near the city of Viana do Castelo. The total basin of the Lima River occupies an area of 2480 km2 (1177 km2 in Portugal—47%, and 1303 km2 in Spain—53%) [24].
The Mean annual precipitation varies from 1300 to 4200 mm, exceeding 3000 mm in the upstream regions and falling below 1900 mm in the downstream regions [25].
Floods and river flows are mainly regulated by three large hydroelectric power stations with considerable reservoir capacity: The Presa de Conchas (Spain), and in Portugal, the Alto Lindoso dam about 3 km through Portuguese territory and the Touvedo dam 16.5 km downstream, both in operation since 1992. The average annual discharge of the river is around 64 m3/s [26], although it shows seasonal variations, with averages of 130 m3/s in the winter and 30 m3/s during the summer. However, This can drop to approximately 5 m3/s during the hottest summer months [27,28].
A large part of the Portuguese territory of the Lima River is included in the Natura 2000 network, from the lower estuary to the Touvedo dam, including the rivers Vez (and its tributaries), Vade, and Estorãos, with special emphasis on the Paisagem Protegida das Lagoas de Bertiandos e São Pedro d’Arcos, a wetland protected by the Ramsar Convention. Relevant habitats include alluvial forests with Alnus glutinosa and Fraxinus excelsior, salt marshes, intertidal mudflats, and brackish lagoons, which contribute to bird biodiversity and fish nurseries. Key species such as migratory fish and the European otter are of high conservation value.
The Lima Estuary encompasses an approximate area of 6 km2, with the influence of spring tides extending up to 22 km upstream [29]. Classified as a partially mixed estuarine system, it operates under a semidiurnal and mesotidal tidal regime, characterized by a tidal range of 3.7 m during high tide and 1.1 m during low tide [28,30]. Salinity levels within the estuary exhibit considerable variability, primarily influenced by tidal cycles and river discharge closely associated with the spatial and temporal distribution of precipitation [31]. At high tide in summer, the salinity varies from 35 at the mouth of the river to 0.4 at a point 16 km upstream [32].

2.2. Commercial Fishing in the Lima River

Professional fishing in the Lima River is managed through two zones, each under a specific regulatory authority, and with different fishing periods. In both zones, the catch of Alosa spp. has recently been prohibited (Portaria n° 46/2023; Despacho n° 44/DG/2024).
The first zone extends from the river’s mouth to the Lanheses bridge (~14 km) in Viana do Castelo, and is under the jurisdiction of the Direção Geral dos Recursos Naturais, Segurança e Recursos Marítimos (DGRM), which supervises fishing activities, issues licences, and enforces regulations (Figure 1). Fishing in this area is permitted from January to April (Portaria n° 370/2024/1).
The second zone, managed by the Institute of Nature and Forest Conservation (ICNF), covers the area from the Lanheses bridge to the Touvedo dam (~33 km), located in Touvedo (São Lourenço and Salvador), Ponte da Barca. This section of the river, which is mainly freshwater, allows fishing activities from January to April between the Lanheses bridge and the A3 highway bridge (~13 km) (ICNF area I), and from March to May between the A3 highway bridge and the Touvedo dam (~20 km) (ICNF area II) (Figure 1).The ICNF’s role includes regulating fishing activities and implementing conservation strategies to protect the river’s biodiversity (Portaria n° 929/99).
Like most river systems, the Lima River is fragmented, with two dams in Portugal and one in Spain, and several fishing weirs known as pesqueiras, in the upper reaches of the river in Portugal. Pesqueiras are permanent stone structures built on the bed or banks of a watercourse, for the installation of professional fishing equipment. The operation of a pesqueiras is based on the natural behavior of fish, generally placed along the watercourse, they create obstacles for the fish, mainly to direct and/or facilitate their capture while they are migrating.
Historically, these structures have been essential for the efficient capture of fish for both subsistence and commercial purposes. However, sustainable management is essential to mitigate their potential negative impacts on aquatic ecosystems and fish populations. Many regions now enforce strict regulations to ensure their responsible use, helping to conserve aquatic resources. In the upper Lima River, 71 pesqueiras are officially documented, with additional unofficial structures, mainly due to bureaucratic obstacles that have led to the decline of these traditional methods. Nevertheless, a small number of fishermen continue to use these techniques.
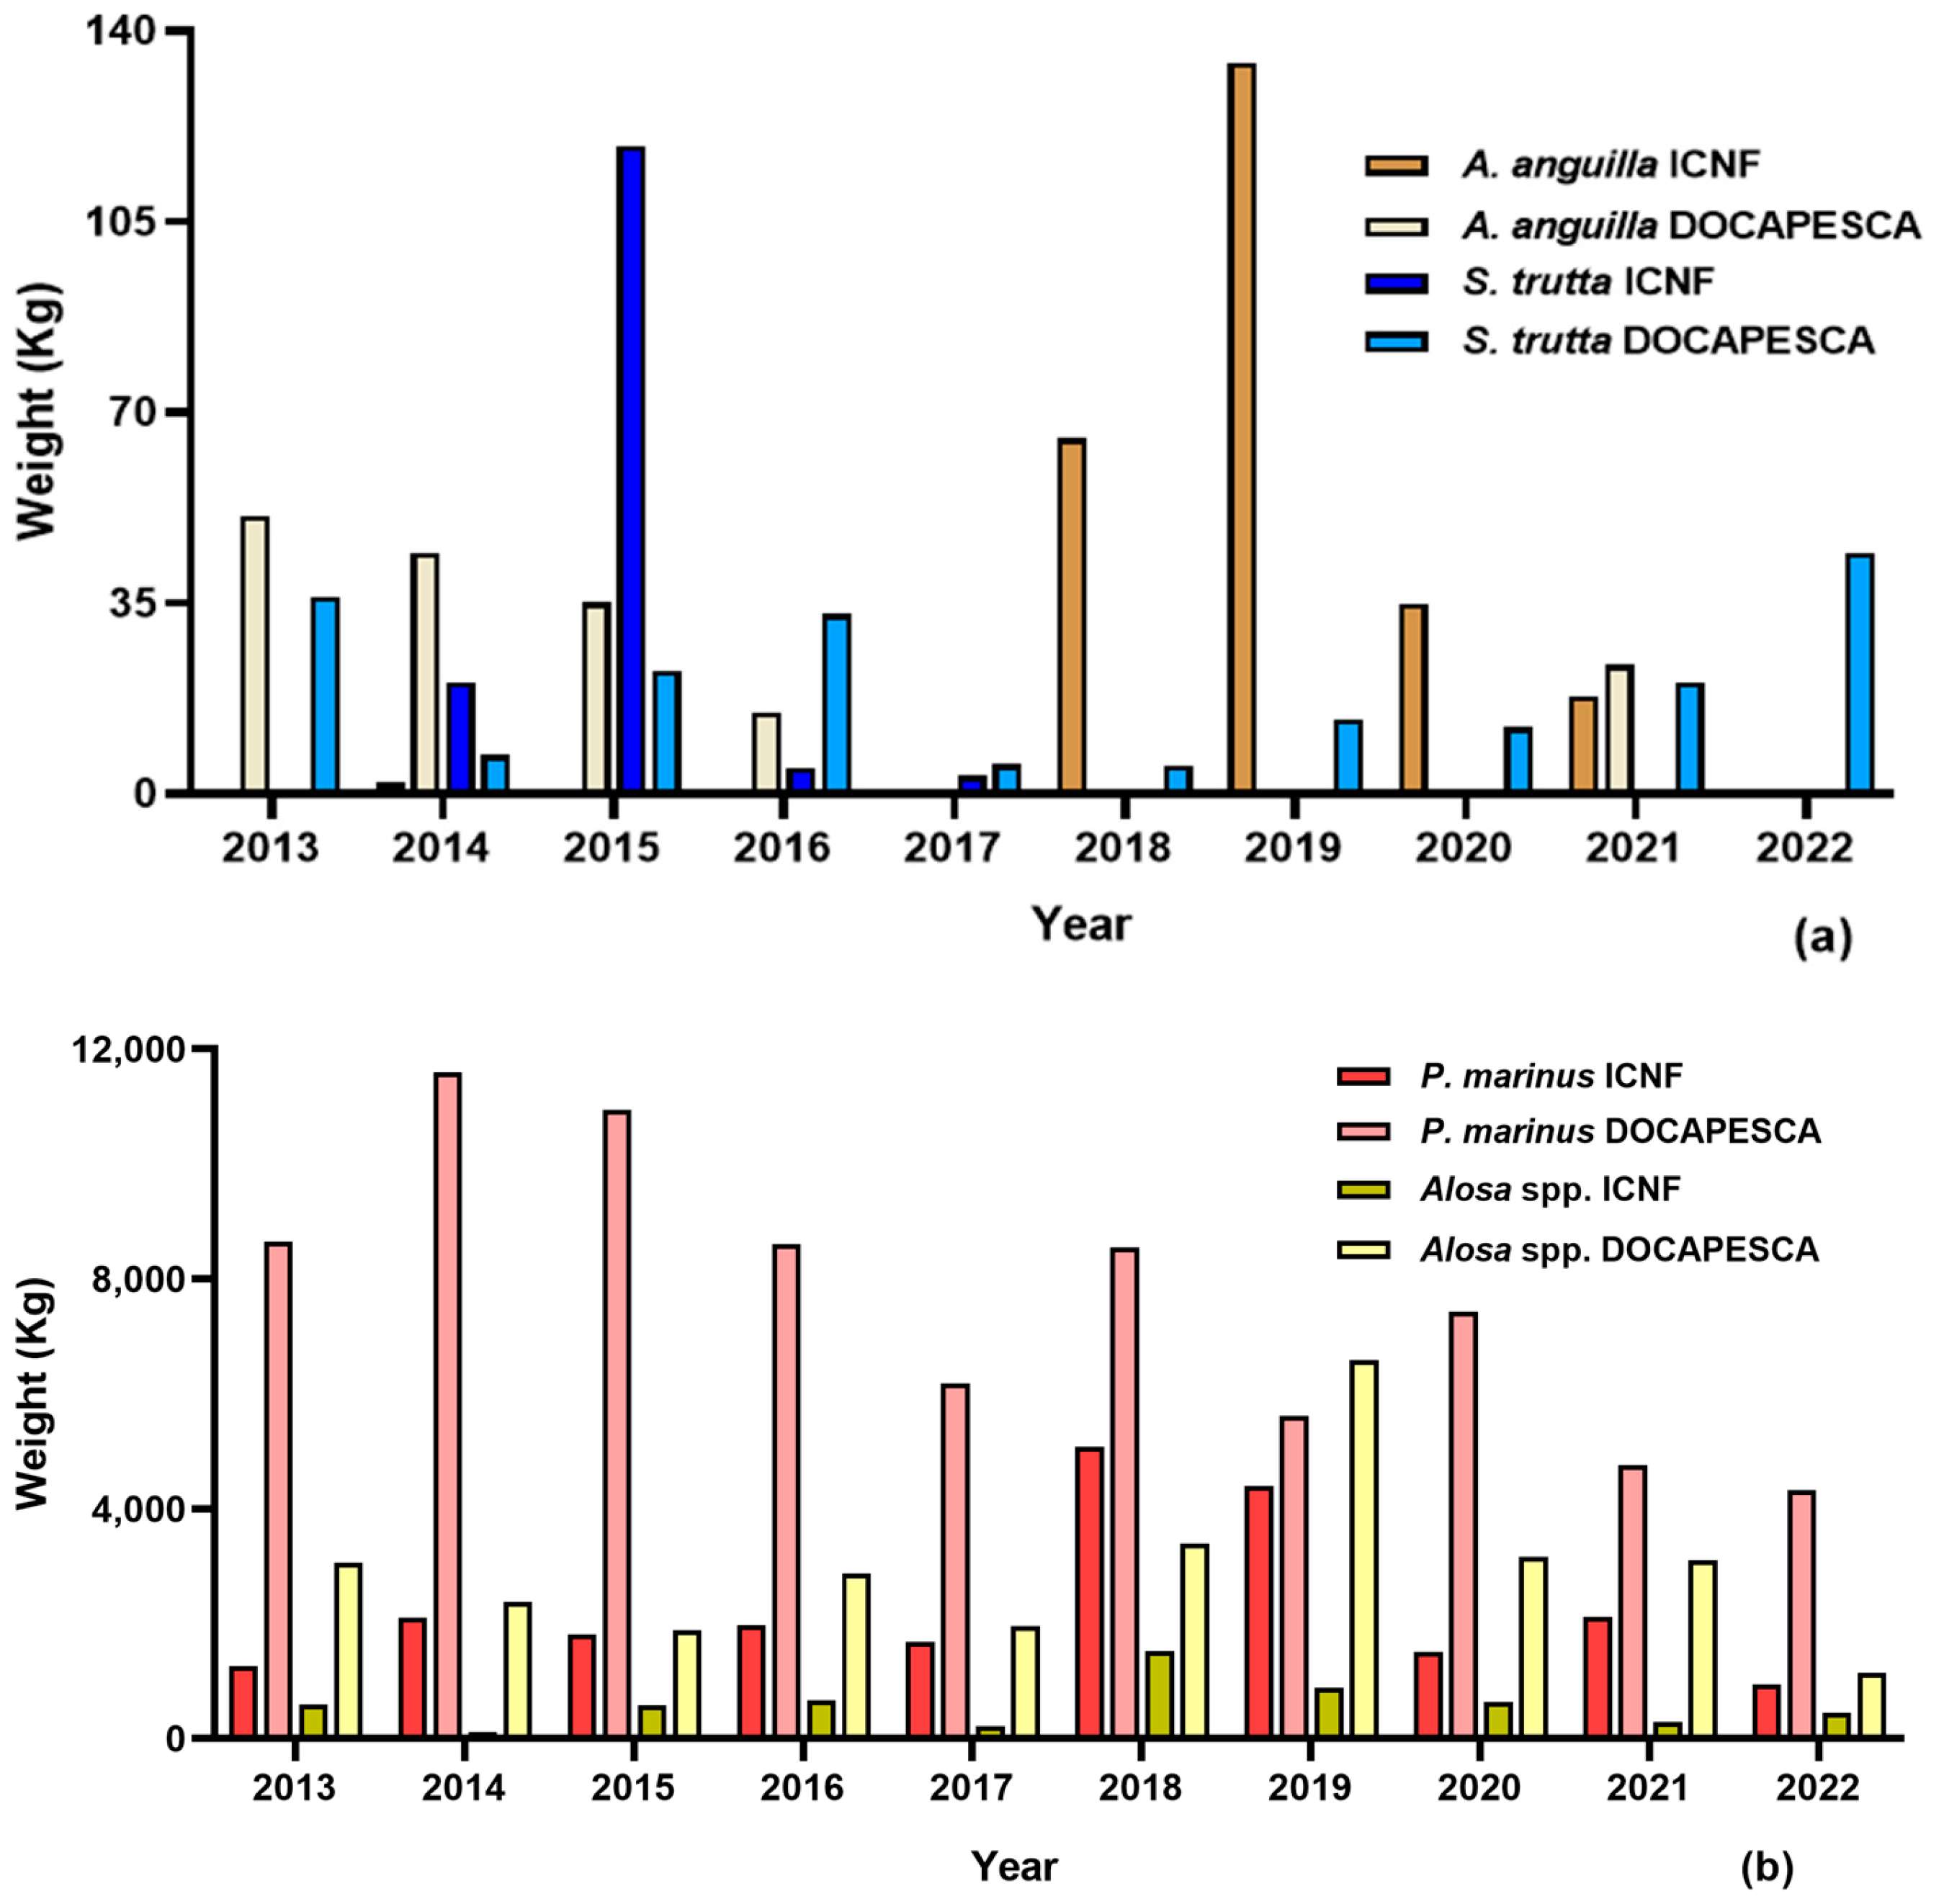
Professional fishing data for both areas are presented in Figure 2, as catches in DGRM zone are represented by DOCAPESCA data. The capture of European eel in DOCAPESCA areas is generally higher compared to ICNF areas, especially in the early years. In contrast, trout captures show variability, with peaks in the ICNF area in 2015 (Figure 2a). Sea lamprey is the most commonly captured species, particularly in the DOCAPESCA area, with consistent capture volumes throughout the analyzed period. The clupeids Alosa spp. show lower, yet still significant catches, capture volumes, with trends between fishing areas (Figure 2b).
Shads and lamprey are the most commercially important species in the Lima River. In the ICNF area, lamprey catches peaked in 2018, with 4782 specimens caught, totaling 5082 kg, representing a considerable increase compared to previous and subsequent years. This increase may indicate a natural cycle of abundance of this species or a temporary change in the fishing strategy of local fishermen. However, in 2022, there was a sharp drop to 1957 specimens and 949.2 kg, suggesting a possible decrease in the population or a change in catch prioritization. DOCAPESCA area stood out as the most profitable species over the period analyzed. In 2013, 8653.3 kg were sold, generating revenue of EUR 101,138.52, at an average price of 11.69 EUR/kg. There was a substantial increase in the average price over the years, reaching 28.37 EUR/kg in 2022, when 4324.0 kg was sold, generating revenue of EUR 122,679.00.
Shads in the ICNF area also showed a catche peak in 2018, with 542 individuals weighing 1522.3 kg. In 2022, the total catch fell to 117 individuals and 450.5 kg, representing a significant reduction from the mid-decade peak. DOCAPESCA shads showed a more moderate variation in both quantities sold and average prices. In 2013, 3061.0 kg was sold, generating EUR 11,562.23 in revenue, with an average price of 3.78 EUR/kg. In 2019, there was a peak in catches, with 6596.9 kg sold and revenue of EUR 17,697.28, although the average price was 2.68 EUR/kg. In 2022, sales decreased to 1144.1 kg, with revenue of EUR 3048.19 and an average price of 2.66 EUR/kg.

2.3. Field Sampling and Laboratory Procedures

Sampling with fyke and fixed trammel nets took place from October to November 2022 and February to the end of May 2023, with additional fixed trammel nets sampling during end of June and middle of July in upper river zones for Alosa spp. catch. Due to a lack of data, data on S. trutta was provided by a professional fisherman for both 2021 and 2022. Sampling was conducted at thirteen primary sites along the Lima River, with 1–5 samples collected per site each month, though exact numbers varied due to environmental constraints, specifically, high river flow and periods of intense rainfall. Sampling depths ranged from 1.5 to 8.0 m, depending on riverbed topography and flow conditions, but specific depths per site were not consistently recorded.
Fyke nets (7 m long, 10 mm mesh) were used with 1–4 nets per sampling event, remaining in the water for 1–6 days. Fixed trammel nets (60 m long, 2.5 m height, 70 mm mesh) were deployed 2–8 times per month, with 1–2 nets per sample, submerged for approximately 12 h (Figure 1). Fyke nets are effective for capturing fish in shallow, vegetated areas, and allow live capture for biometric measurements, but are limited in catching large pelagic fish. Fixed trammel nets are versatile for deeper waters and target a broader range of fish sizes, yet they may entangle non-target species and cause higher mortality. The number of nets and fishing time were determined based on environmental conditions, such as high river flow (assessed visually), depth, and intense rainfall. These conditions, particularly heavy rainfall, led to the suspension of sampling from December 2022 to January 2023 due to unsafe conditions and high turbidity. Decisions were made in consultation with six assisting professional fishermen, prioritizing safety and catch efficiency.
After capture, all specimens were subjected to laboratory procedures to collect biometric data. The exemplars of the species targeted for this study died with an anesthetic overdose. Parameters measured included fork length (FL, expressed in centimeters, ±0.1 cm), total length (TL, expressed in centimeters, ±0.1 cm), and total weight (TW, expressed in grams, ±0.01 g), using a digital A&D EK-610i scale (A&D Company. Limited, Tokyo, Japan). Subsequently, biological samples were collected in all of the studied species, weighing organs as stomach, liver, and gonads, as well as sex identification (classifying specimens as male, female, or undifferentiated).
Electric fishing was used in tributaries to assess diadromous species, employing Hans Grassl (EL62II GI) equipment (Hans Grassl GmbH, Schonau am Konigssee, Germany). Fish were captured using a hand net in a zigzag pattern along the watercourse. Electric fishing complements net-based methods by accessing shallow, rocky, or vegetated areas inaccessible to nets, providing data on juvenile and smaller fish populations that nets may miss due to mesh size or habitat preferences. It also allows non-lethal sampling, enabling release after measurement. However, it is less effective in deeper waters and may under-represent larger, mobile species. Specimens caught by electric fishing were measured (FL and TL) to the nearest 0.1 cm (on a measuring board) and TW determined to the nearest 5 g (digital Kern HDB scale, Kern & Sohn GmbH, Balingen-Frommern, Germany).
All sampling techniques were carried out under Institute of Nature and Forest Conservation authorization (LICENÇA No. 115/2023/CAPT; CREDENCIAL PESCA No. 13/2023; LICENÇA No. 112/2023/CAPT CREDENCIAL PESCA No. 12/2023).

2.4. Data Analysis

To analyze the catch data from the fyke and trammel nets, the average values of CPUE (catch per unit effort) were calculated using the following equation [33].
CPUE = Number fish/Number of nets/Number of days
For fyke nets, one day represents 24 h in the water, while in trammel net calculations, one day represents 12 h in the water. The relationship between weight and length was assessed using Equation (2) [34], where W represents the weight, L is the length, a is a constant, and b is the allometric coefficient.
W = a × Lb
The significance of the allometric coefficient (b) was assessed using Equation (3) [35], where SD Log TL is the standard deviation of the Log TL values and SD Log W is the standard deviation of the Log W values; R2 is the coefficient of determination that is estimated when the logarithmic Equation (2) is fitted to the data; n is the number of fish used in computation
t′ = (SD Log TL/SD Log W) × [|b − 3|/(√(1 − R2)] × √(n − 2)
The calculated t′ value was compared to the critical t-value for n − 2 degrees of freedom. If t′ < t, the null hypothesis (b = 3) was accepted, indicating isometric growth. Conversely, if t′ > t, the null hypothesis was rejected, and b ≠ 3, indicating significant deviations from isometric growth [35].
The Fulton Condition Factor (K) was calculated to assess the health status of the fish, using Equation (4) [36], where W is the weight (g), and L is the length (cm).
K = (W/L3) × 100
To further understand the physiological state, hepatosomatic (HSI) and gonadosomatic indices (GSI) were calculated. The HSI was determined by expressing the liver weight as a percentage of the total body weight [37], while the GSI represented the gonad weight as a percentage of the total body weight [38].
Species-specific analyses were conducted to gather detailed information about growth and age determination. For Alosa spp., to identify taxa and to establish the extent of hybridisation between allis and twaite shad, the first gill arch was removed and the gill rakers were counted under a binocular microscope (Nikon SMZ800, Nikon Instruments Inc., New York, NY, USA), i.e., less then 61 rakers: A. fallax, from 61 to 115: hybrids, and more than 115: A. alosa [39]. Age estimation was performed through scale readings [40], while otoliths were used for S. trutta [41] and A. anguilla [42]; back-calculation of fish growth was also calculated [43]. To estimate the age of the fish, a sample of otoliths was collected and observed by 2 distinct readers, and age assignment took place only when both readings agreed. These were cleaned with 70% alcohol. To make it easier to read the ages, a magnifying glass (Nikon SMZ800) was used, and the otoliths were photographed. The visibility of the otolith rings was increased with the application of a bleaching agent (ethanol:glycerol (1:1)) [44]. After analysis, the bleach was removed using alcohol and, once dry, the otoliths were stored for future analysis. A subsample (1 cm3) of shads’ ovary was collected and preserved in 70% alcohol for subsequent egg counting and fecundity estimation [45]. Fecundity (F) was determined by directly counting fixed mature oocytes in ovarian subsamples and using Equation (5).
F = total number of oocytes × gonadal weight/gonadal subsample weight
Relative fecundity (FR) was also calculated by Equation (6).
FR = fecundity (F)/total weight of the fish (TW)
In addition, stomach content analysis for S. trutta involved identifying prey items to the lowest taxonomic level, and calculating the frequency of occurrence [FO% − (number of stomachs containing prey item i/total number of non-empty stomachs) × 100], relative abundance [Pi% − (total number of prey item i/total number of individuals of all prey categories) × 100], and vacuity index [Vi% − (number of empty stomachs/total number of stomachs) × 100] [46]. For A. anguilla, age was determined by counting the year 0 band as the first winter after the oceanic migration, marking the beginning of the continental life stage [47]. Ocular indices were calculated using body length, body mass, eye diameter, and pectoral fin length [48]. This index produces six maturation stages: I, MII, and FII–FV, with I denoting resident undifferentiated males and females, MII migrant males, FII resident females, FIII pre-migrant females, and FIV–FV indicating migrant females. Swim bladder condition was also examined to classify infection developmental stages and assess health [48]. The classification is based on three criteria, each one coded by the values 0, 1, and 2 (increasing degradation). Criterion 1: transparency-opacity (0-transparent, 1-intermediate, 2-opaque); criterion 2: presence of pigmentation and exudate in swim bladder lumen (0-no pigmentation nor exudate, 1-pigmentation or exudate, 2-exhibit both pigmentation and exudate); criterion 3: thickness of swim bladder wall (0-less than 1 mm, 1-between 1 mm and 3 mm; 2-more than 3 mm thick wall). The swim bladder degenerative index ranges between 0 and 6 [49]. Sex was determined by macroscopic examination of the gonads: individuals with thin, uniformly lobed gonads were identified as males, while those with broad, folded, curtain-like gonads were identified as females [50].
Statistical treatment of the data using GraphPad Prism 8.0.1 includes tests for normality and homoscedasticity using the Shapiro–Wilk (p < 0.05) and Levene tests (p > 0.05). When the assumptions of normality and equal variances were met, an ANOVA followed by Dunn’s post hoc test for multiple comparisons was employed. In cases where these assumptions were violated, the non-parametric Kruskal–Wallis test was used instead, followed by Dunn’s test for post hoc analysis. For comparisons between two groups, the unpaired t-test or the non-parametric Mann–Whitney test was applied, depending on data normality and variance homogeneity. Statistical significance was set at α = 0.05.
Correlations between variables were assessed using Pearson’s correlation for parametric data or Spearman’s rank correlation for non-parametric data, with a significance level of 5% (α = 0.05).
Furthermore, image analysis software “ImageJ” version 2.3.1 [51] was utilized to measure otolith characteristics, including diameter and growth ring distances.

3. Results

A total of 3242 individuals belonging to 15 different species were caught (Table 1). Of these, 11 species (51.1% of total catches) were native and 4 were exotic species (48.9% of total catches). Among the diadromous species (13.0% of total catches), trout Salmo trutta was the most abundant species (5.2% of total catches), followed by European eel Anguilla anguilla (3.1% of total catches), allis and twaite shad, identified as Alosa spp. (2.5% of total catches), and sea lamprey Petromyzon marinus (2.2% of total catches).
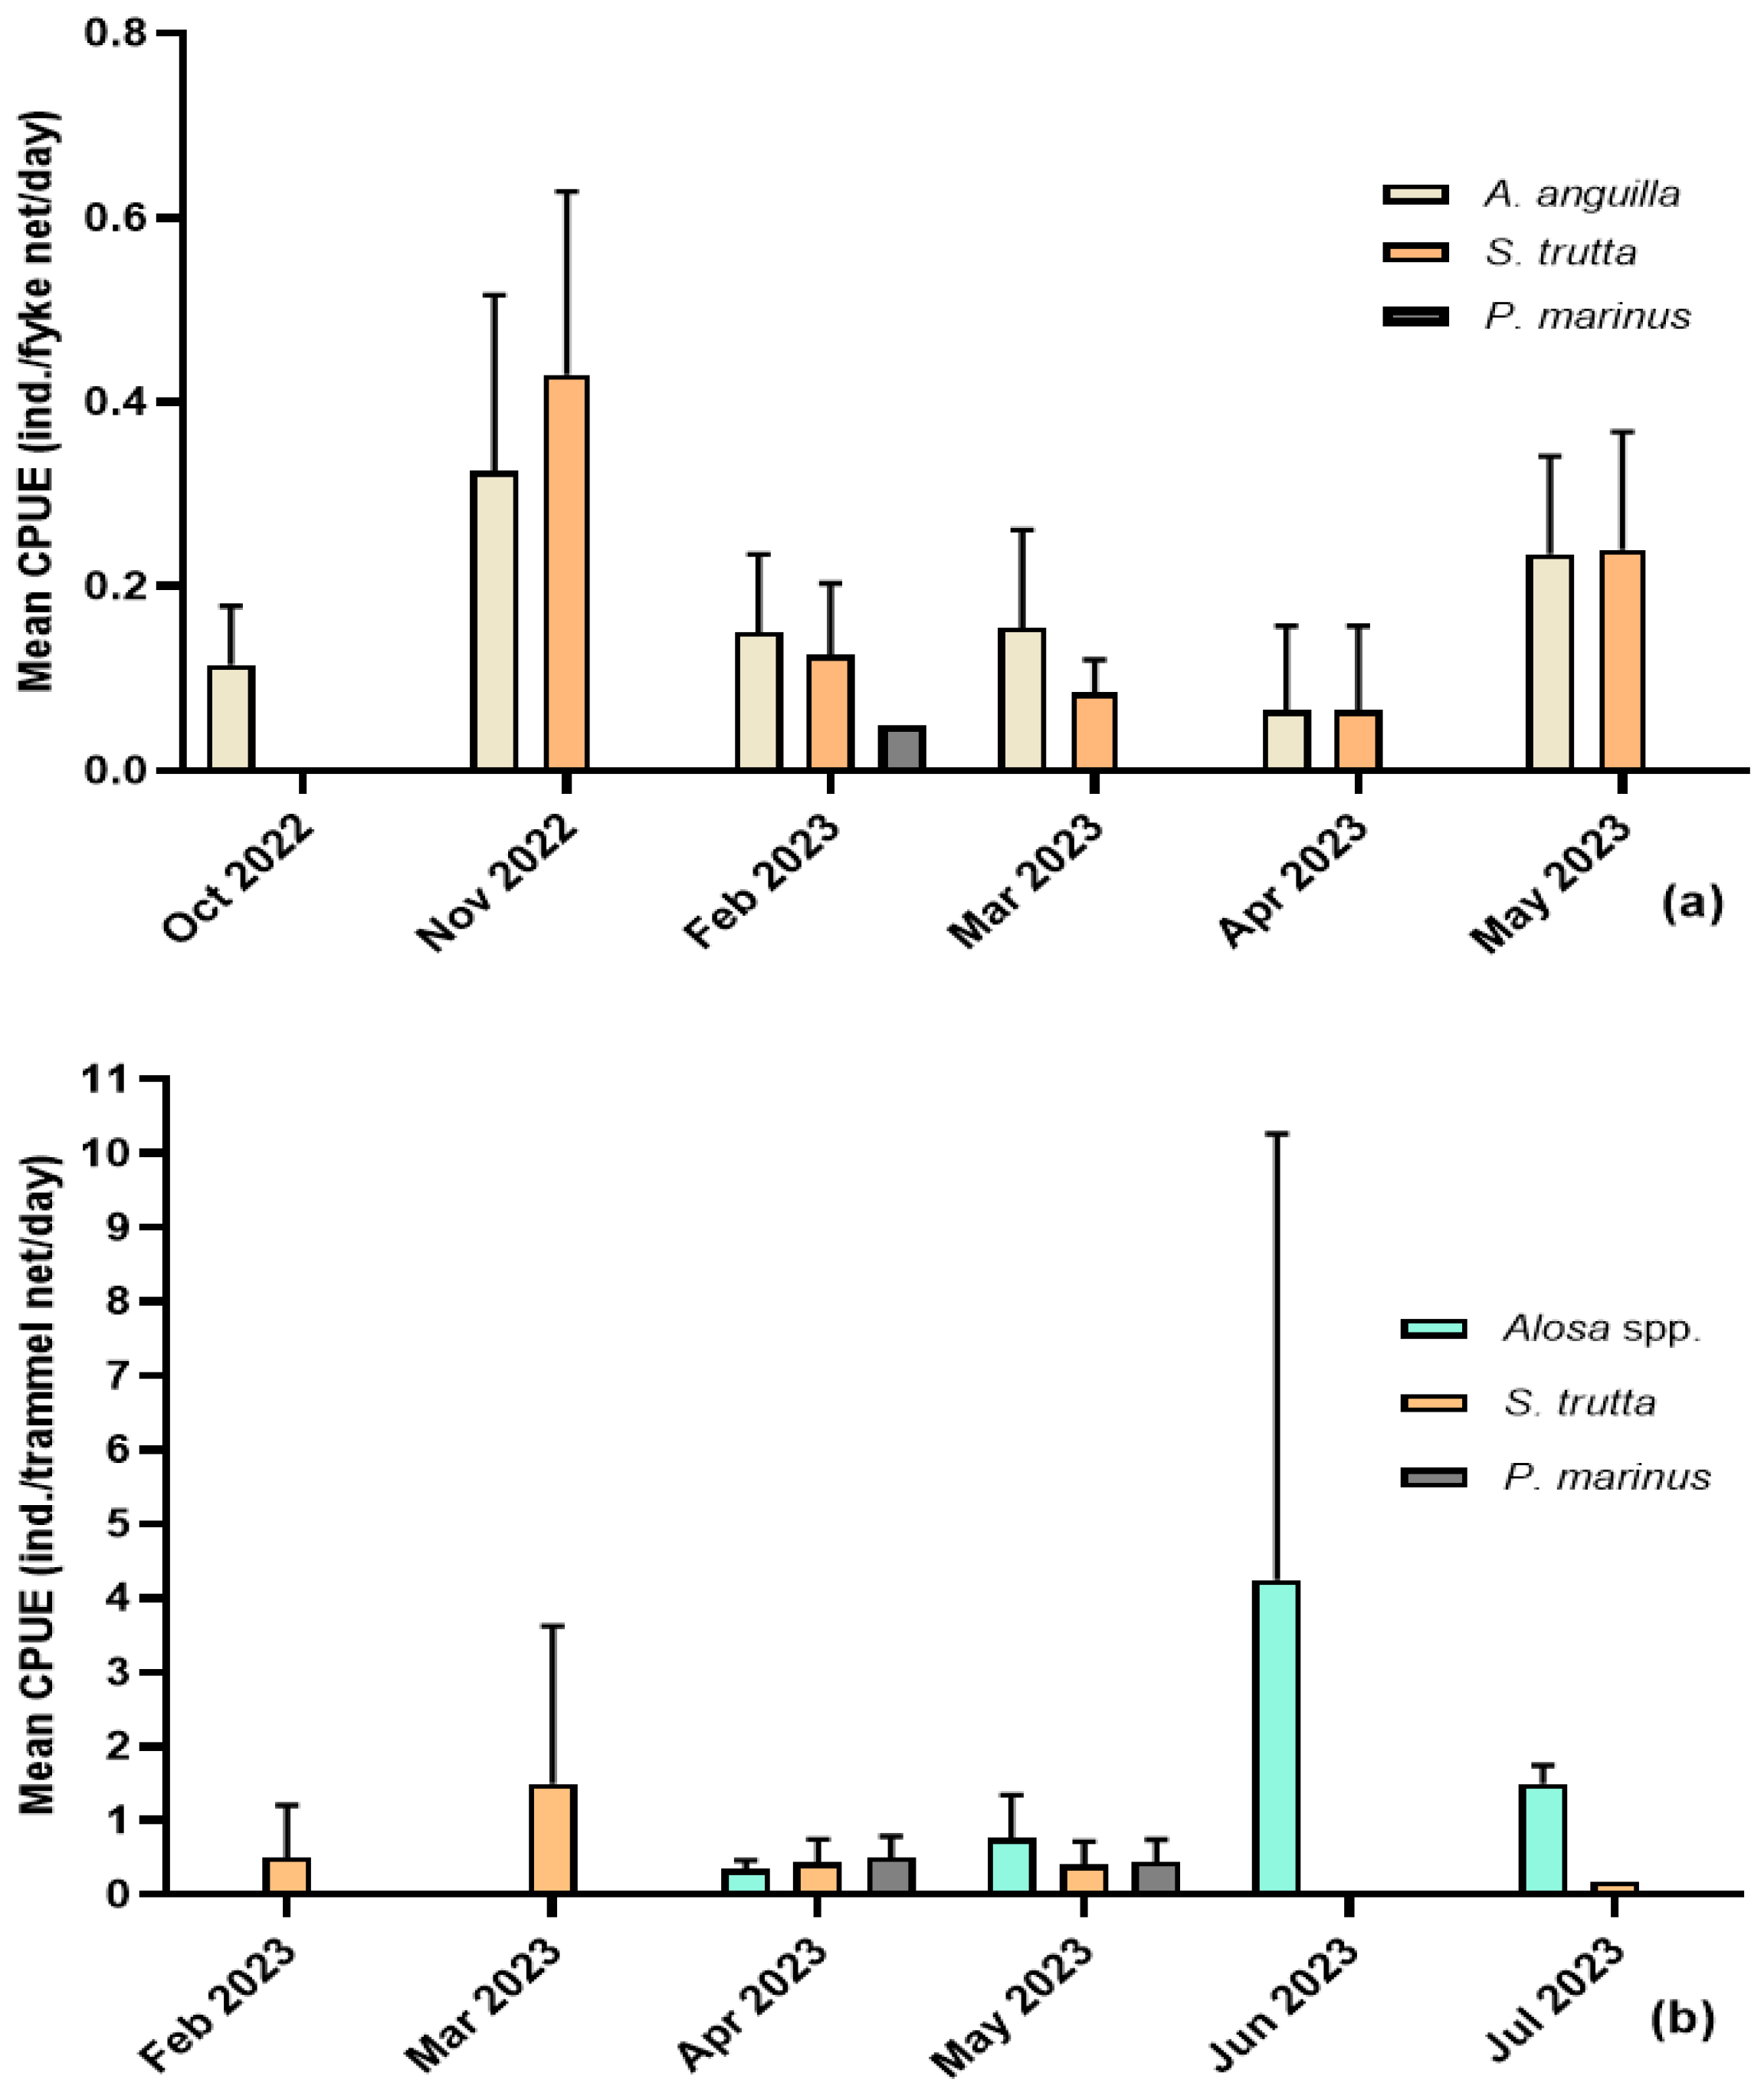
For fyke nets, eel was caught in all of the months analyzed. When catches were registered, a maximum of eight individuals were caught in one sample. The CPUE presented a minimum value of 0.1 and a maximum of 1.75 ind./fyke net/day (Table A1). For S. trutta, catches were lower, with a maximum of seven individuals per sample and a variation in CPUE from 0.8 to 2 ind./fyke net/day (Figure 3a).
In the case of trammel net CPUE, the species Alosa spp. is caught starting in April, and CPUE values were observed ranging from 0.5 to 8.5 ind./trammel net/day, with a maximum of 17 individuals per sample. For P. marinus, samples were taken only in April and May, with a maximum of five individuals per sample, and CPUE ranging from 0.5 and 2.5 ind./trammel net/day. For S. trutta, a maximum of six individuals per sample was observed, with CPUE values ranging from 0.5 to 3 ind./trammel net/day (Figure 3b).

3.1. Sea Lamprey (Petromyzon marinus)

The 59 individuals caught ranged in length from 63.5 cm to 98.6 cm and in weight from 708.0 g to 2350 g, with a weight/length relationship given by the equation W = 2.380 L3.194 (R2 = 0.4164).
The data in Table 2 summarise the mean lengths, weights, and weight/length relationships of sea lampreys in different river zones and sexes. Of the 59 specimens analyzed, sex identification was not possible for 18 individuals because they belonged to fishermen who required the specimens to be kept alive for resale. Consequently, these specimens were included in a general category labelled as “All”.
The estuarine specimens were generally larger, with lengths ranging from 76.7 cm to 98.6 cm, while the upstream specimens ranged from 63.5 cm to 94.0 cm. Males in the estuary ranged from 80.4 cm to 91.0 cm, and females from 83.0 cm to 95.0 cm. Upstream males and females ranged from 65.2 cm to 92.5 cm and 63.5 cm to 94.0 cm, respectively. Significant differences were observed between estuarine and upstream individuals (Mann–Whitney test, p < 0.0001), but no significant differences were found between the sexes (Mann–Whitney test, p = 0.0794).
Weight values followed a similar pattern, with total weights ranging from 708.0 g to 2350.0 g. Estuary weights were generally higher, particularly in females. No significant differences were found (Mann–Whitney test, p > 0.0001).
The weight–length relationship showed negative allometric growth (b < 3) in all groups except the estuary sample, which showed isometric growth (b ≈ 3), indicating proportional weight–length increases in the estuary specimens (Table 2).
Of the 59 individuals captured, it was possible to identify the sex of 41 individuals (69.5%), of which 22 individuals (53.7%) were female and 19 individuals (46.3%) were male.
There was a mean increase in GSI in females in April (13.24 ± 8.491 g) and May (18.34 ± 6.331 g) (mean ± SD), indicating a period of development or maturation of the gonads. In males, no significant variations in GSI values were observed, with the lowest mean in March (1.462 ± 0.7255) and the highest in May (2.199 ± 0.5680) (mean ± SD).
For both sexes, an increase in the HSI was observed from March to May, with a mean low value of 1.754 ± 0.293 and 1.776 ± 0.444 (mean ± SD), and a mean high value of 3.432 ± 0.721 and 2.115 ± 0.846 for males and females, respectively. For males, the medians varied significantly (Dunn’s test, p = 0.0234), and significant changes were observed between the months of March and May (Dunn’s test, p = 0.0276).
Significant differences were observed between the sexes for both indices (Mann–Whitney test; Welch’s t test, p < 0.0001).

3.2. Shads (Allis Shad Alosa alosa; Twaite Shad Alosa fallax)

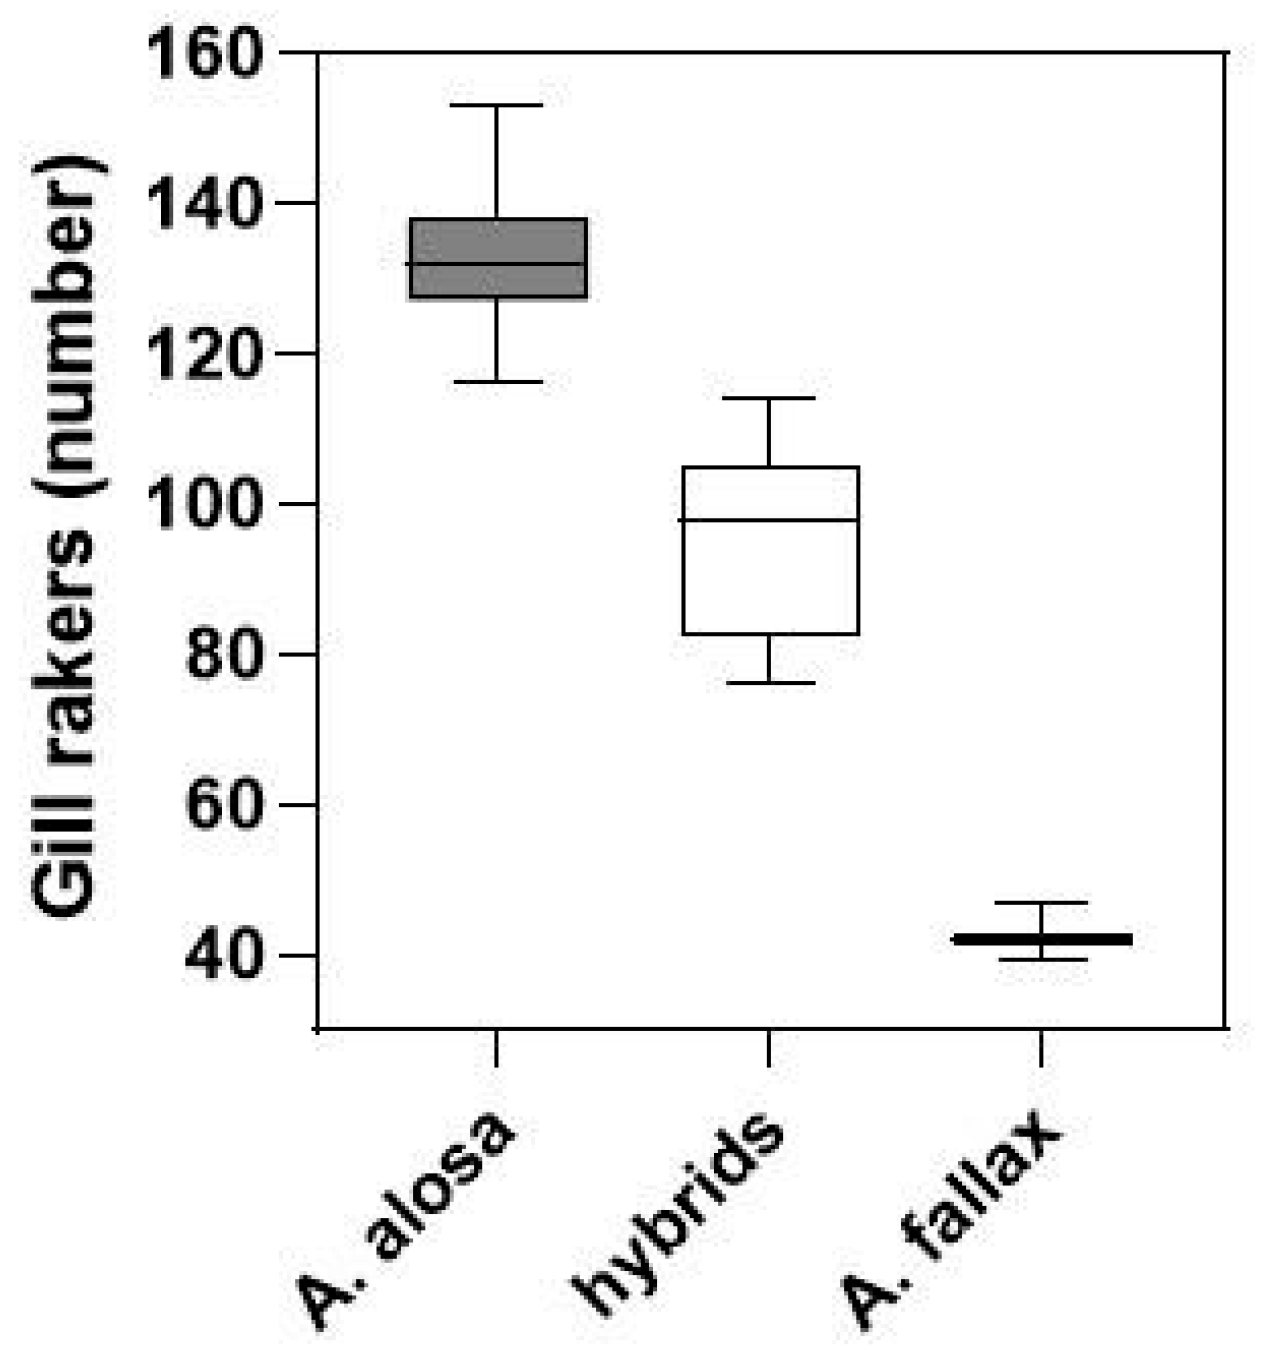
Classification of samples into species according to the number of gill rakers showed that 33.8% of the spawning population were hybrids. For A. alosa (62.5% of the spawning population), the number of gill rakers ranged from 116 to 153 (mean 132.5), for A. fallax (3.75% of the spawning population) from 39 to 47 (mean 42.7), and for hybrids from 76 to 114 (mean 94.8) (Figure 4).
The Fulton condition factor showed similar trends for both sexes in A. alosa and hybrid individuals, with females consistently showing higher values.
For A. alosa, total length (TL) ranged from 47.9 cm in June to 62.7 cm in May for males, and from 54.6 cm to 66.7 cm for females, with both peaks recorded in June. Hybrid males showed a TL range between 44.8 cm and 60.7 cm in May, and females ranged from 49.9 cm in June to 62.6 cm in May (Table 2). Significant differences in TL were found between the sexes (unpaired t-test, p < 0.0001) and between hybrid males and females (Mann–Whitney test, p = 0.0029).
The mean total weight (TW) of A. alosa males ranged from 710.0 g in July to 2433.0 g in May, while females ranged from 1203.0 g in June to 2950.0 g in May. Hybrid males had weight peaks between 562.0 g and 2310.0 g, and females between 902.0 g and 2690.0 g, with peaks occurring in May and June for both sexes (Table 3). Significant differences in TW were observed between the means of A. alosa males (Tukey’s test, p = 0.0013) and between the months of May and July (Tukey’s test, p = 0.0020), as well as between the sexes (unpaired t-test, p < 0.0001). Hybrid males showed significant differences between May and June (Mann–Whitney test, p = 0.0009), and between sexes (Mann–Whitney test, p = 0.0173).
All samples showed positive allometric growth, meaning that weight increased at a faster rate than length, reflecting optimal growth conditions.
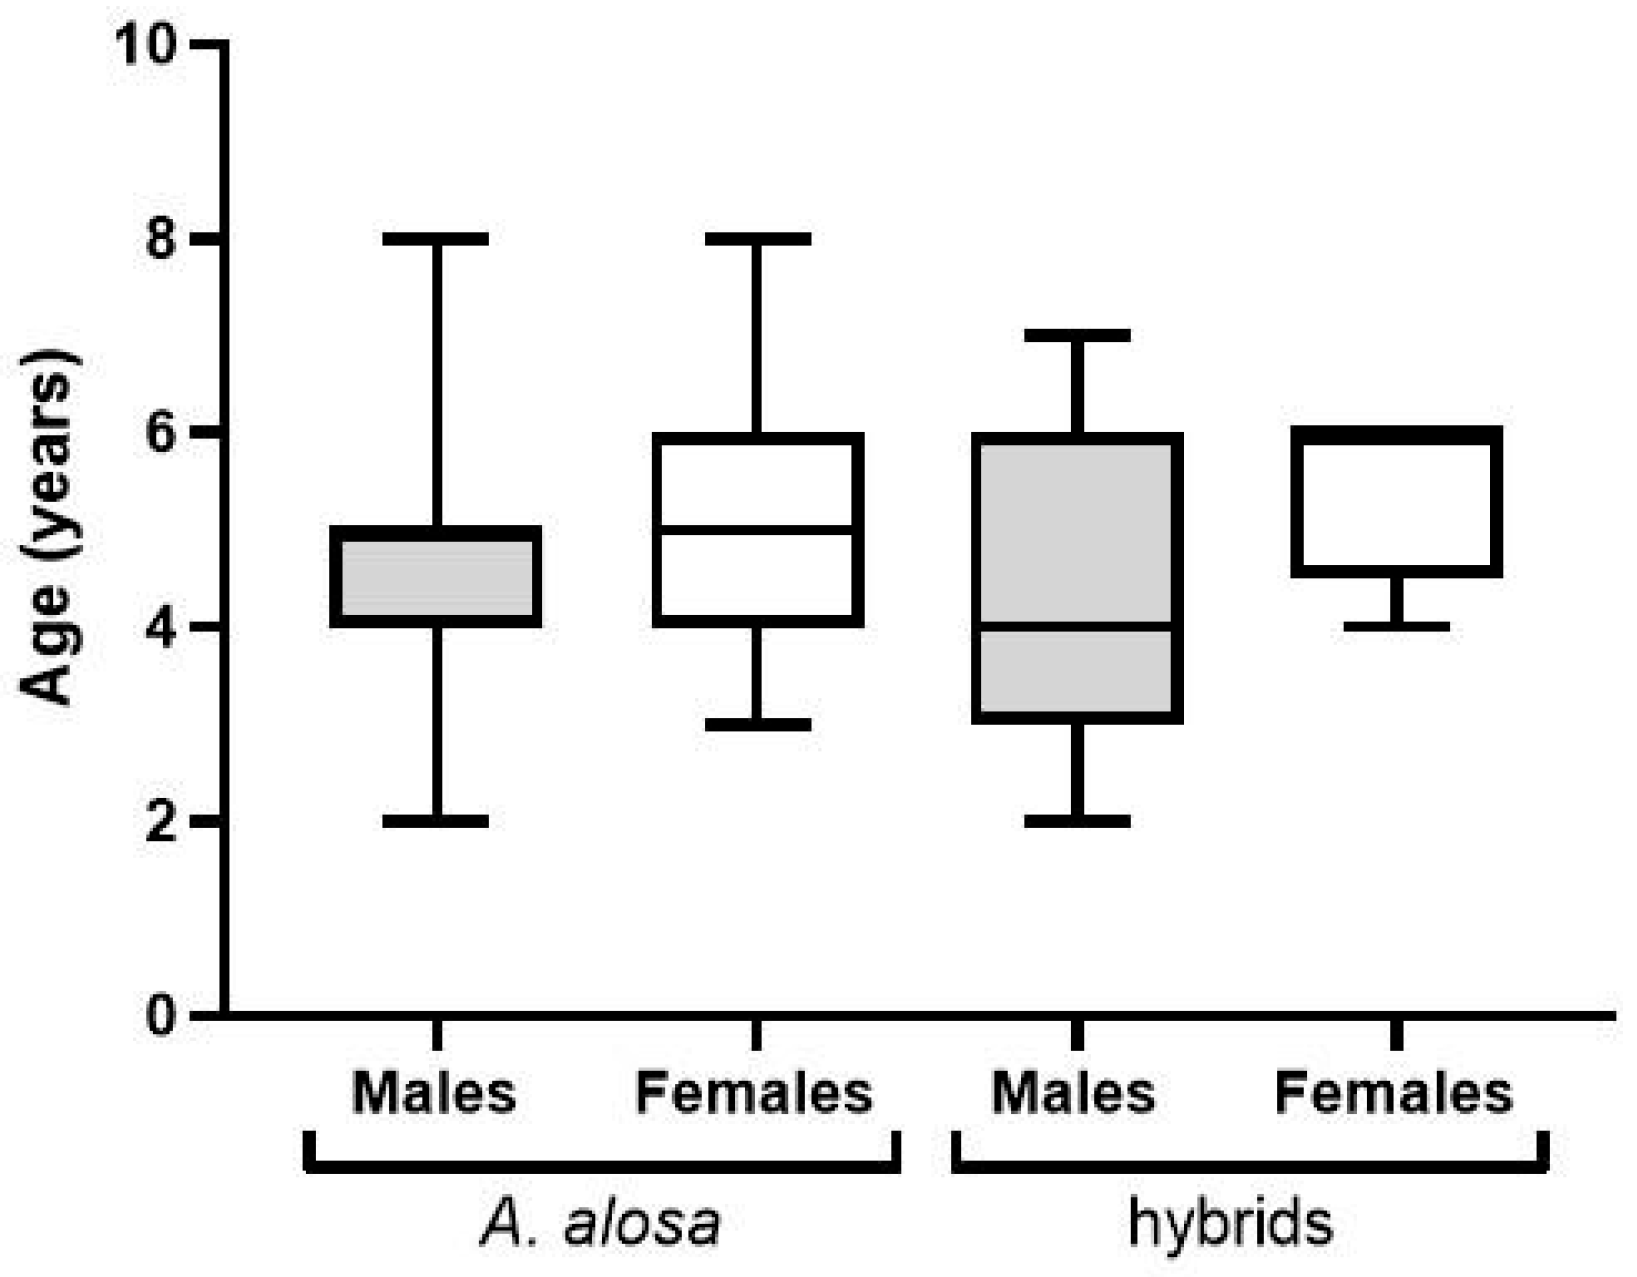
For both A. alosa and hybrid individuals, females had a higher mean age (5.3 and 5.5 years, respectively) than males (4.5 years for both groups) (Figure 5), with no significant differences between individuals of the same sex (Mann–Whitney test, p > 0.05).
For A. alosa, 34 males (66.7%) and 17 females (33.3%) were identified. Hybrids showed more pronounced differences in sex characterization, with 23 males (85.2%) and 4 females (14.8%).
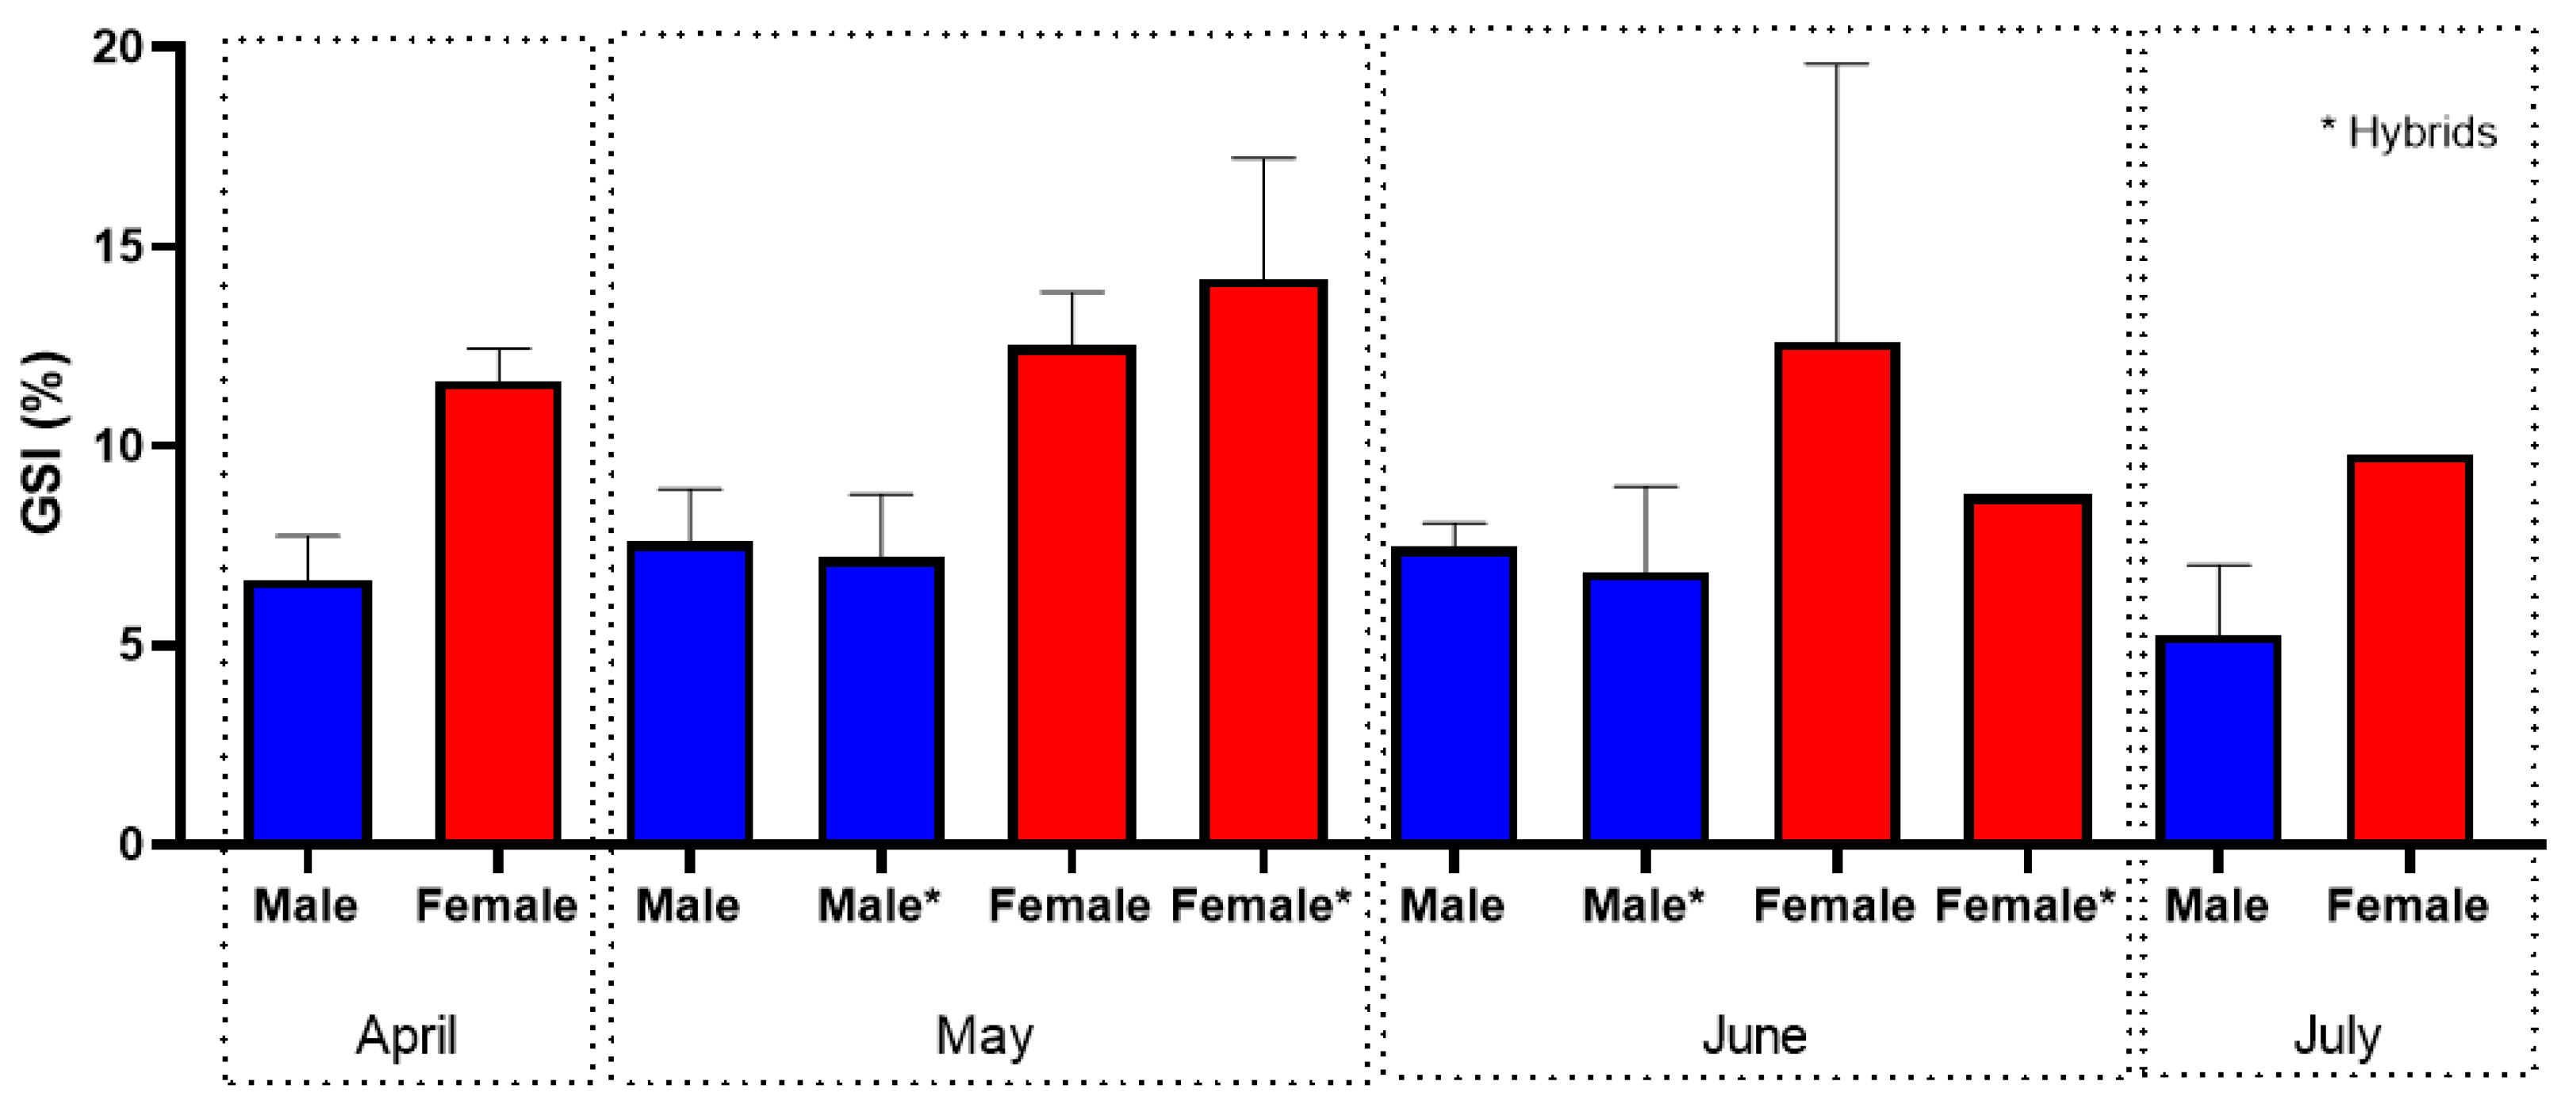
The A. alosa individuals showed similar average GSI values for both sexes during the sampling months (Figure 6). A marked decrease in GSI was observed in June for both sexes, suggesting the end of the reproductive period of the species. For males, the lowest mean GSI was recorded in June (5.28 ± 1.74%), and the highest in May (7.62 ± 1.29%). In contrast, females had the highest mean GSI in June (12.61 ± 6.98%) and the lowest in July (9.80%).
For hybrids, male GSI values remained constant over different sampling months, with a high mean in May (7.20 ± 1.58%) and a low in June (6.84 ± 2.14%) (Figure 6). However, hybrid females showed significant variability, with a high mean GSI of 14.21 ± 3.01% in May and a low mean of 8.80% in June. It is important to note that the sample size for hybrid females was limited, which may affect the observed trends.
Statistical analysis for A. alosa males revealed significant differences in mean GSI values (Tukey’s test, p = 0.0037), especially between May and July (Tukey’s test, p = 0.0020). No significant differences were found for females (Tukey’s test, p = 0.8327). However, when comparing males and females, significant gender differences were found (Mann–Whitney test, p < 0.0001).
In hybrids, significant differences in GSI were observed between the sexes (unpaired t-test, p = 0.0002).
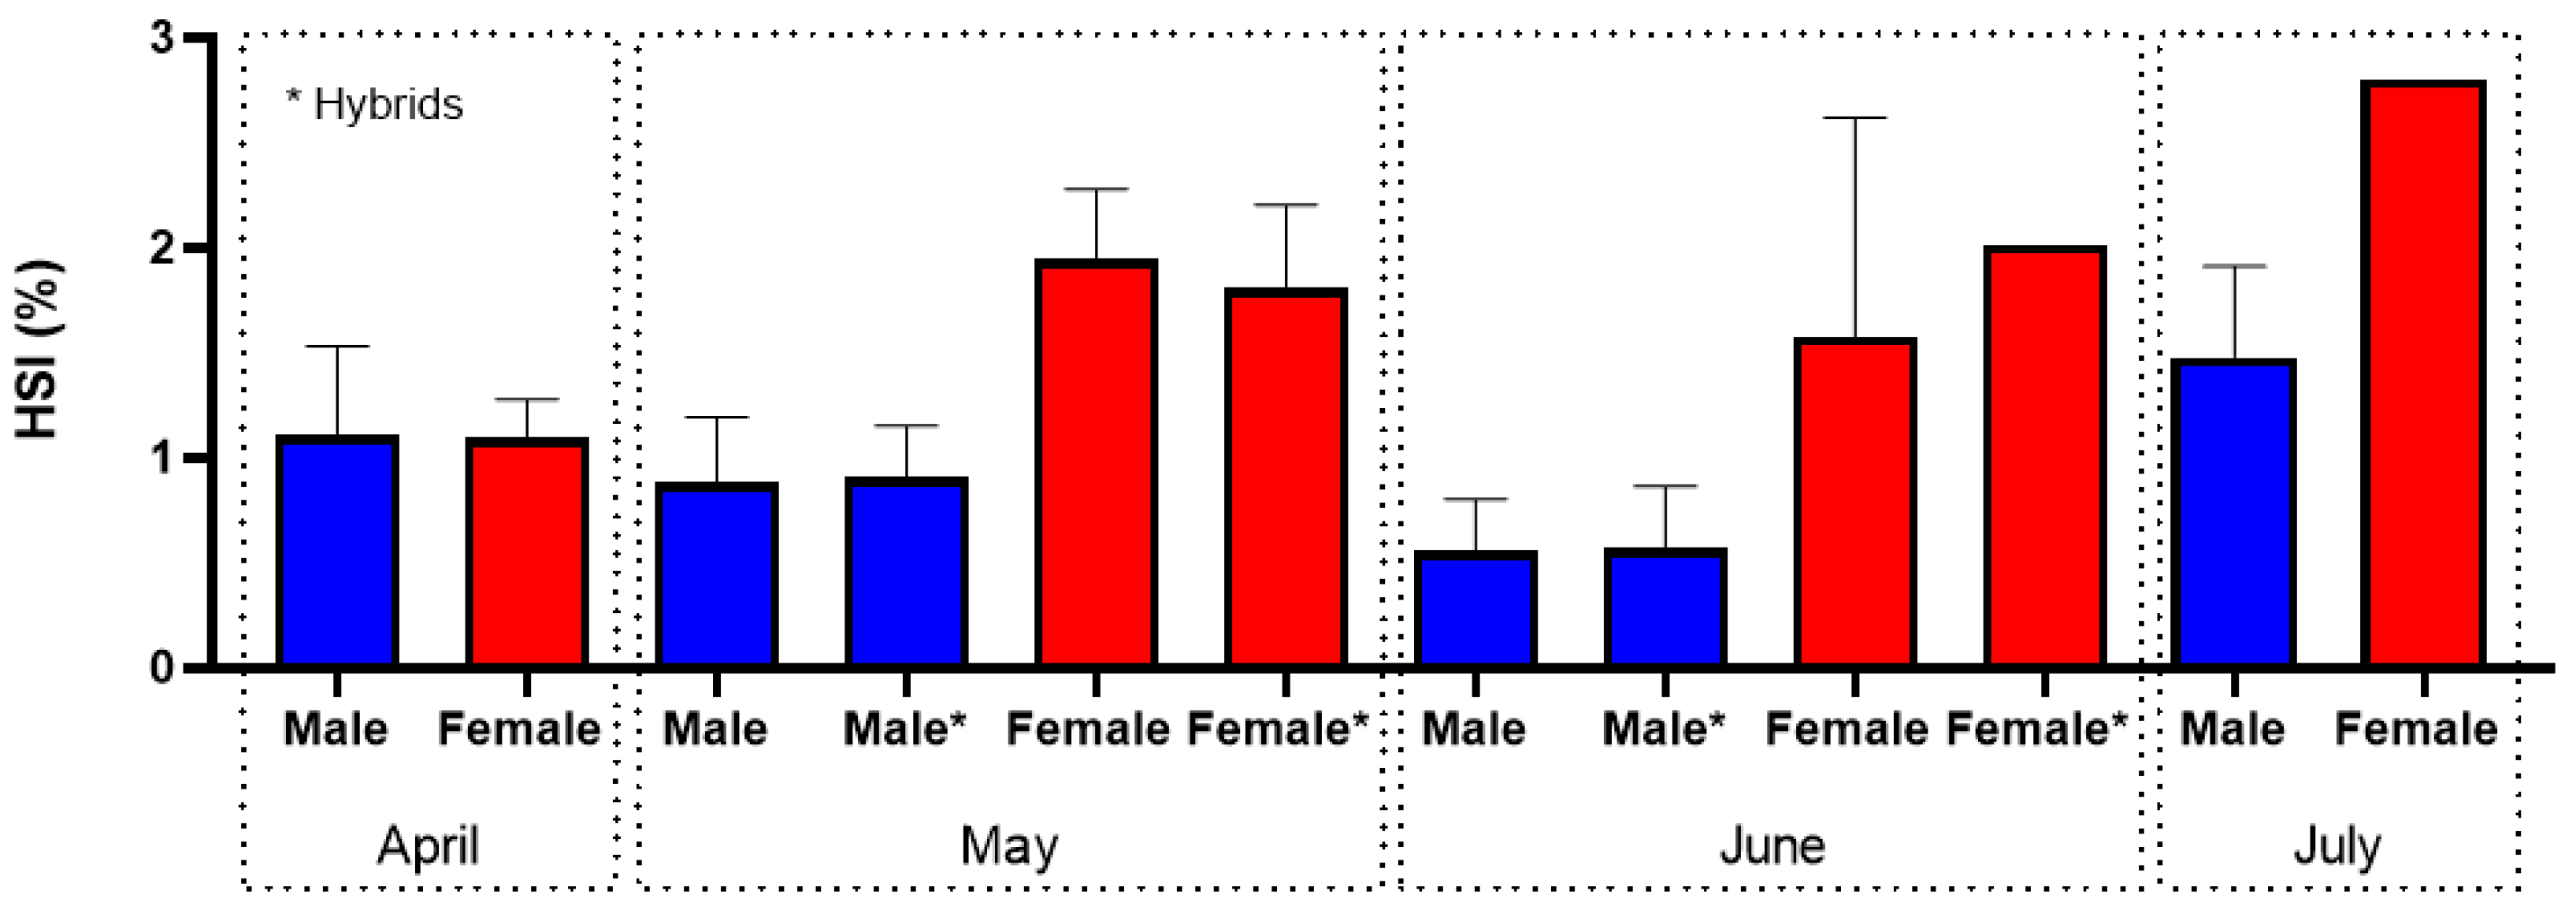
In A. alosa, males showed a decrease in HSI from May to June, with the lowest mean value in June (0.560 ± 0.243%) and a peak in July (1.478 ± 0.435%) (Figure 7). Females showed fluctuations in mean values over the months, with the lowest mean value in April (1.094 ± 0.183%). Their HSI increased in May, decreased in June, and, similar to males, peaked in July (2.801%).
For hybrid individuals, the mean HSI in males decreased from May (0.912 ± 0.239%) to June (0.572 ± 0.291%). In contrast, hybrid females showed an increase in mean values from May (1.811 ± 0.392%) to June (2.017) (Figure 7).
Statistical analysis of A. alosa confirmed significant differences between males and females (unpaired t-test, p < 0.0001). Males showed significant differences in HSI between May and July (Tukey’s test, p = 0.0018) and between June and July (Tukey’s test, p = 0.0008). For females, significant differences were found between April and the remaining sampling months (p < 0.05).
For hybrids, there were significant differences in male HSI between May and June (unpaired t-test, p = 0.0059). Significant differences were also observed between the sexes (unpaired t-test, p < 0.0001).
The mean fecundity (F) was 310 × 103 eggs/ovary (min. 72 × 103, max. 502 × 103 eggs/ovary), and the mean FR was 141 × 103 eggs/kg (min. 59 × 103, max. 180 × 103 eggs/kg). The linear model of F as a function of female weight showed that fish weight was a good and very significant predictor of F (R2 = 0.9784, p < 0.001). The increase in egg number was approximately 240 × 103 per kg of additional body weight.

3.3. Trout (Salmo trutta)

The weight–length ratio was calculated for a total of 121 individuals. The individuals caught ranged in length from 10.4 cm to 54.4 cm and in weight from 14.21 g to 1599.0 g, giving a weight/length ratio expressed by the equation: W = 0.004273 L3.216 (R2 = 0.9602).
Classification of samples by sex showed that 13.2% of the individuals were male, 45.5% were female, and 41.3% of the individuals could not be sexed and were classified as “undifferentiated” (Table 4).
In the Lima River, the mean distribution of total length varied between 25.8 cm and 47.4 cm for males, 17.1 cm and 45.2 cm for females, and 10.4 cm and 54.4 cm for undifferentiated individuals.
The mean distribution of total weight varied between 169.0 g and 940.0 g for males, 50.17 g and 865.0 g for females, and 14.21 g and 1599.0 g for undifferentiated individuals. No significant differences were found between male, female, and undifferentiated individual TL and TW during the sampling months (Mann–Whitney test, p > 0.05). Significant differences were found between male and female TW (Mann–Whitney test, p < 0.05).
The samples showed a value where b displays a positive allometric growth (b > 3), although males showed a trend towards negative allometric growth (b < 3).
The average length of fish across tributaries varied from 3.7 cm to 23.5 cm, and average weights ranged from 0.5 g to 117.0 g. Growth patterns showed a negative allometric growth (b < 3).
Males showed a stable condition factor K over the months, with the highest value recorded in November 2022 (K = 0.9807). In contrast, females showed a decrease in K from November 2022 to February 2023, reaching the lowest value in February 2023 (K = 0.7840), followed by a gradual increase from March to July. Females in 2021 and 2022 had more favourable condition factors compared to those in 2023. Undifferentiated individuals showed contrasting patterns, with condition factor values increasing from March to May 2021 and from November 2022 to February 2023, peaking in February 2023 (K = 1.1250), and reaching a low in November 2022 (K = 0.8861) (Table 4).
No significant differences were observed for males or undifferentiated individuals. However, significant differences were found between females and undifferentiated individuals (unpaired t-test, p < 0.0001).
Compared to the main course, trout individuals from tributaries had higher condition factor values, K = 1.06 (Table 4).
In the total sample, we identified 16 males (13.2%), 54 females (44.6%), and 51 undifferentiated trout (42.2%).
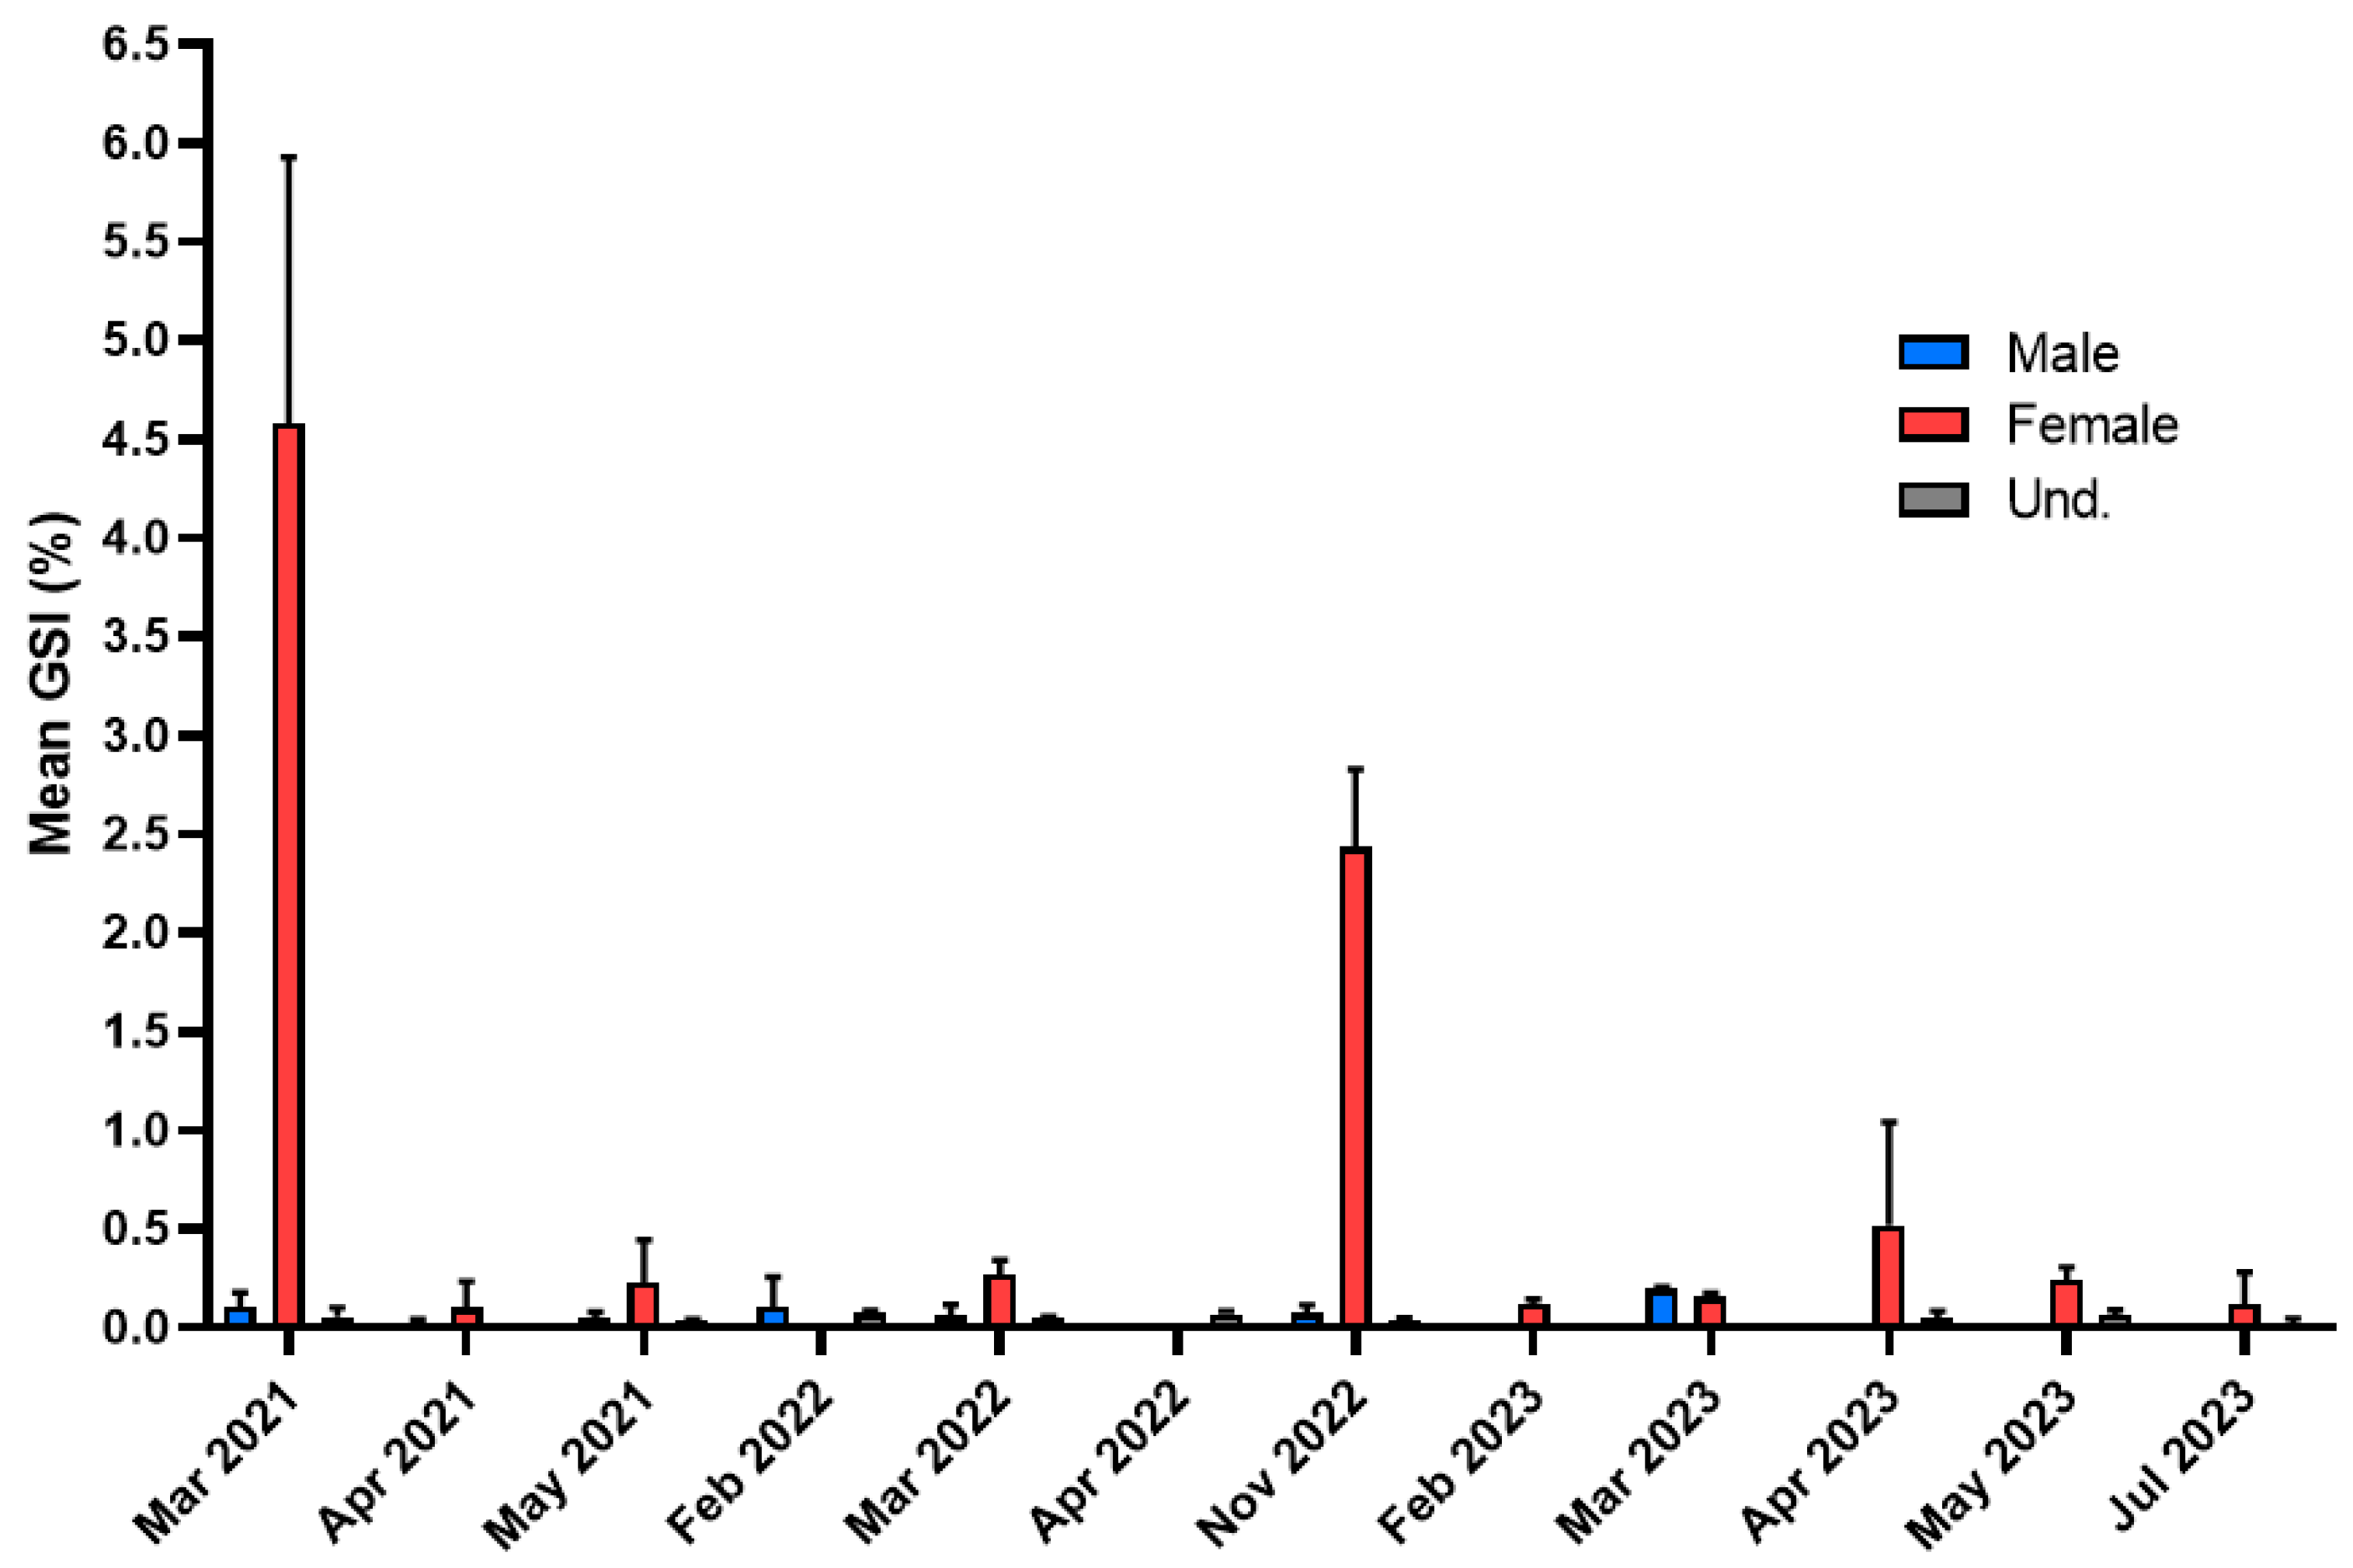
It can be observed that in February 2022 (0.2123) and March 2023 (0.1990), there was an average increase in the male GSI, with no significant differences observed (Dunn’s test, p = 0.1820). Females showed higher mean values and demonstrated significant differences between sampling months (Dunn’s test, p = 0.0111), with peaks in March 2021 (3.631) and November 2022 (2.712). For both sexes, the observed peaks suggest a period of development or maturation of the gonads (Figure 8). There were no meaningful variations or peaks that occurred in undifferentiated individuals or significant differences (Dunn’s test, p = 0.1728), with values ranging from 0.0364 to 0.0851.
Significant differences were found between males and females (Mann–Whitney test, p = 0.0075), males and undifferentiated (Mann–Whitney test, p = 0.0067), and females and undifferentiated (Mann–Whitney test, p < 0.0001).
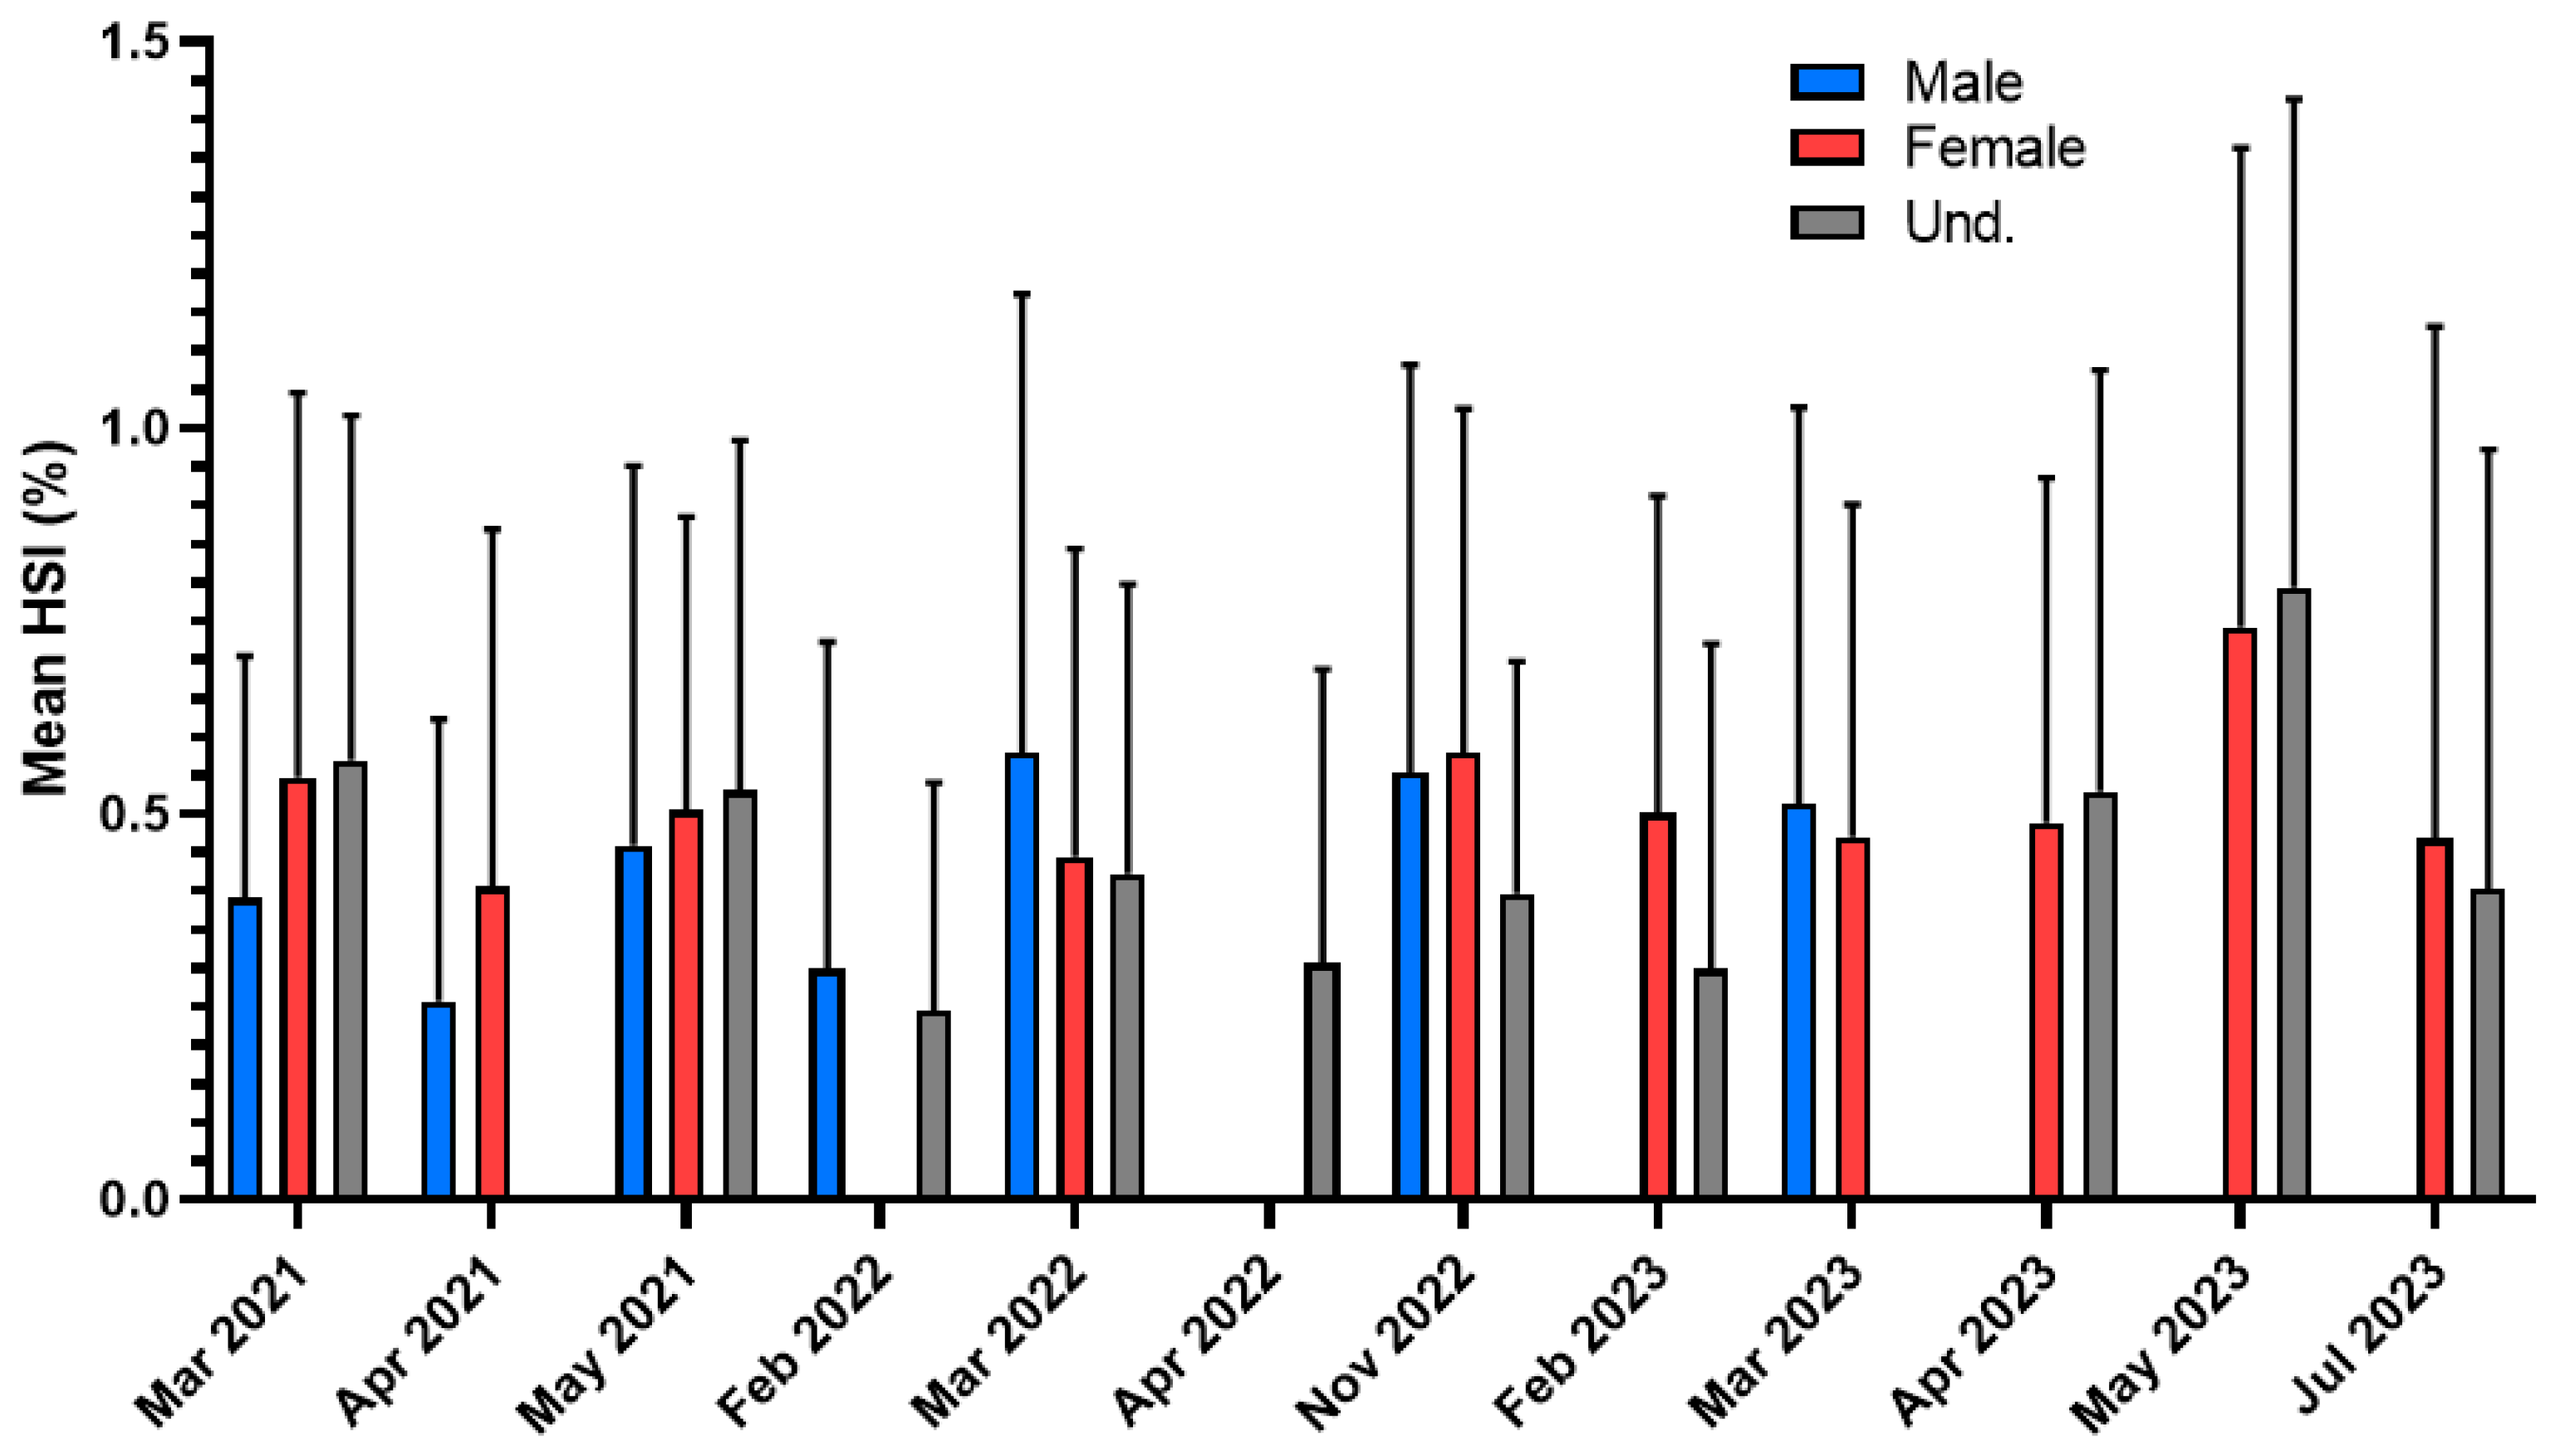
For the HSI, males did not show significant differences (Dunn’s test, p = 0.1402), with the lowest mean value in April 2021 (0.5155) and the highest in March 2022 (0.9994). For females, the lowest mean value was recorded in March 2022 (0.7264). From March 2023 to May 2023, a gradual increase in mean values was observed, reaching the highest recorded value of 1.1810. In 2023, significant differences were observed between May and February and April (Dunn’s test, p = 0.0258 and p = 0.0347, respectively). In contrast to males and females, undifferentiated individuals showed a low mean in November (0.6091). Fluctuations between months showed a low mean of 0.4539 in February 2022, and, as females, a high mean value of 1.2410 in May 2023, with significant differences between the months of March and November 2022 and May 2023 (Dunn’s test, p = 0.0437 and p = 0.0179, respectively) (Figure 9).
A non-parametric Mann–Whitney test showed no significant differences between the sexes (p > 0.05).
A total of 103 S. trutta stomachs were analyzed, of which 8.7% (9 individuals) contained no prey and 91.3% (94 individuals) contained traces or whole prey inside that could be identified. The vacuity index (Vi%) was 8.7%.
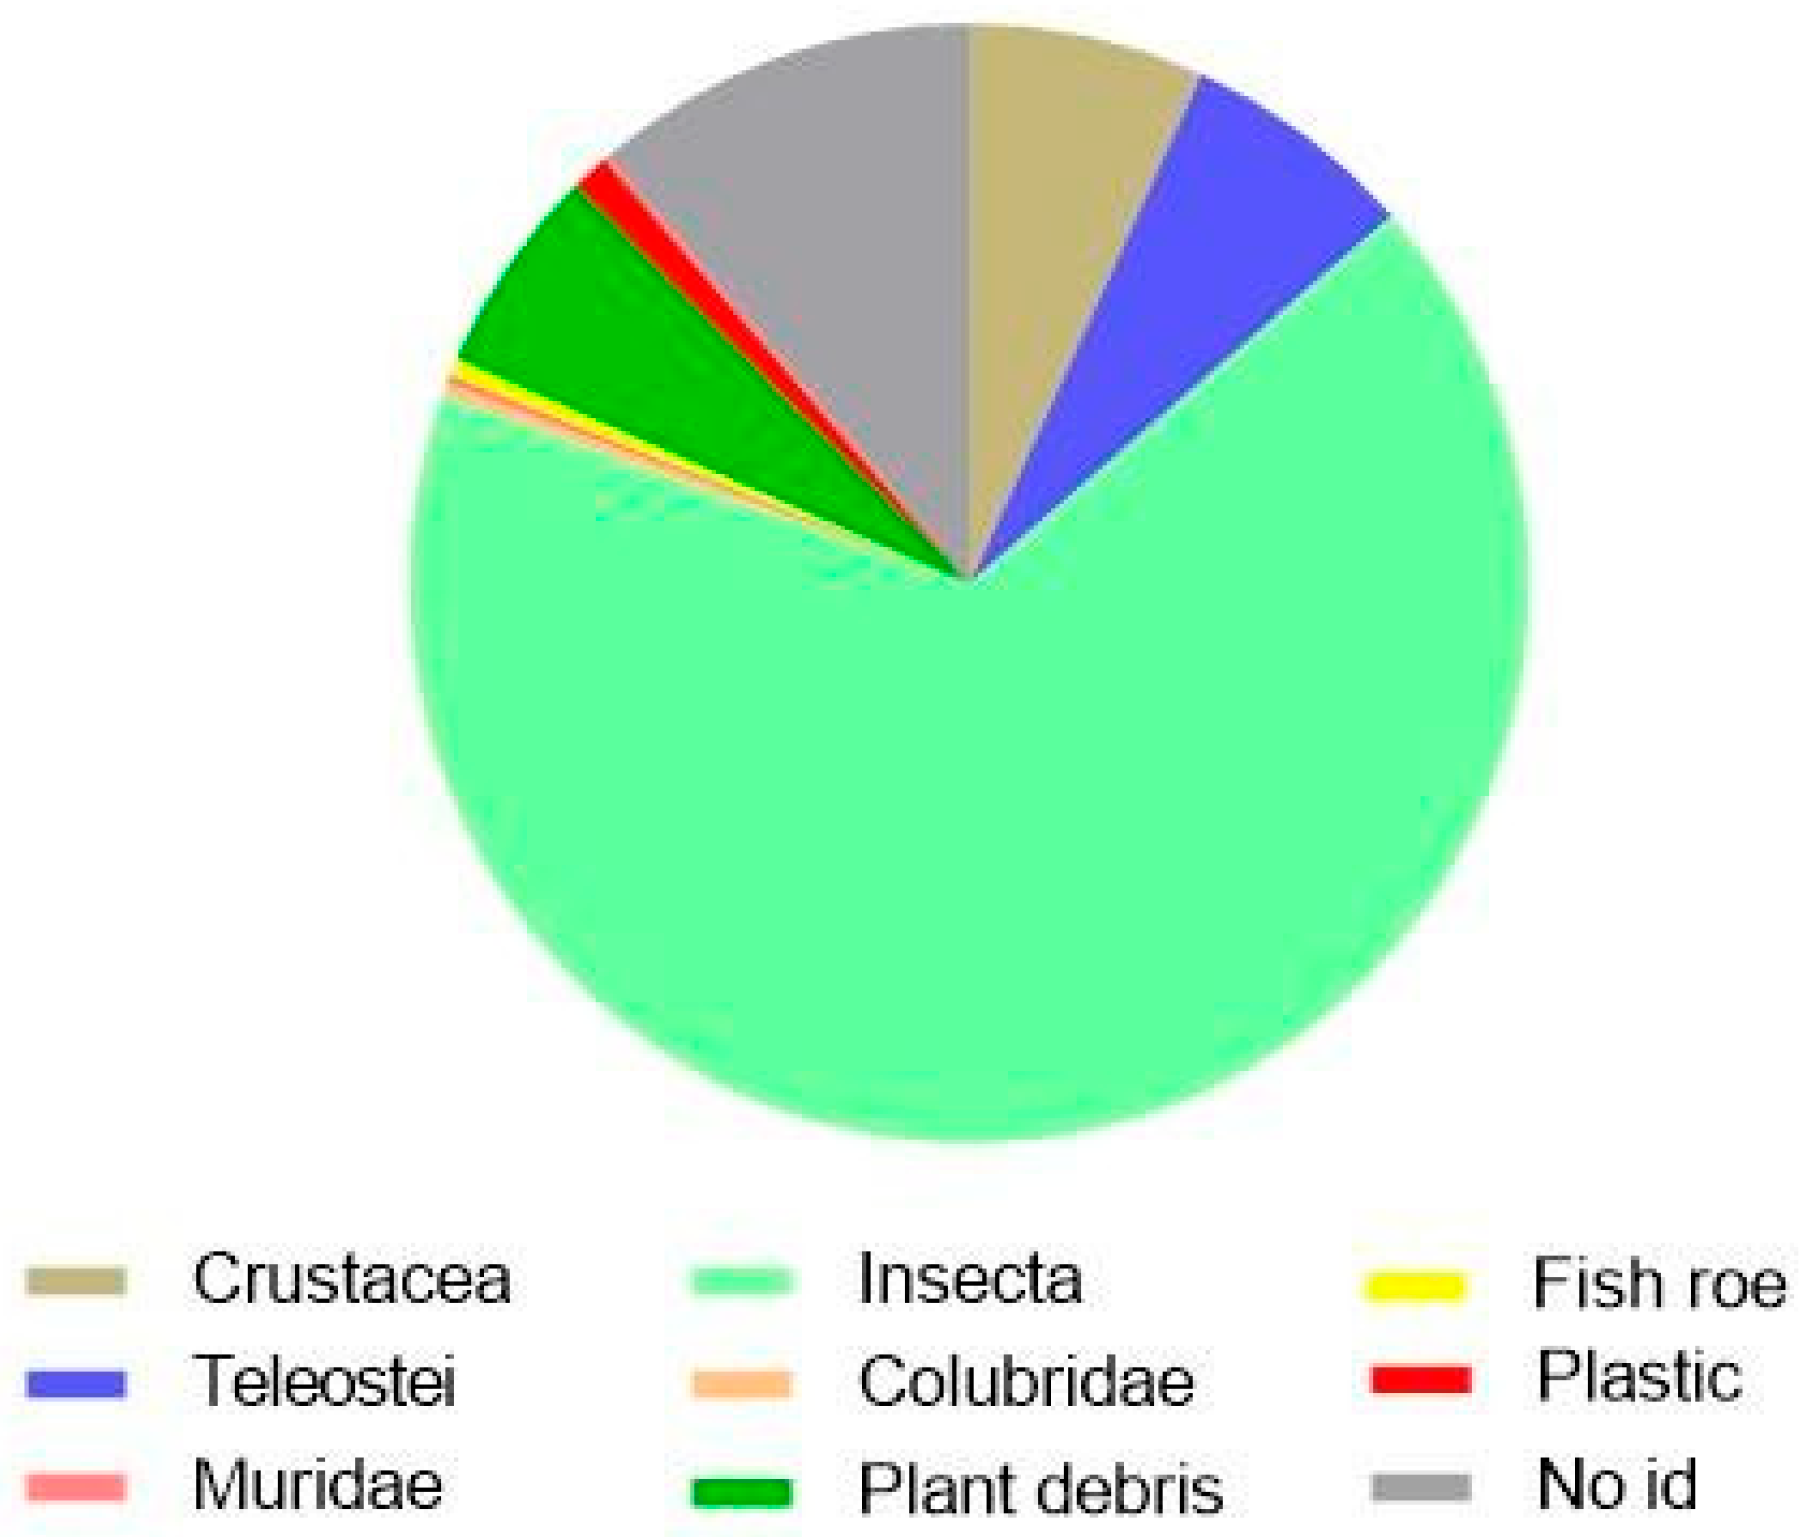
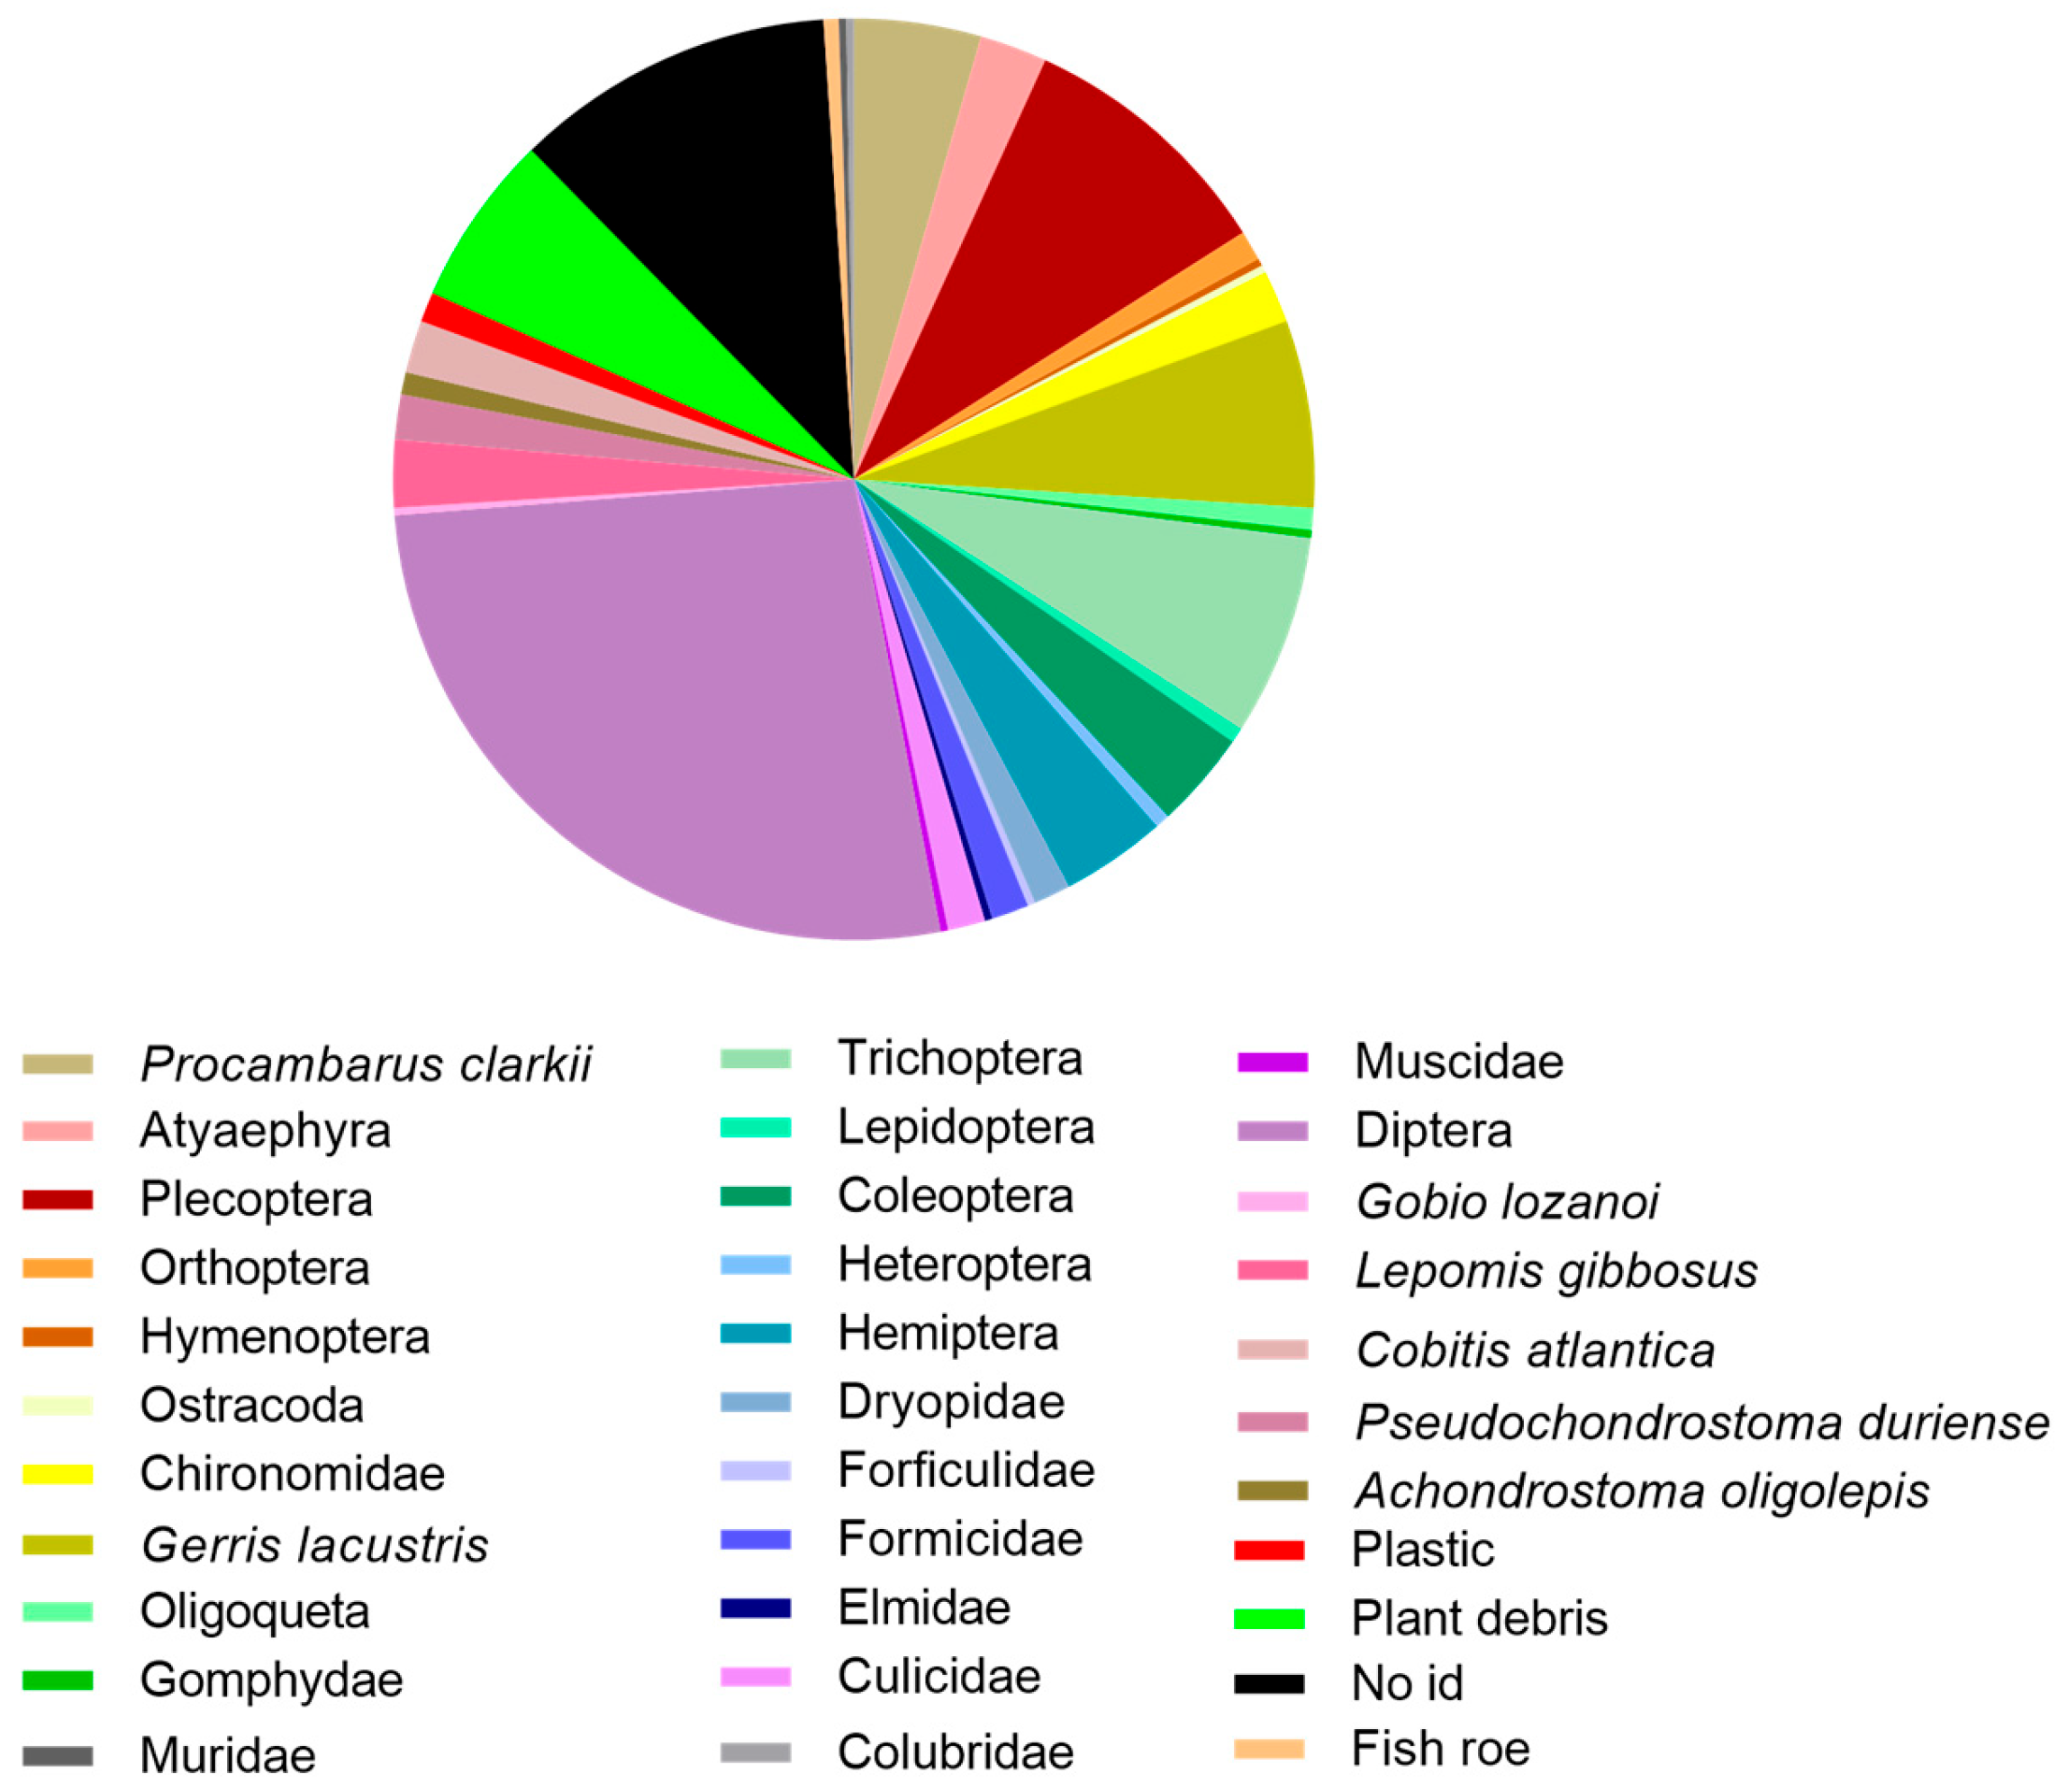
The relative abundance (Pi%) (Figure 10 and Figure 11) of the stomach contents analyzed indicated that a total of five taxonomic groups were counted: Crustacea (Procambarus clarkii 4.5%, Atyaephyra desmaresti 2.3%), Teleostei (Lepomis gibbosus 2.3%, Cobitis atlantica 1.8%, Pseudochondrostoma duriense 1.6%, Achondrostoma oligolepis 0.8%, Gobio lozanoi 0.3%), Insecta (Diptera 26.7%, Plecoptera 9.2%, Trichoptera 7.1%, Gerris lacustris 6.5%, Hemiptera 3.7%, Coleoptera 3.4%, Chironomidae 1.8%, Culicidae 1.3%, Dryopidae 1.3%, Formicidae 1.3%, Orthoptera 1.0%, Oligochaeta 0.8%, Heteroptera 0.5%, Lepidoptera 0.5%, Elmidae 0.3%, Forficulidae 0.3%, Gomphidae 0.3%, Hymenoptera 0.3%, Muscidae 0.3%, Ostracoda 0.3%), Colubridae (0.3%), and Muridae (0.3%). It was also possible to identify fish roe (0.5%), plant debris (6.0%), and plastic (1.1%); 11.3% of the content could not be identified.
Between 2021, 2022, and 2023, the largest number of individuals (41.7%) were aged 3+. Of these, 8.4% were in 2021, 10.0% in 2022, and 23.3% in 2023. In addition, 25.0% of the individuals were aged 2+, of which 5.0% were in 2021, 1.7% in 2022, and 18.3% in 2023. Individuals aged 4+, 5+, and 6+ were found in smaller percentages, representing 17.5%, 9.2%, and 5.8%, respectively. Finally, only 0.8% of the individuals were aged 1+ (Figure 12).
Individual length ranged from 14.3 cm, at age 1, to 54.4 cm, at age 6. Statistical analysis using the non-parametric Kruskal–Wallis test, followed by Dunn’s multiple comparison test, revealed significant differences in length between the different age groups (p < 0.0001). However, no significant differences were found between age groups 3+, 4+, 5+, and 6+ (p > 0.05).
Mean back-calculated length at age increased progressively from 13.5 ± 2.9 cm at age 1 to 46.1 ± 3.0 cm at age 6, with individual lengths ranging from 8.3 cm to 51.0 cm (Table 5).
Regarding otolith measurements, otolith diameter and radius demonstrated a correlation of 0.986. The otolith radius ranged from 1.46 mm, at age 1+, to 4.24 mm, at age 6+ (Table 5).

3.4. European Eel (Anguilla anguilla)

In Lima River, the weight/length ratio was calculated for a total of 54 individuals. The individuals caught ranged in length from 12.2 cm to 69.3 cm and in weight from 1.26 g to 845.0 g (Table 5), giving a weight/length ratio expressed by the equation: W = 0.000046L3.3477 (R2 = 0.9656).
In the studied tributaries, the TL of fish ranged from 7.3 cm to 46.4 cm (Table 6).
Similarly, the TW varied from 0.38 g to 135.8 g, mirroring the TL pattern. Significant differences in both TL and TW were observed between the Lima River and tributaries (Mann–Whitney test, p < 0.05).
In general, tributaries presented negative allometric growth (b < 3), indicating that fish in these rivers grew faster in length than in weight, reflecting not optimal growth conditions.
Fish from the tributaries had lower mean condition factor values compared to those from the Lima River. Statistically significant differences in the condition factor were found between the Lima and Estorãos (unpaired t test, p < 0.05).
For the Lima River, the sex of 37 captured individuals could be determined; 6 males (11.1%) and 31 females (57.4%) were identified. The remaining 17 individuals (31.5%) were classified as undifferentiated.
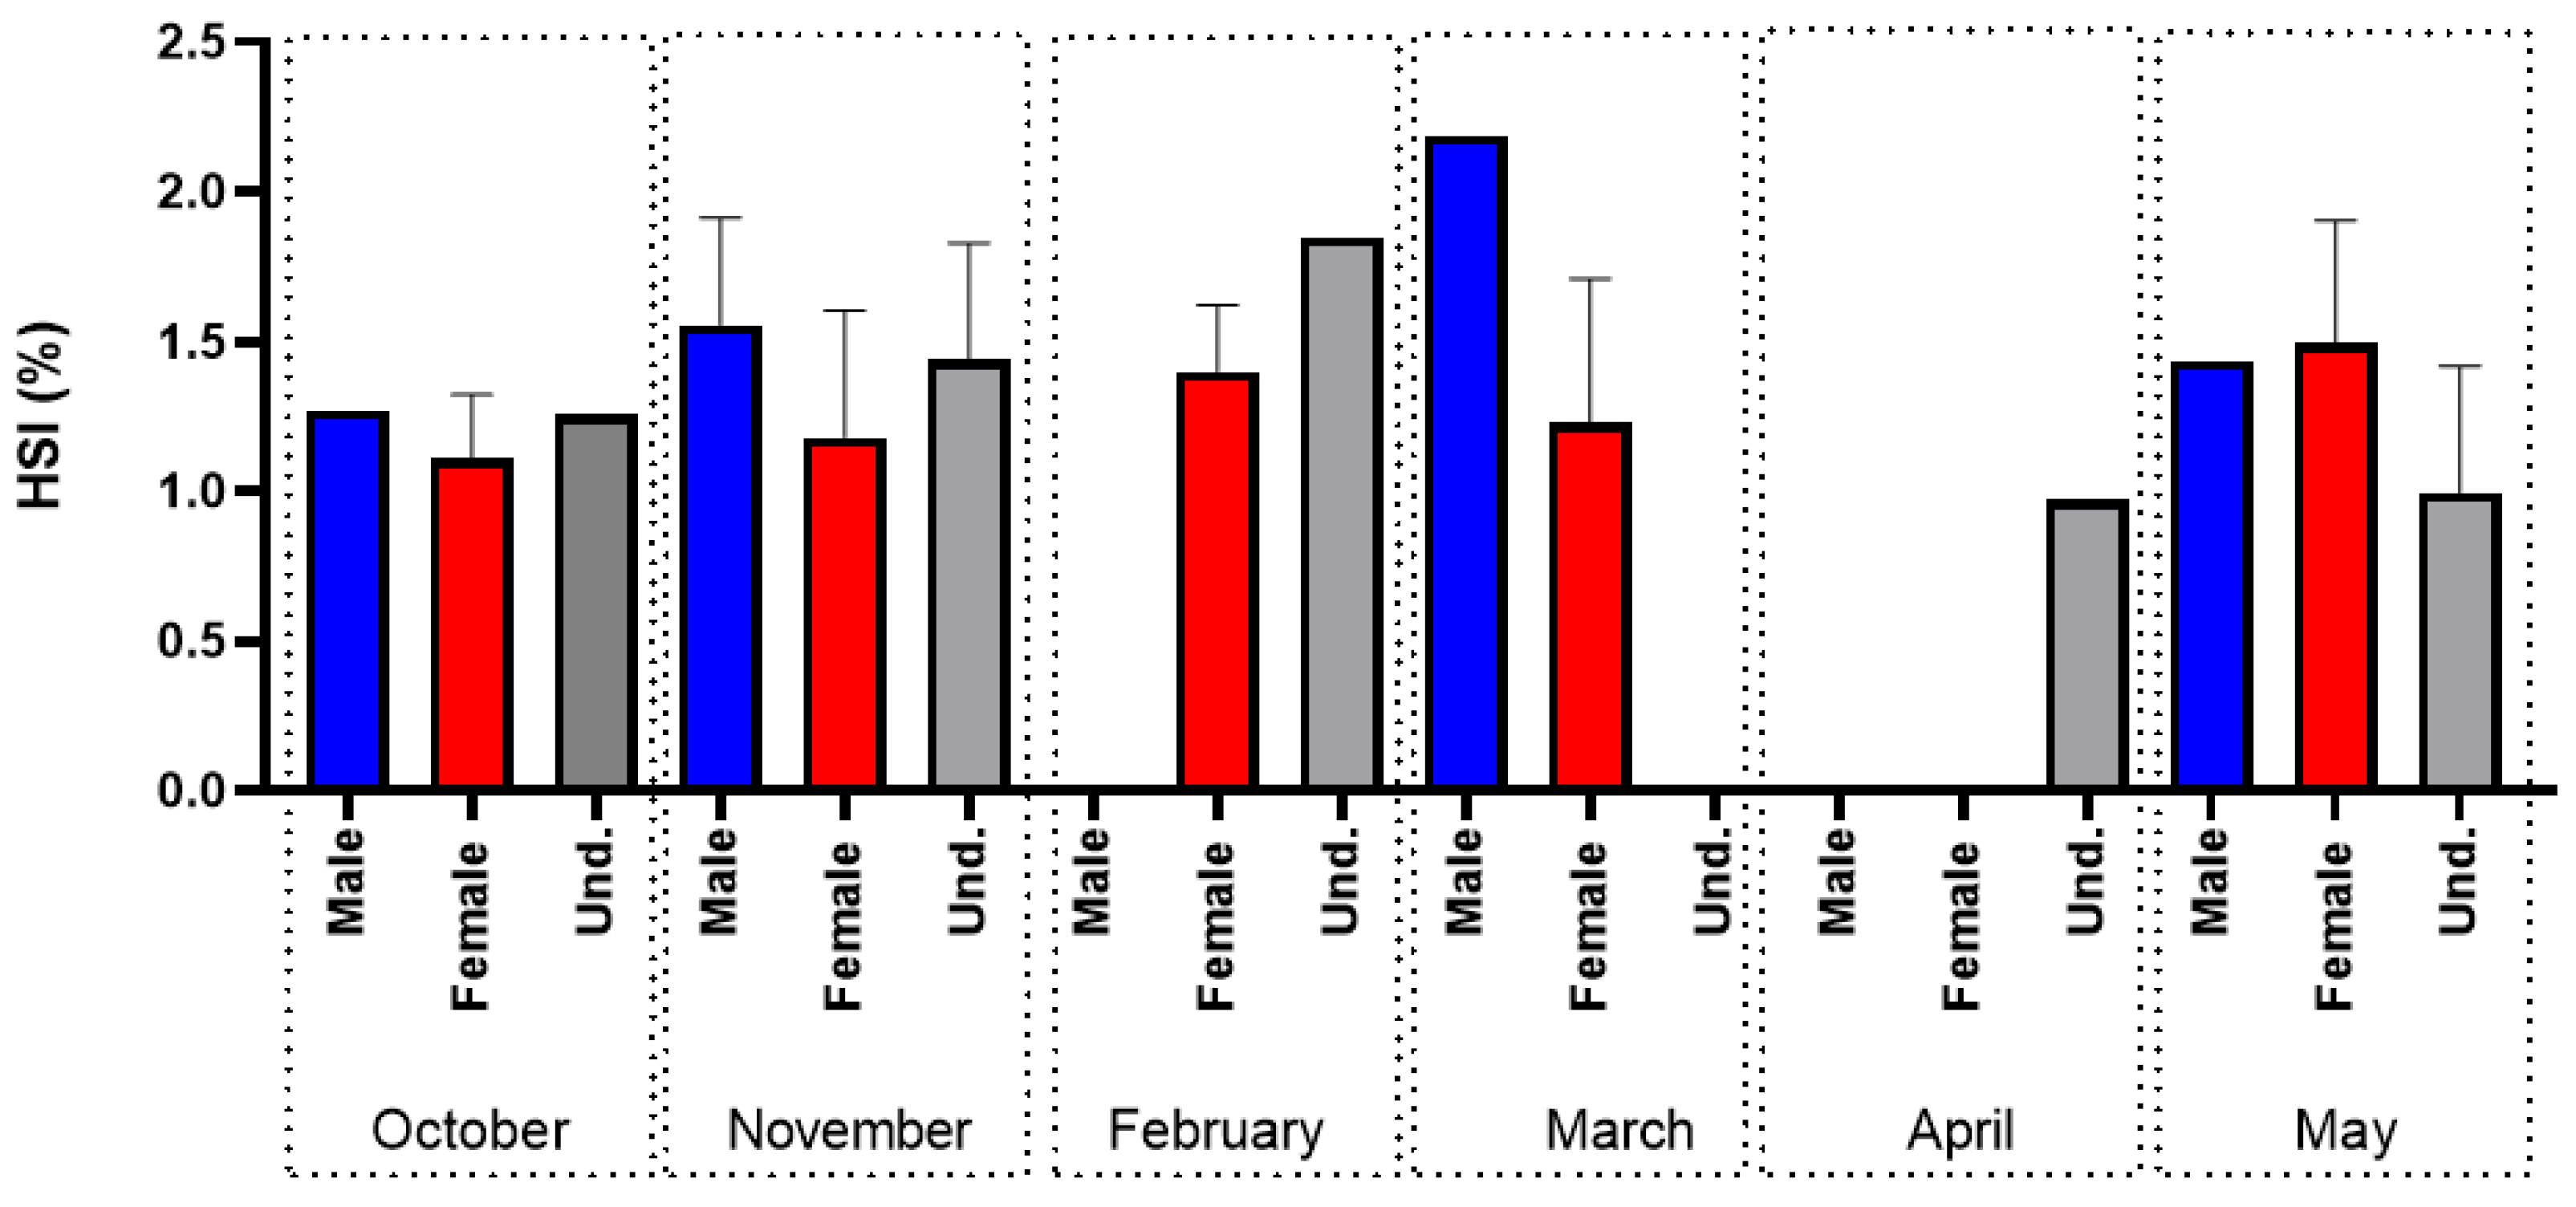
Variations in the HSI were observed on both a monthly and seasonal basis (Figure 13). Males generally had higher mean HSI values than females, except in May. Male HSI values increased from October (lowest recorded value of 1.272) to March, peaking at 2.187, before decreasing in May. For females, a gradual increase in HSI was observed from October (1.112) to May (1.496). For undifferentiated individuals, the HSI increased from October (1.26) to February (1.85), with the lowest mean values recorded in April (0.974) and May (0.998). Significant differences in HSI were found only between males and females (unpaired t-test, p = 0.0343).
A total of 52 eels were analyzed and their developmental status was determined. According to Durif’s method (2009) (Figure 14), the significant number of eels captured are in the growth phase, with 55.8% of the eels in the SI class, which includes resident animals, but young and still sexually undifferentiated, 17.3% in the SFII class, where we find resident but already sexually differentiated individuals. Only females are included here. The phase, in which the females are fully developed and preparing for the beginning of migration, SFIII—pre-migrant eels, represents 15.4% of the animals in this sample. Migrating eels can also be found in the same sample, ready to begin their Atlantic migration towards the laying areas. These correspond to 11.5% of the sample carried out, divided by females in the SFIV class, 1.9%, and males in the SMII class, 9.6%.
In the Lima River, the age distribution is broad, with individuals ranging from 0 to 10 years. The highest number of individuals is observed at ages 4 and 5. Tributaries show a clear peak at age 1. Other age classes show significantly lower numbers, with minimal representation beyond age 4 or absent.
In the Lima River, the TL of individuals showed a progressive increase with age. At age 1, individuals measured 12.2 cm, increasing to 21.2 cm at age 2. At age 3, TL ranged from 25.8 cm to 32.4 cm, while at age 4, TL ranged from 27.5 cm to 38.4 cm. At age 5, TL varied from 29.2 cm to 43.5 cm, and at age 6, the range extended to 39.5 cm to 59.8 cm. At age 7, lengths ranged from 36.9 cm to 60.0 cm. A marked increase in minimum length was observed at age 8 (52.1 cm to 55.8 cm) compared to age 7. At age 9, lengths varied from 56.8 cm to 62.2 cm, and the maximum lengths, recorded at age 10, ranged from 63.3 cm to 69.3 cm. The relationship between TL and age in the Lima River is described by the linear equation: Y = 5.718X + 9.387 (R2 = 0.8281), indicating a strong positive correlation (r = 0.9100). In the studied tributaries, individuals at age 0 had lengths ranging from 7.3 cm to 9.4 cm, increasing to 9.8 cm to 13.3 cm at age 1. At age 2, lengths ranged from 14.4 cm to 30.3 cm. At age 3, lengths ranged from 24.7 cm to 30.5 cm, while at age 4, individuals ranged from 25.8 cm to 33.9 cm. From ages 5 to 7, no individuals were caught, and only one record was made for age 8, with 46.4 cm of length. The linear equation describing the TL–age relationship in the tributaries is Y = 5.829X + 7.446 (R2 = 0.8761), with a high correlation (r = 0.9360).
By back-calculation, 95 individuals were analyzed and it was possible to determine the length of the individuals for certain ages (Table 7).
In the Lima River, mean length at age increased gradually from 14.6 ± 3.1 cm (age 1) to 63.5 ± 3.6 cm (age 10), with individual lengths varying from 9.1 cm to 66.1 cm. In the tributaries, mean length at age increased gradually from 13.0 ± 4.1 cm (age 1) to 45.7 cm (age 8), with individual lengths ranging from 6.5 cm to 45.7 cm.
Statistically, a non-parametric Kruskal–Wallis test was performed for the Lima River and its tributaries, followed by Dunn’s multiple comparison test. Significant differences in medians were observed, with p < 0.0001, in the Lima River. Significant differences were also observed between year 1 and year 3 to year 10 (p < 0.0001); year 2 and year 4 to year 10 (p < 0.05); year 3 and year 5 to year 9 (p < 0.05); year 4 and year 6 (p = 0.0331); and year 4 and year 7 (p = 0.0215). Significant differences were observed in tributaries (p < 0.0001), with differences between year 1 and year 2 (p = 0.0006); year 1 and year 3 (p < 0.001); and year 1 and year 4 (p < 0.0001).
The linear regression equation obtained from otolith diameter–radius relationship for Lima River was Y = 0.5532X − 0.04495 (R2 = 0.9803) and a correlation of 0.9901. For tributaries, a linear regression equation of Y = 0.5064X + 0.04298 (R2 = 0.9503) and a correlation of 0.992 were obtained (Table 8).
In the Lima River, otolith radius increased progressively with age, ranging from 0.40 mm at age 1 to 2.24 mm at age 9 (Table A2).
In the tributaries, otolith radius data were available for younger age classes (ages 0 to 4 and age 8), with values ranging from 0.34 mm at age 0 to 1.52 mm at age 8. Sample sizes were generally smaller in the tributaries, and data were absent for older age groups.
Based on the classification used [48], most of the eels sampled were in the growth phase. Specifically, 55.8% of the eels were in the SI stage, which includes resident, young, and sexually undifferentiated individuals. A further 17.3% of the sample consisted of eels in the SFII stage, characterized by resident but sexually differentiated females. The SFIII stage, representing pre-migrant females that are fully developed and preparing to migrate, represented 15.4% of the sample. In addition, 11.5% of the eels were identified as migrants, ready to begin their Atlantic migration. Of these, 1.9% were at the SFIV stage (females) and 9.6% were at the SMII stage (males).
Eels from different rivers showed marked differences in parasite infection rates. Of the 99 eels sampled, 60 were found to be infected (Table 9). The highest number of infected eels was observed in the Lima River (39). Parasites identified included both larval stages (L3 and L4) and adult stages, with most infected eels hosting adult parasites.
The maximum number of parasites recorded in a single eel was 15, found in the Lima River. In contrast, the minimum number of parasites per swim bladder was 1, which could belong to any developmental stage; this was observed in all sampling sites. The intensity of infection varied significantly among rivers, with an overall mean intensity of 3.6 ± 3.3 parasites per eel and a mean abundance of 2.2 parasites per eel. The highest mean intensity of infection (4.1 ± 3.5 parasites) and abundance (3.0) was observed in eels from the Lima River. Mean infection intensity differs significantly between Lima River and tributaries (Mann–Whitney test, p = 0.0248). The prevalence of infection in the Lima River was significantly higher at 73.6% (95% C.I.: 60.5–84.1%) compared to the tributaries at 45.7% (95% C.I.: 32.0–60.0%).
In general (Lima River and studied tributaries), only 9.1% of the eels had no pathological signs in the swim bladders (SDI = 0), 84.8% had moderate damage (1 ≤ SDI ≤ 3), and 6.1% had severe damage (SDI > 3). No eel was observed with extreme SDI values (5 and 6). The SDI values of eels from the rivers studied were predominantly between 1 and 3, indicating a moderate degree of degeneration in most samples.
In the Lima River, 94.3% of the eels showed moderate swim bladder degeneration with SDI values between 1 and 3. A smaller proportion (5.7%) had an SDI greater than 3, indicating more severe degeneration in a minority of individuals. In tributaries, most samples (73.9%) showed moderate degeneration (SDI 1–3), while only 6.5% had an SDI greater than 3, reflecting a more pronounced degeneration in a smaller proportion of the eels. The remaining 19.7% of samples presented an SDI of 0, indicating no degeneration.

4. Discussion

4.1. Sea Lamprey (Petromyzon marinus)

In Europe, particularly in countries such as France, Spain and Portugal, sea lampreys have been subject to overfishing and habitat loss. These pressures have led to population declines and genetic bottlenecks [52]. Interannual fluctuations in the recruitment of diadromous fish, which are reflected in fishing activity, are common. These fluctuations are reflected in the supply and demand of the product and in the variation of the market price.
Although still widely distributed, the sea lamprey is now classified as endangered or rare in certain parts of its range. It is important in commercial fisheries, particularly during the upstream spawning migration in parts of Spain, Portugal and France. Several conservation strategies have proven effective in stabilizing or reversing these declines, though challenges persist. Improving river connectivity through fish passage facilities has been a cornerstone of conservation efforts. In Portugal’s Mondego River, monitoring at the Coimbra dam fish pass has facilitated sea lamprey migration, with visual counts indicating improved access to upstream spawning grounds [53]. However, traditional fishways often fail to accommodate the benthic swimming style of lampreys, necessitating specialized designs such as smooth ramps with resting pools, which have shown promise in analogous systems [54]. In the Minho River, which straddles Portugal and Spain, fishers’ local ecological knowledge (LEK) identifies dams as the main barrier, highlighting the need for improved fish passage to restore access to spawning habitat [55].
Habitat restoration targeting spawning and larval habitats is another critical strategy. Sea lampreys require gravel beds for spawning and silty substrates for ammocoete development, both of which are degraded by dam impoundments and pollution. In Portugal, habitat restoration in the Mondego River, coupled with institutional partnerships, has improved larval abundance, suggesting potential for wider application in rivers such as the Minho [53]. Environmental DNA (eDNA) surveys are emerging as a cost-effective tool to map spawning sites and prioritize restoration, offering scalable solutions across Iberian and French rivers [54]. Sustainable fisheries management has also proved effective, particularly in France’s Garonne basin, Europe’s largest sea lamprey fishery. Regulated fishing since the 1970s, including seasonal closures (December–May) and licence restrictions, has stabilized the abundance, with CPUE increasing since the late 1990s, indicating that the population is recovering [56]. In Portugal and Spain, however, illegal fishing driven by high market prices undermines conservation, necessitating stricter enforcement and adaptive management based on yield data [53,55].
Emerging threats, such as predation by the invasive European catfish (Silurus glanis), require novel interventions. In the French Garonne-Dordogne system, telemetry studies showed that 80% of tagged sea lampreys were predated within one month, with 50% consumed within eight days, highlighting predation as a significant mortality factor [57]. Targeted catfish control or lamprey release strategies to bypass predation hotspots could improve spawning success, although such measures have yet to be scaled up. Finally, the integration of LEK into conservation frameworks has strengthened monitoring and community engagement. In the Minho River, fishermen’s observations of migration patterns and spawning sites have informed management priorities, complemented scientific surveys and fostered stakeholder support [55]. Artificial propagation, although less common in Europe, has the potential to supplement wild populations by rearing ammocoetes in controlled environments, as has been demonstrated for other lamprey species [58].
In Portugal, sea lampreys are found in all major river basins, with higher concentrations observed in the northern and central regions of the country [59]. Fishing activities are mainly concentrated in these regions, especially in the Minho and Mondego rivers, but also in the Lima, Cávado, Vouga and Tagus rivers. Fishing activities take place mainly during the anadromous migration of the pre-spawners from January to April, which is the main source of livelihood for many artisanal fishers [53]. As evidence of its conservation status, the sea lamprey is classified as vulnerable, according to the Portuguese Red Book of Freshwater and Diadromous Fish [60].
Sea lampreys from the Lima River show consistency in growth and size patterns over recent decades [61]. The results are consistent with other studies suggesting a relationship between lamprey size and river latitude, with lampreys from the Lima River being comparable in length to those from other rivers of similar latitude [61]. However, differences have been observed when compared with regional rivers [56]. For example, lampreys from the Minho River have higher length values, which are consistent with the ranges reported for the Mondego River [62,63], but not with the trends observed at higher latitudes [56]. Conversely, lampreys from the Lima River had smaller lengths than those from lower flow rivers such as the Cávado River [64].
These differences may be influenced by ecological and environmental factors, including, population density and habitat constraints, as well as anthropogenic pressures such as river damming, pollution, habitat destruction, and commercial exploitation [59]. The river structure, in particular the location of dams, plays an important role, as the Touvedo dam on the Lima River is located 48 km from the mouth of the river, while the Frieira dam on the Minho River is located 78 km upstream [59]. The shorter corridor in the Lima River may limit the availability of habitat for larval growth and spawning, as dams block upstream spawning grounds and limit silty areas for ammocoetes. The longer reach of the Minho River may offer more habitat diversity, although the Frieira dam still fragments spawning access. Thermally, although there is a lack of data, Touvedo’s dam proximity to the mouth of the river may cause abrupt temperature changes, disrupting sea lamprey spawning sites, while the Minho’s longer corridor may allow more gradual thermal gradients, although both dams alter regimes critical for reproduction.
Gonadal development plays a crucial role in the weight differences between the sexes, as indicated by the inverse relationship between GSI and gutted carcass weight in both sexes. This study confirms the results of other studies [65,66] and shows that while females have a slightly higher HSI on reaching the estuary, males, in contrast to females, have a significant increase in HSI upstream. This pattern is reversed for GSI, suggesting that liver lipids in sea lampreys may be selectively allocated either to gonadal development for reproduction or to energy burning in other organs for vital functions [67].
In addition, the obstructed nature of the Lima River, with barriers such as weirs, may delay migration and increase energy expenditure in lampreys, potentially reducing energy the available for gonad development and spawning. This observation is consistent with previous studies highlighting the effects of migration delays on reproductive energy allocation [68,69].

4.2. Shads (Allis Shad Alosa alosa; Twaite Shad Alosa fallax)

In the Mediterranean region, A. alosa and A. fallax have been recorded in almost all major rivers, but the construction of reservoirs has confined shad populations to river deltas [17]. In Portugal, the migratory species also have land-locked populations that have been identified in dam reservoirs, including Aguieira (Mondego River basin), Castelo de Bode (Tagus River basin), and Alqueva (Guadiana River basin) [70]. Although some recent studies indicate a possible recovery of the twaite shad population, e.g., in the Ebro River [70], A. fallax populations have been significantly reduced or have even been declared as extinct due to various factors, such as overfishing, increased sedimentation, pollution, habitat destruction, and the construction of weirs. Portugal is no exception. The lack of studies in some locations is also a factor in the description of the status of this species [70,71,72,73,74]. The recent decline in catches in the Lima River has led to a ban on allis shad fishing, which is reviewed annually.
Hybridisation between A. alosa and A. fallax has been well-documented in shad populations throughout Europe and North Africa [75]. Both morphological and genetic analyses [39,76] have confirmed the presence of hybrids in the Lima shad population, similar to the findings in the Minho River [11]. One factor contributing to hybridization is the presence of river dams, which can disrupt migration patterns and cause spawning areas to overlap [77].
On a wider European scale, A. fallax haplotypes were observed in three out of nine populations studied and varying proportions of A. alosa haplotypes in 12 out of 29 A. fallax populations [78]. Relatively high levels of hybridisation (ranging from 25% to 63%) were also reported in populations from the United Kingdom (Usk and Tywi) and Portugal (Lima and Tejo) [78].
In Portugal, the main catch is from the River Minho, which historically yielded around 300 tonnes but declined significantly after the construction of dams in the 1950s. More recently, annual catches have averaged around four tonnes, with additional catches in the central coastal region. In the Lima River, shad populations were abundant in the early 1990s, but have declined significantly since 1999 [79]. This decline is closely linked to the construction of several barriers, including three dams built between the late 1950s and early 1990s (two hydroelectric plants, Alto Lindoso and Touvedo, built in 1993 and 1996, respectively). These structures have altered the freshwater flow of the river, affecting the habitat conditions for shads. In addition, the construction in 1997 of a small stone weir at Ponte de Lima, located 23 km from the mouth of the river, further restricted migration routes. As a result, commercial fishermen reported a significant reduction in shad catches in subsequent years [17].
Comparing the Lima River with similar systems, such as the Minho River, where the spawning grounds of A. alosa and A. fallax were quite far apart, and even after the construction of the dams, these areas remained substantially separated by about 30 km [11]. As the first dam on the Lima River is located 48 km from the mouth of the river, this separation may not be observed. In addition, it is not well understood how hybridisation occurs when spawning grounds are clearly separated [80]. Dams that reduce water flow could push some A. fallax individuals upstream in search of greater water volume/flow, potentially leading to hybridisation [81].
Genetic analysis indicates that most hybrids in the Lima River are backcrossed individuals (mainly A. alosa backcrosses), suggesting introgression with hybrids backcrossed with the more abundant species (i.e., A. alosa) in their spawning grounds [39], as observed in the Minho River [11]. Previous studies based on the Mondego and Lima rivers supported the genetic distinctiveness of the two species populations, with hybrids occupying an intermediate genetic position between the two parental species [39]. Most populations of both species were genetically isolated, suggesting natal homing behaviour and highlighting the genetic diversity and distinct populations within A. alosa and A. fallax across their geographic range [39,82,83,84].
Based on the number of gill rakers, Alosa populations from the Lima River had a hybrid proportion of 17.8% [39]. In the current study, hybrids represent approximately 34% of the total number of individuals captured. The increase in the proportion of hybris may be exacerbated by the reduced area of available habitat and the consequent overlap of the breeding areas for both species. The percentage of hybridisation in the Minho River is approximately 4% when using gill raker numbers [11], but genetic analyses showed that the percentage of hybridisation could be as high as 31%. This highlights the need for further research to obtain more accurate data on these populations, as the status of A. fallax in this study was very reduced. This increased rate of hybridisation may increase genetic diversity through introgression by introducing novel alleles, but risks eroding species-specific genetic integrity, particularly for the declining A. fallax population [82]. Such hybridisation may compromise adaptive capacity, as hybrids may exhibit reduced fitness in specialized niches, altering spawning success and larval survival under environmental stressors such as drought or pollution [39].
Ecologically, the presence of hybrids affects the role of shads as prey for piscivorous fish and their contribution to nutrient cycling in riverine ecosystems. Hybrids may exhibit intermediate traits (e.g., spawning timing, habitat preference), potentially disrupting trophic interactions and competitive dynamics, particularly in the habitat-constrained Lima River [53]. Population structures are also affected, with increased hybridisation correlating with demographic shifts, such as reduced A. fallax abundance in both rivers, potentially destabilizing fisheries yields [53]. Adaptive responses, including shifts in spawning behavior to exploit overlapping habitats, may provide short-term resilience but exacerbate long-term genetic homogenisation, limiting evolutionary potential. The Touvedo dam in the Lima River is likely to exacerbate these effects by fragmenting habitats compared to the Frieira dam in the Minho River. Similar to the Minho River results, spawning marks were detected in 5.88% of all A. alosa analyzed, with the youngest male showing spawning marks at 5+ years of age and the oldest at 6+ years of age. This suggests that some fish return for a second spawning migration, consistent with the semelparous nature of this population observed in other European studies [85,86,87].
For both allis shad and hybrids, the comparison between sexes showed statistically significant differences, suggesting a possible influence of sex on the condition of the fish. However, no significant differences were found between the species studied, indicating a similar response to the environment and reproductive cycles. Regarding the relationship between the age of the fish and the condition factor, it was observed that different age groups showed distinct variations in K values. Both males and females showed a similar trend, with K values peaking at older ages.
The decrease in GSI values in July in the upper zones suggests that June is the optimal month for reproduction in the Lima, consistent with observations in the Minho River [11]. Statistical analyses show significant sex differences between months for both GSI and HSI, with females consistently having higher mean GSI values than males in both A. alosa and hybrid groups. For allis shad males, HSI increased and GSI decreased; for females, the inverse relationship was observed only in July. No differences were observed for hybrids.
Female fecundity is consistent with that described in previous studies [88], and increases with latitude [83,89,90]. A significant correlation between absolute fecundity and female body weight has been found in the Lima and other European/Moroccan allis shad populations [89,91], suggesting that larger females are more productive.

4.3. Trout (Salmo trutta)

Trout, scientifically known as Salmo trutta, is an iteroparous salmonid species found naturally in regions of Europe, North Africa, and western Asia [92].
In recent decades, trout populations have declined significantly in various regions, with European regions experiencing a decline in catch rates over the last few decades [93]. Similar declines have been observed globally, with hypotheses suggesting reduced marine survival associated with changes in food supply and increased parasite infestations associated with fish farming [93]. In freshwater, dam construction (disruption of spawning migrations), deforestation, drainage, straightening and channelization of watercourses, overfishing, poaching, and environmental degradation damage spawning areas [94,95]. The effects of mortality differ between the freshwater and marine phases of the life cycle of sea trout. Mortality in the freshwater phase, especially during early life stages, regulates sea trout populations, whereas mortality in the marine phase reduces their numbers [96].
In Portugal, the trout is classified as “Critically Endangered” for the migratory ecotype and “Near Threatened” for the resident ecotype [60]. It occurs in northern and central Portugal [97], and a significant decline in population viability has been recorded over much of its range [60,98].
This species is typically targeted by recreational fisheries, but commercial fishing in freshwater fishing is prohibited in Portugal. Despite its importance, the marine biology and ecology of sea trout remains poorly understood [93].
In the Lima River, trout provide an important recreational fishery [18]. Although recent studies characterize the Lima River as a good river for supporting trout populations [19], very few stock assessment studies have been carried out over the years [18,20]. Although fishing in the Lima River and its tributaries is regulated, it would be important to intensify fishing in areas without death.
The data show considerable variation in the trout length over the study period, suggesting dynamic growth patterns within the population. This variability is likely to be influenced, at least in part, by seasonal variations affecting trout growth rates [99].
Males showed negative allometric growth, possibly influenced by seasonal factors [100], as they were only caught during winter, and possibly in conjunction with intense competition for resources or increased predation pressure [101].
Analysis of the trout populations in the tributaries studied revealed a negative allometric growth, suggesting that individuals in these specific areas may be facing environmental challenges or competition for resources that affect their physical development.
Males were in relatively better physical condition, whereas females showed a pattern of variation with lower condition factor values, which may indicate periods of greater energetic stress, perhaps related to reproductive effort or intense resource competition.
In general, individuals from tributaries had higher condition values than those from the main river, possibly due to favourable habitat and food conditions.
There is an inverse relationship between HSI and GSI values. This can be explained by the allocation of energy resources during the reproductive period [102,103]. In the present study, significant peaks in GSI were observed in the months of March 2021 and November 2022, coinciding with the trout reproductive season. These peaks reflect fluctuations in the reproductive periods when compared to nearby rivers, such as the Minho River [97,104]. The decrease in average GSI values in the months following these peaks suggests a post-reproductive period, during which fish recover and accumulate energy reserves after spawning.
There was a low value of the HSI in March 2022 and from February to March 2023. This decrease can be attributed to the redirection of energy resources for reproduction, as the liver plays an important role in nutrient metabolism and detoxification, making it particularly sensitive to environmental changes during the reproductive period [37,105]. Differences were observed between undifferentiated individuals in different months, suggesting a differentiation between the reproductive months and the rest of the months, thus justifying the reason why it was not possible to access the sex of these individuals.
Studies on the diet of trout in the upper tributaries of the Seyhan and Euphrates rivers, in Turkey [46], and in the Vez River [106], revealed a diverse diet, including taxa such as Coleoptera and Gastropoda. These taxa, in addition to Teleostei and Atyaephyra desmarestii [107] and Hemiptera [106], were also found in the present study, indicating the consistency of trout diets in different regions.
In a study carried out in the Vez River [106], 98.9% of trout stomach contents were insects, with the remaining 0.8% divided between crustaceans (0.1%), molluscs (0.1%), and arachnids (0.6%). However, in the present study, although insects still made up the majority of stomach contents (66.9%), the relative abundance was significantly lower. Crustaceans and teleosts followed with 6.8% each, without the presence of arachnids, indicating an increase in the intake of crustaceans and fish. The presence of exotic species in the Lima River, such as Lepomis gibbosus, Gobio lozanoi, and Procambarus clarkii, found in the stomach contents of trout, may increase food availability. These differences in diet reflect variations in the availability of food resources between different habitats, as well as the dietary flexibility of the species, reinforcing the idea that Salmo trutta is a generalist-opportunistic species [108]. The selection of prey by trout is more related to their accessibility than to the individual size or weight of the species [109]. This observation may help to explain the dietary differences found between different studies and tributaries of the Lima River. In addition, the presence of 1.1% of plastic was detected in the stomachs analysed, indicating a possible environmental problem in the Lima River, which may have negative effects on the health of the trout, as the individuals studied had low K values, as well as on the ecological quality of the habitat.
The predominance of individuals in the 3+ age group suggests that this age may be a critical point in the development of the species, possibly indicating a high survival rate up to this particular age. Older trout require more territory and better-quality habitat, may be more vulnerable to predators (e.g., otters), and are more attractive to anglers.
The variation in length between different ages also provides an insight into the growth rates of trout. The observation of greater lengths at older ages is consistent with the fish continuing to grow throughout their lives. However, the wide range of lengths observed within each age group suggests that environmental factors, food availability, habitat conditions, and genetics can significantly influence individual growth [110].
It is important to emphasize that the data from the present study show a clear trend towards an increase in the mean length of trout with age. When comparing the results of the present study with previous studies carried out in different geographical regions, we observed a general agreement in the growth patterns of trout [111,112,113,114,115]. Variations in length of individuals within the same cohort may be influenced by several ecological factors, including competition for resources and predation, as well as possible changes in water quality [116,117]. The method of age determination may have also influenced these length differences. Individuals were assumed to be born on 1 April, which may explain the greater lengths observed in individuals caught in January and February compared to others of the same age, as well as the very low percentage of age 1+ individuals in the sample, which may have been influenced by the sampling techniques used, the mesh size of the nets, and the lack of upstream sampling in the tributaries.

4.4. European Eel (Anguilla anguilla)

The European eel, one of the most important high-value fish species [118], is known to be a catadromous and semelparous migratory species [119] with a complex and fascinating life cycle. A. anguilla is recognized as a key species in a variety of aquatic ecosystems and inhabits a wide range of environments including rivers, ponds, lakes, reservoirs, coastal tidal ponds, estuaries, and coastal areas [120]. The decline in numbers observed for this species in recent decades has led to its listing as “Critically Endangered” (CR) on the IUCN Red List [121].
The Iberian and Moroccan watersheds were disproportionately important compared to those in northern Europe, due to their proximity to the Sargasso Sea, but they experienced the most pronounced collapse of A. anguilla [122]. Within the Iberian Peninsula, the species is no longer present in major river basins such as the Ebro, Tagus, Douro, and Guadiana [123]. Extensive surveys carried out in the early 1980s showed that over 80% of Iberian rivers had lost their eel populations [124], with stocks completely absent in central Spain and Portugal [74,125]. The eel is currently classified as “Vulnerable” and “Endangered” in Spain and Portugal, respectively [60,123]. Yellow and silver eel fisheries are important in Galicia, Valencia, Catalonia, and Portugal. Notably, there are no professional yellow or silver eel fisheries in the Basque Country, Asturias, Cantabria, and in the international section of the Minho River. In Portugal, yellow eel fishing is regulated by eleven specific regulations for coastal waters (estuaries and coastal lagoons) and nine additional regulations for inland waters. These regulations define fishing areas and authorized river stretches, and lay down rules on fishing techniques, mesh sizes, species size limits, time limits, and species restrictions [74].
In contrast to Spain, where the practice of glass eel fishing is still allowed in some Region Basin Demarcations (RBDs), in Portugal glass eel fishing has been prohibited since 2000 in all river basins except for the Minho River [74]. Glass eel fishing has deep traditional roots in the Asturias and Galicia/North Portugal regions, particularly around the Minho River [126,127]. Despite the determined efforts by the Portuguese authorities (confiscation of numerous nets), illegal glass eel fishing remains a persistent problem throughout Portugal, particularly in the northern and central regions [126]. In the Lima estuary, the hydrophysical factors play a crucial role in shaping habitat characteristics, influencing the establishment, development, and functioning of fish communities [128]. It also revealed significant structural changes in the estuary, particularly in the lower estuary from 1933 to 2013 [128]. During this period, approximately 88% of vegetated areas, including salt marshes, disappeared due to land claims for agriculture, aquaculture, and coastal construction. The dominance of intertidal and shallow subtidal habitats with soft sediment and salt marshes decreased significantly, giving way to moderately deep to deep subtidal habitats. These changes had a notable impact on the estuarine ecosystem and the potential to disrupt the functioning of transitional aquatic habitats, particularly their secondary production, which in turn could affect the biomass of species such as A. anguilla.
The TL and TW values observed in the Lima River have the same distribution as those of eels from the Minho River [44]. The significant differences observed between the TL of undifferentiated individuals and males and females reflect the maturation state of smaller eels and a greater investment in TL than in TW.
The K values in the different sites are low compared to other rivers in the Iberian Peninsula [129], but they are average when compared to previous studies carried out in rivers located in the same area (i.e., Minho River) [130]. The patterns of increase in the condition factor observed over the months in females suggest a preparation for migration, with an increase in the weight of the individuals after the energetic investment to prepare for silvering. In the case of the undifferentiated eels, the opposite is true, as energy expenditure may increase as the eels grow towards sexual differentiation and adulthood. Age did not seem to have an effect on K, as the only significant difference was observed in females at 10 years of age.
The observed GSI values showed similar mean values throughout the months for males and females and showed an inverse correlation with the HSI, possibly due to the mobilization of reserves, for gonad formation, and reproduction at the seasonal level [131,132,133]. Furthermore, taking into account the age of the individuals studied, males and females show different patterns of variation between GSI and HSI with age, reflecting differences in reproductive strategies and energy allocation between the sexes, with males tending to reach sexual maturity earlier [134].
The data collected showed that the age of individuals varied between sampling sites. The Lima River presented older individuals (the majority of individuals were between 5 and 6 years old). A different age structure was observed in the tributaries, where all individuals analyzed were between 0 and 4 years old, with the exception of one 8-year-old individual.
There are no studies on the effects of environmental variability and differences in habitat suitability on the development of eels in the Lima River. However, these relationships have been observed in other basins with similar habitats. The shorter length-for-age and poorer body condition of eels collected in the tributaries compared to those in the main river may indicate that the tributaries are less suitable habitats for eel growth [44]. Previous studies have shown that growth tends to be greater in brackish environments and freshwater marshes close to the sea than in upstream freshwater habitats [135,136,137], due to higher productivity and food quality [138]. Although no productivity estimates are available for the tributaries of the Lima River, previous studies in nearby basins (Minho River) indicate that the food chains in these tributaries are mainly supported by detritus of aquatic and terrestrial origin [139]. The detrital pathway is generally considered to be less efficient than the phytoplankton pathway [140], which in this case is more associated with the estuary [141]. In addition, extreme hydrological regimes in tributaries, characterized by summer droughts and winter torrential floods, may influence fish responses and promote stressful conditions [142]. Eels in freshwater environments tend to have lower levels of fat accumulation and higher prevalence of the parasite A. crassus, which, together with the reductions in habitat quality and complexity due to human intervention, may place additional constraints on eel growth and development, with consequences for their performance, health, and survival [143,144,145]. The large variation in size between eels of the same age is consistent with findings from other studies [146]. The wide range of annual growth observed here is probably due to the variable growth rates of eels in general, and the faster growth may be related to the accelerated growth of eels in their first year after arrival in Europe. In the first year (and often the second), eels grew much faster than in subsequent years, doubling their size at the glass eel stage in a maximum of two years. This rapid increase in body size in the first year in Europe has been described previously [146,147]. However, the results of this study indicate that the rapid growth rate may also extend over several continental years [146,148], reflecting possible abiotic pressures. Compared to the present study, the mean annual length increase is higher in brackish water, as reported for the Guadalquivir estuary, Spain and Óbidos lagoon, Portugal, but similar to the values found in freshwater, as reported for the Minho River [44].
As expected for the area studied, the majority of the population is in the yellow eel phase. This is slightly consistent with the mean lengths at each site and with the sex determination of the individuals, where the majority (57.4%) were females. The values obtained are consistent with the ocular indices, which show a majority of immature individuals and a smaller but significant proportion of females in the resident, pre-migratory, and silver/migratory stages. The number of males in the migratory phase is much lower. Although population densities were not calculated, similar results in the Minho River suggest that the predominance of females may be related to a slight decrease in population density [130,149]. However, the sampling methods used also influence the composition of the individuals sampled, affecting the proportions of males and females. Male European eels typically begin their Atlantic migration when they reach a certain length and weight. In this study, their mean length falls at the lower end of the size range associated with the onset of migration [50]. This size suggests that these eels have spent about 3–4 years in the river. During this time, they grow and develop until they reach the stage of sexual maturity, which coincides with the start of their Atlantic migration [150]. For females, the mean length is outside the expected range for eels of this sex [50], including only the most extreme cases. This is in line with the index used [48], which identifies them as pre-migratory eels, although 1.9% of these females are silver migrants.
Parasite infection, in particular the non-native swim bladder nematode Anguillicola crassus Kuwahara, Niimi and Itagaki, 1974, which attributes its introduction and geographical area expansion to anthropogenic activities [151], may also contribute to eel population decline [152,153]. In particular, A. anguilla lacks an effective immune response to A. crassus [154]. This nematode is widespread throughout the Iberian Peninsula. Data on parasites and pathogens have been collected from various locations, including the Spanish Mediterranean basins, Asturias, and five Portuguese brackish water systems (Aveiro Lagoon, Óbidos lagoon, Tejo estuary, Santo André Lagoon, and Mira estuary), as well as the Minho and Mondego rivers [118,155,156,157]. The prevalence of A. crassus infection varied widely, ranging from 1.7% to 100% [126,127]. In recent years, this nematode was found in almost all samples from the Minho River [158] and in all A. anguilla samples from the Lima River (present study).
A gradual increase in prevalence was expected upstream due to decreasing salinity [159,160], but this was not found, as prevalence levels decreased in the upper tributaries. Low population densities may also explain the variation in prevalence [159], with higher population densities allowing for high prevalence levels. All eels showed pathological signs of infection in the swim bladder (100.0%) in the Lima River, but not in all tributaries. Most eels in the rivers were moderately affected, with a low percentage of individuals showing severe degeneration. Host size may be the most important factor in explaining variation in the swim bladder degenerative index [49]. A general increasing trend in damage is observed with increasing eel size (e.g., Minho River) [158]. Results from the Lima River indicate that the degree of swim bladder degeneration is not significantly related to parasite numbers. There was also a non-linear relationship between swim bladder damage and luminal parasite numbers, and in some cases, there were no signs of degeneration despite the presence of live nematodes. Several infection events are required for pathological changes in the swim bladder to become visible. In less severe cases, the absence of parasites may be caused by an inadequate food supply (destruction of the swim bladder capillary system, from which luminal worms actively feed), an inadequate habitat for larval development, or an acquired immune response by the host [49,161,162]. Regardless of the cause, severely infected eels are expected to provide an unfavourable environment for A. crassus invasion and survival [163]. Furthermore, the absence of parasites does not rule out the possibility that the eel has been repeatedly infected and severely affected in the past [164].
The influence of the parasite on the body condition of eels varies according to the authors. A positive relationship was observed in the Esva River when adult parasites were considered [129], while several studies documented no effect of A. crassus on body condition [158,165,166]. In the present study, we found that fish in better physical condition tended to have more parasites at different stages, so the physical condition of the fish may not be directly related to swim bladder degeneration (Table A3). Fish from the tributaries showed a moderate correlation between TL and TW, which is notably weaker than the strong correlation observed for eels from the Lima River. This suggests that the length–weight relationship is less consistent in tributary fish populations. The correlation between TL, TW, and the condition factor was positive but relatively weak, indicating a much weaker relationship between fish size and body condition compared to Lima River fish. The L4 phase showed a weak negative correlation with TL and TW, similar to the L3 pattern observed in Lima River fish (Table A4). Overall, parasite dynamics in tributary fish appear to be different from those in the main Lima River, with generally weaker length–weight correlations, but stronger relationships between weight and both parasite infections and swim bladder degeneration.
The fish lift in the Touvedo dam seems to help to confirm the data observed in eels from the Froufe River (tributary), as eel consumption has shown that there is no translocation of eels from areas below the dam [21].

5. Conclusions

The study of migratory fish species reveals the complex interplay of ecological factors affecting their populations, as the decline of this species can serve as an early indicator of ecosystem degradation, with potential cascading effects on nutrient cycling, food web dynamics, and the overall health of the river ecosystem. Conservation efforts must address multiple challenges simultaneously, as population declines cannot be attributed to single factors, but rather to a combination of human and environmental pressures. Barriers to migration, habitat destruction, overfishing, and pollution have led to a loss of suitable space and connectivity between vital habitats. In addition, climate change may alter the distribution of fish species, their assemblages, and species richness in each river basin [167]. Although there is still a lack of information on the conservation status, migratory behaviour, biology, genetics, and ecology of diadromous fish (e.g., the shad and sea lamprey populations of the Minho River have recently been studied [11,66,149]), it is clear that the general trend for these Iberian populations is a decline and that most species may disappear from most of their natural distribution in the Iberian Peninsula. Adaptation strategies need to anticipate shifts in migration timing, spawning conditions, and species distributions under projected climate scenarios in order to develop resilient conservation frameworks. Future studies should prioritize filling knowledge gaps in the marine life stages of diadromous species and use new technologies to better understand migration patterns and habitat use, and long-term monitoring programs using standardized protocols across catchments would allow more robust comparative analyses and improve detection of population trends.

Author Contributions

Conceptualization, L.P., U.A. and C.A.; methodology, L.P., U.A. and C.A.; validation, U.A. and C.A.; formal analysis, L.P.; investigation, L.P.; resources, C.A.; data curation, L.P.; writing—original draft preparation, L.P.; writing—review and editing, U.A. and C.A.; visualization, L.P.; supervision, U.A. and C.A.; project administration, L.P.; funding acquisition, U.A. and C.A. All authors have read and agreed to the published version of the manuscript.

Funding

This research received no external funding.

Institutional Review Board Statement

No animal experiments in laboratory were used in this work. Some fish were sacrificed according to legal procedures (Decree-Law No. 113/2013 of 7 August). All sampling techniques were carried out under Institute of Nature and Forest Conservation authorization (LICENÇA No. 115/2023/CAPT; CREDENCIAL PESCA No. 13/2023; LICENÇA No. 112/2023/CAPT CREDENCIAL PESCA No. 12/2023).

Informed Consent Statement

Not applicable.

Data Availability Statement

All data used in this study are available upon request from the corresponding author.

Acknowledgments

The authors would like to thank Rodrigo López for editing Figure 1 and thank Mafalda Fernandes, Nuno Gomes, and Inês Caldeira for their assistance in the field. Thanks are due to FCT for the financial support of CESAM (UID Centro de Estudos do Ambiente e Mar (CESAM) + LA/P/0094/2020).

Conflicts of Interest

The authors declare no conflicts of interest.

Appendix A

Table A1. Sampling effort and catch data for fish species collected in the Lima River using two fishing techniques: fyke nets and trammel nets. The table includes the total number of individuals captured (N) and the catch per unit effort (CPUE) for each species recorded in each sampling event. Sampling events span from October 2022 to July 2023, covering different seasons. Asterisks (*) in the dataset indicate days when no sampling effort of that technique was applied.
Sampling DateFyke NetsTrammel Nets
A. anguillaS. truttaP. marinusAlosa spp.S. truttaP. marinus
NCPUENCPUENCPUENCPUENCPUENCPUE
12 October 2022000000******
13 October 202210.50000******
15 October 2022000000******
18 October 202210.170000******
21 October 202210.110000******
22 October 202210.330000******
27 October 2022000000******
02 November 202210.130000******
04November 20220010.500******
04 November 202271.750000******
05 November 2022000000******
05 November 2022112200******
07 November 2022000000******
07 November 2022214200******
10 November 2022000000******
10 November 202210.3310.3300******
12November 2022210000******
12 November 202210.50000******
19 November 202230.520.3300******
25November 202210.110.100******
02 February 20230020.3300******
03 February 2023000000******
10 February 202340.4430.3300******
14 February 202330.2530.2500******
16 February 2023000010.25******
16 February 202310.50000******
25 February 202310.110000002100
28 February 202310.110000******
04March 202310.110000******
08 March 202320.2520.2500******
11 March 2023000000******
17 March 2023000000******
20 March 202340.3310.0800******
25 March 2023******006300
01 April 2023******004210.5
02 April 2023******000010.5
03 April 202310.1310.1300000010.5
04 April 2023******0010.500
05 April 2023******10.50000
13 April 2023******000052.5
21 April 2023******002110.5
23 April 2023******0010.500
24 April 2023******000010.5
25 April 2023******0031.500
26 April 2023******000010.5
27 April 2023******000031.5
28 April 2023******002121
29 April 2023******31.531.531.5
02May 2023******31.510.500
03 May 2023******004200
04 May 2023******0010.521
06 May 202310.1710.170010.50000
07 May 2023******6310.531.5
08 May 2023******212131.5
09 May 2023******10.50000
10 May 2023******52.54200
11 May 202380.8970.7800000031.5
12 May 2023******10.50000
13 May 2023******212100
16 May 2023******31.50000
17 May 202320.1330.20052.50000
19 May 2023******94.52110.5
20 May 202310.1710.1700******
21 May 2023******2110.500
24 May 2023******31.510.500
25 May 2023******630000
26 May 2023******210000
30 May 2023******000052.5
23 June 2023******178.50000
13 June 2023******8410.500
14 June 2023******000000
27 June 2023******0010.500
Table A2. Otolith radius measurements (mean ± SD) across different age classes for A. anguilla sampled from the Lima River and its tributaries. The number of individuals measured (N) is also provided for each category. * No data.
AgeLima RiverTributaries
Otolith Radius (mm)NOtolith Radius (mm)N
0**0.34 ± 0.034
10.4010.46 ± 0.0815
20.7910.78 ± 0.1813
31.14 ± 0.2060.99 ± 0.107
41.32 ± 0.1461.08 ± 0.116
51.38 ± 0.1915**
61.68 ± 0.208**
71.68 ± 0.278**
81.89 ± 0.1531.521
92.24 ± 0.162**
102.20 ± 0.172**
Table A3. Correlations between variables measured in European eel from the Lima River. The variables included are: total length of the fish (TL), total weight of the fish (TW), condition factor (K), parasite number, parasite stages (larval stage L3, larval stage L4, adult males and females) and swim bladder degenerative index (SDI). * p-values < 0.05; ** p-values < 0.01.
VariableTL (cm)TW (g)KParasite NumberParasite StageSDI
L3L4MaleFemale
TL (cm)1.0000.9680.357 **0.281 *−0.1490.1220.333 *0.2590.160
TW (g)0.9681.0000.529 **0.241−0.1970.1010.281 *0.2440.210
K0.357 **0.529 **1.000−0.044−0.1230.001−0.1320.0530.261
Parasite number0.281 *0.241−0.0441.0000.1030.476 **0.775 **0.858 **0.063
Parasite stageL3−0.149−0.197−0.1230.1031.0000.067−0.107−0.059−0.170
L40.1220.1010.0010.4760.0671.0000.1590.1180.002
Male0.333 *0.281 *−0.1320.775−0.1070.1591.0000.655 **−0.053
Female0.2590.2440.0530.858−0.0590.1180.655 **1.0000.160
SDI0.1600.2100.2610.063−0.1700.002−0.0530.1601.000
Table A4. Correlations between variables measured in European eel from the tributaries. The variables included are: total length of the fish (TL), total weight of the fish (TW), condition factor (K), parasite number, parasite stages (larval stage L3, larval stage L4, adult males and females) and swim bladder degenerative index (SDI). * p-values < 0.05; ** p-values < 0.01.
VariableTL (cm)TW (g)KParasite NumberParasite StageSDI
L4MaleFemale
TL (cm)1.0000.606 **0.1110.188−0.0170.1230.2540.321 *
TW (g)0.606 **1.0000.1920.356 *−0.1390.2220.556**0.445 **
K0.1110.1921.0000.098−0.005−0.0050.226−0.041
Parasite number0.1880.356 *0.0981.0000.412 **0.884 **0.739 **0.128
Parasite stageL4−0.017−0.139−0.0050.412 **1.0000.2120.033−0.052
Male0.1230.222−0.0050.884 **0.2121.0000.439 **0.073
Female0.2540.556 **0.2260.739 **0.0330.439 **1.0000.212
SDI0.321 *0.445 **−0.0410.128−0.0520.0730.2121.000

References

  1. Guidetti, P.; Fanelli, G.; Fraschetti, S.; Terlizzi, A.; Boero, F. Coastal fish indicate human-induced changes in the Mediterranean littoral. Mar. Environ. Res. 2002, 53, 77–94. [Google Scholar] [CrossRef] [PubMed]
  2. Moraga, D.; Vivancos, A.; Ruiz, V.H.; Rojas, O.; Díaz, G.; Manosalva, A.; Vega, P.; Habit, E. A century of anthropogenic river alterations in a highly diverse river coastal basin: Effects on fish assemblages. Front. Environ. Sci. 2022, 10, 943586. [Google Scholar] [CrossRef]
  3. Craig, J.F. Introduction. In Freshwater Fisheries Ecology; John Wiley & Sons, Ltd.: Hoboken, NJ, USA, 2015; pp. 1–4. [Google Scholar]
  4. Hughes, R.M. Recreational fisheries in the USA: Economics, management strategies, and ecological threats. Fish. Sci. 2015, 81, 1–9. [Google Scholar] [CrossRef]
  5. Helfman, G. Fish Conservation: A Guide to Understanding and Restoring Global Aquatic Biodiversity and Fishery Resources; Bibliovault OAI Repository, the University of Chicago Press: Chicago, IL, USA, 2008. [Google Scholar] [CrossRef]
  6. Darwall, W.R.T.; Freyhof, J. Lost fishes, who is counting? The extent of the threat to freshwater fish biodiversity. In Conservation of Freshwater Fishes; Closs, G.P., Krkosek, M., Olden, J.D., Eds.; Conservation Biology; Cambridge University Press: Cambridge, UK, 2015; pp. 1–36. [Google Scholar]
  7. Thibault, M. Éléments de la problématique du saumon Atlantique en France. In La Restauration des Rivières à Saumon; Thibault, M., Billard, R., Eds.; INRA: Paris, France, 1987; pp. 413–425. [Google Scholar]
  8. Dadswell, M.; Spares, A.; Reader, J.; McLean, M.; McDermott, T.; Samways, K.; Lilly, J. The Decline and Impending Collapse of the Atlantic Salmon (Salmo salar) Population in the North Atlantic Ocean: A Review of Possible Causes. Rev. Fish. Sci. Aquac. 2021, 30, 215–258. [Google Scholar] [CrossRef]
  9. Denis, J.; Lepage, M.; Gruselle, M.-C.; Amara, R. The Influence of Natural and Anthropogenic Environmental Pressures on European Eel Abundances in French Estuaries. Fishes 2024, 9, 44. [Google Scholar] [CrossRef]
  10. Pelster, B. Swimbladder Function in the European Eel Anguilla anguilla. Fishes 2023, 8, 125. [Google Scholar] [CrossRef]
  11. Mota, M.; Bio, A.; Bao, M.; Pascual, S.; Rochard, E.; Antunes, C. New insights into biology and ecology of the Minho River Allis shad (Alosa alosa L.): Contribution to the conservation of one of the last European shad populations. Rev. Fish Biol. Fisher 2015, 25, 395–412. [Google Scholar] [CrossRef]
  12. Azeiteiro, U.M.; Pereira, M.J.; Soares, A.M.V.M.; Braga, H.O.; Morgado, F.; Sousa, M.C.; Dias, J.M.; Antunes, C. Dynamics of Two Anadromous Species in a Dam Intersected River: Analysis of Two 100-Year Datasets. Fishes 2021, 6, 21. [Google Scholar] [CrossRef]
  13. Antunes, C.; Cobo, F.; Araújo, M.J. Iberian inland fisheries. In Freshwater Fisheries Ecology; John Wiley & Sons, Ltd.: Hoboken, NJ, USA, 2015; pp. 268–282. [Google Scholar]
  14. Chang, H.Y.; McKown, K.; Chen, Y. A long-term ichthyoplankton monitoring program suggests climate-induced environmental variabilities changed fish communities in the Hudson River estuary. Front. Mar. Sci. 2023, 9, 1077997. [Google Scholar] [CrossRef]
  15. Palmer, M.A.; Lettenmaier, D.P.; Poff, N.L.; Postel, S.L.; Richter, B.; Warner, R. Climate Change and River Ecosystems: Protection and Adaptation Options. Environ. Manag. 2009, 44, 1053–1068. [Google Scholar] [CrossRef]
  16. Sousa, J. Fase larvar e metamorfose da população de lampreia (Petromyzon marinus L.) do Rio Lima. Publicações avulsas INIP 1992, 17, 199–227. [Google Scholar]
  17. Costa, M.J.; Almeida, P.R.; Domingos, I.M.; Costa, J.L.; Correia, M.J.; Chaves, M.L.; Teixeira, C.M. Present status of the main shads’ populations in Portugal. Bull. Fr. Pêche Piscic. 2001, 1109–1116. [Google Scholar] [CrossRef]
  18. Valente, A. Trout populations in the lima basin, north Portugal. Management of Freshwater Fisheries. In Proceedings of the Symposium EIFAC, Gothenburg, Sweden, 31 May–3 June 1988; Van Densen, W.L., Steinmetz, T.B., Hugues, R.H., Eds.; pp. 437–446. [Google Scholar]
  19. Sá, F.M.S. Estado de Populações de truta-de-rio em Portugal: Influência de Fatores Ambientais, Bióticos e do Ordenamento da Pesca. Master’s Thesis, Universidade de Lisboa Portugal, Lisboa, Portugal, 2021. [Google Scholar]
  20. Maia, C.; Valente, A. The brown trout Salmo trutta L. populations in the river Lima catchment. Limnetica 1999, 17, 119–126. [Google Scholar] [CrossRef]
  21. Santos, J.M.; Ferreira, M.T.; Godinho, F.N.; Bochechas, J. Performance of fish lift recently built at the Touvedo Dam on the Lima River, Portugal. J. Appl. Ichthyol. 2002, 18, 118–123. [Google Scholar] [CrossRef]
  22. Santos, J.M.; Godinho, F.; Ferreira, M.T.; Cortes, R. The organisation of fish assemblages in the regulated Lima basin, Northern Portugal. Limnologica 2004, 34, 224–235. [Google Scholar] [CrossRef]
  23. Mameri, D.; Rivaes, R.; Oliveira, J.M.; Pádua, J.; Ferreira, M.T.; Santos, J.M. Passability of Potamodromous Species through a Fish Lift at a Large Hydropower Plant (Touvedo, Portugal). Sustainability 2020, 12, 172. [Google Scholar] [CrossRef]
  24. Baeta, A.; Vieira, L.R.; Lírio, A.V.; Canhoto, C.; Marques, J.C.; Guilhermino, L. Use of stable isotope ratios of fish larvae as indicators to assess diets and patterns of anthropogenic nitrogen pollution in estuarine ecosystems. Ecol. Indic. 2017, 83, 112–121. [Google Scholar] [CrossRef]
  25. Pereira, H.; Sousa, M.C.; Vieira, L.R.; Morgado, F.; Dias, J.M. Modelling Salt Intrusion and Estuarine Plumes under Climate Change Scenarios in Two Transitional Ecosystems from the NW Atlantic Coast. J. Mar. Sci. Eng. 2022, 10, 262. [Google Scholar] [CrossRef]
  26. Caetano, M.; Raimundo, J.; Nogueira, M.; Santos, M.; Mil-Homens, M.; Prego, R.; Vale, C. Defining benchmark values for nutrients under the Water Framework Directive: Application in twelve Portuguese estuaries. Mar. Chem. 2016, 185, 27–37. [Google Scholar] [CrossRef]
  27. Costa, N.C.; Venâncio, S.; Pinho, J.L.; Vieira, J.M. Morphodynamics of the River Lima Estuary (NW Portugal). In Proceedings of the 2nd International Conference on Integrated Environmental Management for Sustainable Development, Hammamet, Tunisia, 27–30 October 2016. [Google Scholar]
  28. Oliveira, V.H.; Sousa, M.C.; Picado, A.; Mendes, R.; Ribeiro, A.S.; Morgado, F.; Dias, J.M. Coupled modelling of the interaction between dissolved substances emitted by Minho and Lima estuarine outflows (Portugal). J. Mar. Syst. 2021, 222, 103601. [Google Scholar] [CrossRef]
  29. Pinho, J.L.S.; Vieira, J.M.P. Mathematical Modelling of Salt Water Intrusion in a Northern Portuguese Estuary; IAHS-Aish Press: Wallingford UK, 2007; Volume 310, p. 277. [Google Scholar]
  30. Rocha, M.J.; Cruzeiro, C.; Reis, M.; Pardal, M.A.; Rocha, E. Spatial and seasonal distribution of 17 endocrine disruptor compounds in an urban estuary (Mondego River, Portugal): Evaluation of the estrogenic load of the area. Environ. Monit. Assess 2014, 186, 3337–3350. [Google Scholar] [CrossRef]
  31. Fais, M.; Bellisario, B.; Duarte, S.; Vieira, P.E.; Sousa, R.; Canchaya, C.; Costa, F.O. Meiofauna metabarcoding in Lima estuary (Portugal) suggests high taxon replacement within a background of network stability. Reg. Stud. Mar. Sci. 2020, 38, 101341. [Google Scholar] [CrossRef]
  32. Sousa, R.; Dias, S.; Antunes, J.C. Spatial Subtidal Macrobenthic Distribution in Relation to Abiotic Conditions in the Lima Estuary, NW of Portugal. Hydrobiologia 2006, 559, 135–148. [Google Scholar] [CrossRef]
  33. Ilarri, M.; Souza, A.T.; Dias, E.; Antunes, C. Influence of climate change and extreme weather events on an estuarine fish community. Sci. Total Environ. 2022, 827, 154190. [Google Scholar] [CrossRef]
  34. Tesch, F.W. Age and growth. In Methods for Assessment of Fish Production in Fresh Waters; Ricker, W.E., Ed.; Blackwell Scientific Publications: Oxford, UK, 1971; pp. 99–130. [Google Scholar]
  35. Pauly, D. A mechanism for the juvenile-to-adult transition in fishes. ICES J. Mar. Sci. 1984, 41, 280–284. [Google Scholar] [CrossRef]
  36. Fulton, T.W. The Rate of Growth of Fishes. In 20th Annual Report of the Fishery Board of Scotland; London, 1902; Volume 3, pp. 326–446. [Google Scholar]
  37. Sindhe, V.R.; Kulkarni, R.S. Gonadosomatic and hepatosomatic indices of the freshwater fish Notopterus notopterus (Pallas) in response to some heavy metal exposure. J. Environ. Biol. 2004, 25, 365–368. [Google Scholar]
  38. Karaytug, S.; Erdem, C.; Cicik, B.; Ay, Ö. Effects of copper on hepatosomatic index, gonadosomatic index and condition factor of Oreochromis niloticus (L. 1758). Fresen Environ. Bull. 2007, 16, 1355–1358. [Google Scholar]
  39. Alexandrino, P.; Faria, R.; Linhares, D.; Castro, F.; Le Corre, M.; Sabatié, R.; Baglinière, J.L.; Weiss, S. Interspecific differentiation and intraspecific substructure in two closely related clupeids with extensive hybridization, Alosa alosa and Alosa fallax. J. Fish Biol. 2006, 69, 242–259. [Google Scholar] [CrossRef]
  40. Baglinière, J.L.; Sabatié, M.R.; Aprahamian, M.W.; Alexandrino, P.; Aprahamian, C.D.; Assis, C.A.; Cassou-Leins, J.J.; Le Corre, M.; Mennesson-Boisneau, C.; Martin-Vandembulcke, D.; et al. A guide to scale interpretation and age estimation for the East-Atlantic and West-Mediterranean shads (Alosa spp.). Bull. Fr. Peche Piscic 2001, 357–360, 496–531. [Google Scholar]
  41. Panfili, J.; De Pontual, H.; Troadec, H.; Wright, P. Manual of Fish Sclerochronology; Ifremer-IRD coedition: Brest, France, 2002; Volume 2004. [Google Scholar]
  42. ICES. Third Workshop on Age Reading of European and American Eel (WKAREA3). ICES Sci. Rep./Rapp. Sci. Du CIEM 2020, 2, 34. [Google Scholar] [CrossRef]
  43. Vigliola, L.; Meekan, M. The Back-Calculation of Fish Growth From Otoliths. In Tropical Fish Otoliths: Information for Assessment, Management and Ecology; Springer Netherlands: Dordrecht, The Netherlands, 2009; pp. 174–211. [Google Scholar]
  44. Moura, A.; Dias, E.; López, R.; Antunes, C. Regional Population Structure of the European Eel at the Southern Limit of Its Distribution Revealed by Otolith Shape Signature. Fishes 2022, 7, 135. [Google Scholar] [CrossRef]
  45. Mota, M. Biology and Ecology of the Allis Shad, Alosa alosa (Linnaeus, 1758), in the Minho River. Ph.D Thesis, University of Porto, Porto, Portugal, 2014; p. 200. [Google Scholar]
  46. Kara, C.; Alp, A. Feeding habits and diet composition of brown trout (Salmo trutta) in the upper streams of River Ceyhan and River Euphrates in Turkey. Turk J. Vet. Anim. Sci. 2005, 29, 417–428. [Google Scholar]
  47. Durif, C.M.F.; Diserud, O.H.; Sandlund, O.T.; Thorstad, E.B.; Poole, R.; Bergesen, K.; Escobar-Lux, R.H.; Shema, S.; Vollestad, L.A. Age of European silver eels during a period of declining abundance in Norway. Ecol. Evol. 2020, 10, 4801–4815. [Google Scholar] [CrossRef]
  48. Durif, C.; Guibert, A.; Elie, P. Morphological discrimination of the silvering stages of the European eel. In American Fisheries Society Symposium 2009; American Fisheries Society: New York, NY, USA, 2009; Volume 58, pp. 103–111. [Google Scholar]
  49. Lefebvre, F.; Contournet, P.; Crivelli, A.J. The health state of the eel swimbladder as a measure of parasite pressure by. Parasitology 2002, 124, 457–463. [Google Scholar] [CrossRef]
  50. Tesch, F.W. The Eel: Third Edition; Blackwell Science: Oxford, UK, 2007; pp. 1–408. [Google Scholar]
  51. Rasband, W. ImageJ; v. 1.50i; National Institute of Health: Bethesda, MD, USA, 2009. [Google Scholar]
  52. Bryan, M.B.; Zalinski, D.; Filcek, K.B.; Libants, S.; Li, W.; Scribner, K.T. Patterns of invasion and colonization of the sea lamprey (Petromyzon marinus) in North America as revealed by microsatellite genotypes. Mol. Ecol. 2005, 14, 3757–3773. [Google Scholar] [CrossRef]
  53. Stratoudakis, Y.; Mateus, C.S.; Quintella, B.R.; Antunes, C.; de Almeida, P.R. Exploited anadromous fish in Portugal: Suggested direction for conservation and management. Mar. Policy 2016, 73, 92–99. [Google Scholar] [CrossRef]
  54. Lucas, M.C.; Hume, J.B.; Almeida, P.R.; Aronsuu, K.; Habit, E.; Silva, S.; Wang, C.J.; Zampatti, B. Emerging conservation initiatives for lampreys: Research challenges and opportunities. J. Great Lakes Res. 2021, 47, S690–S703. [Google Scholar] [CrossRef]
  55. Braga, H.O.; Pereira, M.J.; Morgado, F.; Soares, A.M.; Azeiteiro, U.M. Ethnozoological knowledge of traditional fishing villages about the anadromous sea lamprey (Petromyzon marinus) in the Minho river, Portugal. J. Ethnobiol. Ethnomed. 2019, 15, 71. [Google Scholar] [CrossRef]
  56. Beaulaton, L.; Taverny, C.; Castelnaud, G. Fishing, abundance and life history traits of the anadromous sea lamprey (Petromyzon marinus) in Europe. Fish. Res. 2008, 92, 90–101. [Google Scholar] [CrossRef]
  57. Boulêtreau, S.; Carry, L.; Meyer, E.; Filloux, D.; Menchi, O.; Mataix, V.; Santoul, F. High predation of native sea lamprey during spawning migration. Sci. Rep. 2020, 10, 6122. [Google Scholar] [CrossRef]
  58. Moser, M.L.; Hume, J.B.; Aronsuu, K.K.; Lampman, R.T.; Jackson, A.D. Lamprey Reproduction and Early Life History: Insights from Artificial Propagation. In Lampreys: Biology, Conservation and Control, Fish & Fisheries Series; Docker, M., Ed.; Springer: Dordrecht, The Netherlands, 2019; Volume 38. [Google Scholar] [CrossRef]
  59. Mateus, C.S.; Rodríguez-Muñoz, R.; Quintella, B.R.; Alves, M.J.; Almeida, P.R. Lampreys of the Iberian Peninsula: Distribution, population status and conservation. Endanger. Species Res. 2012, 16, 183–198. [Google Scholar] [CrossRef]
  60. Magalhães, M.F.; Amaral, S.D.; Sousa, M.; Alexandre, C.M.; Almeida, P.R.; Alves, M.J.; Cortes, R.; Farrobo, A.; Filipe, A.F.; Franco, A.; et al. Livro Vermelho dos Peixes Dulciaquícolas e Diádromos de Portugal Continental; FCiências.ID & ICNF-Instituto da Conservação da Natureza e das Florestas: Lisboa, Portugal, 2023. [Google Scholar]
  61. Santos, J.M.; Ferreira, M.T.; Godinho, F.N.; Bochechas, J. Efficacy of a nature-like bypass channel in a Portuguese lowland river. J. Appl. Ichthyol. 2005, 21, 381–388. [Google Scholar] [CrossRef]
  62. Duarte, A.; Jorge, I.; Sobral, M.; Rebordão, F.; Martins, R.; Carneiro, M. Rendimento do Botirão Usado na Captura da Lampreia Petromyzon marinus L., 1758 no Estuário do rio Mondego; Relatórios Científicos e Técnicos-Série Digital: Lisboa, Portugal, 2003; pp. 1–27. [Google Scholar]
  63. Quintella, B.R.; Andrade, N.O.; Almeida, P.R. Distribution, larval stage duration and growth of the sea lamprey ammocoetes, Petromyzon marinus L., in a highly modified river basin. Ecol. Freshw. Fish 2003, 12, 286–293. [Google Scholar] [CrossRef]
  64. Gonçalves, M.S.A. Caracterização da Pesca da Lampreia-Marinha, Petromyzon marinus L., no Estuário do Cávado, em 2002. Master’s Thesis, University of Algarve, Faro, Portugal, 2004. [Google Scholar]
  65. Beamish, F.W.H.; Potter, I.C.; Thomas, E. Proximate Composition of the Adult Anadromous Sea Lamprey, Petromyzon Marinus, in Relation to Feeding, Migration and Reproduction. J. Anim. Ecol. 1979, 48, 1–19. [Google Scholar] [CrossRef]
  66. Araújo, M.J.; Ozório, R.O.A.; Bessa, R.J.B.; Kijjoa, A.; Gonçalves, J.F.M.; Antunes, C. Nutritional status of adult sea lamprey (Petromyzon marinus Linnaeus, 1758) during spawning migration in the Minho River, NW Iberian Peninsula. J. Appl. Ichthyol. 2013, 29, 808–814. [Google Scholar] [CrossRef]
  67. Tocher, D.R. Metabolism and functions of lipids and fatty acids in teleost fish. Rev. Fish Sci. 2003, 11, 107–184. [Google Scholar] [CrossRef]
  68. Mesa, M.G.; Bayer, J.M.; Seelye, J.G. Swimming performance and physiological responses to exhaustive exercise in radio-tagged and untagged Pacific lampreys. Trans. Am. Fish. Soc. 2003, 132, 483–492. [Google Scholar] [CrossRef]
  69. Quintella, B.R.; Póva, I.; Almeida, P.R. Swimming behaviour of upriver migrating sea lamprey assessed by electromyogram telemetry. J. Appl. Ichthyol. 2009, 25, 46–54. [Google Scholar] [CrossRef]
  70. ICES. Report of the Workshop on Lampreys and Shads (WKLS); ICES CM 2014/SSGEF:13; ICES: Lisbon, Portugal, 2015; p. 206. [Google Scholar]
  71. Volk, J.; Bekkevold, D.; Loeschcke, V. Weak population differentiation in northern European populations of the endangered anadromous clupeid. J. Fish Biol. 2007, 71, 461–469. [Google Scholar] [CrossRef]
  72. Jager, Z.; Bolle, L.; Dänhardt, A.; Diederichs, B.; Neudecker, T.; Scholle, J.; Vorberg, R. Fish. Thematic Report No. 14: Fishes Checklist; OBIS Secretariat: Wilhelmshaven, Germany, 2009. [Google Scholar] [CrossRef]
  73. Scholle, J.; Schuchardt, B. A fish-based index of biotic integrity–FAT-TW an assessment tool for transitional waters of the northern German tidal estuaries. Coastline Rep. 2012, 18, 1–73. [Google Scholar]
  74. Mota, M.; Rochard, E.; Antunes, C. Status of the Diadromous Fish of the Iberian Peninsula: Past, Present and Trends. Limnetica 2016, 35, 1–18. [Google Scholar]
  75. Alexandrino, P.; Boisneau, P.H. Diversité Génétique; Les Aloses (Alosa alosa et Alosa fallax spp.). In Écobiologie et variabilité des populations; Baglinière, J.L., Elie, P., Eds.; INRA/CEMAGREF: Paris, France, 2000; pp. 179–198. [Google Scholar]
  76. Alexandrino, P.; Ferrand, N.; Baglinière, J.-L. Preliminary Results on the Genetic Differentiation Between the Two Species of Shad (Alosa alosa and Alosa fallax) Occuring in Portugal; ICES Paper CM-1992/M17; EQHC: Rennes Cedex, France, 1992; pp. 1–10. [Google Scholar]
  77. Boisneau, P.; Mennesson Boisneau, C.; Guyomard, R. Electrophoretic Identity between Allis Shad, Alosa alosa (L), and Twaite Shad, Alosa fallax (Lacepede). J. Fish Biol. 1992, 40, 731–738. [Google Scholar] [CrossRef]
  78. Faria, R.; Weiss, S.; Alexandrino, P. Comparative phylogeography and demographic history of European shads (Alosa alosa and A. fallax) inferred from mitochondrial DNA. BMC Evol. Biol. 2012, 12, 194. [Google Scholar] [CrossRef] [PubMed]
  79. Rougier, T.; Lambert, P.; Drouineau, H.; Girardin, M.; Castelnaud, G.; Carry, L.; Aprahamian, M.; Rivot, E.; Rochard, E. Collapse of allis shad, Alosa alosa, in the Gironde system (southwest France): Environmental change, fishing mortality, or Allee effect? Ices J. Mar. Sci. 2012, 69, 1802–1811. [Google Scholar] [CrossRef]
  80. Maitland, P.S.; Lyle, A.A. Ecology of allis shad Alosa alosa and twaite shad Alosa fallax in the Solway Firth, Scotland. Hydrobiologia 2005, 534, 205–221. [Google Scholar] [CrossRef]
  81. Faria, R. Estudo de Processos Evolutivos e Filogeografia em Espécies Europeias do Género Alosa. (Study of Evolutionary Processes and Phylogeography in European Species of the Genus Alosa). Ph.D. Thesis, University of Porto, Porto, Portugal, 2007. [Google Scholar]
  82. Jolly, M.T.; Aprahamian, M.W.; Hawkins, S.J.; Henderson, P.A.; Hillman, R.; O’Maoiléidigh, N.; Maitland, P.S.; Piper, R.; Genner, M.J. Population genetic structure of protected allis shad (Alosa alosa) and twaite shad (Alosa fallax). Mar. Biol. 2012, 159, 675–687. [Google Scholar] [CrossRef]
  83. Martin, J.; Rougemont, Q.; Drouineau, H.; Launey, S.; Jatteau, P.; Bareille, G.; Berail, S.; Pécheyran, C.; Feunteun, E.; Roques, S.; et al. Dispersal capacities of anadromous Allis shad population inferred from a coupled genetic and otolith approach. Can. J. Fish. Aquat. Sci. 2015, 72, 991–1003. [Google Scholar] [CrossRef]
  84. Rougemont, Q.; Perrier, C.; Besnard, A.L.; Lebel, I.; Abdallah, Y.; Feunteun, E.; Réveillac, E.; Lasne, E.; Acou, A.; Nachón, D.J.; et al. Population genetics reveals divergent lineages and ongoing hybridization in a declining migratory fish species complex. Heredity 2022, 129, 137–151. [Google Scholar] [CrossRef]
  85. Boisneau, C.; Aprahamian, M.W.; Sabatié, M.R.; Cassou-Leins, J.J. Remontée migratoire des adultes. In Les aloses (Alosa alosa et Alosa fallax spp.): Ecobiologie et Variabilité des Populations; INRA Editions (coll. Hydrobiologie et Aquaculture): Versailles, France, 2000. [Google Scholar]
  86. Aprahamian, M.W.; Baglinière, J.L.; Sabatié, M.R.; Alexandrino, P.; Aprahamian, C.D. Synopsis of Biological Data on Alosa alosa and Alosa fallax spp.; Environment Agency R&D Dissemination Center, WRc: Swindon, UK, 2002; p. 314. [Google Scholar]
  87. Maitland, P.; Hatton-Ellis, T. Ecology of the Allis and Twaite Shad. Conserving Natura 2000 Rivers Ecology Series Nº 3; English Nature: Peterborough, UK, 2003. [Google Scholar]
  88. Baglinière, J.-L.; Sabatié, M.R.; Rochard, E.; Alexandrino, P.; Aprahamian, M.W. The allis shad Alosa alosa: Biology, ecology, range, and status of populations. Am. Fish. Soc. Symp. 2003, 2003, 85–102. [Google Scholar]
  89. Eiras, J.C. Contribuição para o Conhecimento da Biologia de Alosa alosa L. Estudo de Algumas Modificações Somáticas, Fisiológicas e Bioquímicas Durante a Migração Anádroma No Rio Douro. Ph.D. Thesis, Faculty of Sciences of University of Porto, Porto, Portugal, 1981. [Google Scholar]
  90. Sabatié, M.R.; Alexandrino, P.; Baglinière, J.-L. Comparaison des caractéristiques biologiques de la Grande Alose (Alosa alosa) dans l’oued Sebou (façade Nord-Atlantique du Maroc) et dans le fleuve Lima (Portugal). Cybium. Cybium 1996, 20, 59–73. [Google Scholar]
  91. Aprahamian, M.; Aprahamian, C.; Baglinière, J.; Sabatié, R.; Alexandrino, P. Alosa alosa and Alosa fallax spp.: Literature Review and Bibliography; Environment Agency: Warrington, UK, 2003. [Google Scholar]
  92. McIntosh, A.; McHugh, P.; Budy, P. Salmo trutta L. (brown trout). In A Handbook of Global Freshwater Invasive Species; Routledge: Oxfordshire, UK, 2011; pp. 285–298. [Google Scholar]
  93. ICES. Report of the Workshop on Sea Trout (WKTRUTTA); ICES Expert Group Reports (Until 2018); ICES: Toronto, ON, Canada, 2013. [Google Scholar]
  94. Lundqvist, H.; McKinnell, S.M.; Jonsson, S.; Östergren, J. Is Stocking with Sea Trout Compatible with the Conservation of Wild Trout (Salmo trutta L.)? In Sea Trout Biology, Conservation and Management; Wiley: Hoboken, NJ, USA, 2006; pp. 356–371. [Google Scholar]
  95. Okumuş, I.; Kurtoglu, I.Z.; Atasaral, Ş. General Overview of Turkish Sea Trout (Salmo trutta L.) Populations. In Sea Trout: Biology, Conservation and Management; Wiley: Hoboken, NJ, USA, 2007; pp. 115–127. [Google Scholar]
  96. Jonsson, B.; Jonsson, N. Ecology of Atlantic salmon and Brown Trout: Habitat as A Template for Life Histories; Springer: Berlin/Heidelberg, Germany, 2011; Volume 33. [Google Scholar]
  97. Collares-Pereira, M.J.; Alves, M.J.; Ribeiro, F.; Domingos, I.; Almeida, P.R.; da Costa, L.; Gante, H.; Filipe, A.F.; Aboim, M.A.; Rodrigues, P.M.; et al. Guia dos Peixes de Água Doce e Migradores de Portugal Continental; Edições Afrontamento: Porto, Portugal, 2021. [Google Scholar]
  98. Rogado, L.C.; Alexandrino, P.; Almeida, P.R.; Alves, J.; Bochechas, J.; Cortes, R.; Domingos, I.; Filipe, F.; Madeira, J.; Magalhães, F. Salmo trutta: Truta-marisca. In Livro Vermelho dos Vertebrados de Portugal; Cabral, M.J., Almeida, J., Almeida, P.R., Dellinger, T., Ferrand de Almeida, N., Oliveira, M.E., Palmeirim, J.M., Queirós, A.I., Rogado, L., Santos-Reis, M., Eds.; Instituto da Conservação da Natureza: Lisbon, Portugal, 2005; pp. 105–106. [Google Scholar]
  99. Olsen, E.M.; Knutsen, H.; Simonsen, J.H.; Jonsson, B.; Knutsen, J.A. Seasonal variation in marine growth of sea trout, Salmo trutta, in coastal Skagerrak. Ecol. Freshw. Fish 2006, 15, 446–452. [Google Scholar] [CrossRef]
  100. Arslan, M.; Yildirim, A.; Bektas, S. Length-weight relationship of brown trout, Salmo trutta, inhabiting kan stream coruh basin Nort-Eastren Turkey. Turk. J. Fish. Aquat. Sci. 2004, 4, 45–48. [Google Scholar]
  101. Costa, M.J.; Cabral, H.N. Changes in the Tagus nursery function for commercial fish species: Some perspectives for management. Aquat. Ecol. 1999, 33, 287–292. [Google Scholar] [CrossRef]
  102. Wootton, R.J. Ecology of Teleost Fishes; Springer Netherlands: Dordrecht, The Netherlands, 1998. [Google Scholar]
  103. Brown-Peterson, N.J.; Wyanski, D.M.; Saborido-Rey, F.; Macewicz, B.J.; Lowerre-Barbieri, S.K. A Standardized Terminology for Describing Reproductive Development in Fishes. Mar. Coast Fish 2011, 3, 52–70. [Google Scholar] [CrossRef]
  104. Antunes, C.; Rodrigues, H. Guia Natural do Rio Minho–Os Peixes; Aquamuseu do Rio Minho: Vila Nova de Cerveira, Portugal, 2004; 84p. [Google Scholar]
  105. Parikh, P.; Sadekarpawar, S. Gonadosomatic and Hepatosomatic Indices of Freshwater Fish Oreochromis mossambicus in Response to a Plant Nutrient. World J. Zool. 2013, 8, 110–118. [Google Scholar] [CrossRef]
  106. Novais, D. Biologia, ecologia e pesca desportiva da truta, Salmo trutta morpha fario L., no rio Vez. Master Thesis, University of Porto, Porto, Portugal, 2012. [Google Scholar]
  107. Ergüden, S.A.; Özcan, T.; Ergüden, D. The Occurrence of Atyaephyra desmarestii (Millet, 1831) (Decapoda: Atyidae) in the Seyhan Reservoir (Seyhan River Basin). J. Black Sea/Mediterr. Environ. 2011, 17, 4–10. [Google Scholar]
  108. Ribeiro, H.A.C. Ecologia e Conservação da Espécie Salmo trutta no Troço Internacional do Rio Minho (Ecology and Conservation of the Especies Salmo trutta in International Section of the river Minho). Master’s Thesis, University of Minho, Braga, Portugal, 2014. [Google Scholar]
  109. Hernández, J.S. Influencia del estiaje sobre el comportamento alimentário de la trucha común en un río de montaña (Espanha Central): Implicaciones en el estado de repleción y selección del alimento. Ecologia 2012, 24, 61–72. [Google Scholar]
  110. Ferguson, A.; Reed, T.E.; Cross, T.F.; McGinnity, P.; Prodohl, P.A. Anadromy, potamodromy and residency in brown trout Salmo trutta: The role of genes and the environment. J. Fish Biol. 2019, 95, 692–718. [Google Scholar] [CrossRef]
  111. Lobon-Cervia, J.; Fernandez-Delgado, C. On the biology of the barbel (Barbus barbus bocagei) in the Jarama river. Folia Zool. 1984, 33, 371–384. [Google Scholar]
  112. Lobon-Cervia, J.; Montañés, C.; de Sostoa, A. Reproductive ecology and growth of a population of brown trout (Salmo trutta L.) in an aquifer-fed stream of Old Castile (Spain). Hydrobiologia 1986, 135, 81–94. [Google Scholar] [CrossRef]
  113. Valente, A.C.N. Biologia e dinâmica das populações de truta-de-rio, Salmo trutta L., da bacia hidrográfica do rio Lima. Ph.D. Thesis, University of Porto, Porto, Portugal, 1993. [Google Scholar]
  114. Formigo, N.M.E. A Bacia Hidrográfica do rio Âncora-Caracterização Ecológica e Potencialidades bio-Económicas para a Prática da Pesca Desportiva. Ph.D. Thesis, University of Porto, Porto, Portugal, 1997. [Google Scholar]
  115. Martinho, A.M.V.; Cortes, R.M.V. Gestão Sustentável das Populações de Truta (Salmo trutta): O caso do Rio Olo. Master’s Thesis, University of Trás-os-Montes and Alto Douro, Vila Real, Portugal, 2008. [Google Scholar]
  116. Caballero, P.; Cobo, F.; Gonzàlez, M.A. Life History of a Sea Trout (Salmo trutta L.) Population from the North-West Iberian Peninsula (River Ulla, Galicia, Spain). In Sea Trout: Biology, Conservation and Management; Wiley: Hoboken, NJ, USA, 2007; pp. 234–247. [Google Scholar]
  117. Caballero Javierre, P. Biología de la Forma Anádroma de la Trucha Común Salmo trutta Linnaeus, 1758, en Galicia. Ph.D. Thesis, University of Santiago de Compostela, Galicia, Spain, 2021. [Google Scholar]
  118. Domingos, I.M.M. A Enguia-Europeia, Anguilla anguilla (L., 1758), na Bacia Hidrográfica do rio Mondego. Ph.D. Thesis, University of Lisbon, Lisbon, Portugal, 2003. [Google Scholar]
  119. Bonhommeau, S.; Le Pape, O.; Gascuel, D.; Blanke, B.; Tréguier, A.M.; Grima, N.; Vermard, Y.; Castonguay, M.; Rivot, E. Estimates of the mortality and the duration of the trans-Atlantic migration of European eel Anguilla anguilla leptocephali using a particle tracking model. J. Fish Biol. 2009, 74, 1891–1914. [Google Scholar] [CrossRef] [PubMed]
  120. Moriarty, C.; Dekker, W. Management of the European Eel; 0332-4338; Marine Institute: St. John’s, NL, Canada, 1997. [Google Scholar]
  121. Jacoby, D.; Gollock, M. Anguilla anguilla. The IUCN Red List of Threatened Species 2020:e. T60344A45833138. IUCN. 2014. [Google Scholar]
  122. Kettle, A.J.; Asbjørn Vøllestad, L.; Wibig, J. Where once the eel and the elephant were together: Decline of the European eel because of changing hydrology in southwest Europe and northwest Africa? Fish Fish. 2011, 12, 380–411. [Google Scholar] [CrossRef]
  123. Doadrio, I. Atlas y Libro rojo de los Peces Continentales de España; Dirección General de Conservación de la Naturaleza; Museo Nacional de Ciencias Naturales: Madrid, Spain, 2002. [Google Scholar]
  124. Lobón-Cerviá, J. The decline of eel Anguilla anguilla (L.) in a river catchment of northern Spain 1986-1997. Further evidence for a critical status of eel in Iberian waters. Arch. Für Hydrobiologie 1999, 144, 245–253. [Google Scholar] [CrossRef]
  125. Nicola, G.; Elvira, B.; Almodóvar, A. Dams and fish passage facilities in the large rivers of Spain: Effects on migratory species. Arch. Für Hydrobiologie 1996, 113, 375–379. [Google Scholar] [CrossRef]
  126. Domingos, I.; Antunes, C.; Oliveira, J.M. Report on the Eel Stock and Fishery in Portugal 2011/2012; FAO: Rome, Italy, 2012; pp. 630–665. [Google Scholar]
  127. Díaz, E.; Korta, M.; Aranburu, A.; Abaroa, C. Report on the Eel Stock and Fishery in Spain 2010/2011; FAO: Rome, Italy, 2012; pp. 666–699. [Google Scholar]
  128. Amorim, E.; Ramos, S.; Elliott, M.; Franco, A.; Bordalo, A.A. Habitat loss and gain: Influence on habitat attractiveness for estuarine fish communities. Estuar. Coast. Shelf Sci. 2017, 197, 244–257. [Google Scholar] [CrossRef]
  129. Costa-Dias, S.; Dias, E.; Lobón-Cerviá, J.; Antunes, C.; Coimbra, J. Infection by Anguillicoloides crassus in a riverine stock of European eel, Anguilla anguilla. Fish. Manag. Ecol. 2010, 17, 485–492. [Google Scholar] [CrossRef]
  130. Braga, A.C.R. Susceptibilidade da Enguia Europeia, Anguilla anguilla e do parasita Anguillicoloides crassus, às Concentrações de metais Pesados no rio Minho Internacional. Master’s Thesis, School of Medicine and Biomedical Sciences (ICBAS)-University of Porto, Porto, Portugal, 2011. [Google Scholar]
  131. Bruslé, J. Effects of heavy metals on eels, Anguilla sp. Aquat. Living Resour. 1990, 3, 131–141. [Google Scholar] [CrossRef]
  132. Belpaire, C.; Goemans, G. Eels: Contaminant cocktails pinpointing environmental contamination. ICES J. Mar. Sci. 2007, 64, 1423–1436. [Google Scholar] [CrossRef]
  133. Imbert, H.; Arrowsmith, R.; Dufour, S.; Elie, P. Relationships between locomotor behavior, morphometric characters and thyroid hormone levels give evidence of stage-dependent mechanisms in European eel upstream migration. Horm. Behav. 2008, 53, 69–81. [Google Scholar] [CrossRef]
  134. Bevacqua, D.; Melià, P.; Crivelli, A.J.; De Leo, G.A.; Gatto, M. Timing and rate of sexual maturation of European eel in brackish and freshwater environments. J. Fish Biol. 2006, 69, 200–208. [Google Scholar] [CrossRef]
  135. Edeline, E.; Elie, P. Is salinity choice related to growth in juvenile eel Anguilla anguilla? Cybium 2004, 28, 77–82. [Google Scholar] [CrossRef]
  136. Daverat, F.; Élie, P.; Lahaye, M. Microchemistry contribution to a first approach to the diversity of life histories of eels from the lower part of the Gironde-Garonne-Dordogne watershed. Cybium 2004, 28, 83–90. [Google Scholar]
  137. Daverat, F.; Limburg, K.E.; Thibault, I.; Shiao, J.-C.; Dodson, J.J.; Caron, F.; Tzeng, W.-N.; Iizuka, Y.; Wickström, H. Phenotypic plasticity of habitat use by three temperate eel species, Anguilla anguilla, A. japonica and A. rostrata. Mar. Ecol. Prog. Ser. 2006, 308, 231–241. [Google Scholar] [CrossRef]
  138. Jessop, B.M.; Shiao, J.C.; Iizuka, Y.; Tzeng, W.N. Variation in the annual growth, by sex and migration history, of silver American eels Anguilla rostrata. Mar. Ecol. Prog. Ser. 2004, 272, 231–244. [Google Scholar] [CrossRef]
  139. Dias, E.; Miranda, M.L.; Sousa, R.; Antunes, C. Riparian vegetation subsidizes sea lamprey ammocoetes in a nursery area. Aquat. Sci. 2019, 81, 44. [Google Scholar] [CrossRef]
  140. Rooney, N.; McCann, K.S. Integrating food web diversity, structure and stability. Trends Ecol. Evol. 2012, 27, 40–46. [Google Scholar] [CrossRef]
  141. Dias, E.; Morais, P.; Cotter, A.M.; Antunes, C.; Hoffman, J.C. Estuarine consumers utilize marine, estuarine and terrestrial organic matter and provide connectivity among these food webs. Mar. Ecol. Prog. Ser. 2016, 554, 21–34. [Google Scholar] [CrossRef]
  142. Rytwinski, T.; Harper, M.; Taylor, J.J.; Bennett, J.R.; Donaldson, L.A.; Smokorowski, K.E.; Clarke, K.; Bradford, M.J.; Ghamry, H.; Olden, J.D.; et al. What are the effects of flow-regime changes on fish productivity in temperate regions? A systematic map. Environ. Evid. 2020, 9, 7. [Google Scholar] [CrossRef]
  143. Domingos, I.; Costa, J.L.; Costa, M.J. Factors determining length distribution and abundance of the European eel, Anguilla anguilla, in the River Mondego (Portugal). Freshw. Biol. 2006, 51, 2265–2281. [Google Scholar] [CrossRef]
  144. Gravato, C.; Guimarães, L.; Santos, J.; Faria, M.; Alves, A.; Guilhermino, L. Comparative study about the effects of pollution on glass and yellow eels (Anguilla anguilla) from the estuaries of Minho, Lima and Douro Rivers (NW Portugal). Ecotoxicol. Environ. Saf. 2010, 73, 524–533. [Google Scholar] [CrossRef]
  145. Marohn, L.; Jakob, E.; Hanel, R. Implications of facultative catadromy in Anguilla anguilla. Does individual migratory behaviour influence eel spawner quality? J. Sea Res. 2013, 77, 100–106. [Google Scholar] [CrossRef]
  146. Simon, J. Age, growth, and condition of European eel (Anguilla anguilla) from six lakes in the River Havel system (Germany). ICES J. Mar. Sci. 2007, 64, 1414–1422. [Google Scholar] [CrossRef]
  147. Matthews, M.; Evans, D.; Rosell, R.; Moriarty, C.; Marsh, I. The Erne eel enhancement programme. In EU Programme for Peace and Reconciliation; Project No. 15, Ballyshannon; Northern Regional Fisheries Board: Co Donegal, Ireland, 2001; p. 348. [Google Scholar]
  148. Jörgensen, L. Fischereibiologische Analyse der Altersstruktur der Aalbestände in der Havel, Berlin (West); Projektabschluß: Berlin, Germany, 1988. [Google Scholar]
  149. Antunes, C.; Cobo, F.; Araújo, M.J.; Braga, C.; Roleira, A.; Mota, M.; Sanchez, J.; Vieira, R.; Servia, M.J.; Couto, M.T.; et al. Contribuição para o plano de gestão da enguia-europeia, Anguilla anguilla no rio Minho internacional. In Valorização dos Recursos Naturais da Bacia Hidrográfica do rio Minho–Projecto Natura Minho-Miño, Relatório Final; CIIMAR: Matosinhos, Portugal, 2011. [Google Scholar]
  150. Adam, G.; Feunteun, E.; Prouzet, P.; Rigaud, C. L’anguille Européenne. Indicateurs D’abondance et de Colonisation; Editions Quae: Versailles, France, 2008; p. 400. [Google Scholar]
  151. Simon, J.; Westerberg, H.; Righton, D.; Sjöberg, N.B.; Dorow, M. Diving activity of migrating silver eel with and without Anguillicola crassus infection. J. Appl. Ichthyol. 2018, 34, 659–668. [Google Scholar] [CrossRef]
  152. Lefebvre, F.; Tobias, S.; Marcel, M.; Mike, H.; and Poulin, R. Anguillicolosis in the short–finned eel Anguilla australis: Epidemiology and pathogenicity. New Zealand J. Mar. Freshw. Res. 2004, 38, 577–583. [Google Scholar] [CrossRef]
  153. Kennedy, C.R. The pathogenic helminth parasites of eels. J. Fish Dis. 2007, 30, 319–334. [Google Scholar] [CrossRef]
  154. Taraschewski, H. Hosts and parasites as aliens. J. Helminthol. 2006, 80, 99–128. [Google Scholar] [CrossRef]
  155. Antunes, C. Anguillicola Infestation of Eel Population from the Rio Minho (North of Portugal); ICES-EIFAC Working Group on Eel: Silkeborg, Denmark, 1999; p. 1. [Google Scholar]
  156. Passos, D.M. Concentração de Metais Pesados na Enguia Europeia, Anguilla anguilla (Linnaeus, 1758), em Estuários e Lagoas Costeiras de Portugal; University of Aveiro: Aveiro, Portugal, 2008; p. 41. [Google Scholar]
  157. Jakob, E.; Walter, T.; Hanel, R. A checklist of the protozoan and metazoan parasites of European eel (Anguilla anguilla): Checklist of Anguilla anguilla parasites. J. Appl. Ichthyol. 2016, 32, 757–804. [Google Scholar] [CrossRef]
  158. Pereira, L.; Braga, A.C.; Moura, A.; Antunes, C. Prevalence of the Anguillicola crassus parasite in the International Minho River. Environ. Smoke 2022, 64–74. [Google Scholar] [CrossRef]
  159. Heitlinger, E.G.; Laetsch, D.R.; Weclawski, U.; Han, Y.-S.; Taraschewski, H. Massive encapsulation of larval Anguillicoloides crassus in the intestinal wall of Japanese eels. Parasites Vectors 2009, 2, 48. [Google Scholar] [CrossRef]
  160. Wysujack, K.; Dorow, M.; Ubl, C. The infection of the European eel with the parasitic nematode Anguillicoloides crassus in inland and coastal waters of northern Germany. J. Coast. Conserv. 2014, 18, 121–130. [Google Scholar] [CrossRef]
  161. Haenen, O.L.M.; Van Banning, P. Detection of larvae of Anguillicola crassus (an eel swimbladder nematode) in freshwater fish species. Aquaculture 1990, 87, 103–109. [Google Scholar] [CrossRef]
  162. Würtz, J.; Taraschewski, H. Histopathological changes in the swimbladder wall of the European eel Anguilla anguilla due to infections with Anguillicola crassus. Dis. Aquat. Organ. 2000, 39, 121–134. [Google Scholar] [CrossRef] [PubMed]
  163. Székely, C.; Palstra, A.; Molnár, K.; van den Thillart, G. Impact of the Swim-Bladder Parasite on the Health and Performance of European Eels. In Spawning Migration of the European Eel: Reproduction Index, a Useful Tool for Conservation Management; van den Thillart, G., Dufour, S., Rankin, J.C., Eds.; Springer Netherlands: Dordrecht, The Netherlands, 2009; pp. 201–226. [Google Scholar]
  164. Lefebvre, F.; Fazio, G.; Mounaix, B.; Crivelli, A.J. Is the continental life of the European eel Anguilla anguilla affected by the parasitic invader Anguillicoloides crassus? Proc. R. Soc. B Biol. Sci. 2013, 280, 20122916. [Google Scholar] [CrossRef]
  165. Neto, A.F.; Costa, J.L.; Costa, M.J.; Domingos, I. Epidemiology and pathology of Anguillicoloides crassus in European eel Anguilla anguilla from the Tagus estuary (Portugal). Dis. Aquat. Organ. 2010, 88, 225–233. [Google Scholar] [CrossRef]
  166. Denny, S.; Denny, A.; Paul, T. Distribution, prevalence and intensity of Anguillicoloides crassus in the American eel, Anguilla rostrata, in the Bras d’Or Lakes, Nova Scotia. BioInvasions Rec. 2013, 2, 19–26. [Google Scholar] [CrossRef]
  167. Taverny, C.; Elie, P. Bilan des Connaissances Biologiques et de l’état des Habitats des Lamproies Migratrices dans le Bassin de la Gironde: Propositions D’actions Prioritaires; IRSTEA: Montpellier, France, 2009; p. 110. [Google Scholar]
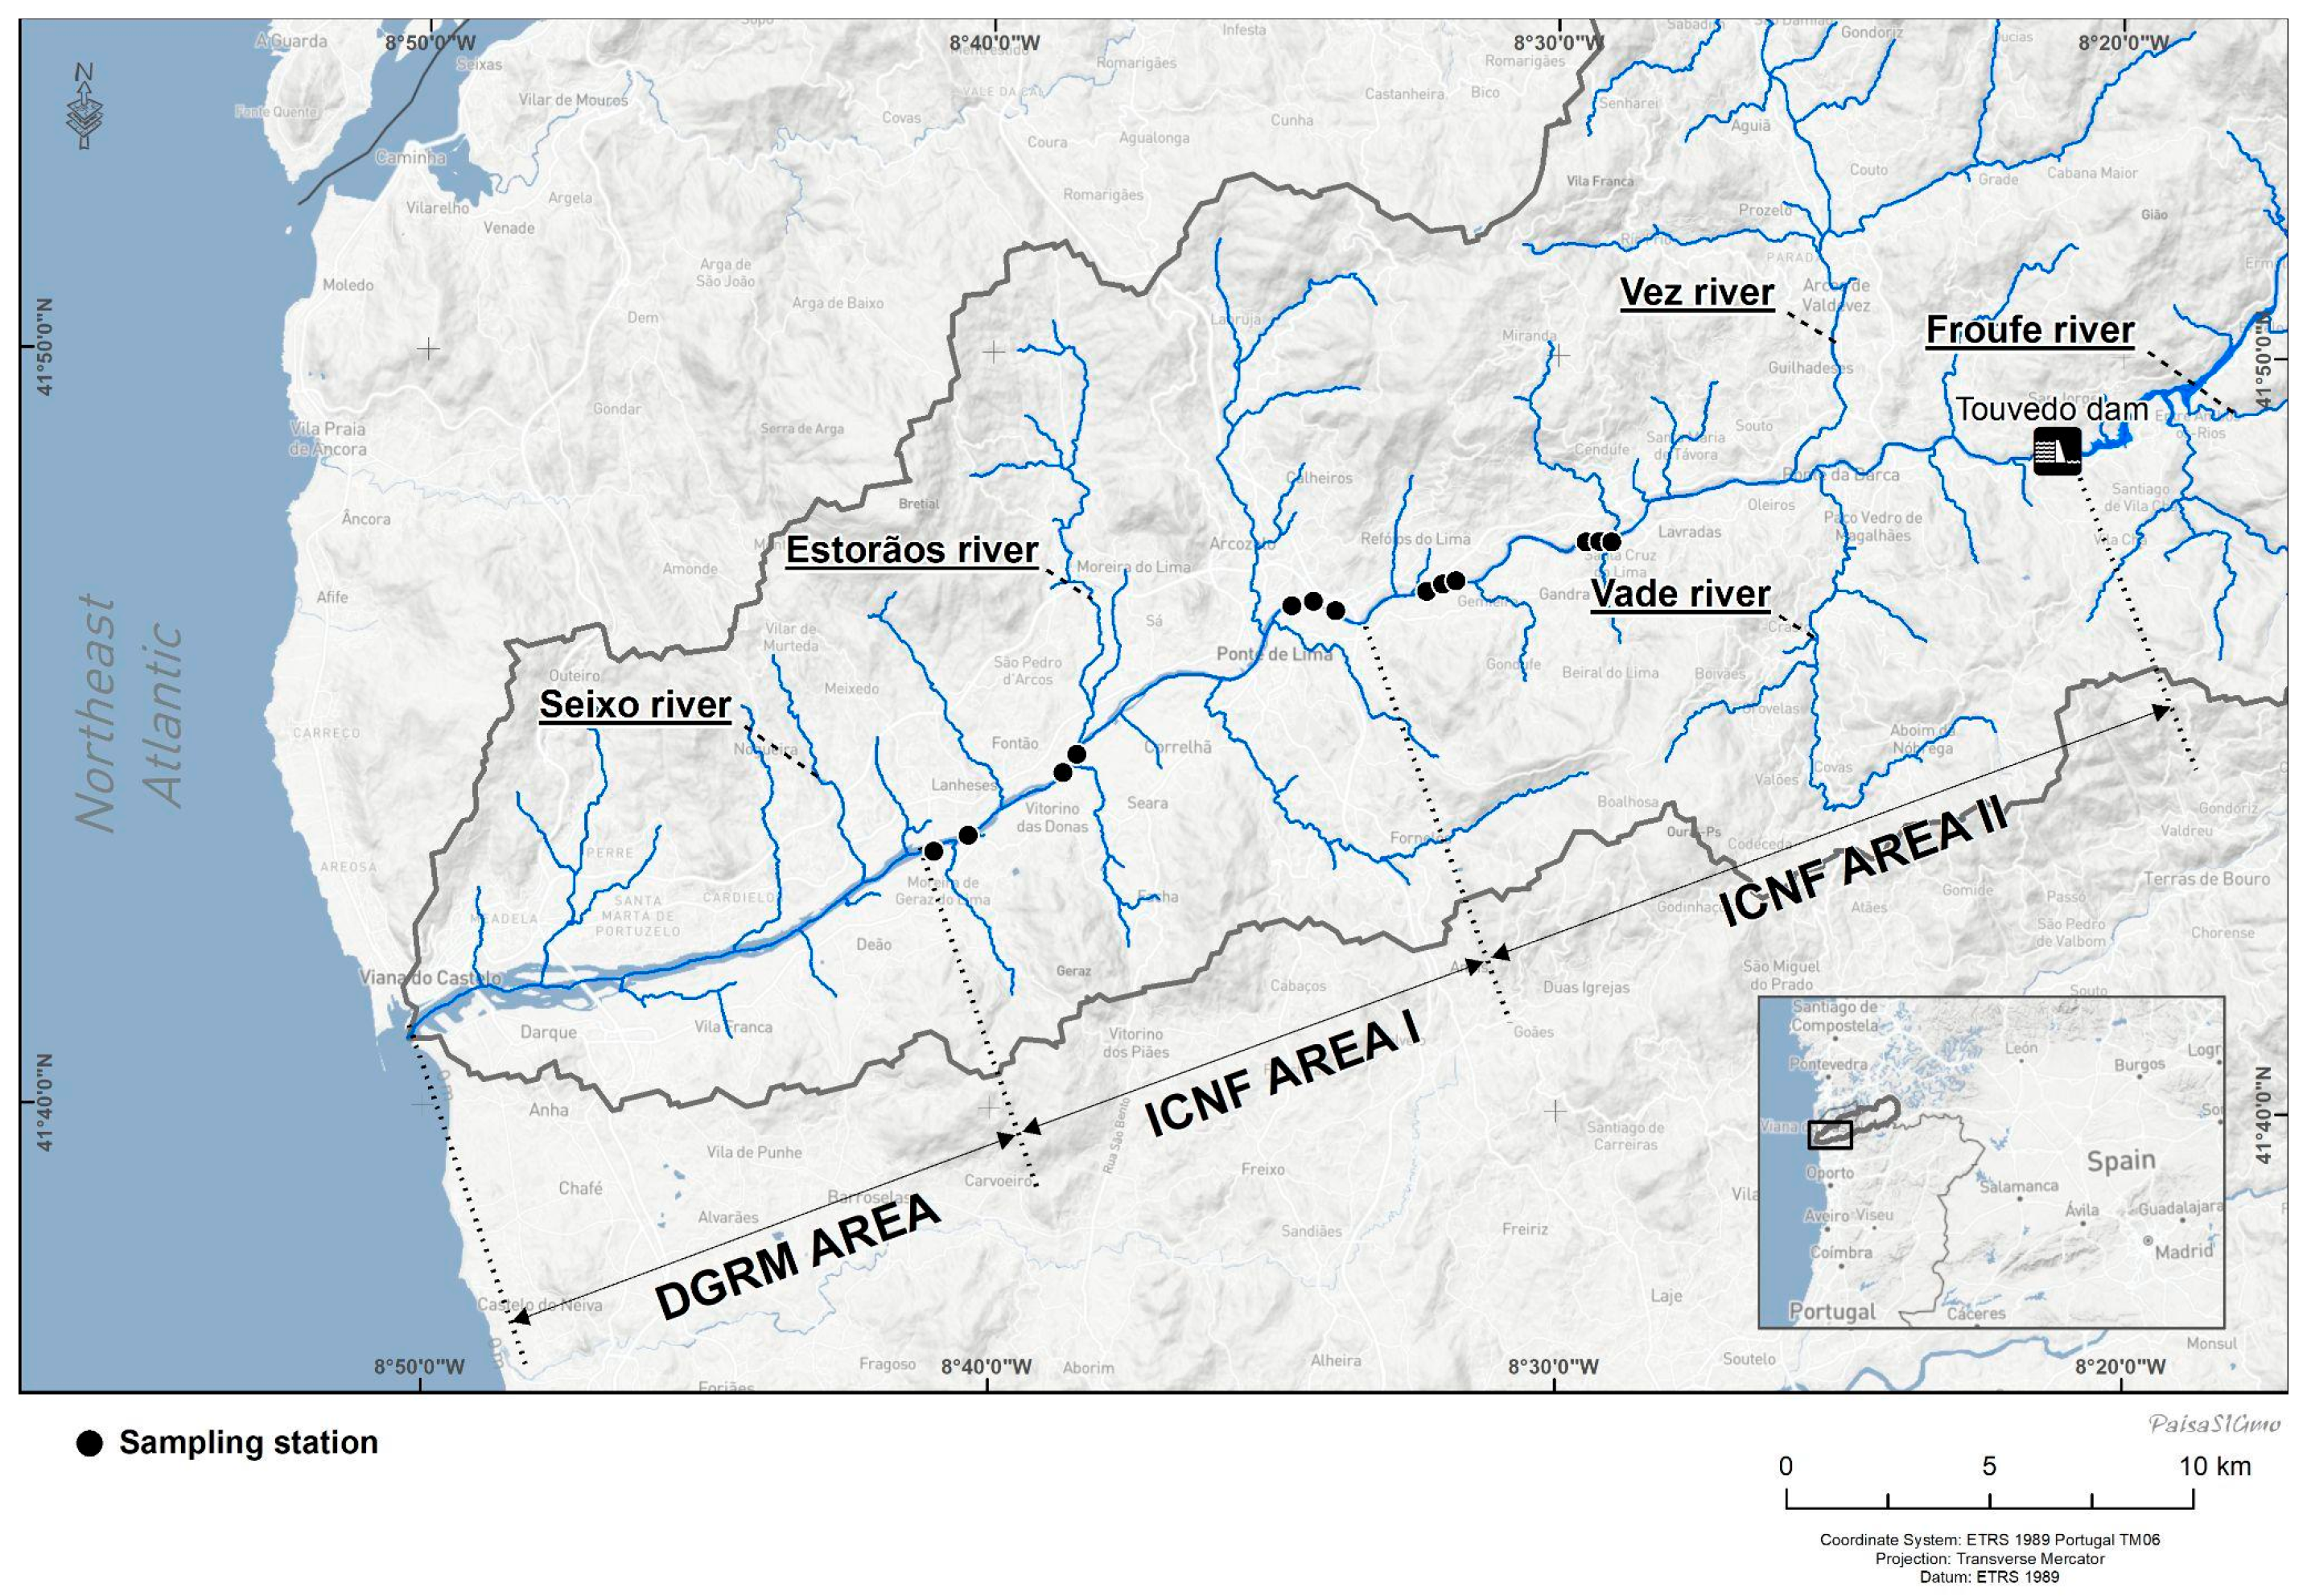
Figure 1. The areas regulated for fishing activity are represented by two entities: DGRM and ICNF (Areas I and II). Sampling sites and studied tributaries (Seixo, Estorãos, Vade, Vez, and Froufe rivers).
Fishes 10 00230 g001
Figure 2. Yearly fish capture data (in Kilograms) for Anguilla anguilla and Salmo trutta (a), and Petromyzon marinus and Alosa spp. (b) in the Lima River from 2013 to 2022. Data is divided by the management authorities: ICNF and DOCAPESCA.
Fishes 10 00230 g002
Figure 3. Monthly Catch Per Unit Effort (CPUE) for fish species in fyke and trammel nets, October 2022–July 2023. (a) Fyke nets: mean CPUE (individuals per fyke net per day) ± SD across sampling months (October 2022–May 2023). (b) Trammel nets: mean CPUE ± SD from February 2023 to July 2023. Alosa spp. was caught from April onward and P. marinus primarily in April–May. Data were aggregated from daily samples (Table A1), with error bars representing the standard deviation of the mean (SD). Months with no sampling are excluded.
Fishes 10 00230 g003
Figure 4. Mean gill rakers number (±SD) of adult Alosa spp. from the Lima River (N A. alosa = 51; N hybrids = 27; N A. fallax = 3).
Fishes 10 00230 g004
Figure 5. Mean age distribution (±SD) by gender of A. alosa (N = 51) and hybrids (N = 26).
Fishes 10 00230 g005
Figure 6. Mean GSI values (±SD) of allis shad (females, N = 17; males, N = 33) and hybrids (females*, N = 3; males*, N = 23) captured over the sampling months.
Fishes 10 00230 g006
Figure 7. Mean HSI values (±SD) of allis shad (females, N = 17; males, N = 33) and hybrid (females*, N = 3; males*, N = 23) individuals captured over the sampling months.
Fishes 10 00230 g007
Figure 8. Mean values (±SD) of the GSI of S. trutta individuals captured over the sampling months (N = 113; F, N = 53; M, N = 16; Und, N = 43).
Fishes 10 00230 g008
Figure 9. Mean values (±SD) of the HSI of S. trutta individuals captured over the sampling months (N = 113; F, N = 53; M, N = 16; Und, N = 43).
Fishes 10 00230 g009
Figure 10. Trout diet relative abundance of each taxonomic group identified.
Fishes 10 00230 g010
Figure 11. Trout diet relative abundance of content identified at the lowest possible taxonomic level.
Fishes 10 00230 g011
Figure 12. Relation between S. trutta individuals’ age through sampling years.
Fishes 10 00230 g012
Figure 13. Mean HSI values (±SD) of European eel females (N = 30), males (N = 6) and undifferentiated (N = 16) individuals captured over the sampling months.
Fishes 10 00230 g013
Figure 14. Percentage (%) of yellow and silver eels, in the different stages of development [41] (N = 52).
Fishes 10 00230 g014
Table 1. List of fish species collected during the study period.
SpeciesCommon NameClassification
Anguilla anguillaEuropean eelNative
Salmo truttaTroutNative
Petromyzon marinusSea lampreyNative
Alosa spp.Allis/Twaite shadNative
Chelon ramadaThinlip grey mulletNative
Pseudochondrostoma durienseNorthern straight-mouth naseNative
Achondrostoma oligolepisPortuguese naseNative
Luciobarbus bocageiIberain barbelNative
Squalius carolitertiiNorthern Iberian chubNative
Cobitis atlanticaSouthern Iberian spined loachNative
Gasterosteus aculeatusThree-spined sticklebackNative
Lepomis gibbosusPumpkinseed sunfishExotic
Gobio lozanoiIberian gudgeonExotic
Micropterus salmoidesLargemouth black bassExotic
Carassius auratusGoldfishExotic
Table 2. Descriptive statistics and estimated parameters of sea lamprey length–weight relationships (LWR) from the Lima River. N-number, TL-total length, TW-total weight, mean ± SD-mean ± standard deviation, min-minimum, max-maximum, a, b-parameters, CI-confidence interval, R2-coefficient of determination.
SampleZoneNTL (cm)TW (g)LWR Parameters
MinMean ± SDMaxMinMean ± SDMaxab95% CI of bR2
AllEstuary + Upstream5963.581.5 ± 9.298.6708.01240.0 ± 301.32350.02.3801.4210.9666 to 1.8880.4164
Estuary2376.787.6 ± 6.098.6795.01300.0 ± 384.92350.00.00070443.2221.851 to 4.6390.5343
Upstream3663.577.6 ± 8.894.0708.01201.0 ± 231.01715.05.8471.2240.8402 to 1.6070.5474
FemaleEstuary483.087.6 ± 5.495.01220.01276.0 ± 72.31380.021.030.91800.6052 to 1.2280.9874
Upstream1863.578.9 ± 9.594.0762.01261.0 ± 224.71715.09.7281.1110.5749 to 1.6610.5505
MaleEstuary480.483.5 ± 5.091.01020.01125.0 ± 140.61330.00.17161.9850.8254 to 3.1010.9630
Upstream1565.276.2 ± 8.392.5708.01143.0 ± 242.51491.03.4171.3410.5743 to 2.0840.5136
Table 3. Descriptive statistics and estimated parameters of length–weight relationships (LWR) and Fulton Condition factor (K) for A. alosa and hybrids from the Lima River. N-number, TL-total length, TW-total weight, mean ± SD-mean ± standard deviation, min-minimum, max-maximum, a, b-parameters, CI-confidence interval, R2-coefficient of determination.
NKTL (cm)TW (g)LWR Parameters
MinMean ± SDMaxMinMean ± SDMaxab95% CI of bR2
A. alosaAll510.8847.957.3 ± 4.466.7710.01712.0 ± 590.32950.00.00013624.0293.386 to 4.6890.7750
Males350.8547.955.4 ± 3.562.7710.01478.0 ± 453.32433.00.00028353.8462.869 to 4.8380.6557
Females160.9454.661.5 ± 3.066.71203.02225.0 ± 536.02950.0~7.327 × 10⁻⁵~4.180(very wide)0.6525
HybridsAll270.8544.849.8 ± 5.162.6562.01124.0 ± 581.42690.00.00014134.0483.631 to 4.4700.9276
Males230.8344.848.4 ± 3.560.7562.0971.3 ± 374.52310.00.00021643.9403.208 to 4.6330.8033
Female40.9749.957.9 ± 6.062.6902.02001.0 ± 835.42690.02.092 × 10−54.5133.280 to 5.9760.9942
Table 4. Descriptive statistics and estimated parameters of length–weight relationships (LWR) and Fulton Condition factor (K) from the Lima River S. trutta genders and the studied tributaries. N-number, TL-total length, TW-total weight, mean ± SD-mean ± standard deviation, min-minimum, max-maximum, a, b-parameters, CI-confidence interval, R2-coefficient of determination.
NKTL (cm)TW (g)LWR Parameters
MinMean ± SDMaxMinMean ± SDMaxab95% CI of bR2
Lima RiverAll1210.9410.432.0 ± 7.254.414.2354.2 ± 258.81599.00.0042733.2163.100 to 3.3340.9602
Male160.9425.835.1 ± 5.847.4169.0431.9 ± 208.0940.00.018132.8142.605 to 3.0270.9839
Female540.8917.131.2 ± 6.145.250.2298.7 ± 173.0865.00.0067173.0762.859 to 3.2980.9476
Und.510.9810.431.9 ± 8.554.414.2388.6 ± 331.01599.00.0053453.1693.005 to 3.3360.9707
Tributaries481.063.712.0 ± 5.523.50.528.4 ± 30.1117.00.016492.8282.650 to 3.0120.9757
Table 5. Growth data for S. trutta individuals, including observed total length, back-calculated length, and otolith radius measurements across different age classes. Observed length (mean ± SD) was recorded for each age group, along with the number of individuals measured (N). Otolith radius (mean ± SD) was also measured to assess growth increments and validate age estimation.
AgeObserved (cm)NBack-Calculated (cm)NOtolith Radius (mm)N
114.3113.5 ± 2.91151.461
225.3 ± 4.23022.7 ± 3.41142.4 ± 0.4430
332.0 ± 3.75029.8 ± 3.6843.0 ± 0.2648
434.2 ± 2.92134.8 ± 4.2373.3 ± 0.2620
539.7 ± 4.81040.5 ± 4.9173.7 ± 0.2610
647.0 ± 3.5846.1 ± 3.074.0 ± 0.248
Table 6. Descriptive statistics and estimated parameters of Condition Factor (K) and length–weight relationships (LWR) for European eel individuals from the Lima River and studied tributaries. N-number, TL-total length, TW-total weight, mean ± SD-mean ± standard deviation, min-minimum, max-maximum, a, b-parameters, CI-confidence interval, R2-coefficient of determination.
SampleNKTL (cm)TW (g)LWR Parameters
Mean ± SDMean ± SD
(Min–Max)
Mean ± SD
(Min–Max)
ab95% CI of bR2
Lima540.17 ± 0.0341.3 ± 12.5
(12.2–69.3)
159.4 ± 167.2
(1.26–845.0)
0.0000463.9143.617 to 4.2350.9656
Tributaries460.14 ± 0.0219.4 ± 9.2
(7.3–46.4)
17.9 ± 25.8
(0.4–135.8)
0.0018032.9372.757 to 3.1220.9667
Table 7. European eel length at age through back calculation; minimum–maximum with mean ± standard deviation. * No data available.
AgeNLima RiverNTributaries
Back calculation Length at age (cm)1539.1–22.2
(14.6 ± 3.1)
426.5–21.9
(13.0 ± 4.1)
25213.3–28.8
(20.2 ± 3.4)
2713.7–29.0
(20.0 ± 4.0)
35117.6–34.8
(26.0 ± 3.6)
1417.2–29.0
(25.3 ± 3.2)
44524.1–41.6
(31.1 ± 3.8)
721.4–31.8
(28.7 ± 3.9)
53928.2–53.0
(36.7 ± 5.2)
124.7
(24.7 ± 0.0)
62434.6–58.8
(44.2 ± 6.4)
132.3
(32.3 ± 0.0)
71636.3–58.3
(48.6 ± 6.3)
140.3
(40.3 ± 0.0)
8850.0–60.6
(54.1 ± 3.8)
145.7
(45.7 ± 0.0)
9555.5–64.3
(58.8 ± 3.8)
**
10359.6–66.1
(63.5 ± 3.6)
**
Table 8. Descriptive statistics and estimated parameters of European eel otolith diameter–radius relationship (DRR) from the Lima River and studied tributaries. N-number, mean ± SD-mean ± standard deviation, min-minimum, max-maximum, a, b-parameters, CI-confidence interval, R2-coefficient of determination.
SampleNOtolith Diameter (mm)Otolith Radius (mm)DRR Parameters
MinMean ± SDMaxMinMean ± SDMaxab95% CI of bR2
Lima River530.76702.821 ± 0.714.4450.40101.516 ± 0.402.4020.5532−0.04495−0.1091 to 0.019200.9803
Tributaries460.35201.344 ± 0.592.8350.29500.737 ± 0.311.5170.50640.04298−0.00843 to 0.094390.9503
Table 9. Anguillicola crassus infection in eels collected in the Lima River and studied tributaries; data presented: total number of samples (N), number of infected individuals, stages of the parasites found (L3, L4, adult males and females), intensity range, mean intensity, and mean abundance of the parasites. * No L1 and L2.
Sampling SiteTotal (N)Infected (N)Parasite Stage *Intensity RangeMean
Intensity
AbundancePrevalence
(%)
95% CI of
Prevalence (%)
L3L4Adults
MalesFemales
Lima River533932554791–154.1 (±3.5)3.073.660.4–83.6
Tributaries46210726211–92.6 (±2.5)1.245.732.2–59.8
All9960332801001–153.6 (±3.3)2.260.650.8–69.7
Disclaimer/Publisher’s Note: The statements, opinions and data contained in all publications are solely those of the individual author(s) and contributor(s) and not of MDPI and/or the editor(s). MDPI and/or the editor(s) disclaim responsibility for any injury to people or property resulting from any ideas, methods, instructions or products referred to in the content.