Article

Effects of Increased Feeding Rates on Oxidative Stress, Biochemical Indices and Growth of Juvenile Hybrid Grouper (Epinephelus fuscoguttatus ♀ × Epinephelus tukula ♂) Under Mild-Hyperoxia Conditions

by
Zhiyi Wang
,
Yikai Zheng
,
Dengpan Dong
,
Xiefa Song
* and
Meng Li
*
College of Fisheries, Ocean University of China, Qingdao 266003, China
*
Authors to whom correspondence should be addressed.
Fishes 2025, 10(5), 228; https://doi.org/10.3390/fishes10050228
Submission received: 12 March 2025 / Revised: 18 April 2025 / Accepted: 23 April 2025 / Published: 15 May 2025
(This article belongs to the Section Physiology and Biochemistry)

Abstract

Evaluating the interaction between dissolved oxygen (DO) and feeding rates (FRs) in fish is crucial for the precise regulation of aquaculture water environments. This study established four treatment groups: the CK group (DO = 6 mg/L, FR = 2% of body weight), the HFR group (DO = 6 mg/L, FR = 3.5% of body weight), the HDO group (DO = 9 mg/L, FR = 2% of body weight), and the MIX group (DO = 6 mg/L, FR = 3.5% of body weight). The combined effects of dissolved oxygen and feeding levels on oxidative stress, biochemical indicators, and growth in the hybrid grouper were evaluated. The results showed that mild hyperoxia significantly upregulates the expression of antioxidant enzyme genes (cat, cu/zn-sod, and gpx1a). Under conditions of mild hyperoxia, an increased feed rate can significantly downregulate the expression of cat and gpx1a. Additionally, serum levels of carnosine and cndp1 in muscle tissue are significantly elevated. Furthermore, a high FR mitigates the downregulation of glucose, triglycerides, and alanine aminotransferase (ALT) induced by mild hyperoxia while alleviating the upregulation of aspartate aminotransferase (AST). The combined effects of mild hyperoxia and high FR significantly enhance final body weight and specific growth rate (SGR), with notable interactions observed. Mild hyperoxia reduces serum levels of bile acids and glycocholic acid under high feeding conditions while significantly downregulating the expression of ghrb in both liver and brain tissues. In summary, high FRs alleviate oxidative stress and energy substrate deficiency in juvenile hybrid grouper under mild-hyperoxia environments. Moreover, the synergistic effect between mild hyperoxia and high FR promotes growth by improving bile acid enterohepatic circulation. This study provides a reference for the regulation of DO and feeding in modern industrial intensive mariculture.
Key Contribution: High feeding rates (3.5%) combined with mild hyperoxia (9 mg/L) enhance hybrid grouper growth via bile acid cycling and growth hormone upregulation, while alleviating oxidative stress and energy deficits, guiding optimized DO–feeding strategies in intensive mariculture.

1. Introduction

Dissolved oxygen (DO) is a crucial parameter in aquaculture, exerting significant influence on a range of fundamental biological processes. These include fish growth [1,2,3], development [4], metabolism, reproduction [5] and other essential life functions. The majority of previous scholars concentrated their studies on the effects of hypoxia and post-hypoxia reoxygenation processes on fish, with a particular focus on the effects on the expression of enzymes, including antioxidant enzymes [6,7]. In recent years, several factors have contributed to elevated oxygen levels in aquaculture environments, including the application of oxygen cone and the application of nano-bubble technology in industrial aquaculture and the over-oxygenation of aquaculture water during the culture process. While these practices have been beneficial in improving water quality and increasing culture density, they have also resulted in high oxygen stress for fish, namely hyperoxia. In particular, within the context of industrial recirculating aquaculture, pure oxygen was frequently employed through an oxygen cone to improve culture efficiency by maintaining the DO level at mild hyperoxia (i.e., 100–130% air saturation) [8,9].
However, in current research, the question as to whether mild-hyperoxia environments promote fish growth remains debatable [10]. A number of studies have demonstrated that a reasonable range of elevated dissolved oxygen concentrations can enhance the conversion rate of feed and facilitate the growth and development of aquatic animals. For example, Atlantic salmon (Salmo salar L.) [11] and juvenile Japanese flounder (Paralichthys olivaceus) [12] exhibit a proclivity for growth in mild-hyperoxia conditions. Nevertheless, evidence indicates that mild hyperoxia does not affect fish growth, Atlantic salmon (Salmo salar L.) and Atlantic cod (Gadus morhua L.) exhibited unimpaired growth when cultivated for 40 and 100 days at DO levels of 123% and 150%, respectively [13]. In contrast, several studies showed that elevated DO levels have a repressive effect on fish growth. A study by Aksakal et al. [14] revealed a reduction in weight gain and specific growth rate (SGR) in trout exposed to hyperoxia.
Prior research demonstrated that hyperoxia induces stress in fish, primarily due to the generation of excessive reactive oxygen species (ROS). In fish, ROS are produced from oxygen consumption during respiration. A limited quantity of ROS serves a regulatory function in cellular processes and gene expression. The formation of ROS is increased at elevated oxygen levels, leading to oxidative stress that causes tissue damage and apoptosis [15,16,17]. In response to hyperoxia, fish modify their antioxidant systems. An increase in superoxide dismutase (SOD) and catalase (CAT) activity in the liver of Atlantic salmon has been observed following a 12-week cultivation period under hyperoxia (140–150% oxygen saturation) [18]. Similarly, SOD and CAT activity increased in rainbow trout when exposed to 166% oxygen saturation conditions [19]. Actually, research on other vertebrates has highlighted the pivotal role of amino acid metabolic adaptation in mitigating hyperoxia-induced stress. In a study by Magnúsdóttir et al. [20], the upregulation of numerous amino acids including histidine and phenylalanine were found in the lung tissue of pigs when exposed to 100% oxygen for five hours. This may be associated with the synthesis of antioxidant compounds.
It is worth noting that the majority of current studies examining the impact of elevated DO on fish have been conducted under fixed feeding conditions, which may have overlooked potential interactions between DO levels and feeding rates (FRs). On the one hand, hyperoxia may help fish to alleviate the oxygen consumption stress associated with high feeding and may ultimately be reflected in fish growth performance. The FR affects the processes of oxygen consumption that are related to the digestive and absorptive functions. Jordan and Steffensen [21] discovered that the cod (Gadus morhua) exhibited longer specific dynamic action (SDA) processes accompanied by higher peak oxygen consumption at 2.5% and 5% FR. This phenomenon was also observed in the study of juvenile southern catfish (Silurus meridionalis Chen) [22]. On the other hand, elevated FRs may influence protein synthesis by increasing amino acid levels, thereby reducing the impact of excessive ROS from hyperoxia. Huang et al. [9] showed that adequate protein intake increased blood concentrations of essential and non-essential amino acids, as well as increased amino acid-related metabolic pathways, which in turn lead to enhanced growth performance. Furthermore, Rahimnejad et al. [23] observed an elevation in serum antioxidant enzyme activities in European grey fish following the consumption of diets with an optimal ratio of protein and fat. Such alternations may assist fish in regulating the production of ROS under hyperoxia conditions. Nonetheless, no studies have been conducted on whether increased FRs can alleviate hyperoxia stress.
The grouper is widely distributed throughout China and is cultivated in a variety of modes including cages and industrial recirculating aquaculture systems. In order to enhance the economic viability of grouper aquaculture, Chinese researchers selected the tiger grouper (Epinephelus fuscoguttatus ♀) and the blue potato grouper (Epinephelus tukula ♂) for crossbreeding, resulting in the successful breeding of a hybrid grouper, designated the ‘Golden Tiger Grouper’. The hybrid grouper exhibits several advantageous characteristics, including a high fertilization rate, high hatching rate, low deformity rate and fast growth rate. In response to the expanding market demand, this species has become the primary breeding species in southern and northern China. Environmental changes and differences in the level of intensification in high-density aquaculture may result in hyperoxia stress for the grouper. While the effects of FR and DO levels on the grouper have been evaluated in some studies, the interaction between FR and hyperoxia remains unreported. It is unclear whether hyperoxia stress can be alleviated by elevating the FR, and the mechanism of the intrinsic physiological response requires further investigation.
The present study thus sought to investigate the effects of hyperoxia and FR on the growth, physiological stress and antioxidant capacity of the golden tiger grouper. Furthermore, the separate and interactive effects of the two factors and their influence mechanisms were studied. The findings of this study may provide a theoretical basis for ensuring optimal water in grouper culture, minimizing wasteful expenditure and energy wastage due to over-oxygenation, and achieving optimal production efficiency.

2. Materials and Methods

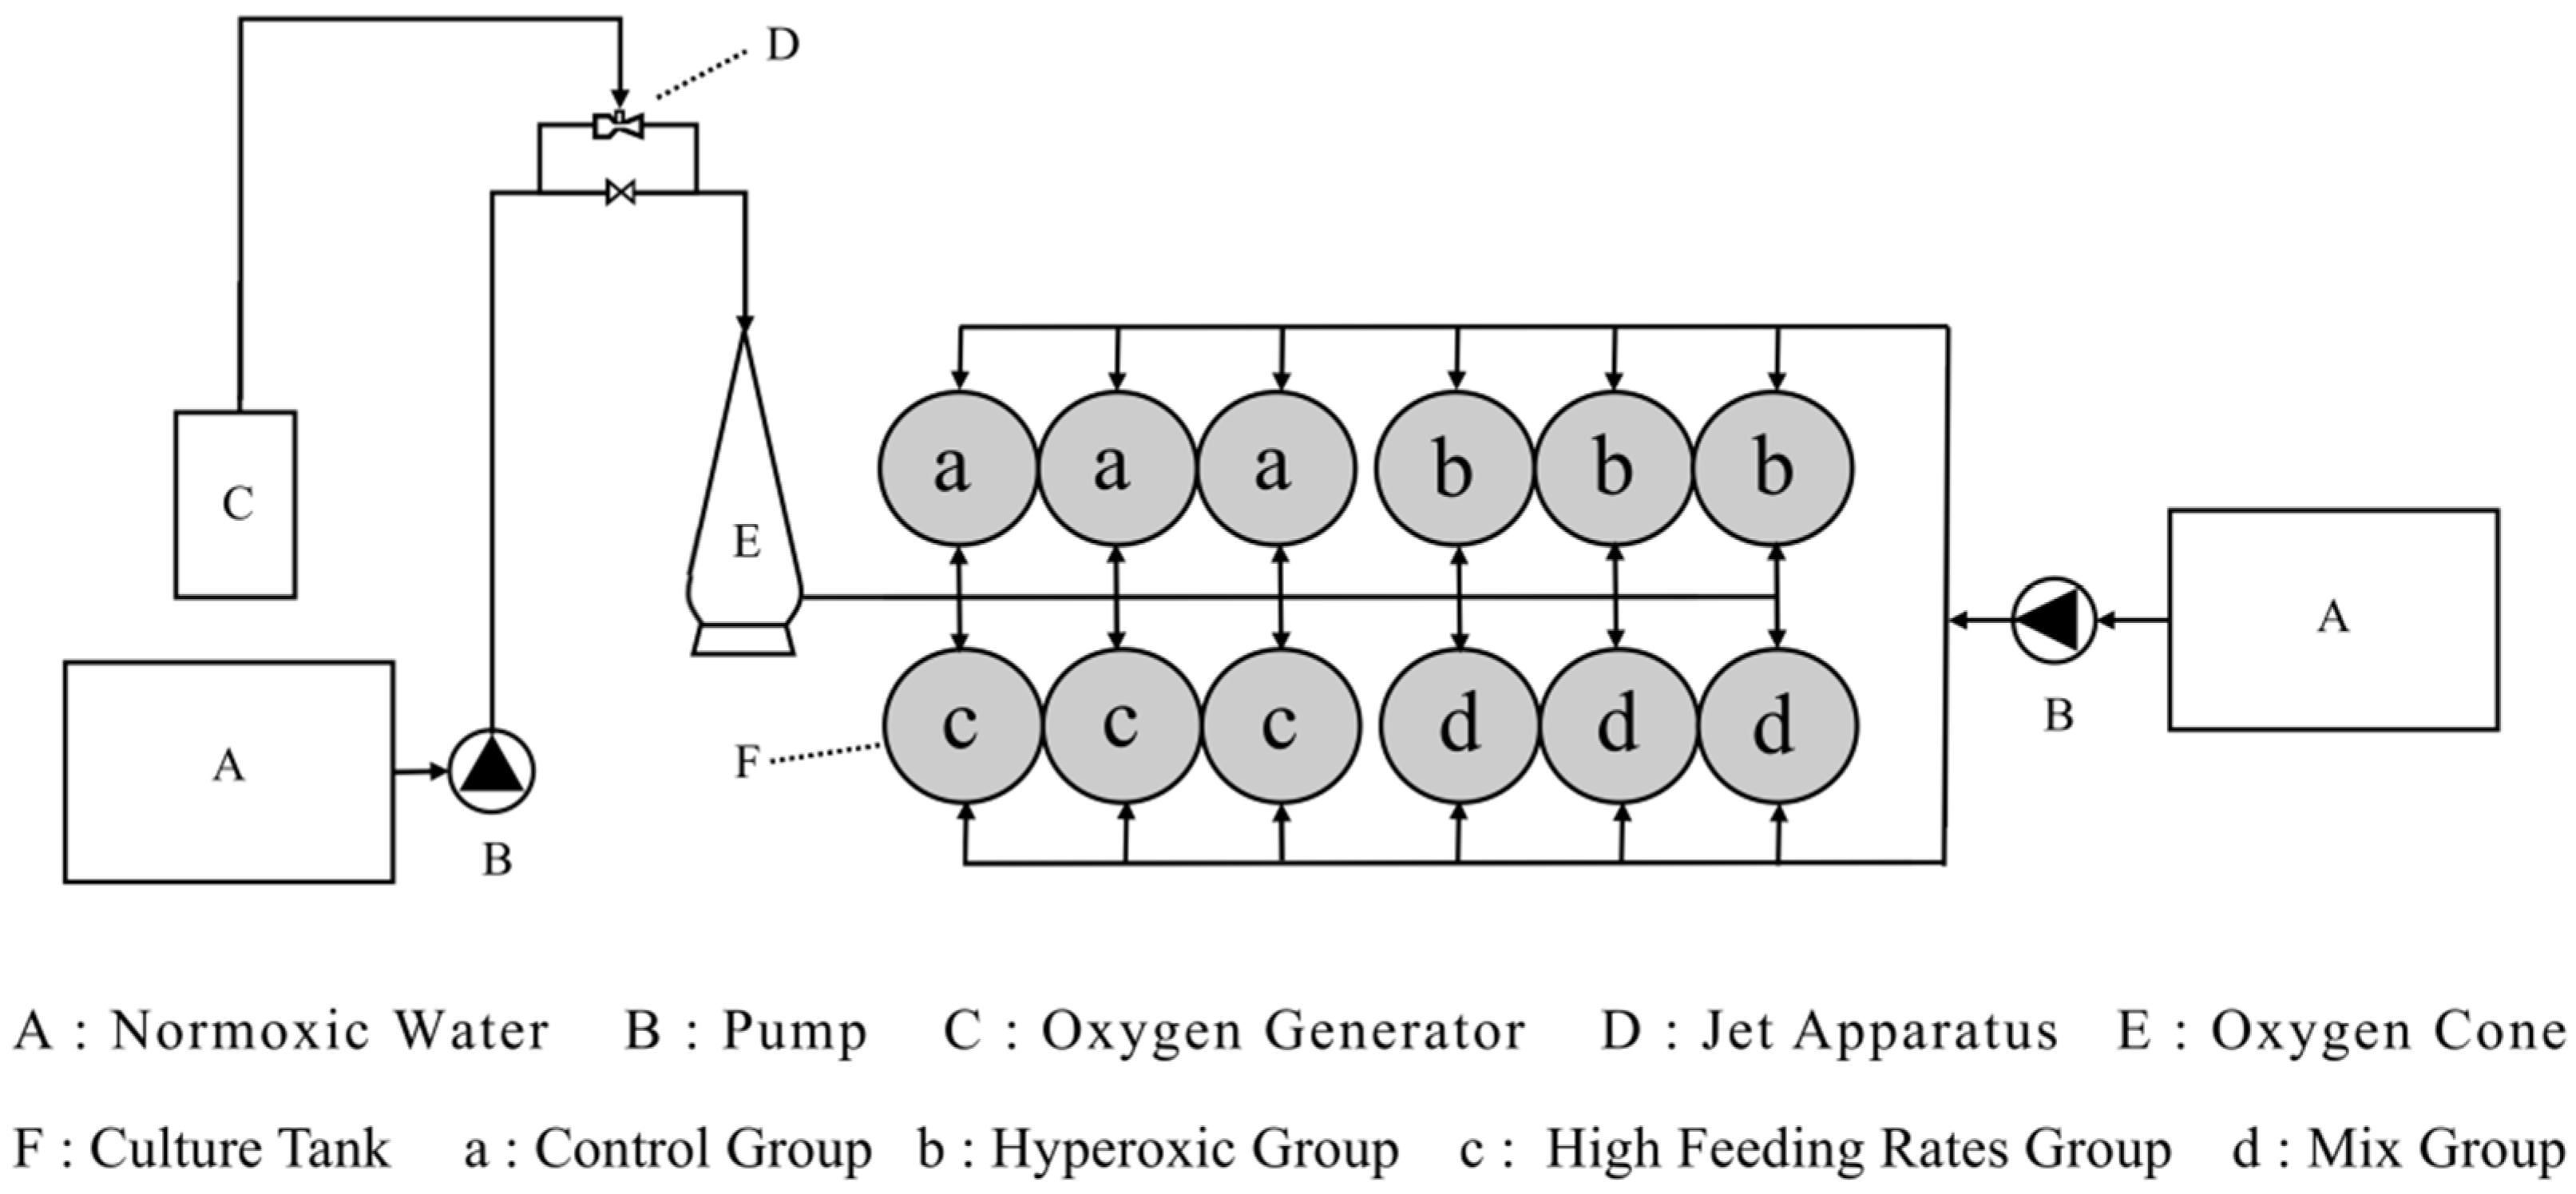
2.1. Fish and Aquaculture Facilities

The experiment was conducted over a period of 60 days, from 22 August to 20 October, 2023, at Laizhou Mingbo Aquatic Products Co. Ltd. (Yantai, China). The fish employed in this experiment were hybrid groupers (E. fuscoguttatus ♀ × E. tukula ♂), bred by the company under uniform breeding conditions. A total of 180 healthy, non-injured hybrid groupers with an average initial body weight of 45.70 ± 2.36 g were selected for the experimental research.
Before the experiment, the selected hybrid groupers were distributed into 12 breeding barrels with identical dimensions (120 cm in diameter and 60 cm in height) for a period of temporary rearing spanning 15 days. The aquaculture system utilized a flowing water supply. The natural seawater is initially filtered and subsequently combined with pure oxygen within an oxygen cone prior to its introduction into the breeding tank. The water temperature was maintained at 27.30 ± 1.08 °C, the DO levels averaged 6.57 ± 0.84 mg/L, the pH was measured at 7.29 ± 0.04 and the salinity levels stabilized at 28.48 ± 0.21. All grouper were provided with a compound pelleted diet (Santong Bioengineering Co. Ltd., Weifang, China). The composition of the feed is as follows: crude protein 55%, crude fat 10%, and ash content 15%. The daily FR is 2% of body weight. The feeding frequency is twice a day (9 a.m. and 5 p.m.). The health status of the fish was documented on a daily basis.

2.2. Experimental Design

The hybrid grouper (average initial body weight: 56.90 ± 2.08 g) was chosen, which had been domesticated for a period of 15 days. Fish were randomly assigned to twelve tanks, with fifteen juveniles in each tank. Oxygen is introduced into all culture tanks via oxygen cone, and the DO levels are regulated by adjusting the ratio of natural seawater to the flow from the oxygen cone outlet over a period of three days (Figure 1). Before the experiment, we conducted a preliminary experiment and found that 5% was the maximum FR. No feeding occurred during this period of adjustment. This study employed a two-factor experimental design, incorporating two FRs (2% and 3.5% of body weight) and two DO levels (6.34 ± 0.72 mg/L and 9.26 ± 0.48 mg/L). The control group (CK) was maintained at a FR of 2% and a DO level of 6 mg/L throughout the study. The hyperoxia group (HDO) had a FR of 2% and a DO level of 9 mg/L. The high FR treatment group (HFR) was established with a FR of 3.5% and a DO level of 6 mg/L, while the mixed group (MIX) consisted of a FR of 3.5% and a DO level of 9 mg/L (Figure 1). Each treatment group included three replicates. The experiment was conducted over a period of 60 days. Throughout the course of the experiment, fish were fed twice a day, with each feeding comprising half of the total daily feed quantity. Their body length and weight were measured biweekly to facilitate adjustments in feeding amounts as necessary. The FRs were adjusted based on the dietary intake observed in the HFR group. The mean temperature of the water within the aquaculture tank was 27.19 ± 1.84 °C, the pH was kept at 7.27 ± 0.03 and the salinity was maintained at 28.52 ± 0.11 parts per thousand (ppt). Over the experiment, concentrations of ammonia nitrogen, nitrite and nitrate were kept below 0.5 mg/L, 0.5 mg/L and 1 mg/L, respectively.

2.3. Sampling

Prior to sampling, all fish were starved for 24 h. At the end of the stocking phase and the 60-day culture period, three fish were randomly selected from each tank for sample collection. All sampling was performed after fish were euthanized by MS-222 (70 mg/L). The growth sampling of stocked fish was conducted, during which the total length and weight of individual fish were recorded. Once the fish had been weighed, blood was collected from the caudal vasculature using a needle and a non-heparinized syringe. This was then subjected to a five-minute centrifugation at 3000× g in order to obtain serum. This procedure was conducted subsequent to the blood being permitted to coagulate at 4 °C for a period of five hours. The serum was stored at −80 °C until analysis was conducted. Following dissection, the liver, brain, gills and muscles were collected and frozen immediately in liquid nitrogen in their intact state.

2.4. Untargeted Metabolomic Analysis

A total of six serum samples were randomly selected from each group for metabolomic analysis. The serum (100 μL) were placed in the Eppendorf tubes and resuspended with prechilled 80% methanol by well vortex, as previously described [24,25]. Subsequently, the samples were incubated on ice for 5 min and then subjected to centrifugation at 15,000× g, 4 °C for 20 min. A portion of the supernatant was diluted to a final concentration of 53% methanol, prepared with LC-MS grade water. Each sample was then transferred to a fresh Eppendorf tube and centrifuged at 15,000× g, 4 °C for 20 min. Finally, the supernatant was injected into the LC-MS/MS [26].
UHPLC-MS/MS analyses were performed using a Vanquish UHPLC system (Thermo Fisher, Dreieich, Germany) coupled with an Orbitrap Q ExactiveTM HF mass spectrometer or an Orbitrap Q ExactiveTM HF-X mass spectrometer (Thermo Fisher, Dreieich, Germany) at Novogene Co., Ltd. (Beijing, China). The samples were injected onto a Hypersil Gold column (100 × 2.1 mm, 1.9 μm) using a 12 min linear gradient at a flow rate of 0.2 mL/min. The eluents for the positive and negative polarity modes were eluent A (0.1% FA in water) and eluent B (methanol). The solvent gradient was set as follows: 2% B, 1.5 min; 2–85% B, 3 min; 85–100% B, 10 min; 100–2% B, 10.1 min; 2% B, 12 min. The Q ExactiveTM HF mass spectrometer was operated in positive/negative polarity mode with spray voltage of 3.5 kV, capillary temperature of 320 °C, sheath gas flow rate of 35 psi, aux gas flow rate of 10 L/min, S-lens RF level of 60, and aux gas heater temperature of 350 °C.
The raw data files generated by UHPLC-MS/MS were processed using the Compound Discoverer 3.3 (CD3.3, Thermo Fisher, Dreieich, Germany) to perform peak alignment, peak picking, and quantitation for each metabolite. After that, the peak intensities were normalized to the total spectral intensity. The normalized data were employed to ascertain the molecular formula through the analysis of additive ions, molecular ion peaks and fragment ions. Subsequently, the peaks were matched with the mzCloud (https://www.mzcloud.org/, (accessed on 1 February 2024), mzVault and MassList databases. The statistical analyses were performed using the statistical software R (R version R-3.4.3), Python (Python 2.7.6 version) and CentOS (CentOS release 6.6). In instances where the data were not normally distributed, the values were standardized in accordance with the following formula: sample raw quantitation value/(the sum of sample metabolite quantitation value/the sum of QC1 sample metabolite quantitation value). This was carried out in order to obtain relative peak areas. Furthermore, any compounds whose CVs of relative peak areas in QC samples were greater than 30% were removed. Ultimately, the metabolites’ identification and relative quantification results were obtained.
The metabolites were annotated using the KEGG database (https://www.genome.jp/kegg/pathway.html, accessed on 15 February 2024). Principal components analysis (PCA) and partial least squares discriminant analysis (PLS-DA) were conducted using the metaX platform [27]. A univariate analysis (t-test) was employed to calculate the statistical significance (p-value). Metabolites with VIP > 1 and p-value < 0.05 and fold change ≥ 2 or FC ≤ 0.5 were identified as differential metabolites. Volcano plots were used to identify metabolites of interest, based on the log2(FoldChange) and −log10(p-value) of metabolites, using the ggplot2 function in the R language.
The functions of these metabolites and metabolic pathways were studied using the KEGG database. The enrichment of differential metabolites was evaluated through the examination of metabolic pathway ratios, where x/n > y/N, and the statistical significance of these pathways was determined by a p-value threshold of 0.05.

2.5. RNA Extraction and Real-Time Fluorescence Quantitative Determination

The primers were designed using Primier 5.0, with the internal reference gene was selected as 18S. The primers (Table 1) were derived from the Gene Bank and obtained from Tsingke Biotechnology Co. (Qingdao, China). Prior to the commencement of the experiment, the specificity and amplification efficiency of the primers were also evaluated. A total of six tissue samples were randomly selected from each group, and total RNA was extracted using Trizol. In summary, the sample was placed in a 1.5 mL centrifuge tube and 550 μL of Trizol (Vazyme, Nanjing, China) was added to the tube. Subsequently, chloroform as added to separate the organic and aqueous phases, followed by isopropanol to precipitate RNA. Finally, the RNA was washed twice with 75% ethanol. The cDNA was synthesized with a reverse transcription (RT) kit HiScript® III RT SuperMix for qPCR (+gDNA wiper) (Vazyme, Nanjing, China), in accordance with the manufacturer’s instructions. The experiment was conducted according to the TaKaRa TB GreenTM Premix Ex Taq™ II (Tli RNaseH Plus) (RR820A) kit, utilizing a 20 μL reaction system. Real-time quantitative PCR (RT-qPCR) analysis was conducted using a Bio-Rad CFX Connect Real-Time PCR System. The cDNA was amplified for 40 cycles of denaturation at 95 °C for 30 s, 95 °C for 5 s, and 60 °C for 30 s. The specificity of the PCR products was tested by melting-curve analysis. The relative mRNA expression was calculated using the 2−ΔΔCt method [28].

2.6. Assessment of Serum Biochemical Indices

From each group six serum samples were randomly selected for the assessment of serum biochemical indices. The following biochemical indices were determined using the fully automated biochemical analyzer (Rayto Chemray-160, Chicago, IL, USA), including total protein (TP, biuret method), alanine aminotransferase (ALT, IFCC rate method), aspartate aminotransferase (AST, IFCC rate method), alkaline phosphatase (ALP, AMP buffer method), total cholesterol (CHO, CHODPAP method), triglycerides (TG, GPO-PAP method). A mild plate reader (SpectraMax i3x, Shanghai Molecular Devices Instrument Ltd., Shanghai, China) was used to assess glucose (GLU, glucose oxidase method) levels. The assay kits were purchased from Nanjing Jiancheng Bioengineering Institute (Nanjing, China).

2.7. Statistical Analysis

All data are presented as mean ± standard deviation. To investigate the significance of the individual and interactive effects of DO and FR on the response variables, we employed two-way ANOVA and one-way ANOVA for the analysis of growth indicators, serum biochemical indicators and RT-qPCR expression data, in conjunction with Dunnett’s test via SPSS 26.0 software. In the two-way ANOVA, we assume that the two independent variables, DO and FR, may simultaneously affect the response variable. In one-way analysis of variance, we only consider DO or FR. Prior to conducting the ANOVA, the normality and homogeneity of variances were assessed using Bartlett’s test in SPSS. All results were considered statistically significant the 0.05 level.

3. Results

3.1. Growth Indicator

Table 2 shows the growth indices of the hybrid grouper in different experimental groups. After the 60-day culture, no significant differences in survival rates between different groups were observed. The growth indicator indicated that a lower feed rate results in improved feed conversion rates (FCRs) for fish, regardless of whether the DO level is 6 mg/L or 9 mg/L, but their final body weight and specific growth rate (SGR) were significantly lower. At a FR of 3.5%, the DO concentration of 9 mg/L, compared to 6 mg/L, significantly enhanced final body weight and optimized the feed conversion ratio. Table 3 reveals that when the two-way ANOVA was used, it showed DO and feed rate had a significant interaction for final body weight and specific growth rate.

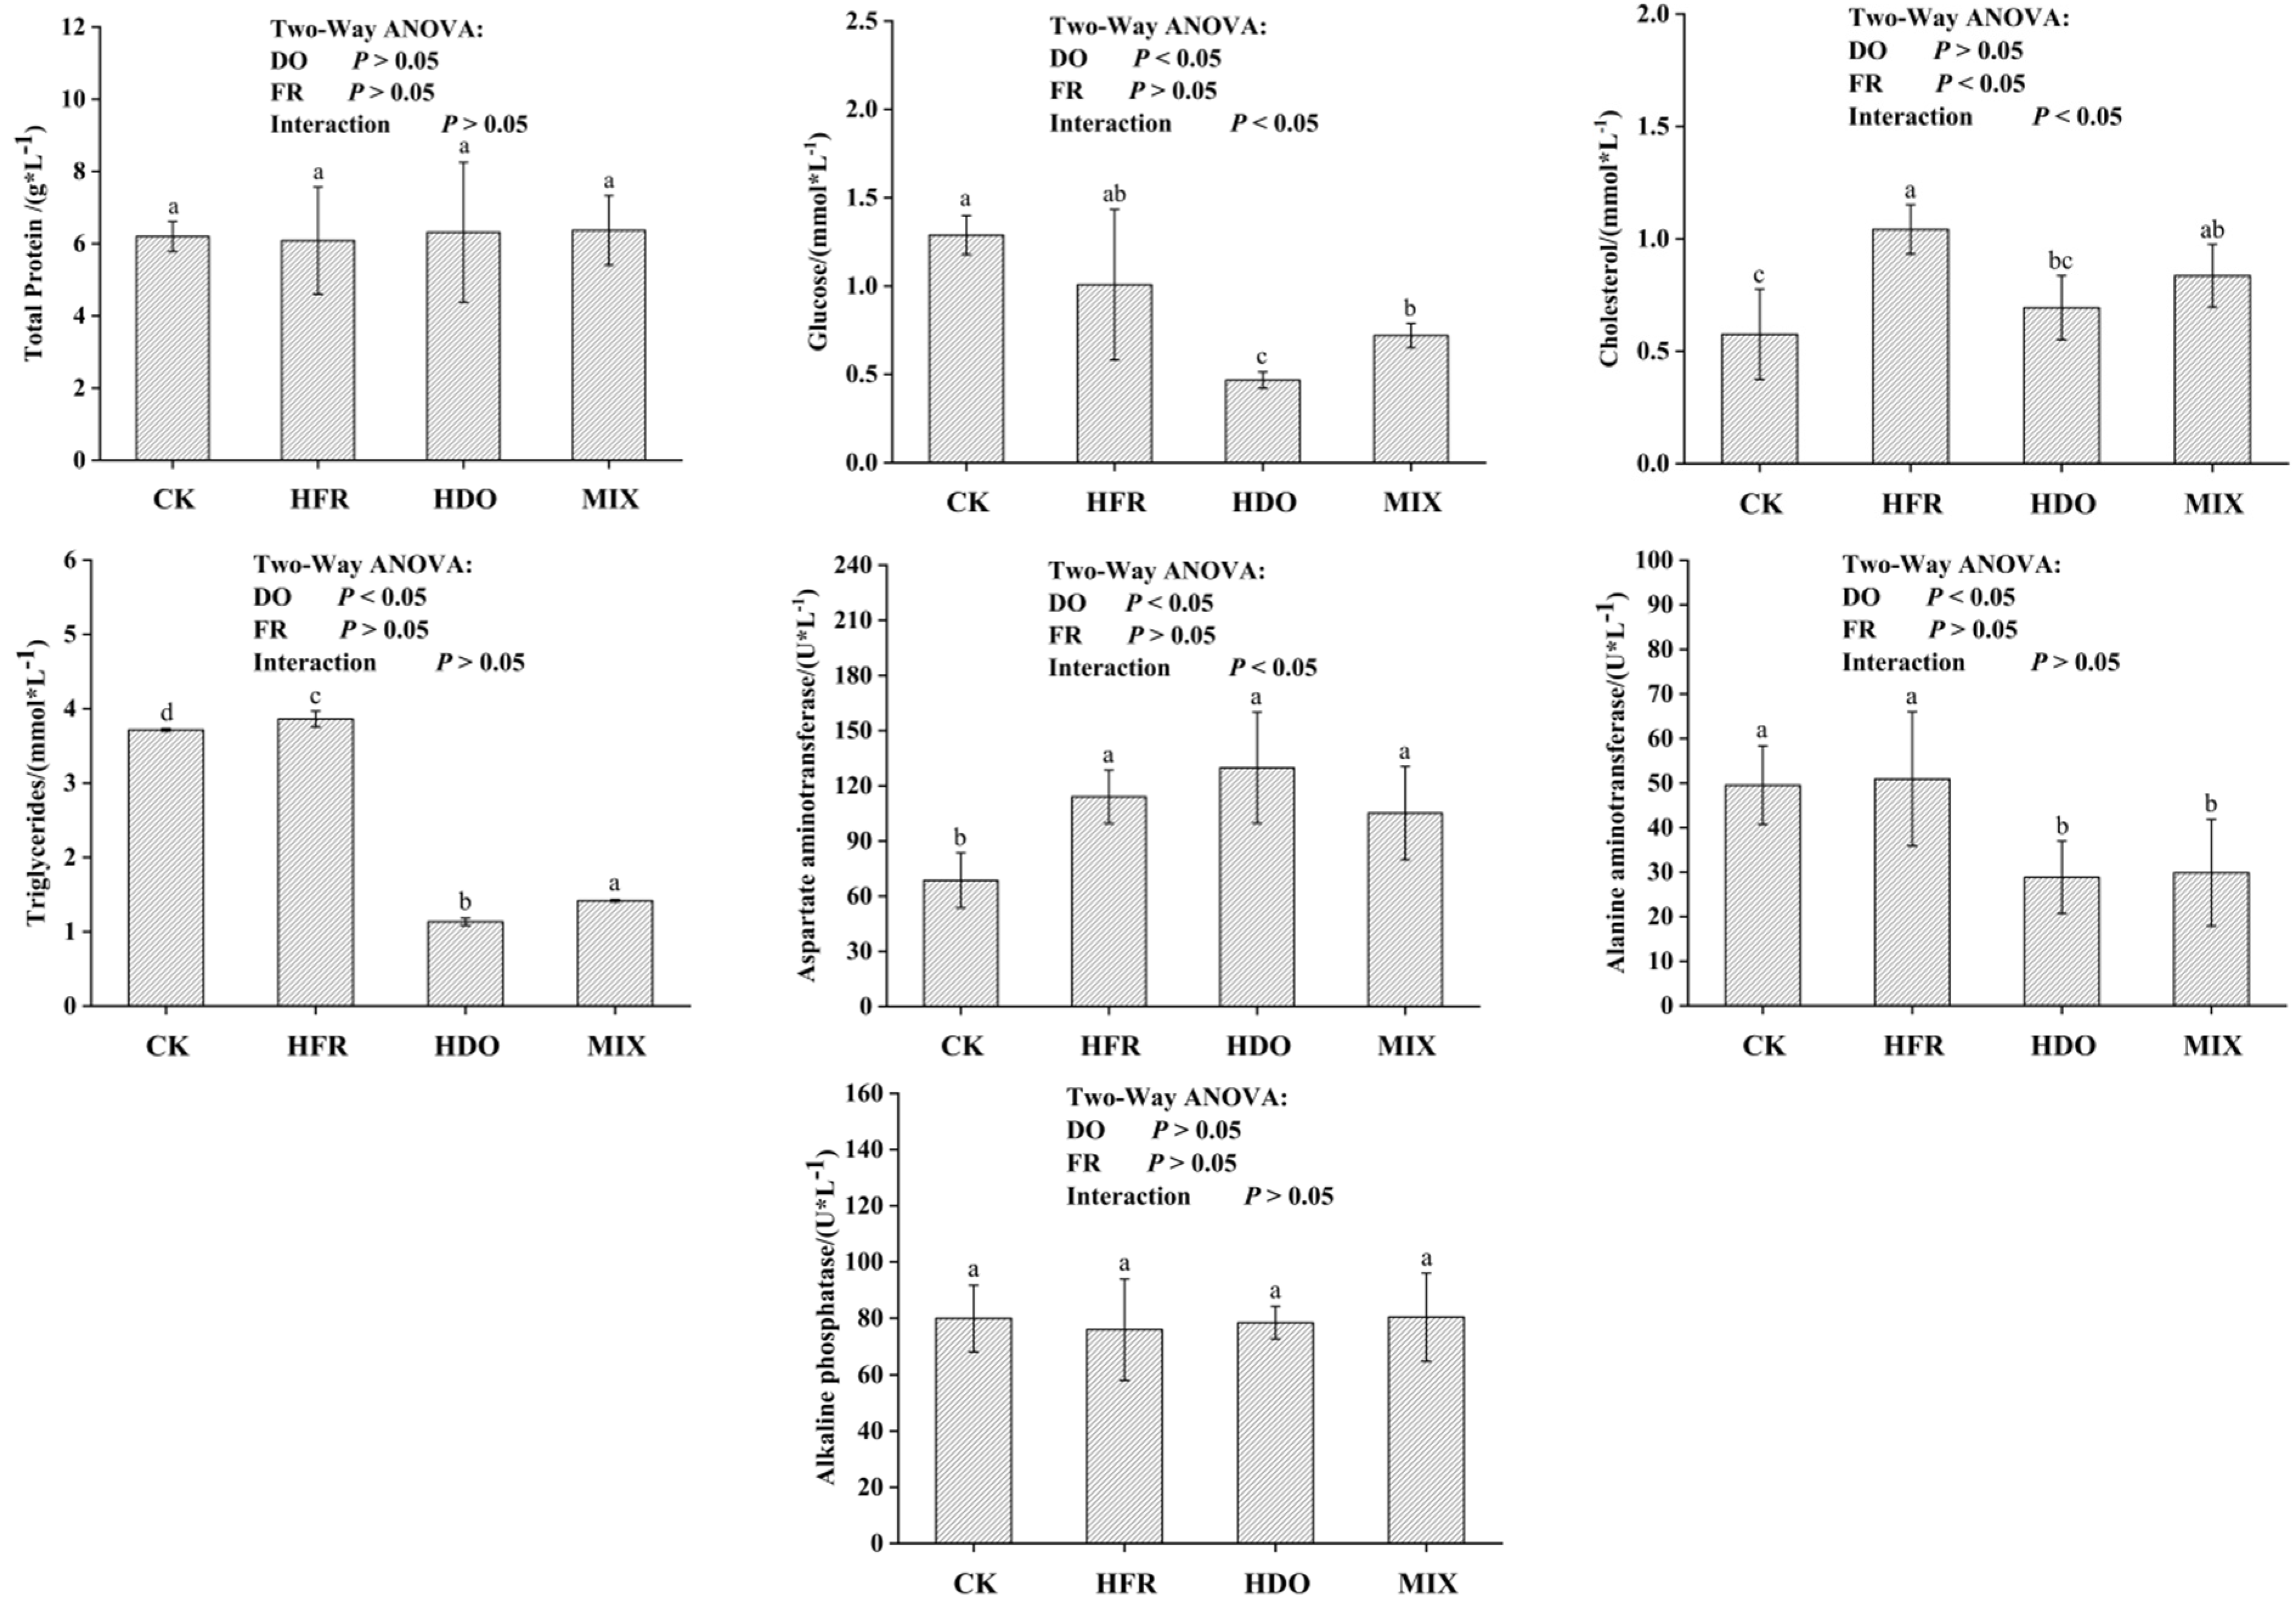
3.2. Physiological and Biochemical Serum Indicators

The physiological and biochemical serum indicators after 60 days are shown in Figure 2. The HDO group compared to CK group exhibited a significant decrease in the contents of GLU, TG and ALT (p < 0.05). Conversely, AST was significantly increased (p < 0.05). However, there were no significant differences in TP and ALP contents between the HDO group and the CK group (p > 0.05). In the MIX group, the levels of GLU and TG were significantly higher than in the HDO group. (p < 0.05). A two-way ANOVA showed a significant interaction (p < 0.05) between the effects of DO and FR on GLU, CHO and AST levels.

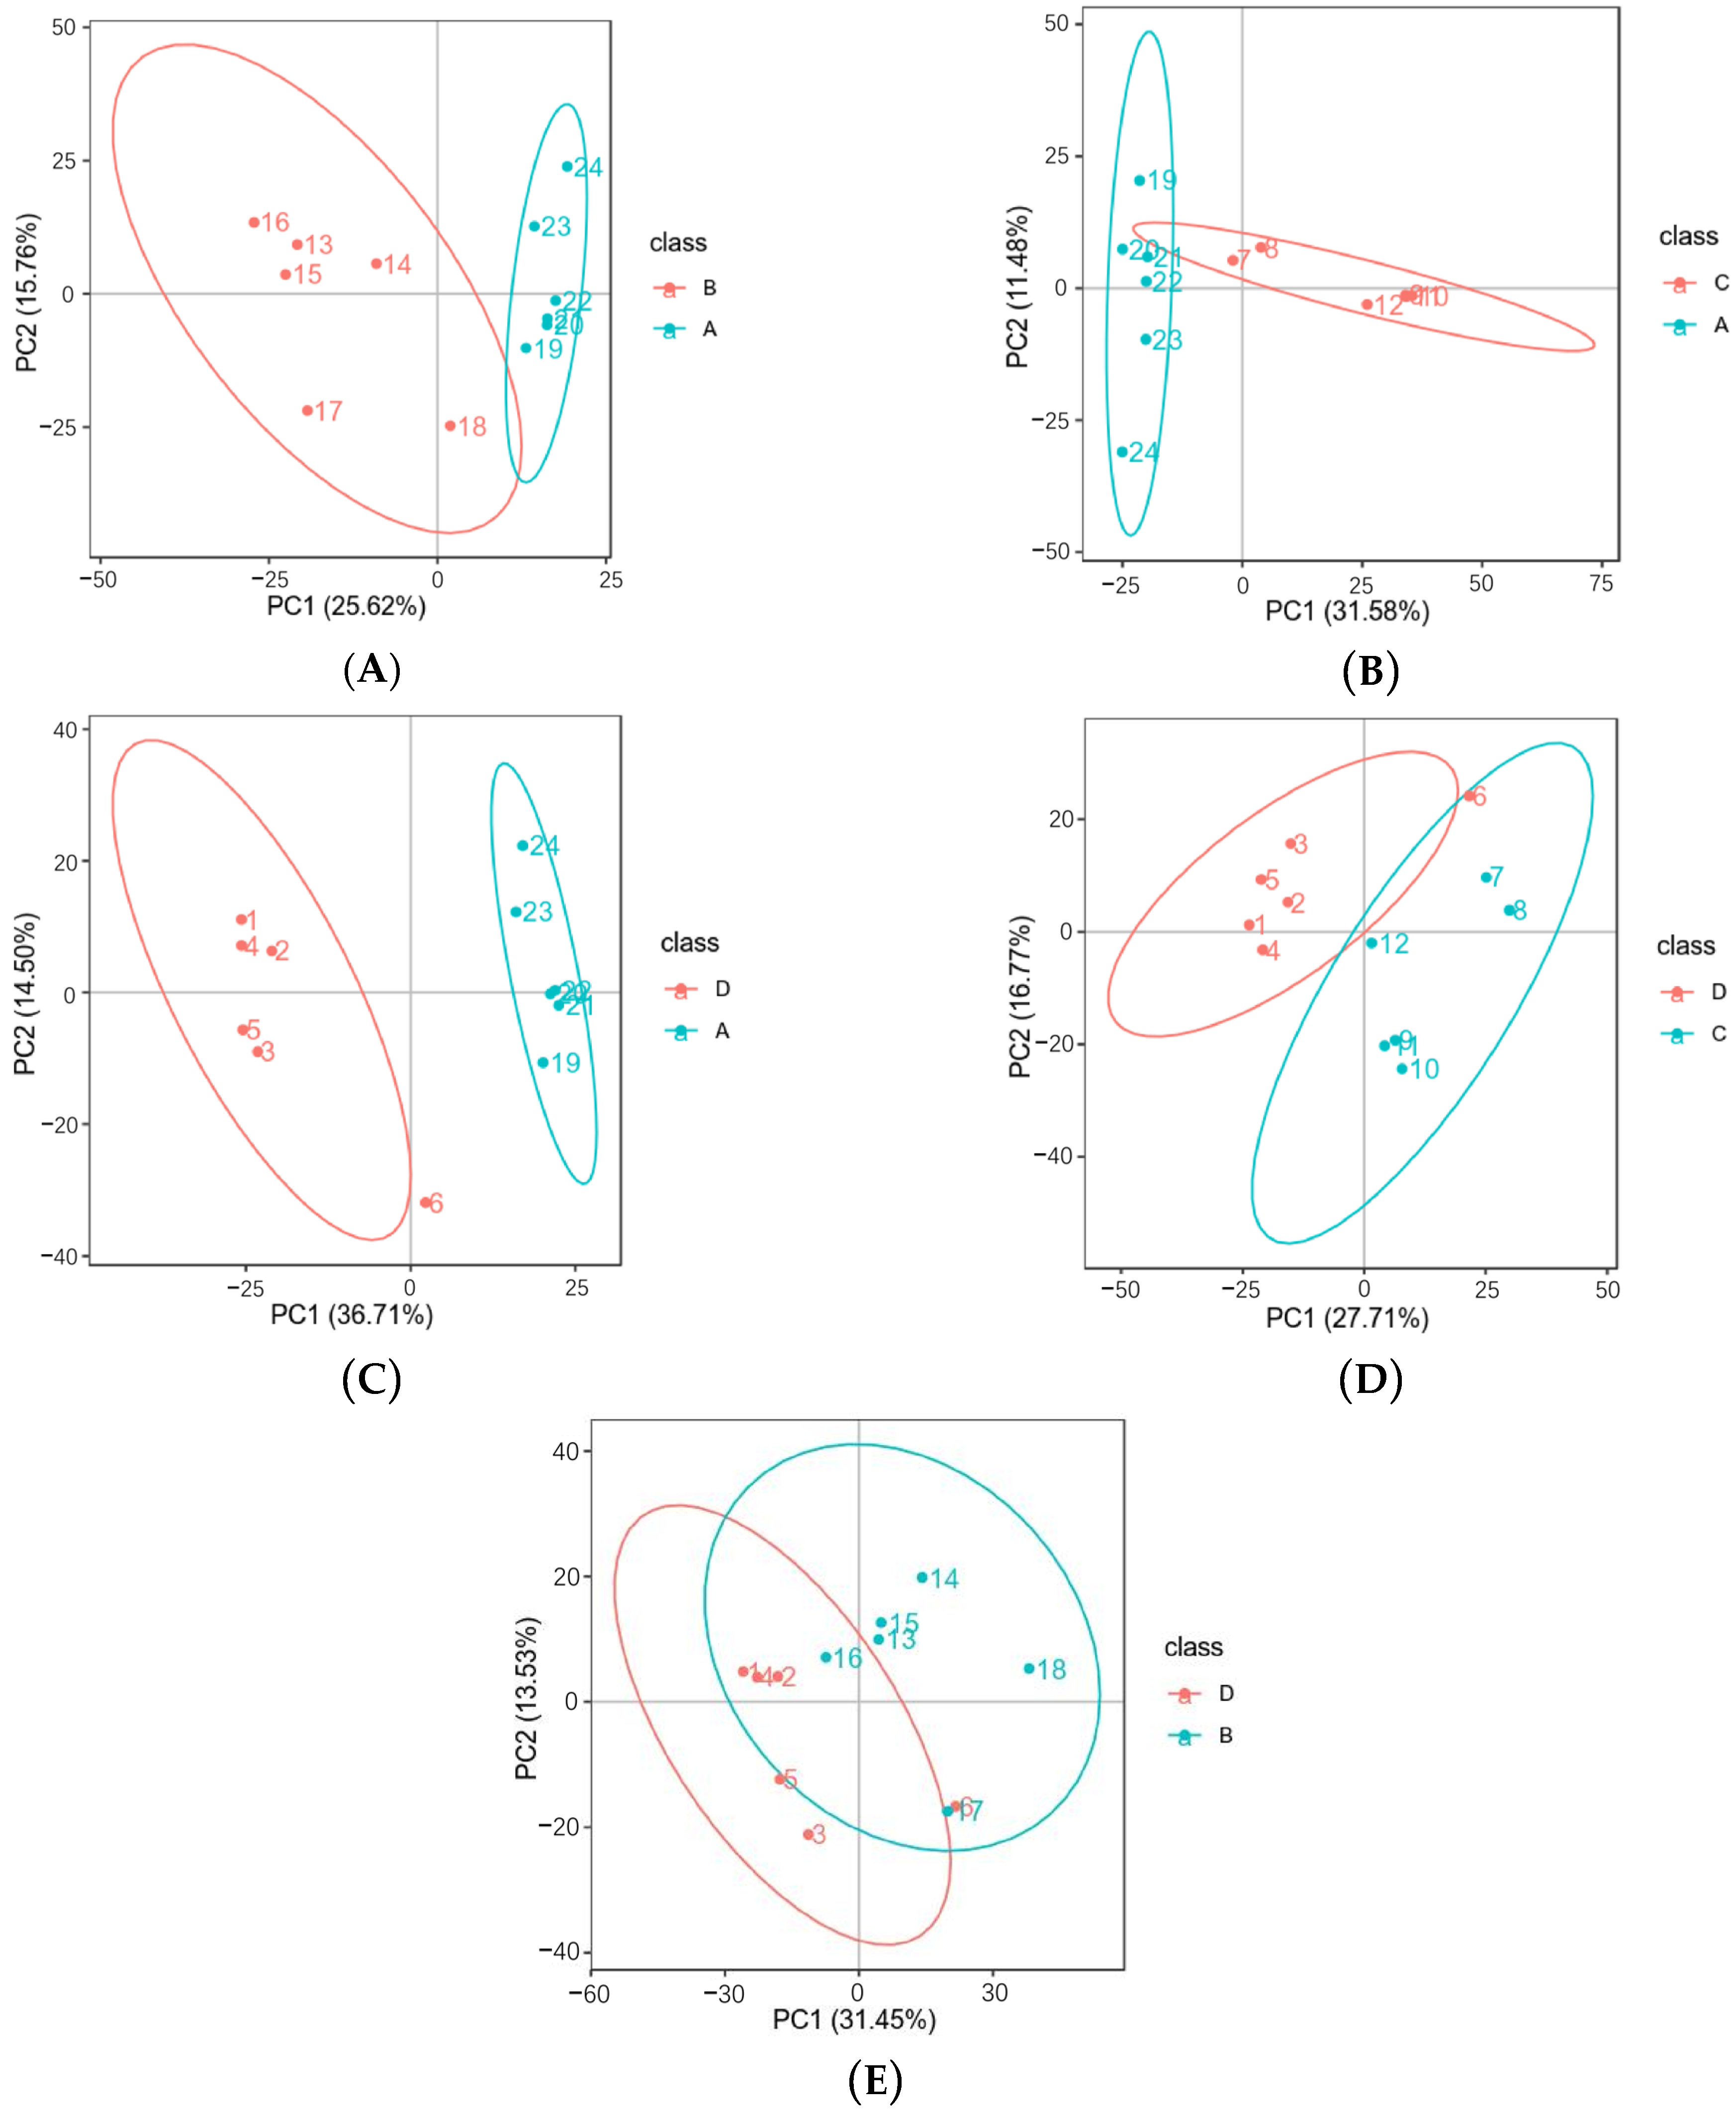
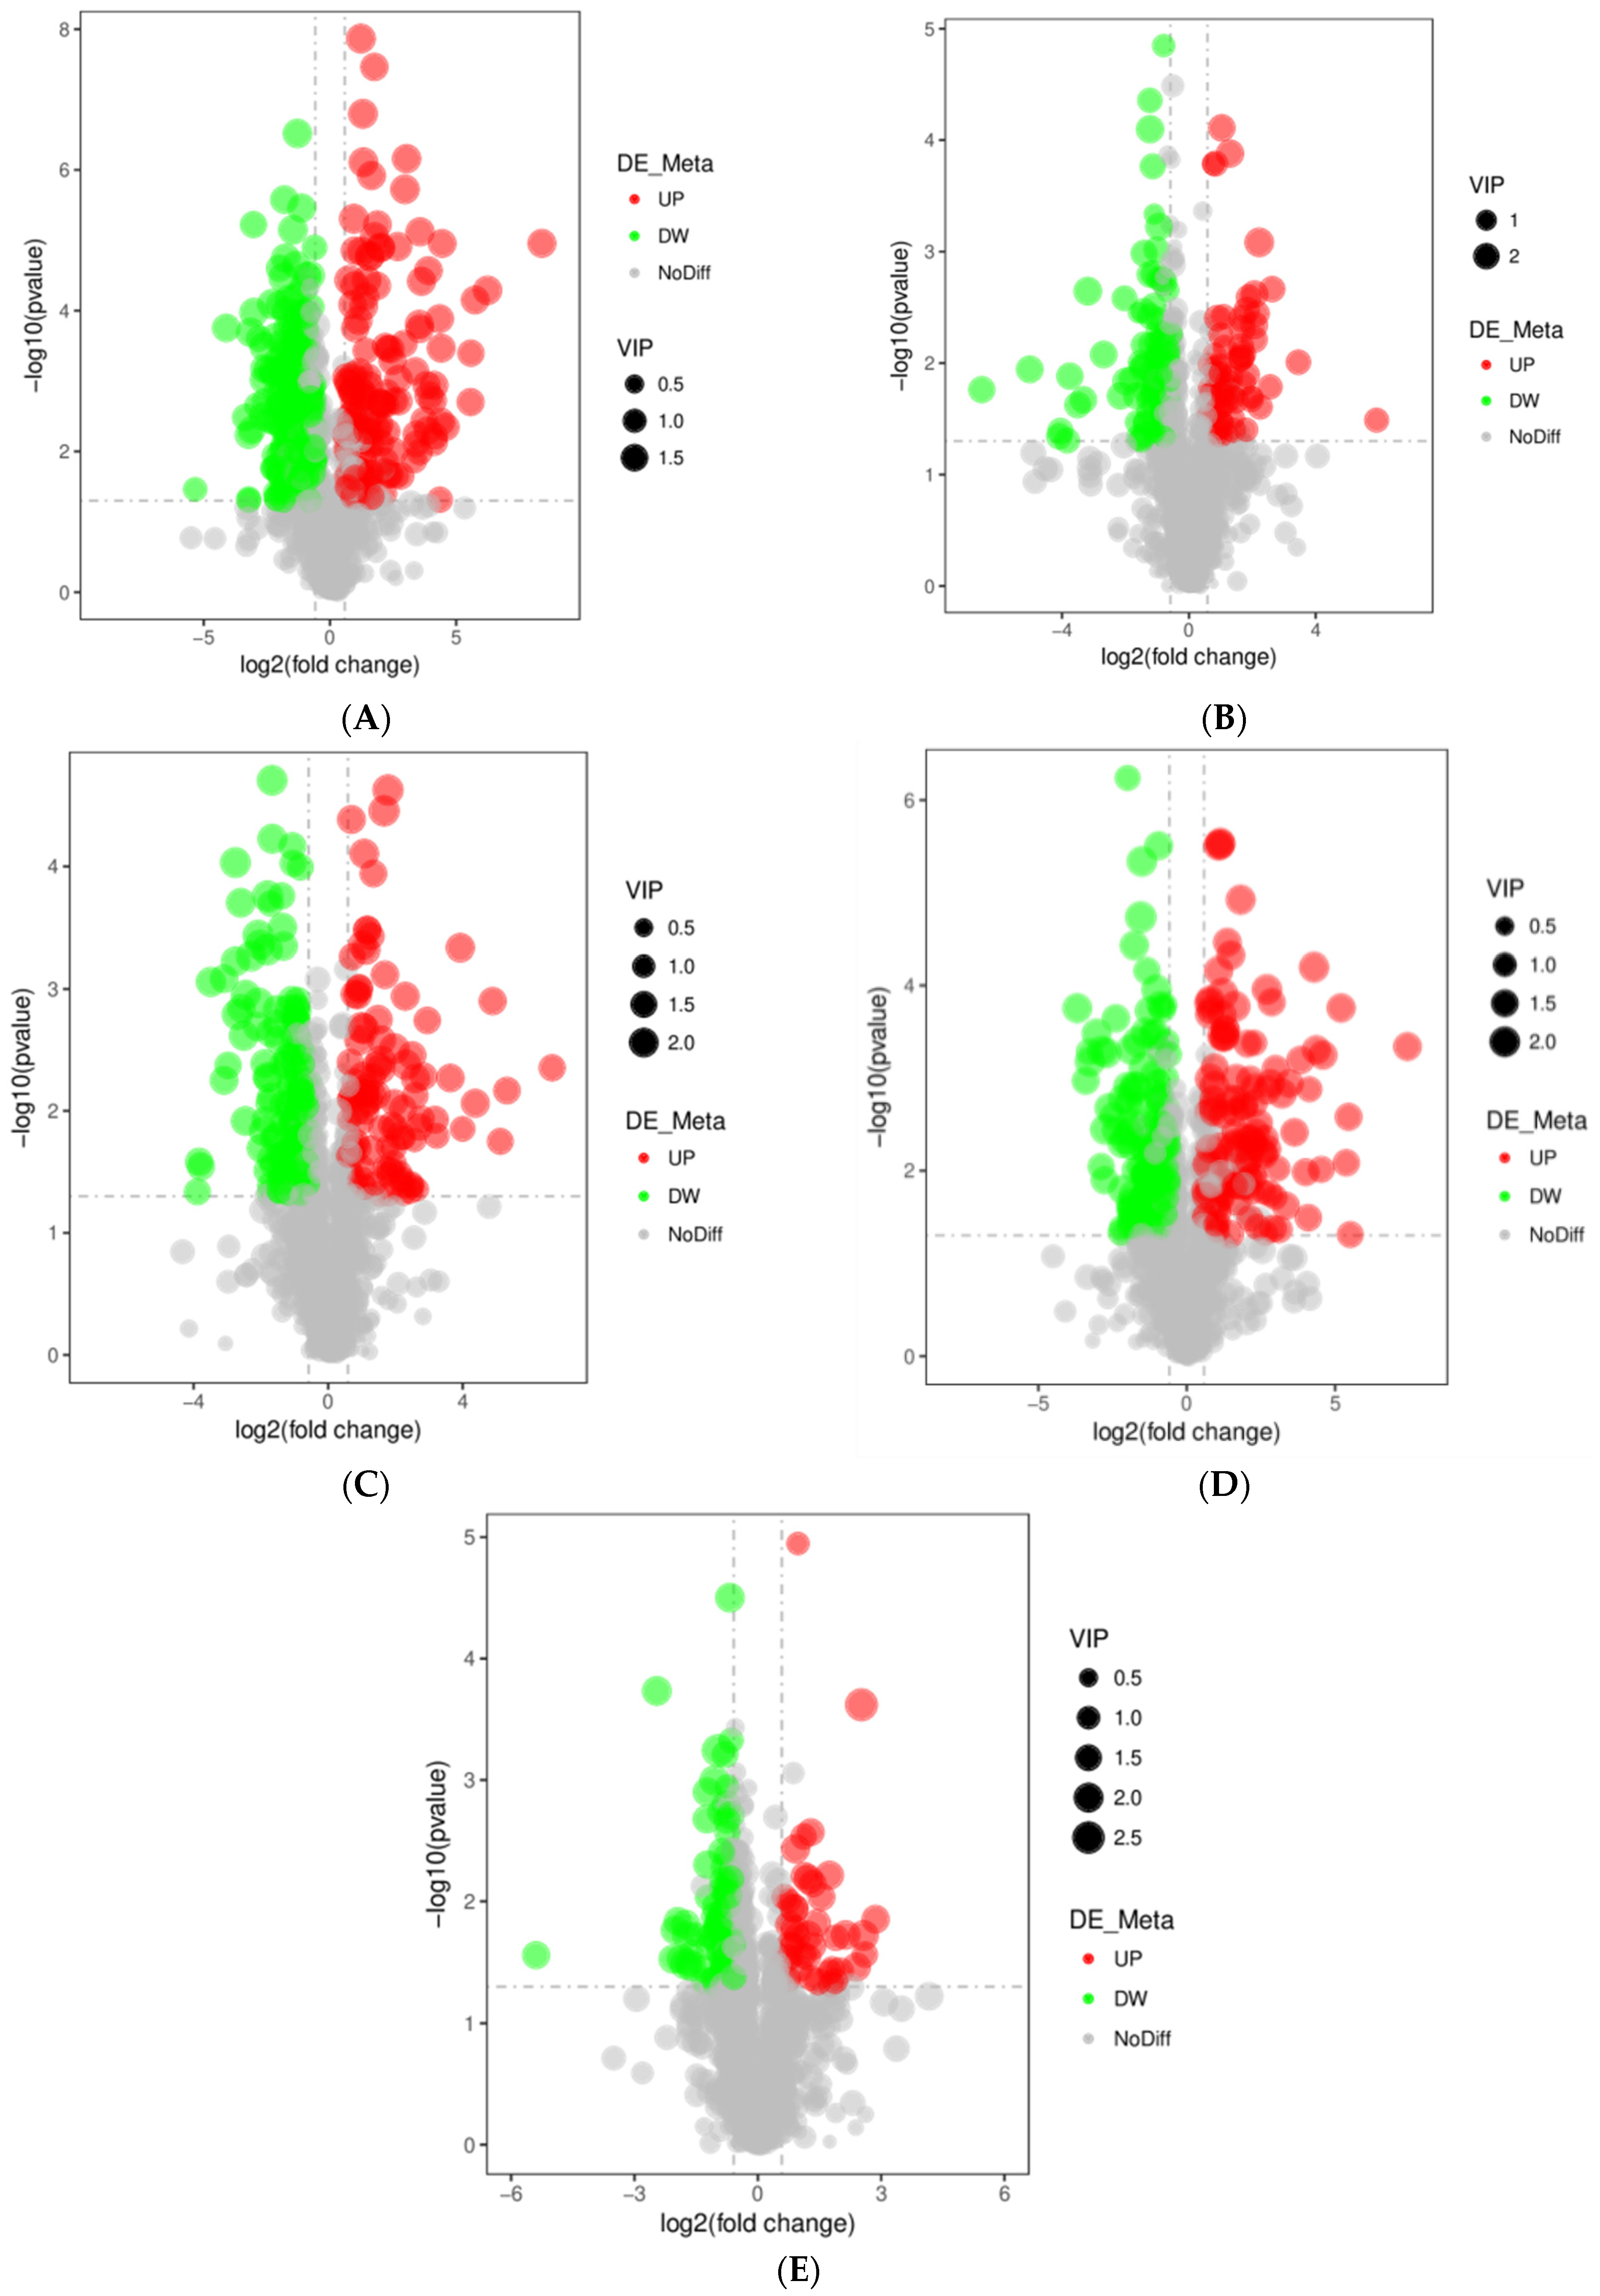
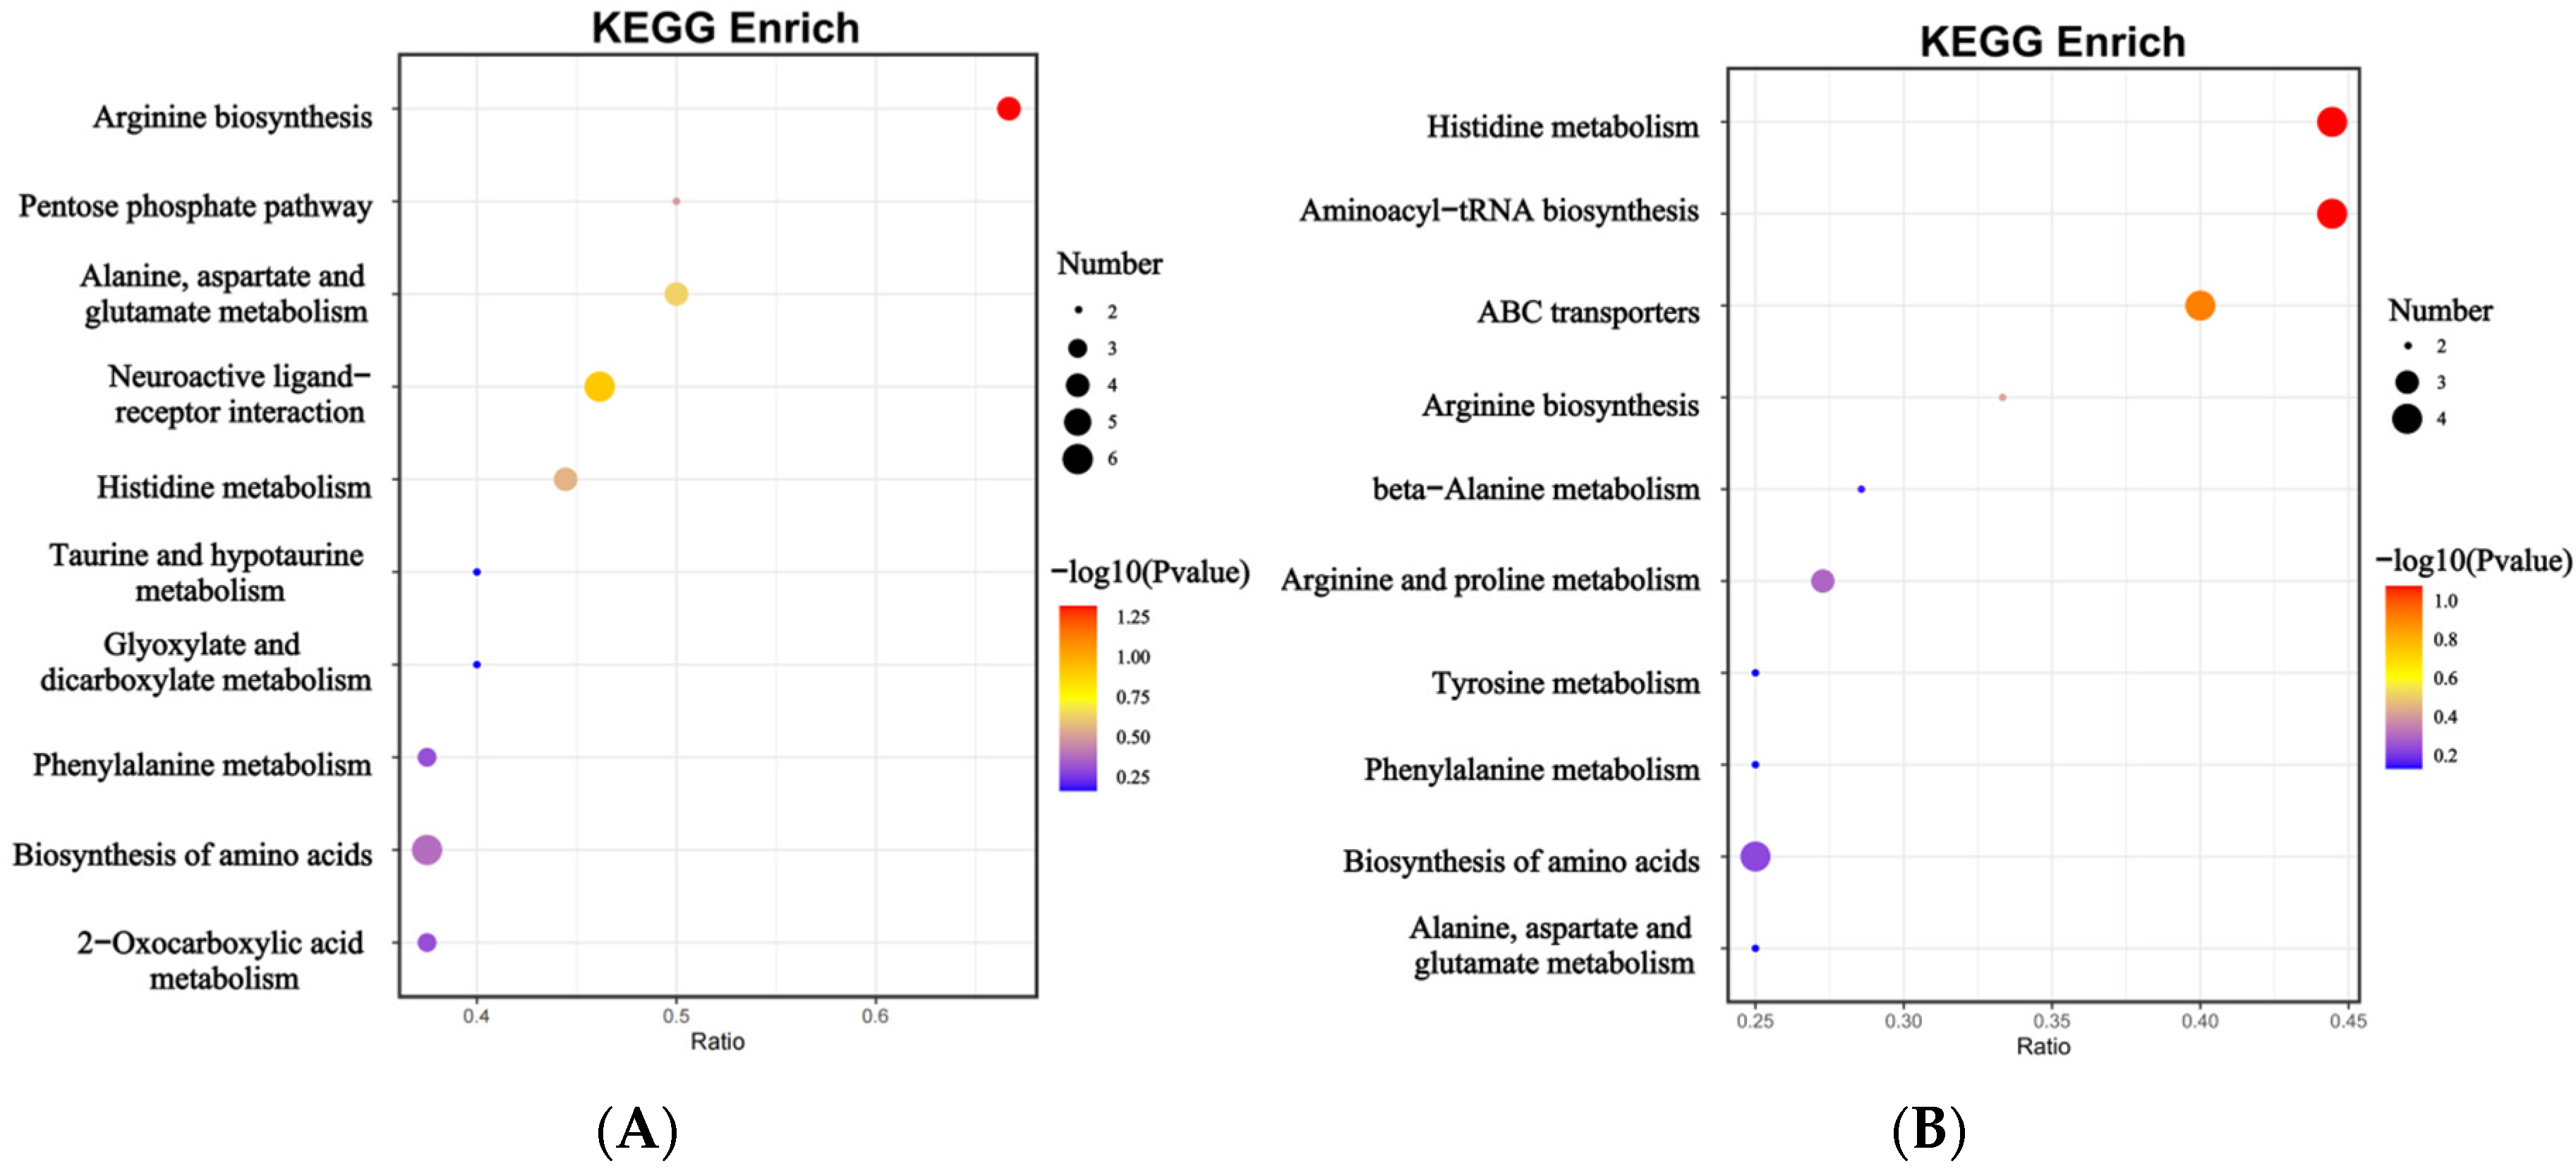
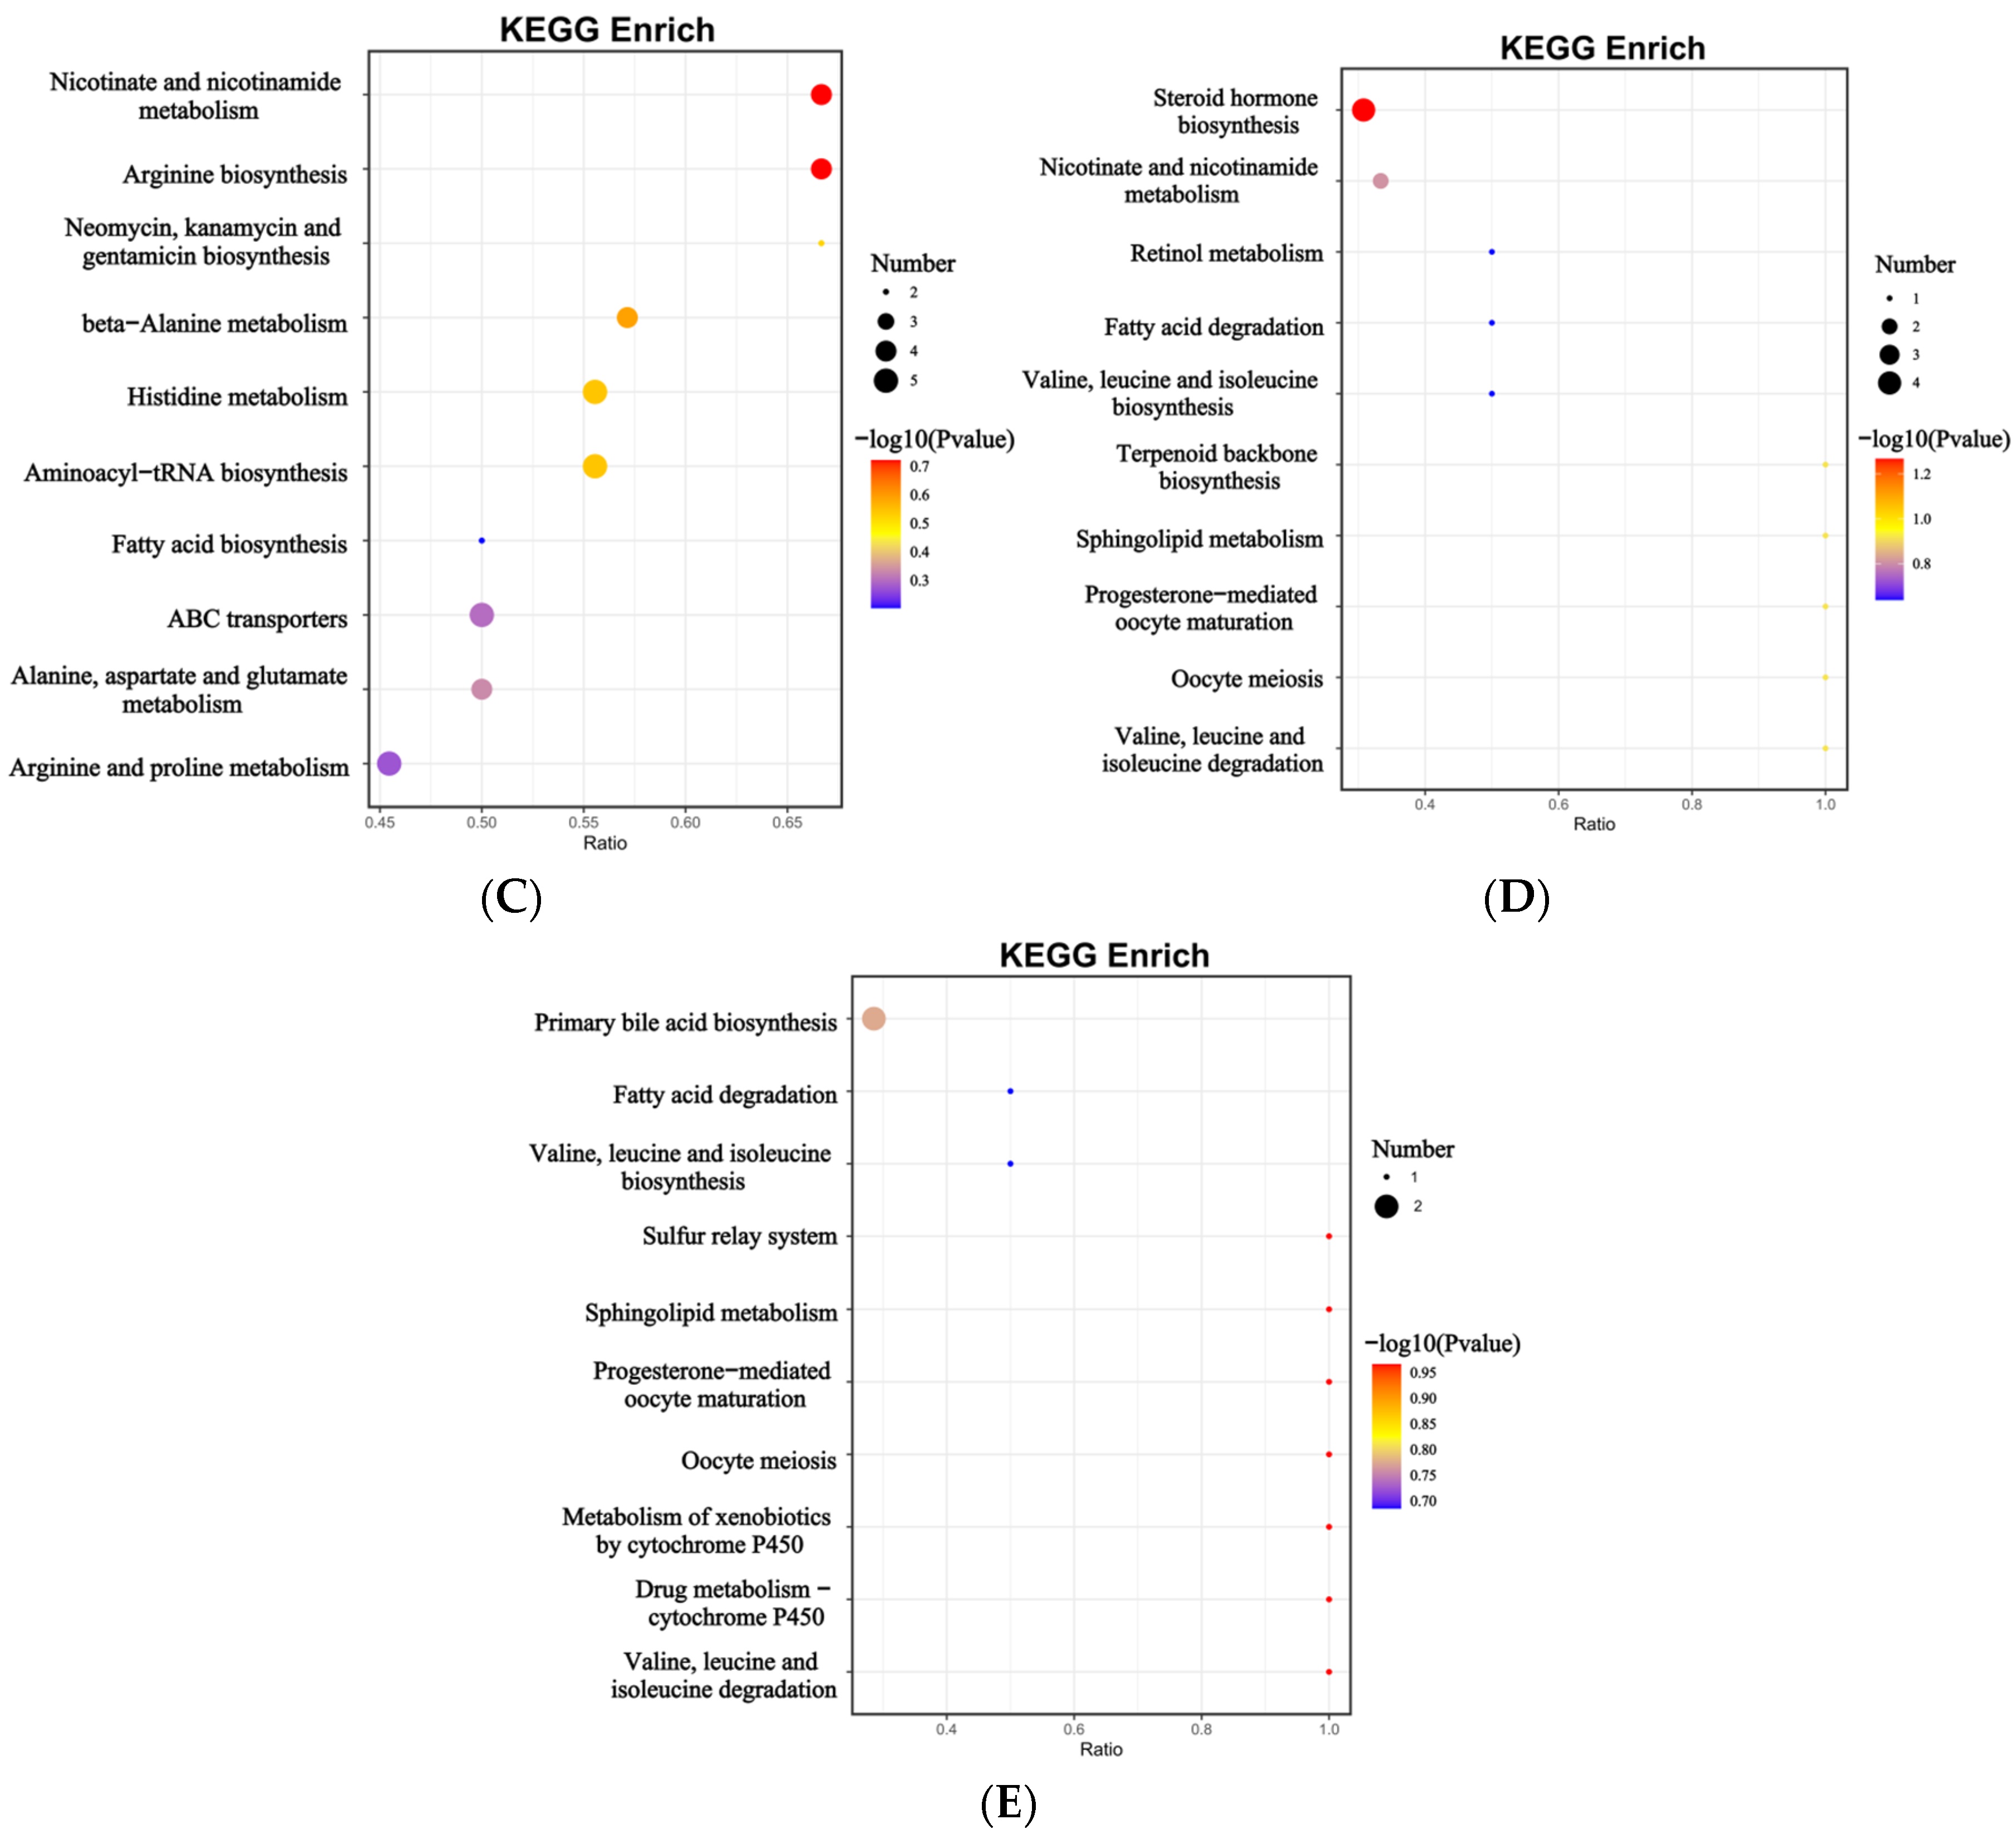
3.3. Differential Metabolites

Results of untargeted metabolomics analysis and PCA showed satisfactory within-group cohesion, with significant differences between treatments (Figure 3). DO levels, FR, as well as their combined function, all resulted in notable changes in the endogenous metabolites of the hybrid groupers. The HFR group resulted in 164 downregulated metabolites and 104 upregulated metabolites (Figure 4A). Notable changes were observed for L-argininosuccinate, alpha-ketoglutaric acid, L-glutamic acid and N-acetylornithine, etc. Substances L-argininosuccinate and L-glutamic acid were elevated. And alpha-ketoglutaric acid and N-acetylornithine were reduced. Similarly, a total of 180 downregulated metabolites and 129 upregulated metabolites were identified in the HDO group compared to the CK group (Figure 4B). The significantly altered metabolites include biotin, thiamine, L-histidine and betaine, etc. Among these metabolites, biotin and thiamine had decreased while L-histidine and betaine were elevated. The MIX group vs. CK group exhibited more differential metabolites, comprising 296 downregulated metabolites and 142 upregulated ones (Figure 4C). Significant changes were observed for carnosine and L-histidine, etc. Both have been significantly upregulated. In particular, our findings revealed that the MIX group exhibited 125 downregulated and 73 upregulated metabolites compared to those of the HDO group (Figure 4D). Notably altered metabolic products were progesterone, 17α-hydroxyprogesterone, dehydroepiandrosterone, and estriol. Each had been significantly downregulated. The MIX group vs. HFR group exhibited more differential metabolites, comprising 86 downregulated metabolites and 41 upregulated ones (Figure 4E). Significant changes were observed for cholic acid and glycocholic acid. Both had been significantly downregulated.
The differential metabolites (DEMs) were then identified for conducting the KEGG enrichment diagram. Hyperoxia significantly affects histidine metabolism, aminoacyl biosynthesis and ATP-binding cassette (ABC) transporter proteins. Furthermore, it also affects several metabolic pathways of amino acids such as arginine, β-alanine and other related amino acids, etc. (Figure 5A). FRs have the most pronounced impact on arginine biosynthesis (the substances included are L-argininosuccinate, alpha-ketoglutaric acid, L-glutamic acid, N-acetylornithine), followed by amino acid metabolic pathways (such as phenylalanine metabolism, histidine metabolism, etc.) (Figure 5B). The combined effect of DO and FR has the greatest influence on arginine biosynthesis (the substances included are L-argininosuccinate, alpha-ketoglutaric acid, L-glutamic acid, and N-acetylornithine.). Additionally, it impacts ABC transporter proteins, as well as histidine metabolism and β-alanine metabolism associated with carnosine synthesis (Figure 5C). Compared to the HDO group, two or more enriched differential metabolites for the steroid hormone biosynthetic pathway and niacin/nicotinamide metabolic pathway were observed in the MIX group (Figure 5D). The MIX group compared to the HFR group, only the primary bile acid synthesis pathway had two examples of differential metabolite enrichment (Figure 5E).

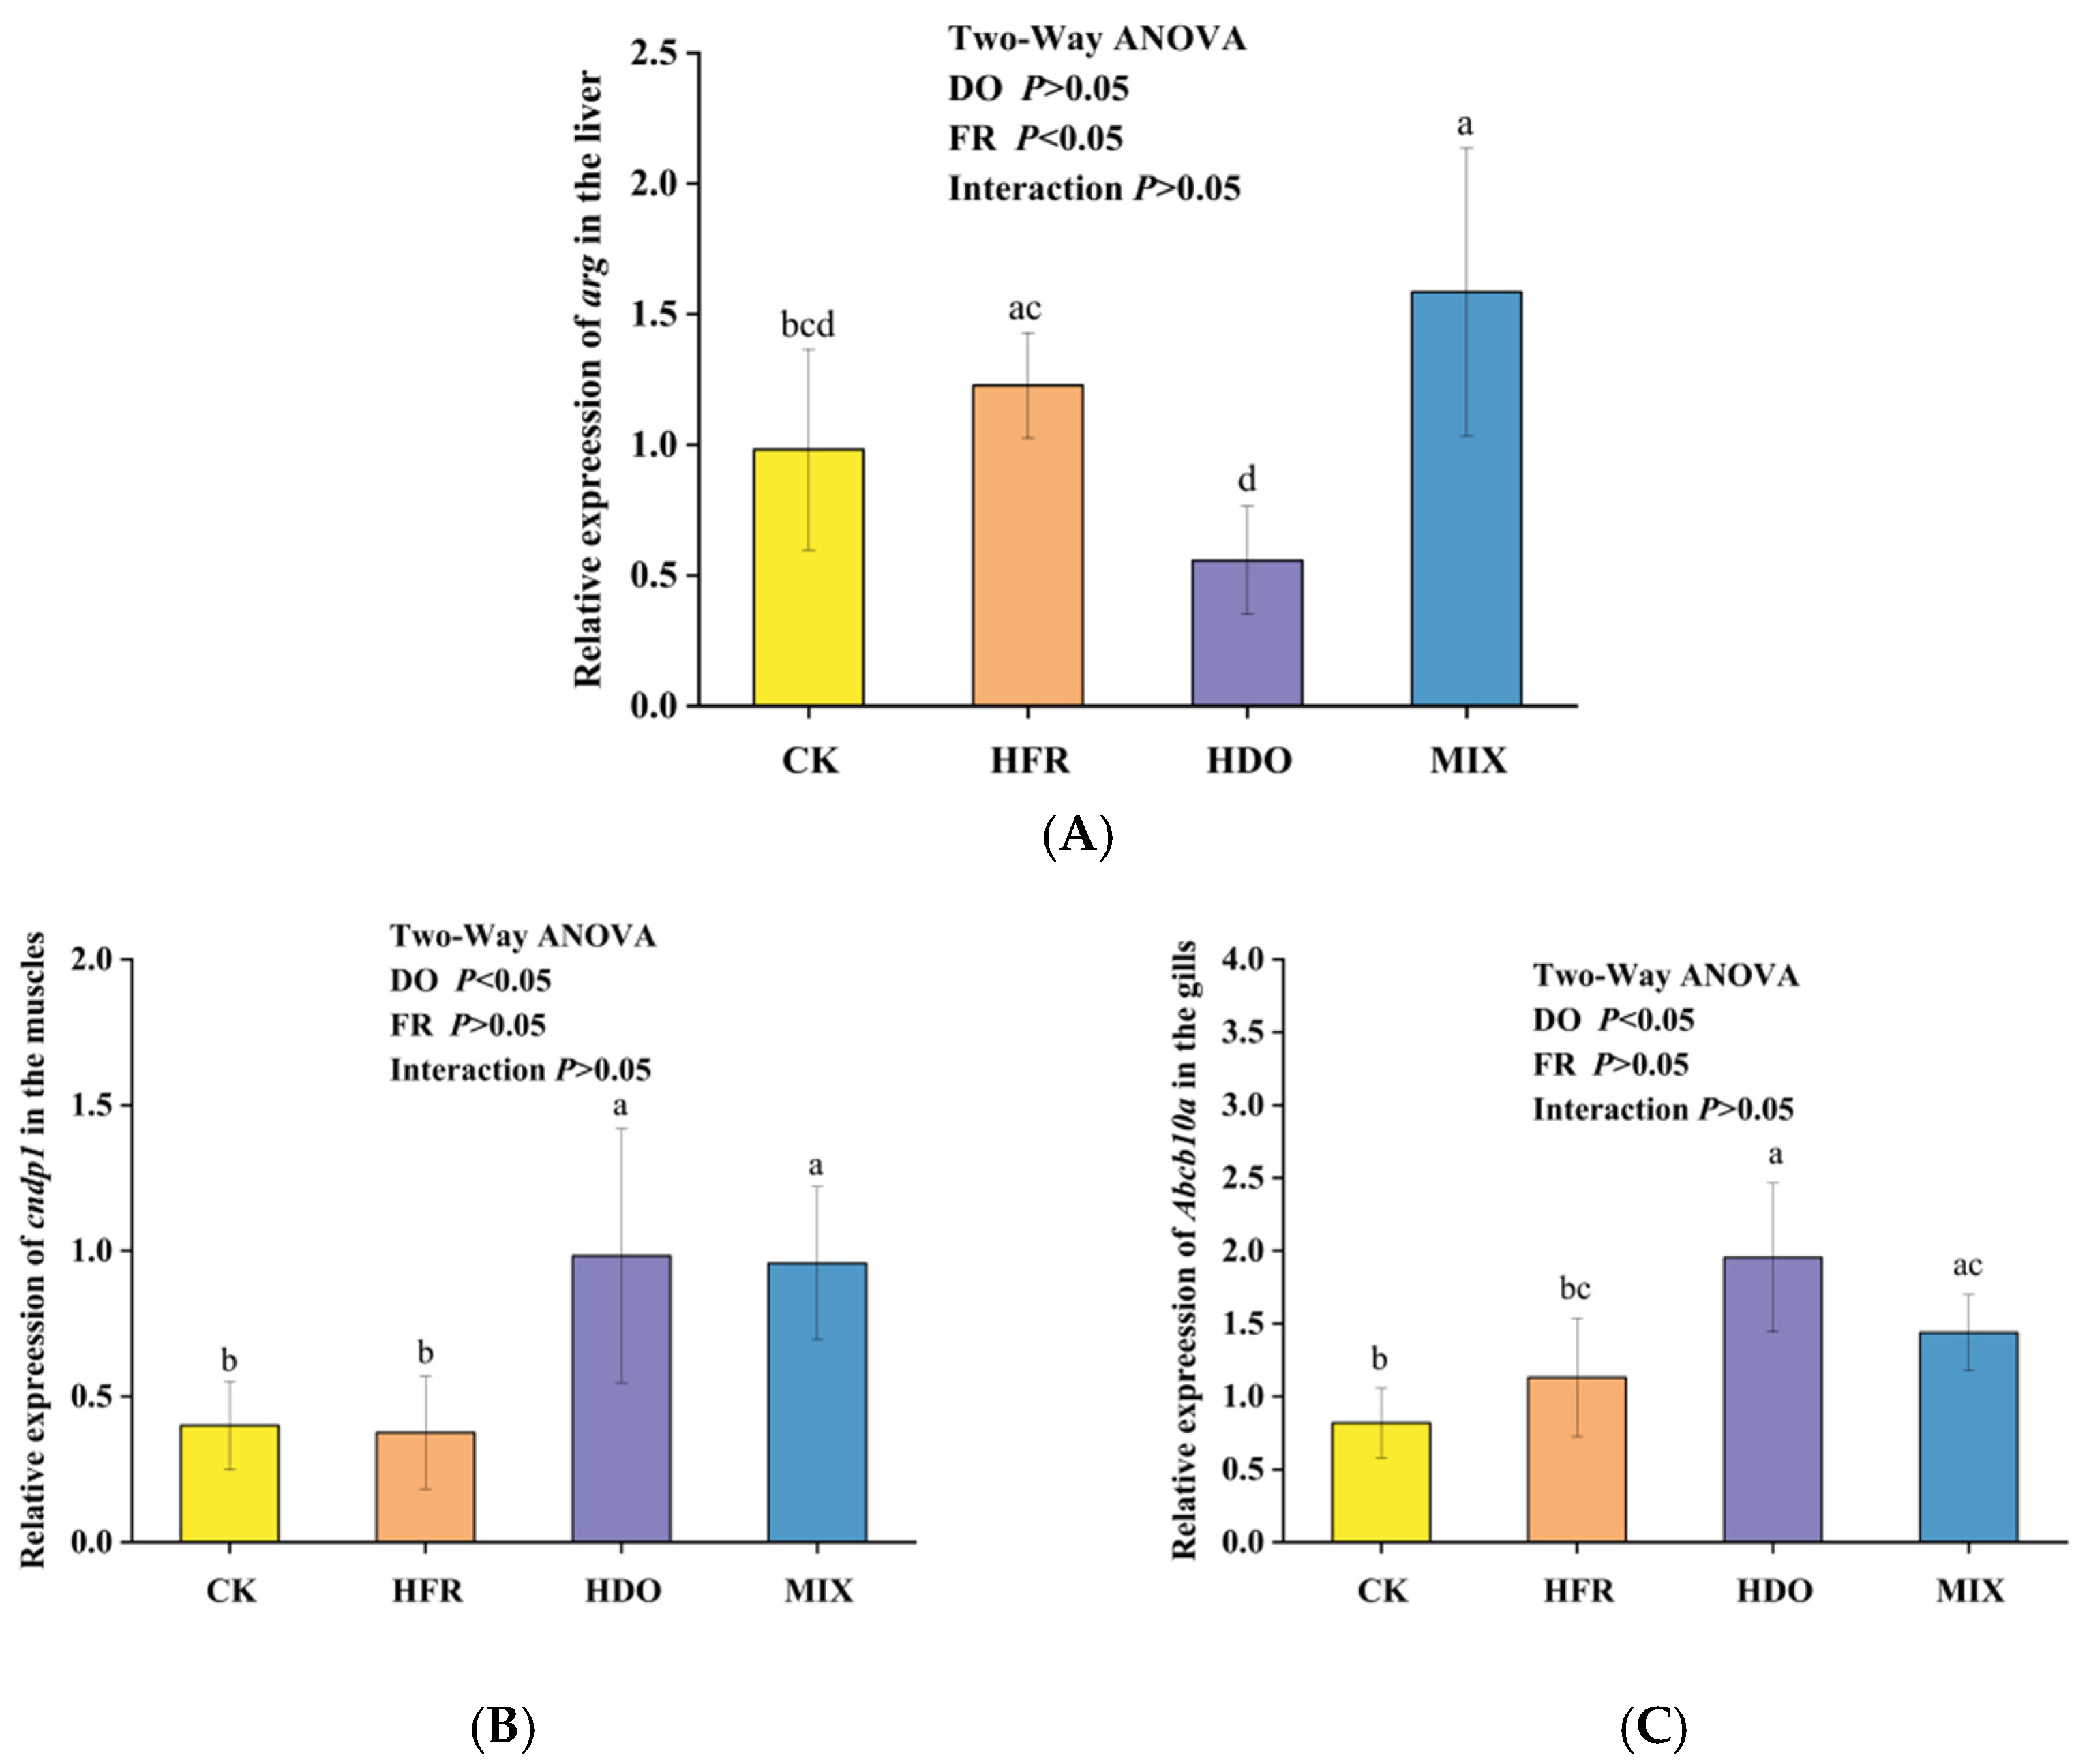
3.4. Metabolomics-Related Gene Expression Results

Based on the results of metabolic pathway enrichment from metabolomics, we further validated the expression levels of key genes identified in the KEGG enrichment analysis through RT-qPCR (Figure 6). In the HFR group, Abcb10a in gills were significantly upregulated compared to the CK group (p < 0.05). This verifies the enrichment of the ABC transporter pathway in the KEGG pathway enrichment results of HDO vs. CK. In addition, the expression of cndp1 in the muscles of the MIX group was significantly upregulated compared to that in the control group. This is consistent with the observed increase in the content of carnosine within the metabolome. While in the MIX group, argH in liver was significantly upregulated relative to the HDO group and CK group (p < 0.05). This is consistent with the enrichment results of the arginine pathway. The two-way ANOVA indicates that there is no significant interaction between DO and FR regarding the expression of the arg, cndp1 and Abcb10a.

3.5. Expression of Growth-Related Genes in Juvenile Golden Tiger Epinephelus

The results of RT-qPCR (Figure 7) indicated that there were no significant differences in the expression levels of IGF-1 and ghrb genes between the liver and brain tissues of the HDO compared to the CK (p > 0.05). This is similar to the results for weight. In the MIX group, the expression of the ghrb was significantly reduced when compared to the other groups in liver and brain (p < 0.05). This corresponds to the final body weight results of the MIX group. IGF-1 expression in the MIX group was significantly upregulated when compared with CK and HDO (p < 0.05). This differs from the results related to its weight. The results of the two-way ANOVA indicate that there is no significant interaction effect between DO and FR on the expression of the IGF-1 and ghrb.

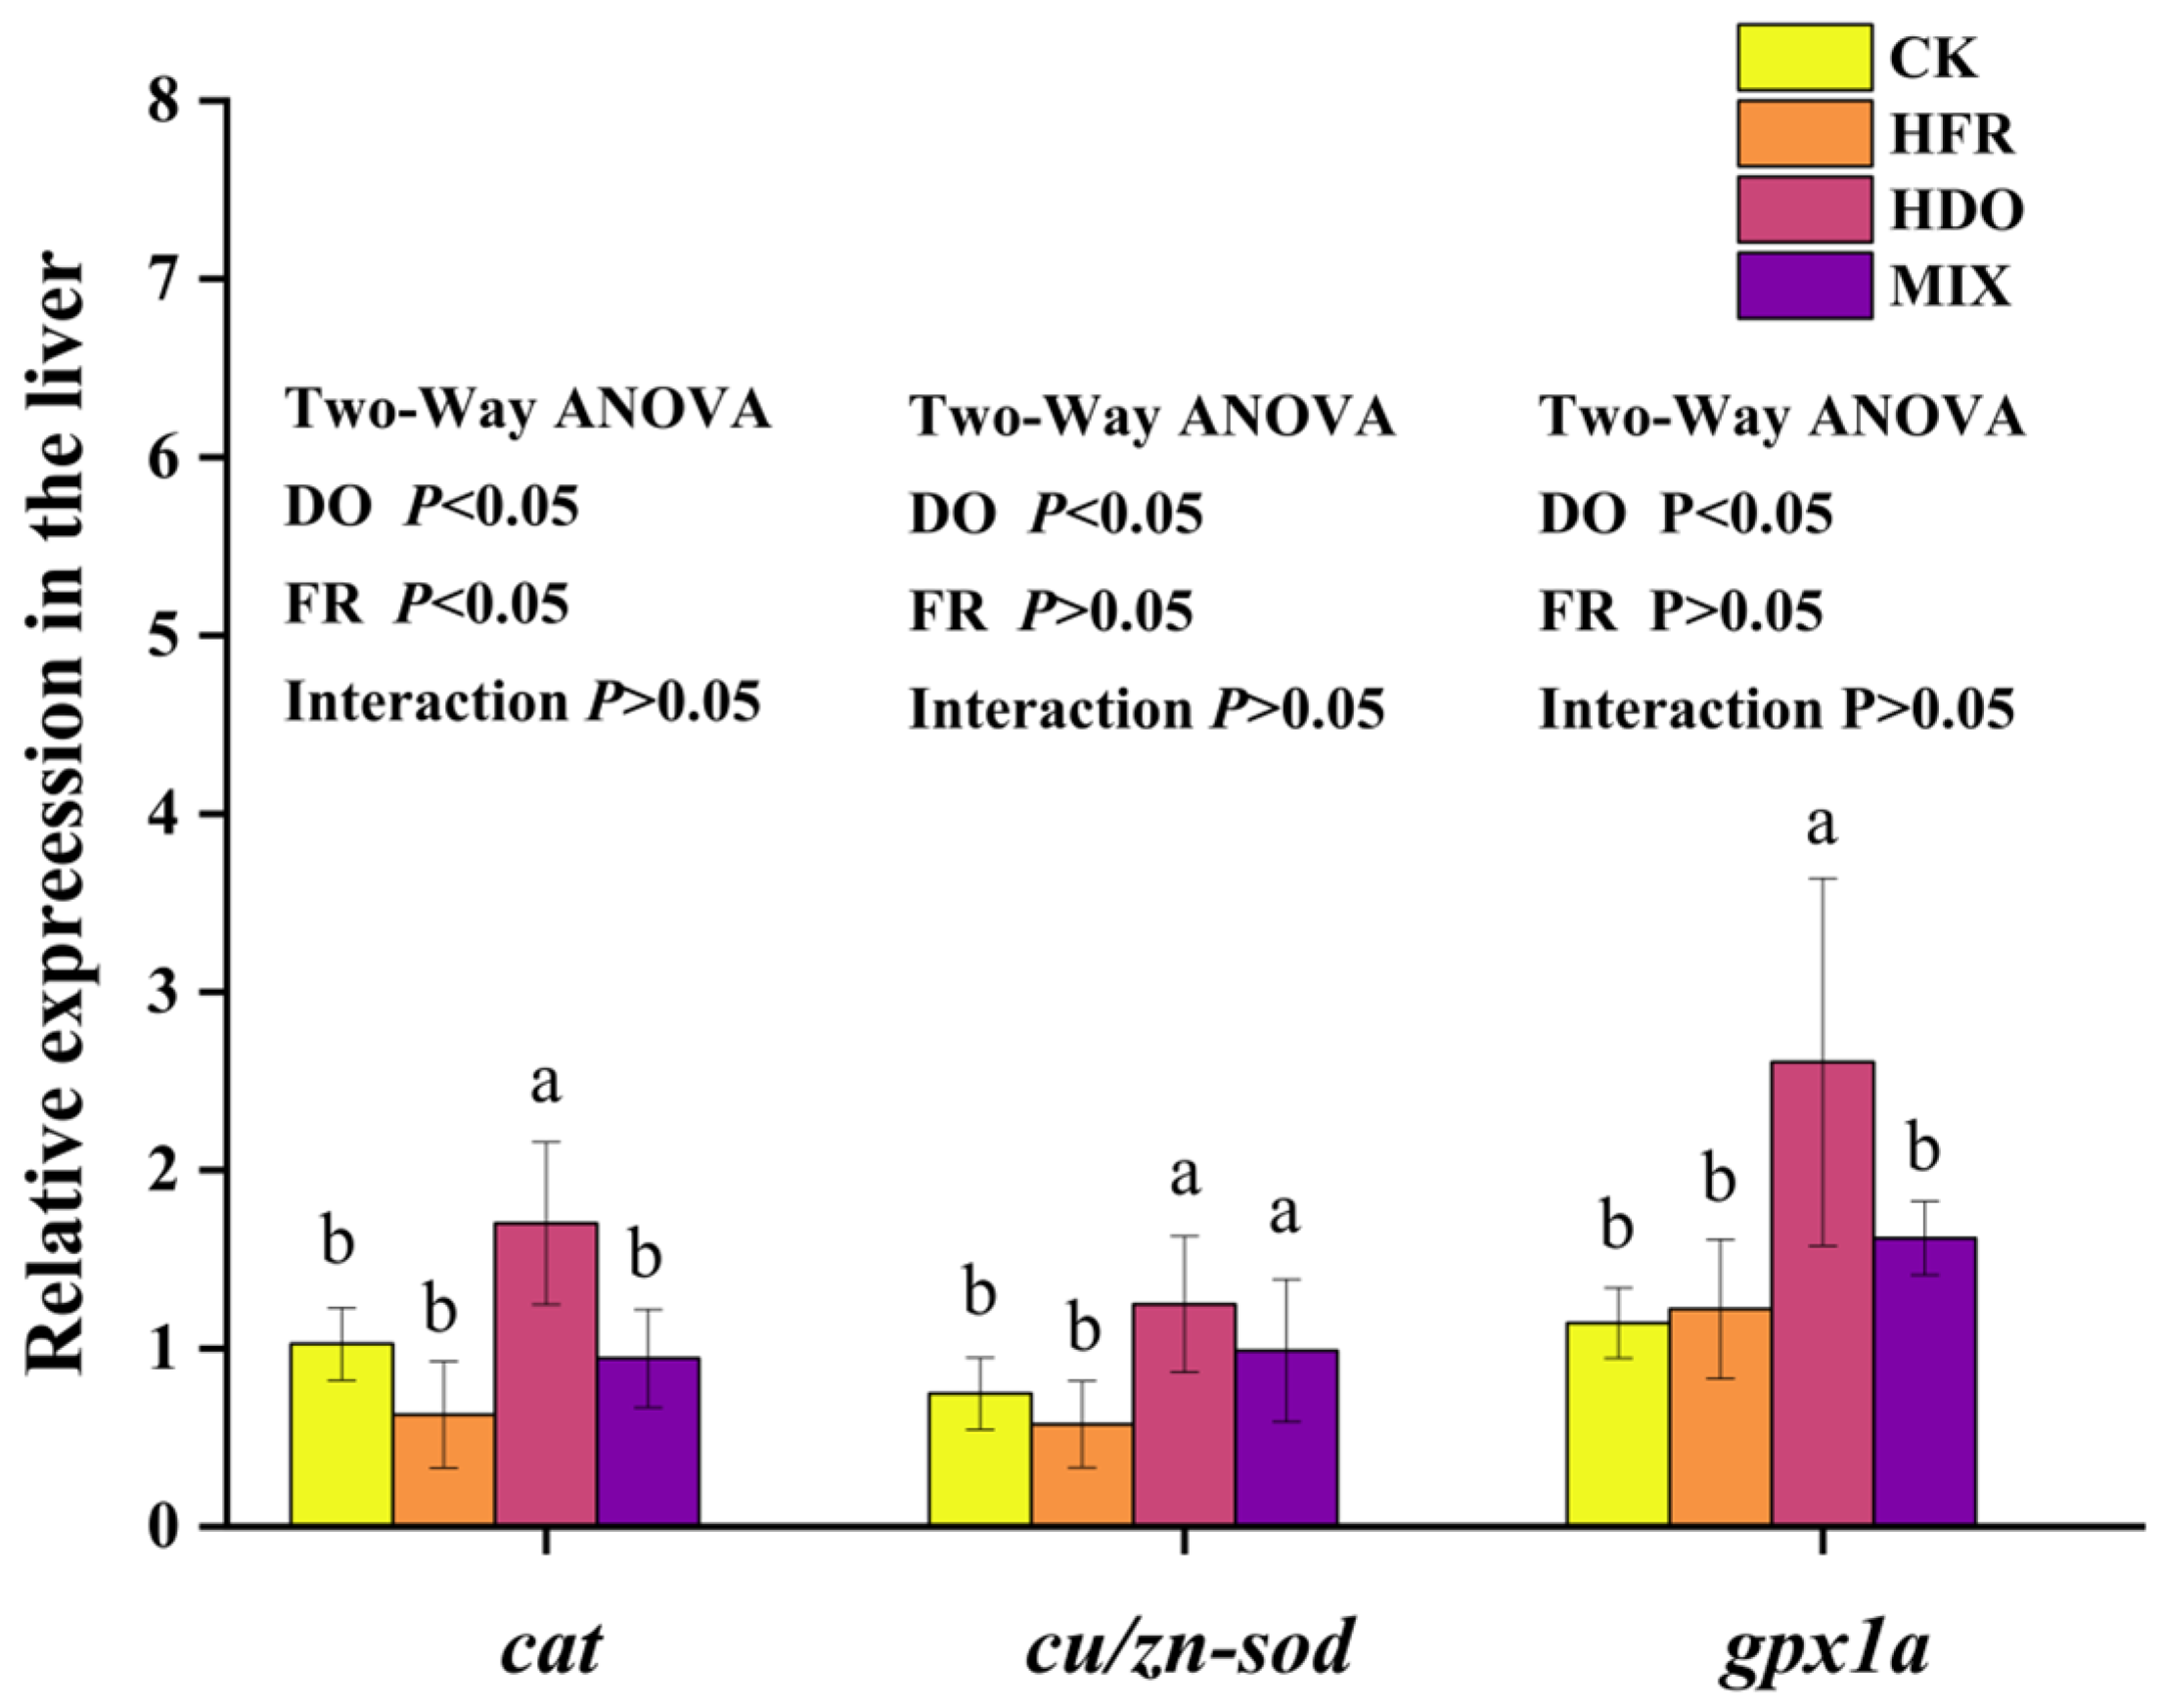
3.6. Assessment of Antioxidative Gene Response in Hybrid Grouper Juveniles

The expression of genes encoding antioxidant enzymes including cat, cu/zn-sod and gpx1a in the liver is shown in Figure 8. Both cat, cu/zn-sod and gpx1a were significantly upregulated in the HFR compared to the CK. Compared to the HDO group, both cat and gpx1a were significantly downregulated in the MIX group. The two-way ANOVA indicates that there is no significant interaction effect between DO and FR on cat, cu/zn-sod, and gpx1a.

4. Discussion

Firstly, elevated oxygen levels can induce a certain degree of oxidative stress in fish [14,29,30,31]. Our research findings indicate that mild hyperoxia can induce oxidative stress in the liver of grouper fish. Compared to the CK, the transcription levels of antioxidant enzymes (i.e., cat, cu/zn-sod, and gpx1a) in the liver of the HDO were significantly upregulated. The organism is recognized as undergoing oxidative stress with the upregulation of antioxidant enzymes which can impede or avert the generation of free radicals or reactive species within cells, decomposing superoxide radicals into innocuous molecules [32]. This is also confirmed by the significantly greater upregulated expression of Abcb10 in the gill tissues of the HDO compared to that of the CK group. Abcb10 is a mitochondrial ABC transporter that has been proved to be involved in the modulation of oxidative stress caused by hazardous agents [33]. The above findings indicate that hybrid grouper exhibit an oxidative stress response to mild-hyperoxia environments.
Furthermore, our results indicate that a high FR can alleviate oxidative stress induced by hyperoxia. The downregulated expression of cat and gpx1a as well as the decreased metabolites in the steroid synthesis pathway in the MIX group, compared to those in the HDO, suggest that increasing the FR can alleviate oxidative stress in hybrid grouper under mild-hyperoxia conditions. Steroid synthesis is intricately regulated by the inflammatory responses provoked by ROS in fish [34]. The observed alleviation effect can be attributed to the presence of carnosine, a naturally occurring peptide composed of β-alanine and L-histidine. Carnosine has been demonstrated to possess an antioxidant effect, to exhibit anti-inflammatory properties, and to scavenge ROS [35,36]. Indeed, a substantial increase in carnosine content was observed in the MIX group in comparison with the CK. Similarly, the gene cndp1, responsible for carnosine production, was increased in the muscles of the MIX group hybrid grouper, further validating this inference. However, with the increase in creatine metabolism, creatinine is formed as a byproduct. Creatinine can impact renal function, as the kidneys are responsible for filtering creatinine and excreting it from the body [37]. However, this study did not conduct further experimental investigations into the impact of creatinine on renal function. Future research should consider this factor in the context of feeding strategies and DO precise regulation.
Fish serum has been identified as a crucial diagnostic instrument, with the capacity to identify stress or disease disorders resulting from environmental alterations [38]. Glucose, cholesterol and triglycerides in the serum are vital energy substrates for fish. A notable decrease in glucose and triglyceride levels was observed in the serum of the HDO compared to the CK. This suggests a deficiency in energy substrates within the juvenile HDO population under conditions of mild hyperoxia, which may be attributed to elevated energy metabolism. Lower levels of ALT, an important enzyme in the alanine–glucose cycle, in the HDO compared to the CK group corroborated this view. Furthermore, the higher AST levels in the fish in the HDO than those in the CK indicates a more active tricarboxylic acid (TCA) cycle [39]. In addition to its roles in energy and general substance metabolism, the TCA cycle also produces intermediate metabolites and derivatives that have the capacity to function as signaling molecules, thereby regulating immune cell activity [40]. The considerable rise in AST in the HDO relative to the CK suggests an inflammatory response in the hybrid grouper under mild-hyperoxia conditions.
The elevated FRs provide the fish with a greater supply of nutrients, which has the potential to alleviate the shortage of energy substrates in hybrid grouper juveniles under mild-hyperoxia conditions. The MIX group demonstrated remarkably elevated levels of glucose and triglycerides in comparison with the HDO. Moreover, compared to the HDO, the MIX groups exhibited a decline in AST levels, though this decline did not attain statistical significance. However, a two-way ANOVA revealed a significant interaction between DO levels and FR on AST levels. This finding suggests that higher FRs may alleviate the inflammatory response induced by mild hyperoxia.
Whether at normal DO concentrations or under mild-hyperoxia conditions, elevated FRs are conducive to enhanced growth. The FR has a direct impact on the nutrient supply in animals reared under aquaculture, which in turn affects fish energy reserves and growth [41]. The significantly increased final body weight and upregulated expression of IGF-1 and ghrb in the liver and brain of both the HFR and the MIX groups compared to those of the CK are direct proof. We propose that this may be associated with arginine biosynthesis. Changes in the arginine biosynthesis pathway were observed in the KEGG pathway analysis of differently expressed metabolites for both the HFR vs. CK and MIX vs. CK groups. Arginine regulates energy homeostasis by modifying the adenosine 5′-monophosphate (AMP) activated protein kinase (AMPK) pathway and influencing the release of IGF-1 and GH by activating the target of the rapamycin (TOR) signaling pathway [16,42]. This, in turn, has been shown to affect growth [43]. Argininosuccinate lyase plays a crucial role in arginine biosynthesis, and the agrH has been observed to exhibit significant upregulation in both the MIX and the HFR, thus confirming the results of the upregulation of arginine biosynthesis in metabolomics.
It is noteworthy that the enhancement of bile acid enterohepatic circulation may be a contributing factor to the observed increase in growth of juvenile grouper in the MIX. Bile is synthesized from cholesterol in the liver and stored in the gallbladder of vertebrates. It is secreted into the proximal intestine, where it acts as a surfactant by emulsifying lipids into micelles, thereby enhancing digestion through an increased number of cleavage sites for pancreatic lipase. The majority of bile acids present in the intestine are reabsorbed via specific bile acid transport proteins and subsequently return to the liver as part of the enterohepatic circulation (EHC) [44,45,46]. In the event of hepatocyte damage, disruption to bile acid reabsorption may ensue [47], which is reflected in increased levels of related substances in the serum. In the KEGG pathway analysis comparing the HFR group to the MIX group, the primary bile acid biosynthesis pathway was significantly enriched, with notable downregulation of cholic acid and glycocholic acid. This finding suggests that mild hyperoxia may alleviate the obstruction of bile acid reabsorption caused by high feeding levels. This optimization has been demonstrated to facilitate the process of digestion and absorption. Nutrients have been identified as a key regulatory factor of the GH/IGF-I axis [48]. This may provide a rationale for the observed downregulation of ghrb in the MIX group compared to the HFR group.

5. Conclusions

Mild hyperoxia induces oxidative stress in the liver and gills, while increased FR alleviates this effect by enhancing the synthesis and metabolism of creatine. Concurrently, mild hyperoxia leads to an increase in energy metabolism, triggering inflammatory responses. However, elevating feeding levels can mitigate the shortage of energy substrates and alleviate inflammation. An increase in feed intake promotes growth. Furthermore, the interaction between mild hyperoxia and elevated FR further enhances the growth of juvenile hybrid grouper, likely due to improvements in bile acid enterohepatic circulation and the upregulation of growth hormone receptors.

Author Contributions

Z.W.: writing—original draft, visualization, methodology. M.L.: writing—review and editing. Y.Z.: methodology. D.D.: project administration, conceptualization. X.S.: writing—review and editing, supervision, funding acquisition, conceptualization, resources, formal analysis. All authors have read and agreed to the published version of the manuscript.

Funding

The study was supported by the Funding Project for Ministry of Science and Technology of the People’s Republic China: National Key Research and Development Program of China (grant number: 2022YFD2001700); And also supported by the Funding Project for Shandong Provincial Government of China: the Taishan Scholar Foundation of Shandong Province (grant number: tsqn202306108).

Institutional Review Board Statement

All experimentation and sample husbandry were performed in compliance with guidance from the Animal Research and Ethics Committees of Ocean University of China (Permit Number: 20141201), and National Institutes of Health Guide for the Care and Use of Laboratory Animals (NIH Publications, No. 8023, revised 1978).

Informed Consent Statement

Not applicable.

Data Availability Statement

Data will be made available on request.

Acknowledgments

Thanks the inimitable care and support of Laizhou Mingbo Aquatic Products Co. Ltd. (Yantai, China) over the years.

Conflicts of Interest

The authors declare that they have no known competing financial interests or personal relationships that could have appeared to influence the work reported in this paper.

References

  1. Abdel-Tawwab, M.; Hagras, A.E.; Elbaghdady, H.A.M.; Monier, M.N. Effects of Dissolved Oxygen and Fish Size on Nile Tilapia, Oreochromis Niloticus (L.): Growth Performance, Whole-Body Composition, and Innate Immunity. Aquacult. Int. 2015, 23, 1261–1274. [Google Scholar] [CrossRef]
  2. Buentello, J.A.; Gatlin, D.M., III; Neill, W.H. Effects of water temperature and dissolved oxygen on daily feed consumption, feed utilization and growth of channel catfish (Ictalurus punctatus). Aquaculture 2000, 182, 339–352. [Google Scholar] [CrossRef]
  3. Zhou, X.; Wu, Y.; Zhou, Y.; Zhang, Z.; Chen, G.; Yu, X.; Tong, J. Different Dissolved Oxygen Effects on Growth and O2-Sensing Pathway in Juvenile Bighead Carp (Hypophthalmichthys nobilis). Aquaculture 2024, 584, 740672. [Google Scholar] [CrossRef]
  4. Wood, A.T.; Clark, T.D.; Elliott, N.G.; Frappell, P.B.; Andrewartha, S.J. Physiological Effects of Dissolved Oxygen Are Stage-Specific in Incubating Atlantic Salmon (Salmo salar). J. Comp. Physiol. B 2019, 189, 109–120. [Google Scholar] [CrossRef] [PubMed]
  5. Qiang, J.; Zhong, C.Y.; Bao, J.W.; Liang, M.; Liang, C.; Tao, Y.F.; Li, H.X.; He, J.; Xu, P. Synergistic Effect of Water Temperature and Dissolved Oxygen Concentration on Rates of Fertilization, Hatching and Deformity of Hybrid Yellow Catfish (Tachysurus fulvidraco♀ × Pseudobagrus vachellii♂). J. Therm. Biol. 2019, 83, 47–53. [Google Scholar] [CrossRef]
  6. Rocha-Santos, C.; Bastos, F.F.; Dantas, R.F.; Hauser-Davis, R.A.; Rodrigues, L.C.; Cunha Bastos, V.L.F.; Cunha Bastos, J. Glutathione Peroxidase and Glutathione S-Transferase in Blood and Liver from a Hypoxia-Tolerant Fish under Oxygen Deprivation. Ecotoxicol. Environ. Saf. 2018, 163, 604–611. [Google Scholar] [CrossRef]
  7. Yang, K.; Fan, Q.; Zhang, L.; Li, B.; Gao, Y.; Zeng, K.; Wang, Q.; Zhu, S.; Fang, G. Effect of Dissolved Oxygen Levels on Growth Performance, Energy Budget and Antioxidant Responses of Yellow Catfish, Pelteobagrus fulvidraco (Richardson). Aquac. Res. 2015, 46, 2025–2033. [Google Scholar] [CrossRef]
  8. Espmark, Å.M.; Baeverfjord, G. Effects of Hyperoxia on Behavioural and Physiological Variables in Farmed Atlantic Salmon (Salmo salar) Parr. Aquac. Int. 2009, 17, 341–353. [Google Scholar] [CrossRef]
  9. Hosfeld, C.D.; Handeland, S.O.; Fivelstad, S.; Stefansson, S.O. Physiological Effects of Normbaric Environmental Hyperoxia on Atlantic Salmon (Salmo salar L.) Presmolts. Aquaculture 2010, 308, 28–33. [Google Scholar] [CrossRef]
  10. McArley, T.J.; Sandblom, E.; Herbert, N.A. Fish and Hyperoxia—From Cardiorespiratory and Biochemical Adjustments to Aquaculture and Ecophysiology Implications. Fish Fish. 2021, 22, 324–355. [Google Scholar] [CrossRef]
  11. Hosfeld, C.D.; Engevik, A.; Mollan, T.; Lunde, T.M.; Waagbø, R.; Olsen, A.B.; Breck, O.; Stefansson, S.; Fivelstad, S. Long-Term Separate and Combined Effects of Environmental Hypercapnia and Hyperoxia in Atlantic Salmon (Salmo salar L.) Smolts. Aquaculture 2008, 280, 146–153. [Google Scholar] [CrossRef]
  12. Guo, H.-Y.; Dong, X.-Y.; Zhang, X.-M.; Zhang, P.-D.; Li, W.-T. Survival, Growth and Physiological Responses of Juvenile Japanese Flounder (Paralichthys olivaceus, Temminck & Schlegel, 1846) Exposed to Different Dissolved Oxygen Concentrations and Stocking Densities. J. Appl. Ichthyol. 2017, 33, 731–739. [Google Scholar]
  13. Thorarensen, H.; Gústavsson, A.; Gunnarsson, S.; Árnason, J.; Steinarsson, A.; Björnsdóttir, R.; Imsland, A.K.D. The Effect of Oxygen Saturation on the Growth and Feed Conversion of Juvenile Atlantic Cod (Gadus morhua L.). Aquaculture 2017, 475, 24–28. [Google Scholar] [CrossRef]
  14. Aksakal, E.; Ekinci, D. Effects of Hypoxia and Hyperoxia on Growth Parameters and Transcription Levels of Growth, Immune System and Stress Related Genes in Rainbow Trout. Comp. Biochem. Physiol. Part A Mol. Integr. Physiol. 2021, 262, 111060. [Google Scholar] [CrossRef]
  15. Phull, A.-R.; Nasir, B.; Haq, I.U.; Kim, S.J. Oxidative Stress, Consequences and ROS Mediated Cellular Signaling in Rheumatoid Arthritis. Chem.-Biol. Interact. 2018, 281, 121–136. [Google Scholar] [CrossRef]
  16. Wang, M.; Wu, F.; Xie, S.; Zhang, L. Acute Hypoxia and Reoxygenation: Effect on Oxidative Stress and Hypoxia Signal Transduction in the Juvenile Yellow Catfish (Pelteobagrus fulvidraco). Aquaculture 2021, 531, 735903. [Google Scholar] [CrossRef]
  17. Wang, W.; Huang, J.; Zhang, J.; Wang, Z.; Li, H.; Amenyogbe, E.; Chen, G. Effects of Hypoxia Stress on the Intestinal Microflora of Juvenile of Cobia (Rachycentron canadum). Aquaculture 2021, 536, 736419. [Google Scholar] [CrossRef]
  18. Lygren, B.; Hamre, K.; Waagbø, R. Effect of induced hyperoxia on the antioxidant status of Atlantic salmon Salmo salar L. fed three different levels of dietary vitamin E. Aquac. Res. 2000, 31, 401–407. [Google Scholar]
  19. Ritola, O.; Tossavainen, K.; Kiuru, T.; Lindstrom-Seppa, P.; Molsa, H. Effects of Continuous and Episodic Hyperoxia on Stress and Hepatic Glutathione Levels in One-Summer-Old Rainbow Trout (Oncorhynchus mykiss). J. Appl. Ichthyol. 2002, 18, 159–164. [Google Scholar] [CrossRef]
  20. Magnúsdóttir, S.O.; Maltesen, R.G.; Haugaard Banch, L.; Baandrup, U.T.; Valbjørn, H.; Andreassen, T.; Bathen, T.F.; Steen Rasmussen, B.; Kjærgaard, B. Hyperoxia Affects the Lung Tissue: A Porcine Histopathological and Metabolite Study Using Five Hours of Apneic Oxygenation. Metab. Open 2019, 4, 100018. [Google Scholar] [CrossRef]
  21. Jordan, A.D.; Steffensen, J.F. Effects of Ration Size and Hypoxia on Specific Dynamic Action in the Cod. Physiol. Biochem. Zool. 2007, 80, 178–185. [Google Scholar] [CrossRef]
  22. Fu, S.J.; Xie, X.J.; Cao, Z.D. Effect of Meal Size on Postprandial Metabolic Response in Southern Catfish (Silurus meridionalis). Comp. Biochem. Physiol. Part A Mol. Integr. Physiol. 2005, 140, 445–451. [Google Scholar] [CrossRef] [PubMed]
  23. Rahimnejad, S.; Dabrowski, K.; Izquierdo, M.; Malinovskyi, O.; Kolářová, J.; Policar, T. Effects of Dietary Protein and Lipid Levels on Growth, Body Composition, Blood Biochemistry, Antioxidant Capacity and Ammonia Excretion of European Grayling (Thymallus thymallus). Front. Mar. Sci. 2021, 8, 715636. [Google Scholar] [CrossRef]
  24. Barri, T.; Dragsted, L.O. UPLC-ESI-QTOF/MS and Multivariate Data Analysis for Blood Plasma and Serum Metabolomics: Effect of Experimental Artefacts and Anticoagulant. Anal. Chim. Acta 2013, 768, 118–128. [Google Scholar] [CrossRef] [PubMed]
  25. Want, E.J.; O’Maille, G.; Smith, C.A.; Brandon, T.R.; Uritboonthai, W.; Qin, C.; Trauger, S.A.; Siuzdak, G. Solvent-Dependent Metabolite Distribution, Clustering, and Protein Extraction for Serum Profiling with Mass Spectrometry. Anal. Chem. 2006, 78, 743–752. [Google Scholar] [CrossRef]
  26. Want, E.J.; Masson, P.; Michopoulos, F.; Wilson, I.D.; Theodoridis, G.; Plumb, R.S.; Shockcor, J.; Loftus, N.; Holmes, E.; Nicholson, J.K. Global Metabolic Profiling of Animal and Human Tissues via UPLC-MS. Nat. Protoc. 2013, 8, 17–32. [Google Scholar] [CrossRef] [PubMed]
  27. Wen, B.; Mei, Z.; Zeng, C.; Liu, S. metaX: A Flexible and Comprehensive Software for Processing Metabolomics Data. BMC Bioinform. 2017, 18, 183. [Google Scholar] [CrossRef]
  28. Livak, K.J.; Schmittgen, T.D. Analysis of Relative Gene Expression Data Using Real-Time Quantitative PCR and the 2−ΔΔCT Method. Methods 2001, 25, 402–408. [Google Scholar] [CrossRef]
  29. Lushchak, V.I.; Bagnyukova, T.V. Effects of Different Environmental Oxygen Levels on Free Radical Processes in Fish. Comp. Biochem. Physiol. Part B Biochem. Mol. Biol. 2006, 144, 283–289. [Google Scholar] [CrossRef]
  30. Singh, S.P.; Sharma, J.; Ahmad, T.; Chakrabarti, R. Oxygen Stress: Impact on Innate Immune System, Antioxidant Defence System and Expression of HIF-1α and ATPase 6 Genes in Catla catla. Fish Physiol. Biochem. 2016, 42, 673–688. [Google Scholar] [CrossRef]
  31. Sollid, J.; Nilsson, G.E. Plasticity of Respiratory Structures—Adaptive Remodeling of Fish Gills Induced by Ambient Oxygen and Temperature. Respir. Physiol. Neurobiol. 2006, 154, 241–251. [Google Scholar] [CrossRef] [PubMed]
  32. Lei, X.G.; Zhu, J.-H.; Cheng, W.-H.; Bao, Y.; Ho, Y.-S.; Reddi, A.R.; Holmgren, A.; Arnér, E.S.J. Paradoxical Roles of Antioxidant Enzymes: Basic Mechanisms and Health Implications. Physiol. Rev. 2016, 96, 307–364. [Google Scholar] [CrossRef] [PubMed]
  33. Sabri, D.; Rabie, T.; Ahmed, A.; Zakaria, S.; Bourdineaud, J.-P. Heavy Metals-Induced Expression of ABCB10 Gene in Zebrafish (Danio rerio). Egypt. Acad. J. Biol. Sciences. C Physiol. Mol. Biol. 2012, 4, 97–106. [Google Scholar] [CrossRef]
  34. McKay, L.I.; Cidlowski, J.A. Molecular Control of Immune/Inflammatory Responses: Interactions Between Nuclear Factor-κB and Steroid Receptor-Signaling Pathways. Endocr. Rev. 1999, 20, 435–459. [Google Scholar] [CrossRef]
  35. Qi, B.; Wang, J.; Hu, M.; Ma, Y.; Wu, S.; Qi, G.; Qiu, K.; Zhang, H. Influences of Beta-Alanine and l-Histidine Supplementation on Growth Performance, Meat Quality, Carnosine Content, and mRNA Expression of Carnosine-Related Enzymes in Broilers. Animals 2021, 11, 2265. [Google Scholar] [CrossRef]
  36. Aydın, A.F.; Bingül, İ.; Küçükgergin, C.; Doğan-Ekici, I.; Doğru Abbasoğlu, S.; Uysal, M. Carnosine Decreased Oxidation and Glycation Products in Serum and Liver of High-fat Diet and Low-dose Streptozotocin-induced Diabetic Rats. Int. J. Exp. Path. 2017, 98, 278–288. [Google Scholar] [CrossRef]
  37. Kashani, K.; Rosner, M.H.; Ostermann, M. Creatinine: From Physiology to Clinical Application. Eur. J. Intern. Med. 2020, 72, 9–14. [Google Scholar] [CrossRef]
  38. Ashaf-Ud-Doulah, M.; Mamun, A.A.; Rahman, M.L.; Islam, S.M.M.; Jannat, R.; Hossain, M.A.R.; Shahjahan, M. High Temperature Acclimation Alters Upper Thermal Limits and Growth Performance of Indian Major Carp, Rohu, Labeo Rohita (Hamilton, 1822). J. Therm. Biol. 2020, 93, 102738. [Google Scholar] [CrossRef]
  39. Yudkoff, M.; Nelson, D.; Daikhin, Y.; Erecińska, M. Tricarboxylic Acid Cycle in Rat Brain Synaptosomes. Fluxes and interactions with aspartate aminotransferase and malate/aspartate shuttle. J. Biol. Chem. 1994, 269, 27414–27420. [Google Scholar]
  40. Choi, I.; Son, H.; Baek, J.-H. Tricarboxylic Acid (TCA) Cycle Intermediates: Regulators of Immune Responses. Life 2021, 11, 69. [Google Scholar] [CrossRef]
  41. MacKenzie, D.S.; VanPutte, C.M.; Leiner, K.A. Nutrient Regulation of Endocrine Function in Fish. Aquaculture 1998, 161, 3–25. [Google Scholar] [CrossRef]
  42. Inoki, K.; Li, Y.; Zhu, T.; Wu, J.; Guan, K.-L. TSC2 Is Phosphorylated and Inhibited by Akt and Suppresses mTOR Signalling. Nat. Cell Biol. 2002, 4, 648–657. [Google Scholar] [CrossRef] [PubMed]
  43. Astheimer, R.W. Thermistor Infrared Detectors; Wolfe, W.L., Ed.; SPIE: San Diego, CA, USA, 1983; pp. 95–111. [Google Scholar]
  44. Murashita, K.; Yoshiura, Y.; Chisada, S.; Furuita, H.; Sugita, T.; Matsunari, H.; Iwashita, Y.; Yamamoto, T. Homologue Gene of Bile Acid Transporters Ntcp, Asbt, and Ost-Alpha in Rainbow Trout Oncorhynchus Mykiss: Tissue Expression, Effect of Fasting, and Response to Bile Acid Administration. Fish Physiol. Biochem. 2014, 40, 511–525. [Google Scholar] [CrossRef] [PubMed]
  45. Cai, J.-S.; Chen, J.-H. The Mechanism of Enterohepatic Circulation in the Formation of Gallstone Disease. J. Membr. Biol. 2014, 247, 1067–1082. [Google Scholar] [CrossRef]
  46. Russell, D.W. Fifty Years of Advances in Bile Acid Synthesis and Metabolism. J. Lipid Res. 2009, 50, S120–S125. [Google Scholar] [CrossRef]
  47. Chiang, J.Y.L. Bile Acid Metabolism and Signaling. In Comprehensive Physiology; Terjung, R., Ed.; Wiley: Hoboken, NJ, USA, 2013; pp. 1191–1212. ISBN 978-0-470-65071-4. [Google Scholar]
  48. Caputo, M.; Pigni, S.; Agosti, E.; Daffara, T.; Ferrero, A.; Filigheddu, N.; Prodam, F. Regulation of GH and GH Signaling by Nutrients. Cells 2021, 10, 1376. [Google Scholar] [CrossRef]
Figure 1. Illustration of the equipment.
Fishes 10 00228 g001
Figure 2. Impact of various experimental groups on physiological indices of juvenile hybrid grouper. Bars bearing different letters (a–d) differ significantly (p < 0.05).
Fishes 10 00228 g002
Figure 3. (A) Shows the PCA score of HFR group and CK group; (B) the PCA score of HDO group and CK group; (C) the PCA score of MIX group and CK group; (D) the PCA score of MIX group and HDO group; (E) the PCA score of MIX group and HFR group.
Fishes 10 00228 g003
Figure 4. (A) Depicts the volcanic map of distinct metabolites in the HFR group compared to the CK group; (B) depicts the volcanic map of distinct metabolites in the HDO group compared to the CK group; (C) depicts the volcanic map of distinct metabolites in the MIX group compared to the CK group; (D) depicts the volcanic map of distinct metabolites in the MIX group compared to the HDO group; (E) depicts the volcanic map of distinct metabolites in the MIX group compared to the HFR group.
Fishes 10 00228 g004
Figure 5. In the figure, (A) illustrates the KEGG pathway analysis bubble plot of DEM comparing the HFR group and CK group; (B) illustrates the KEGG pathway analysis bubble plot of DEM comparing the HDO group and CK group; (C) illustrates the KEGG pathway analysis bubble plot of DEM comparing the MIX group and CK group; (D) illustrates the KEGG pathway analysis bubble plot of DEM comparing the HDO group and MIX group; (E) illustrates the KEGG pathway analysis bubble plot of DEM comparing the HFR group and MIX group.
Fishes 10 00228 g005aFishes 10 00228 g005b
Figure 6. The image illustrates the expression levels of genes correlated with metabolomic outcomes across each experimental group. (A) argH: argininosuccinate lyase. (B) cndp1: beta-Ala-His dipeptidase. (C) Abcb10: ATP-binding cassette, subfamily B (MDR/TAP), member 10. The data are expressed as the means ± SEMs. Values on the same line bearing distinct superscripts differ significantly (p < 0.05). Bars bearing different letters (a–d) differ significantly (p < 0.05).
Fishes 10 00228 g006
Figure 7. Effects of various treatment groups on growth-related gene expression in juvenile hybrid grouper. (A) The relative expression of IGF-I in liver and brain; (B) the relative expression of ghrb in liver and brain. The data are expressed as the means ± SEMs. Values on the same line bearing distinct superscripts differ significantly (p < 0.05).
Fishes 10 00228 g007
Figure 8. Effects of different experimental groups on expression of antioxidase-related genes (cat, cu/zn-sod and gpx1a) in juvenile hybrid grouper. The data are expressed as the means ± SEMs. Values on the same line bearing distinct superscripts differ significantly (p < 0.05).
Fishes 10 00228 g008
Table 1. Real-time quantitative PCR (RT-qPCR) primer pairs used in the present study.
Gene Sequences (5′-3′)Size (bp)
18sFATTCCGATAACGAACGAGAC20
RGGACATCTAAGGGCATCACAG21
argHFCCAATGAACGCAGACTAAA19
RTGTAACCAGGAAACAGGAC19
cndp1FTGCCCTCCATTCTGCTGC18
RTGCGGTGTAGGTCTGGTCTC20
Abcb10aFAGCCAGATTAGCCAACGC18
RTTCCATCAGACGCTCCAA18
IGF-1FTTCAGTAAACCAACAGGCTATG22
RAATGACTATGTCCAGGTAAAGGT23
ghrbFACTACAGCACCGACAGGC18
RCACTGGGAATCTTGACACTTT21
catFGGCATTTGGTTACTTTGAGG20
RCAGTGGAGAAGCGGACAG18
cu/zn-sodFGACCAGCGGGACCGTGTAT19
RCCAGCGTTGCCTGTCTTT18
gpx1aFCTGAGCGTATTCTGTTTCC19
RCTGAGCGTATTCTGTTTCC18
Table 2. Effects of various experimental groups on the growth indices of grouper.Bars bearing different letters (a–c) differ significantly (p < 0.05).
TreatmentInitial Body Weight (g/ind)Final Body Weight (g/ind)Specific Growth Rate (SGR) (%)Feed Conversion Ratio (FCR) Survival Rate (%)
CK56.53 ± 2.64 a158.60 ± 6.42 a1.62 ± 0.19 a0.98 ± 0.03 a88.89 ± 7.70 a
HFR57.09 ± 0.89 a177.05 ± 4.28 b1.89 ± 0.02 b1.52 ± 0.006 b93.33 ± 6.67 a
HDO57.06 ± 2.13 a156.42 ± 6.48 a1.68 ± 0.07 a0.97 ± 0.05 a93.33 ± 6.67 a
MIX56.93 ± 2.66 a191.59 ± 8.09 c2.07 ± 0.02 c1.43 ± 0.06 b95.56 ± 7.70 a
Specific growth rate (%) = 100 × (ln(final body weight) − ln(body weight))/breeding time initial body weight
Feed conversion rate (%) = dry feed consumed/(final body weight − initial body weight)
Survival rate (%) = 100 (final amount of fish)/(initial amount of fish)
Table 3. Two-factor variance analysis of the effects of feeding rates and dissolved oxygen on growth indices of hybrid grouper.
Final Body WeightSGRFCR
Dissolved oxygen0.1200.0770.107
Feeding rates0.0000.0000.000
Interaction between dissolved oxygen and feeding rates0.0480.0100.178
Disclaimer/Publisher’s Note: The statements, opinions and data contained in all publications are solely those of the individual author(s) and contributor(s) and not of MDPI and/or the editor(s). MDPI and/or the editor(s) disclaim responsibility for any injury to people or property resulting from any ideas, methods, instructions or products referred to in the content.

