Technical Note

Application of Flow Cytometry to Determine Cell DNA Content in the Genetic Breeding of Fish

1
Engineering Reseaech Center of Polyploid Fish Reproduction and Breeding of the State Education Ministry, College of Life Sciences, Hunan Normal University, Changsha 410081, China
2
Yuelushan Laboratory, Changsha 410128, China
3
College of Agriculture and Forestry Technology, Hunan Applied Technology University, Changde 415000, China
*
Authors to whom correspondence should be addressed.
These authors contributed equally to this work.
Fishes 2025, 10(5), 227; https://doi.org/10.3390/fishes10050227
Submission received: 20 February 2025 / Revised: 3 April 2025 / Accepted: 21 April 2025 / Published: 15 May 2025

Abstract

In the field of fish genetic breeding, accurately determining the DNA content and ploidy of fish is of great significance. This article introduces the use of flow cytometry (FCM) to measure the DNA content and conduct ploidy analysis by sampling different tissues of freshwater fish species. It describes the FCM detection methods and their effectiveness for different individual tissues. These tissues include embryos and fry, as well as the blood, caudal fins, and sperm of adult live fish, and also specific tissues such as testes, ovaries, gills, spleens, and livers under anatomical conditions. Moreover, the application of ploidy detection to different tissues or individuals in different stages in the practice of fish genetic breeding is analyzed. This research covers samples from different growth stages and a variety of tissue types. The results show that this method exhibits high stability and reliability in the detection of different tissue samples, providing solid data support for subsequent research. It holds significant application value in fish genetic breeding.
Key Contribution: FCM has significant advantages in fish genetic breeding. It is highly efficient in detection and capable of rapidly analyzing and sorting a large number of cells, and can batch-detect seedlings, greatly improving screening efficiency. Moreover, its results are precise. It can accurately measure parameters such as DNA content and determine ploidy, providing accurate data support for breeding work.

1. Introduction

FCM is a modern analytical technique for measuring the ploidy of suspended cells or particles in the liquid phase using a CyFlow® ploidy analyzer (CyFlow® PA) (Partec, Norderstedt, Germany) [1,2,3]. The principle of operation is to prepare single-cell suspensions with a fluorescent label to be tested, pass the samples through the laser-focusing area one by one, generate a scattered light signal and an excited fluorescence signal after laser excitation, and analyze and judge the physicochemical properties of the measured cells or particles through the signal processing and analysis systems [4,5,6]. Currently, the mainstream FCM signal acquisition speed reaches more than 30,000 cells per second, supporting more than 10 parameters at the same time for detection and analysis. Some instruments can detect more than 40 different parameters, and the deviation of the fluorescence resolution of the instrument (CV%) is usually not more than 3%. Under the condition that the ambient temperature change does not exceed 5%, the deviation of FSC and the peak average fluorescence intensity of all fluorescence channels obtained within 8 h are not more than ±10% [6,7,8]. The Cy Flow PA from Partec Company is the world’s first FCM instrument to be sent into space, demonstrating its compact structure and superior performance [9,10,11]. With the development of new multi-functional FCM apparatus, new high-efficiency specific dyes, and powerful analysis software, the accuracy of FCM’s detection results will be continuously improved, its detection indicators will continue to expand, and its application depth will be further expanded. This latter development will play an important role in biological research in the field of life science research [12,13,14].
As an advanced cell analysis technology, FCM plays a crucial role in multiple fields of life sciences due to its advantages of speed, precision, and multi-parameter detection. In basic biological research, it facilitates the study of the plant cell cycle; the identification of polyploids [15,16,17]; the analysis of the characteristics of cells in the developmental stages of embryos, tissues, and organs; and the performance of chromosome analysis, gene mutation detection, etc. [18,19,20]. In practical application scenarios, it is used to monitor minimal residual disease in leukemia patients and diagnose respiratory diseases in the medical field [21,22,23,24,25]. In the field of microbiology, it plays an important role in the detection and analysis of microorganisms in wine [26,27,28] and aquatic microorganisms [29,30,31,32], and enables the early diagnosis of malaria through in vivo photoacoustic flow cytometry [33,34]. Of course, flow cytometry demonstrates broad application prospects in multiple fields, providing powerful technical support for research and development in various fields.
Fish genetics and breeding play an important role in the development of modern fishery, and are of great significance in fish production [35]. Fish genetics and breeding refer to the process of using biological methods to genetically select or modify fish to obtain new and improved species. It can be achieved through the artificial selection of dominant genetic traits or by integrating or modifying existing genetic traits [13,36,37]. Distant hybridization is widely applied in fish genetic breeding, integrating the genomes of the parents and leading to changes in the genotypes and phenotypes of the offspring. Usually, the hybrid offspring exhibit a series of heterosis advantages [38]. Cell ploidy detection is required to guide the breeding process in a range of fish genetic breeding techniques, including selective breeding, hybridization, gynogenesis, sex-controlled breeding, and polyploidy breeding [12,39]. Liu Shaojun et al. determined the ploidy of fish hybrid offspring by detecting the blood cells of different ploidy fish [40,41], predicted the reproductive potential of the hybrid fish by detecting their sperm [42], and determined the reproductive potential of gynogenesis in fish by measuring DNA content in early ovarian tissue [43]. Fish sperm DNA tests have also been conducted to guide the selection of parents for breeding [44,45].
FCM ploidy detection technology can be used in fish genetic breeding to measure the DNA content of various tissue cells. The DNA content reflects all the genetic information of a species [16], including that of embryos, larvae, blood cells, gonadal tissue, caudal fin strip tissue, and liver tissue. According to the needs of breeding, different tissue sample tests can be carried out, and the operation methods are also different. In this paper, we introduce the ploidy detection methods for different tissues in fish, and analyze the guiding significance of the ploidy detection of different tissues in the practice of fish reproduction and breeding.

2. Materials and Methods

2.1. Experimental Materials

The experimental fish, comprising red crucian carp (Carassius auratus red var.), triploid crucian carp (Triploid carassius auratus, 3nDTCC), 3nDTCC and allotetraploid hybrids, and diploid red crucian carp (Carassius auratus red var.) (♀) × common carp (Cyprinus carpio L.) (♂), were obtained from the Yuelushan Laboratory, Hunan Normal University, where they were cultured artificially. Blood cells, caudal fins, and sperm were sampled in vivo. Liver and gonadal tissues needed to be sampled after dissection. 2-phenoxyethanol (Sigma, St. Louis, MO, USA,) was used to stun the experimental fish before dissection. DAPI (Sysmex, Norderstedt, Germany), ACD (citric acid, 0.48 g; sodium citrate, 1.32 g; Levoglucose, 1.47 g; ddH2O, 100 mL; 0.01 M), and PBS (Solarbio, pH 7.2–7.4, 0.01 M) were employed.

2.2. Experimental Methods

2.2.1. Selection of Internal Standards

The absolute or relative content of DNA is commonly used in the FCM analysis of ploidy. If the absolute content of DNA is to be measured, a standard sample must be set to convert the absolute content of DNA. The known nuclear DNA content is usually used as a measurement standard. It is also possible to use the relative content of DNA for comparative analysis. When measuring the sample to be analyzed, a similar material with known ploidy is selected as a control, and all the samples to be tested are compared with it. The obtained result can be converted to the relative content of the DNA of the sample to be tested, and then the ploidy analysis can be carried out. In this experiment, the blood (2n = 100) of the red crucian carp (Carassius auratus red var., abbreviated as RCC) was used as the control to detect the relative ploidy.

2.2.2. Preparation of Nuclear Suspension

The concentration of nuclei in the sample for flow analysis must be maintained at 1.0 × 10⁵~1.0 × 10⁷ cells/mL.
(1)
Embryos: Take one (or more) embryos from the gastrulation stage to the caudal stage and place them in a small culture dish. Cut them into pieces with small scissors, add a small amount of PBS, transfer them to a sterilized 1.5 mL Eppendorf tube (EP tube), and keep them stationary for 2 min. Use a pipette to aspirate the bottom sediment and reserve the cell suspension for later use.
(2)
Fry: Take a single fry within 15 days after hatching (or 3 to 5 mixed fry), peel the abdominal cavity in a small Petri dish with fine tweezers, remove intestinal feces and other debris, cut it with small scissors, add a small amount of PBS and transfer it to a 1.5 mL EP tube, keep it stationary for 2 min, and then take the upper cell suspension for later use.
(3)
Blood: Collect 0.2 mL ACD anticoagulant solution with a syringe, and, after the fish tail is disinfected with complex iodine, take 0.2–0.3 mL blood from below the lateral line. Store the sample in a 1.5 mL EP tube and dilute it with PBS for later use.
(4)
Sperm: Aspirate 10 μL of sperm from the cloaca of adult fish with a 10–200 μL pipette and store in a 1.5 mL EP tube, diluted with PBS for later use.
(5)
Caudal fins: Use ophthalmic scissors to cut a part of the caudal fin tissue and place it in a 1.5 mL EP tube, add 50 μL of ACD, cut the tissue into a cell suspension with ophthalmic scissors, keep it stationary for 2 min, and then take the upper cell suspension for later use.
(6)
Gonadal tissues: In this study, the early ovaries of female fish before stage II development and the sperms of males at each stage of development were all suitable for FCM for ploidy detection. Via ophthalmology, extract ovarian or testicular tissues of the size of a mung bean and cut the tissues into pieces with small scissors in a small Petri dish. Add a small amount of PBS and transfer the sample to a 1.5 mL EP tube, keep it stationary for 2 min, and take the upper cell suspension for later use.
(7)
Livers, gills, spleens, and other tissues: Use ophthalmic scissors to cut liver, gill, and spleen tissues of the size of a mung bean, place them in a small Petri dish, cut them into pieces with small scissors, add a small amount of PBS, transfer them to a 1.5 mL EP tube, keep them stationary for 2 min, and take the upper cell suspension for later use.

2.2.3. Specific Staining of DNA in Nuclear Suspension

Take 1.5 mL EP tubes with the same number of samples to be tested, add 500 μL of specific DAPI dye solution into each tube, make the label, add the corresponding samples to the dye solution (embryo, cell, and tissue samples can make the dye solution slightly cloudy; blood samples can make the dye solution light yellow) and then stain in the dark for 10–15 min, filter through a 30 μm filter, and dilute with normal saline to keep the concentration of nuclei in the samples for FCM analysis at 1.0 × 10⁵~1.0 × 10⁷ per/mL.

2.2.4. Detection via FCM

The test instruments used for the DNA content of samples were the Cell Counter Analyser CCA-Ⅱ produced by Partec PA (Münster, Germany) and 3.5 mL Sysmex tubes (Münster, Germany). In the peak analysis diagram, the X-axis represents the order of magnitude of DNA content, the Y-axis represents the number of cells measured, and each peak represents a group of cells with the same DNA content. The samples were determined and the results were analyzed and stored according to the FCM operating procedures. The measurement results were measured using a caloric square.

3. Results and Analysis

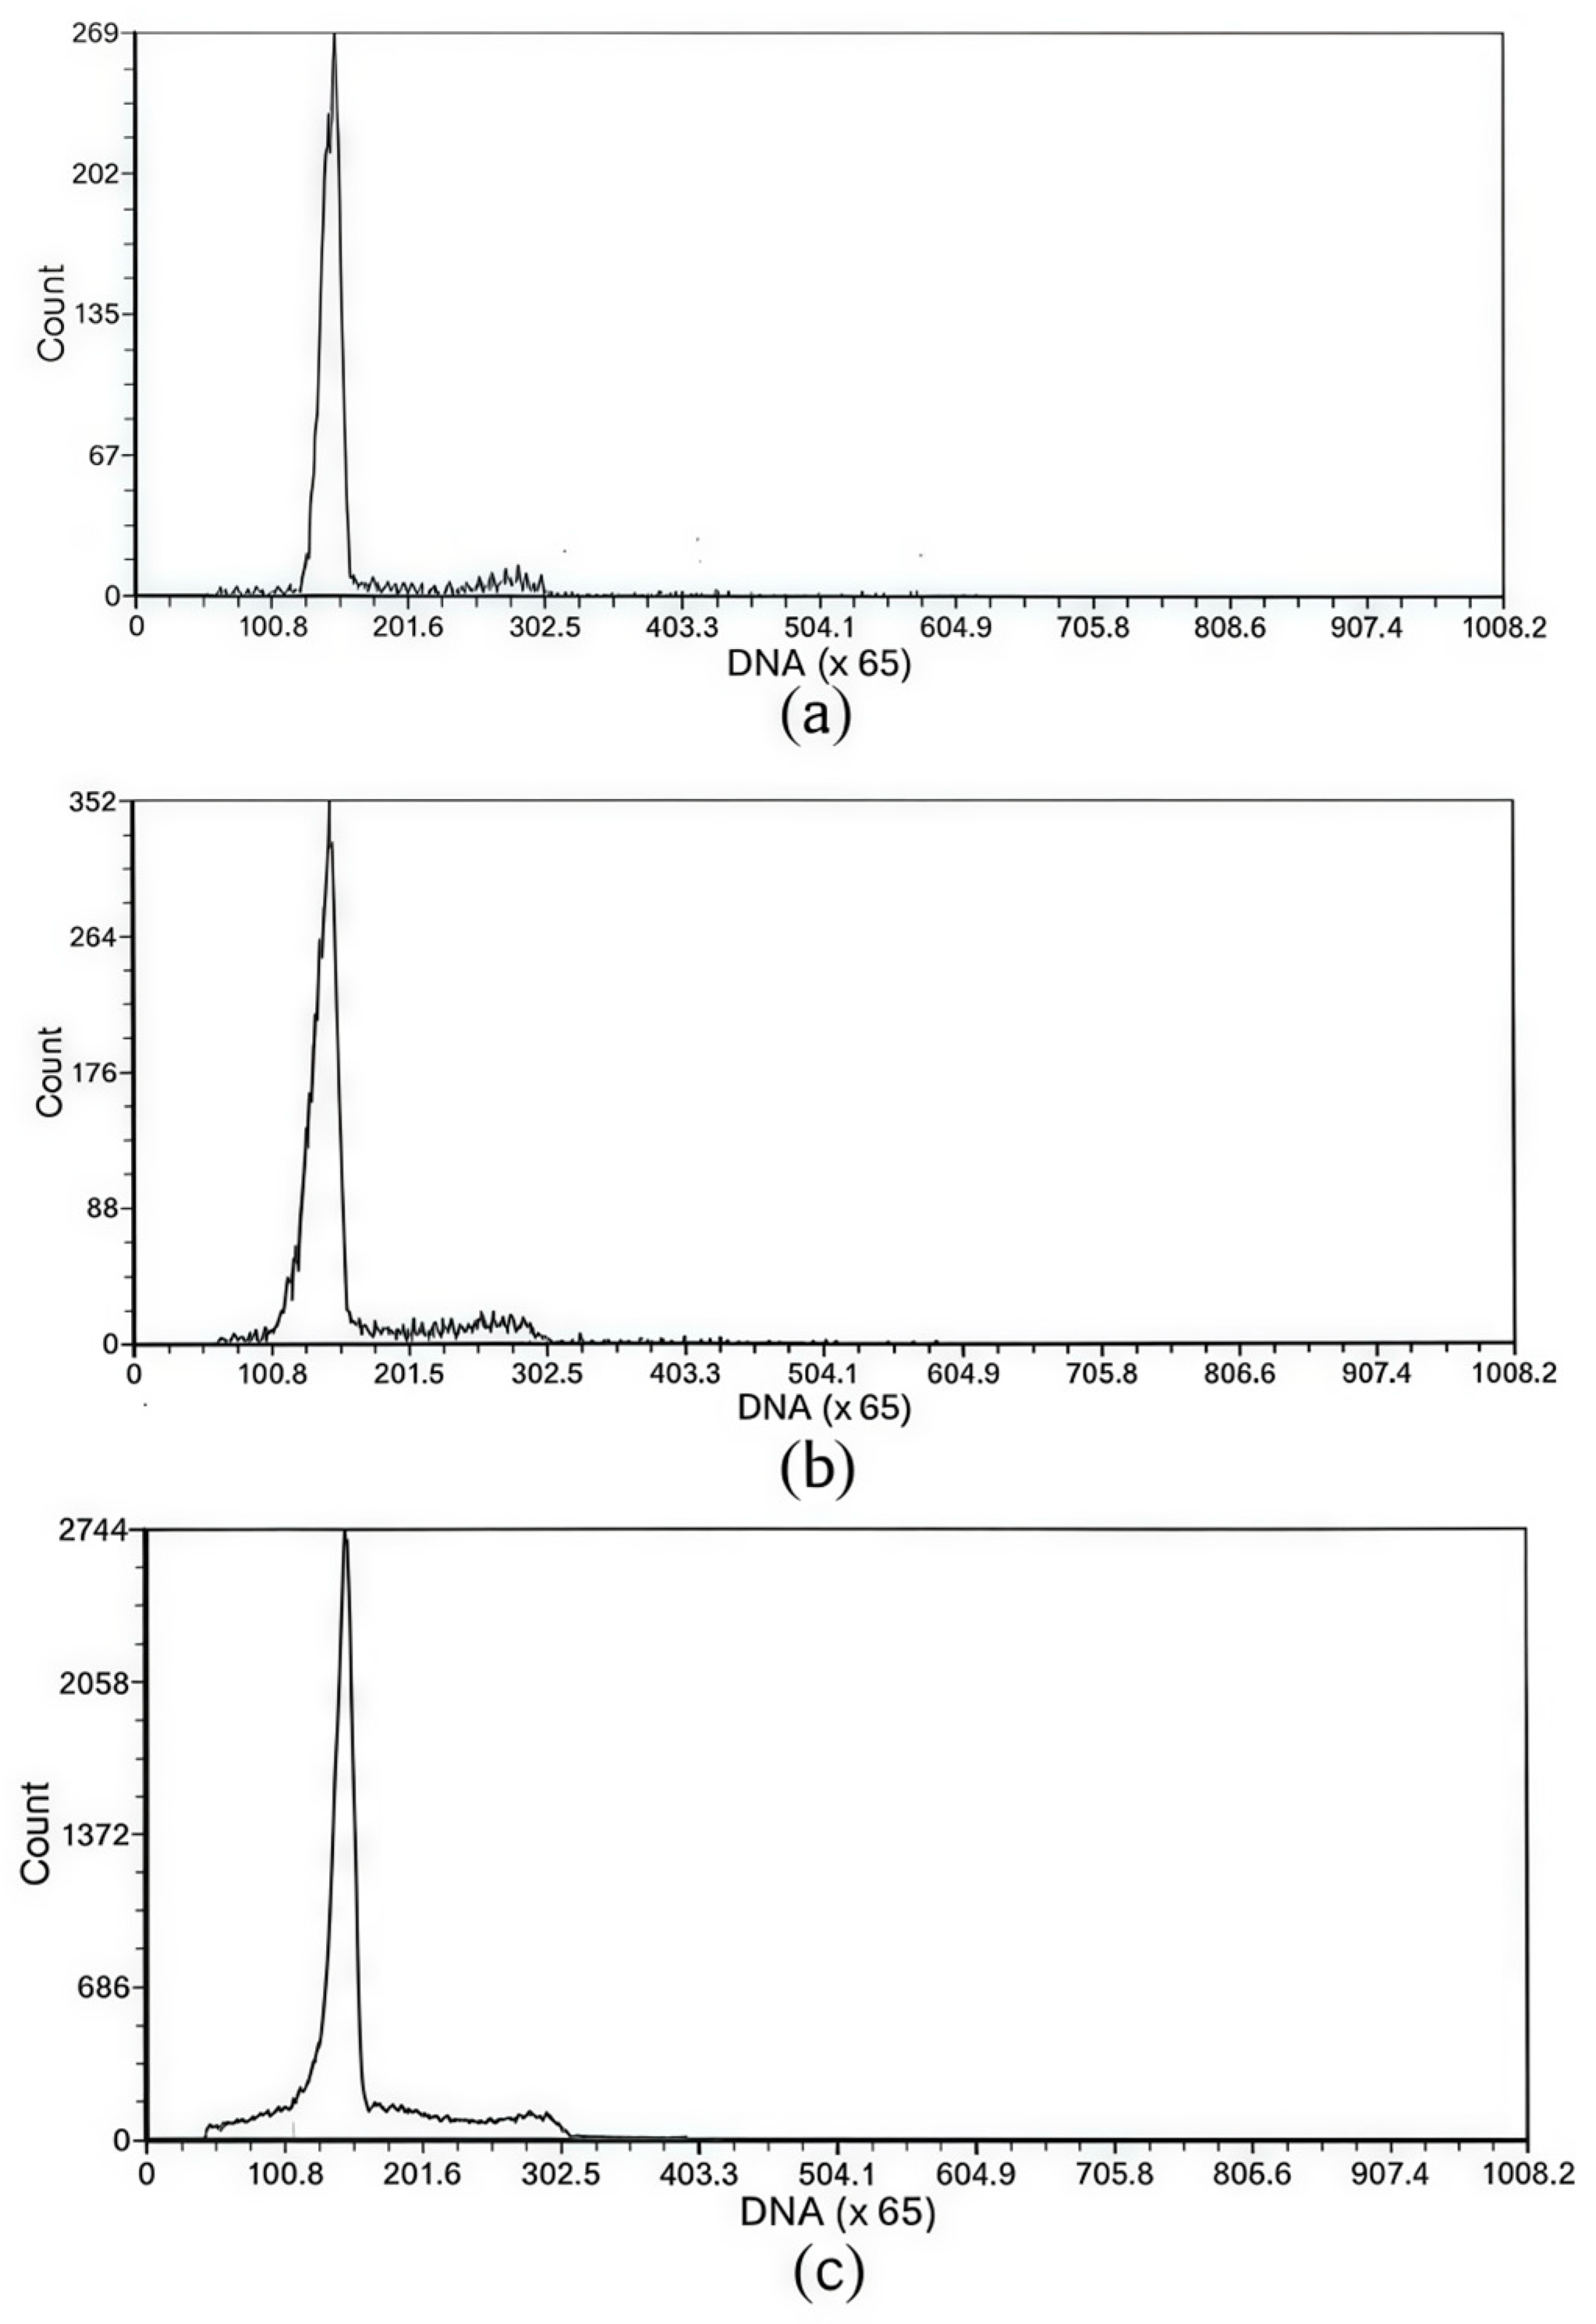
3.1. Detection at the Embryo and Fry Stages

Throughout the fish germplasm innovation experiment, the related breeding combinations could be tested via embryo flow and larvae ploidy at the embryonic stage at the earliest and within half a month after hatching. The DNA ploidy results of embryo cell detection and fry detection were more accurate. Figure 1 shows the DNA content of the blood cells of triploid crucian carp (Triploid carassius auratus, 3n = 150, abbreviated as 3nDTCC), embryo cells, and fry cells measured using FCM (Sysmex). It can be seen that the main peak is relatively concentrated in the FCM results, and there are only a few other heteroploidy signals on both sides of the main peak. The quality and results of the peak graph are consistent with the blood cell detection data from adult fish, demonstrating that this is a convenient and high-quality method to detect the early ploidy of fry.

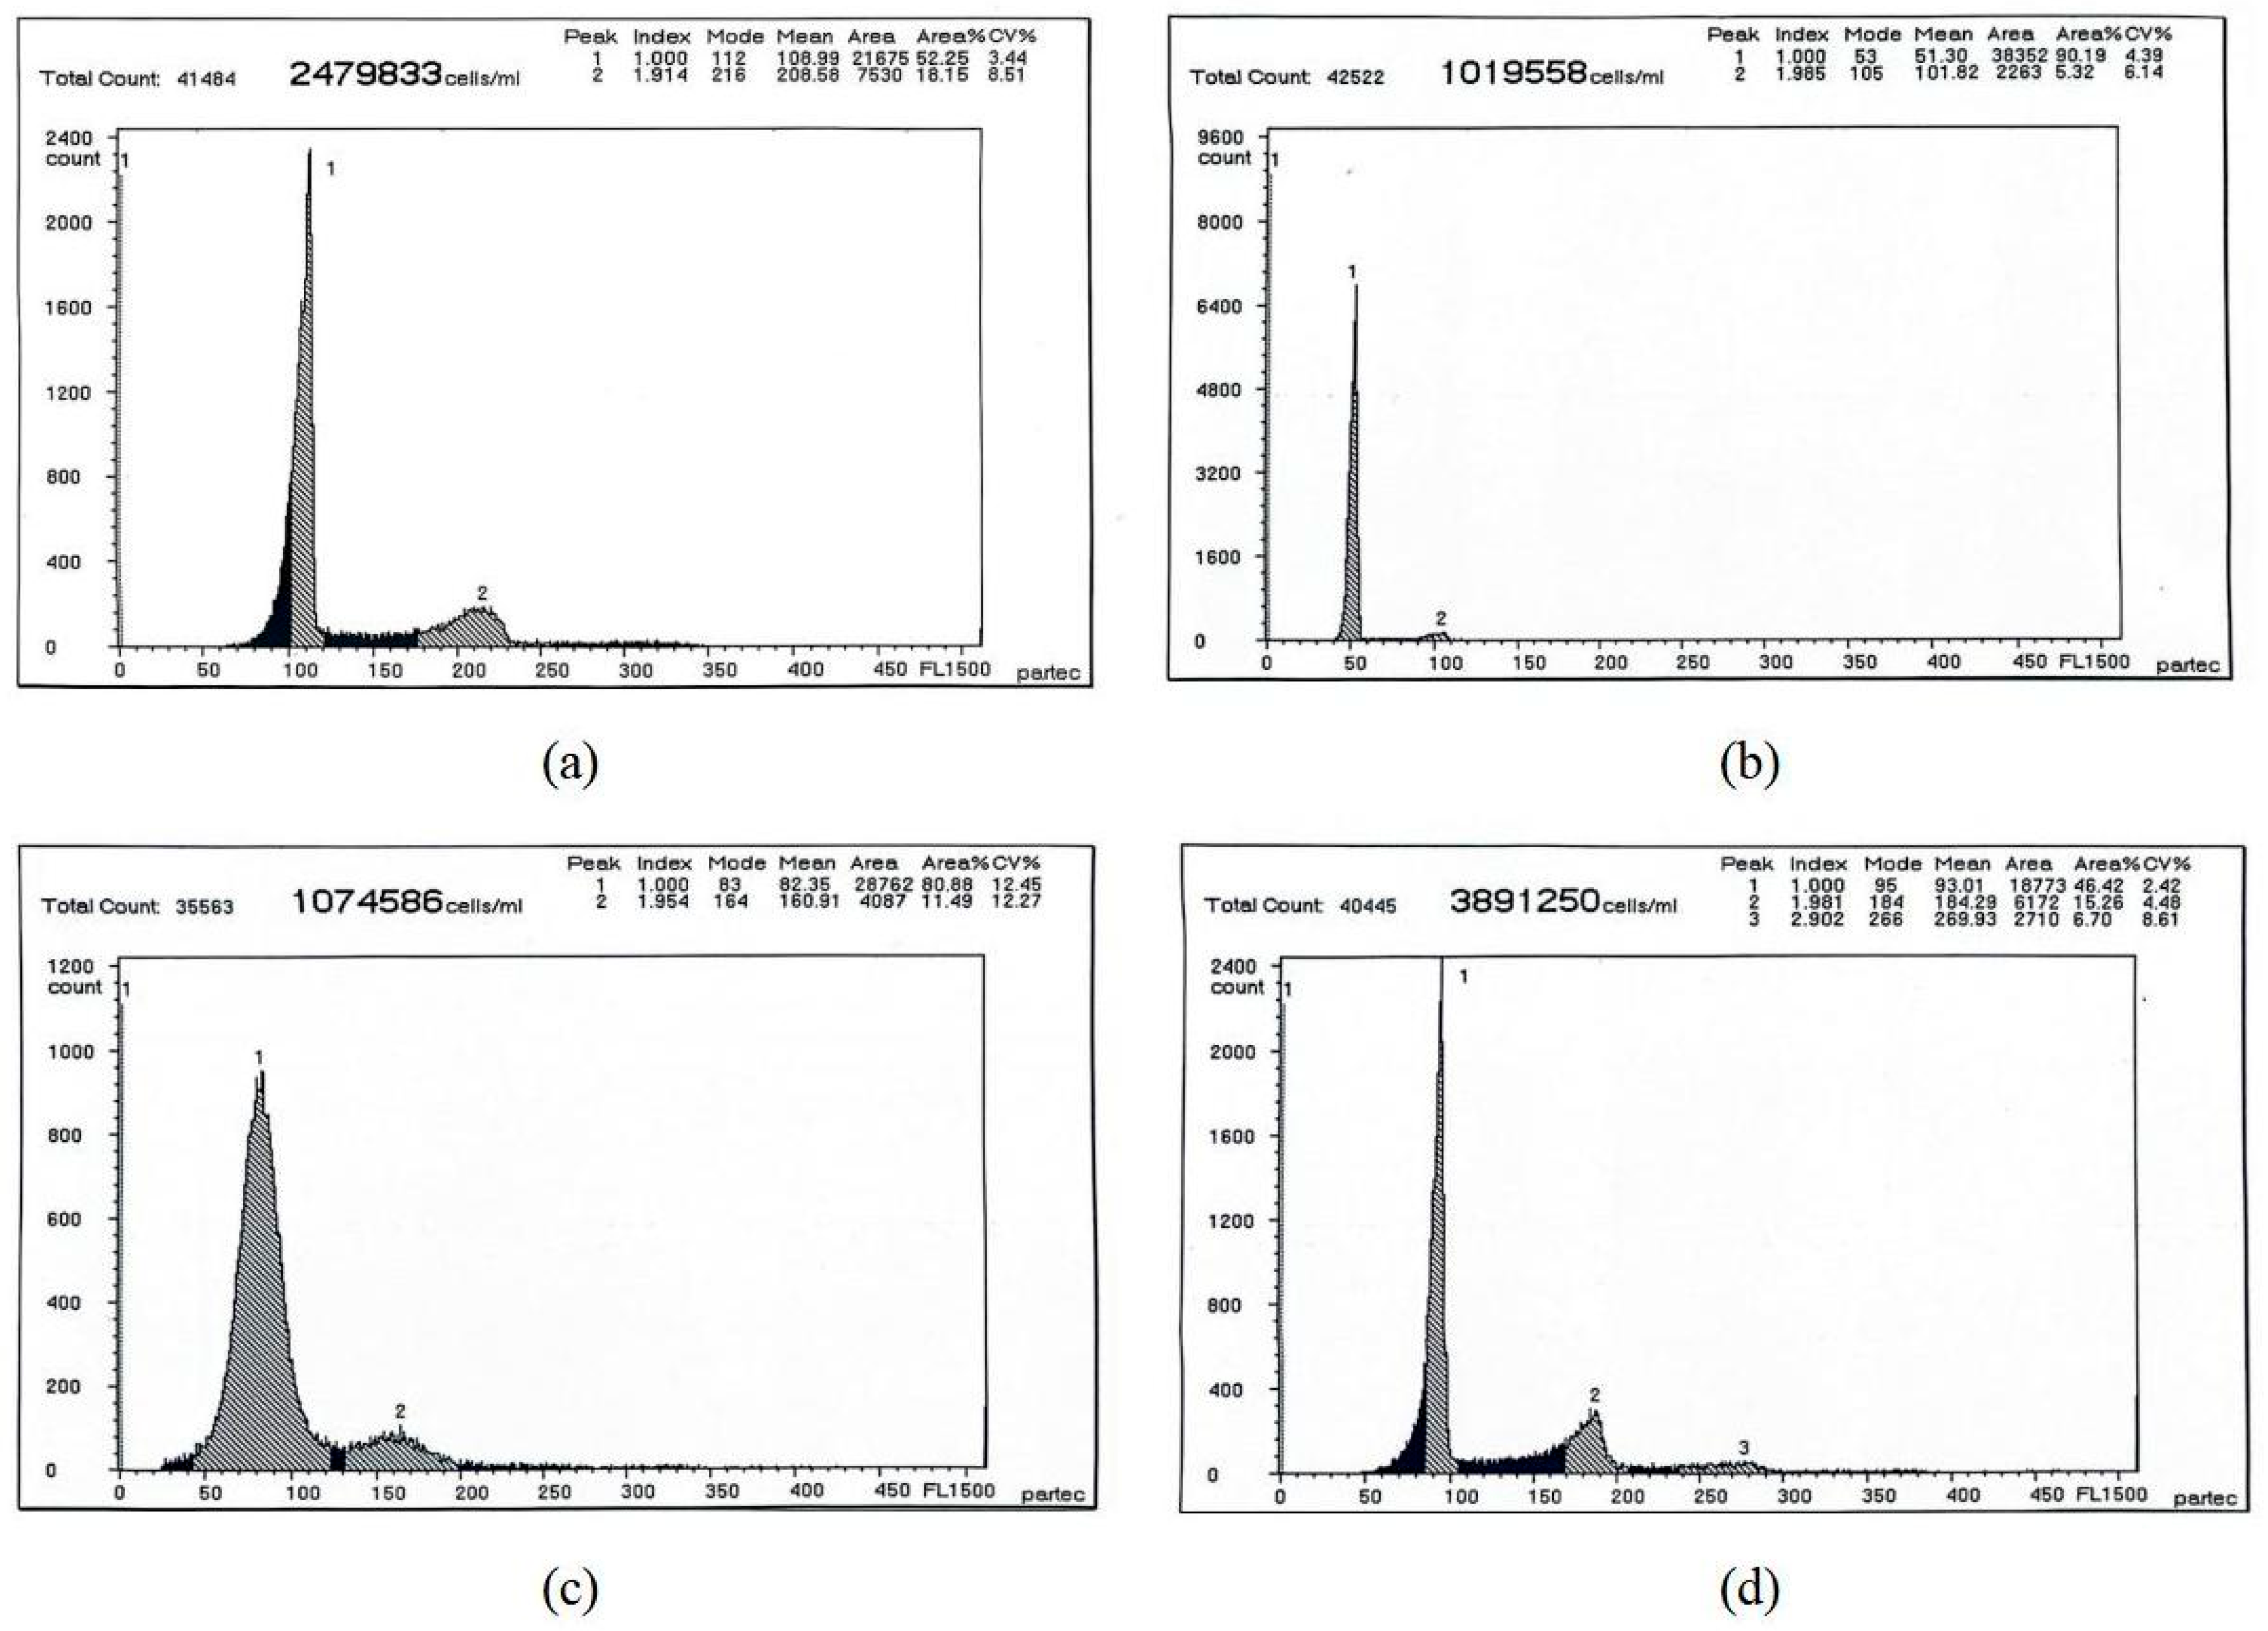
3.2. In Vivo Detection of Adult Fish

The ploidy of adult experimental fish can be detected using FCM to measure the DNA content of blood, sperm, and caudal fin cells. The biggest advantage is that live samples can be collected, and experimental fish can continue to culture after sampling. The DNA content of blood, sperm, or caudal fin cells is often tested when the population of experimental fish is small and to select the parent fish during the breeding season. Blood cell DNA content detection is the most accurate and stable method, and it is the most commonly used sampling method. Blood cell samples are often used in the distant hybridization and polyploid breeding of fish, and are also commonly used as a control in FCM detection experiments.
As shown in Figure 2a and Figure 3, the RCC blood cells were the control group; their main peak was concentrated; and the number of cells measured per unit volume was orders of magnitude higher. The detection of sperm DNA content can intuitively reflect the ploidy of sperm produced. Figure 2b–d show the detection of DNA content in the sperm cells of diploid RCC, 3nDTCC, and allotetraploid hybrids (4n = 200, abbreviated as 4nAT), respectively. It can be seen that their DNA content is half that of somatic cells, the main peak is clearly visible, and the number of cells measured per unit volume is orders of magnitude higher. Generally, there will be one to two additional secondary peaks of other multiples in succession (cell adhesion leads to the appearance of peaks of different ploidies), the specific values are shown in Table 1 and Table 2.

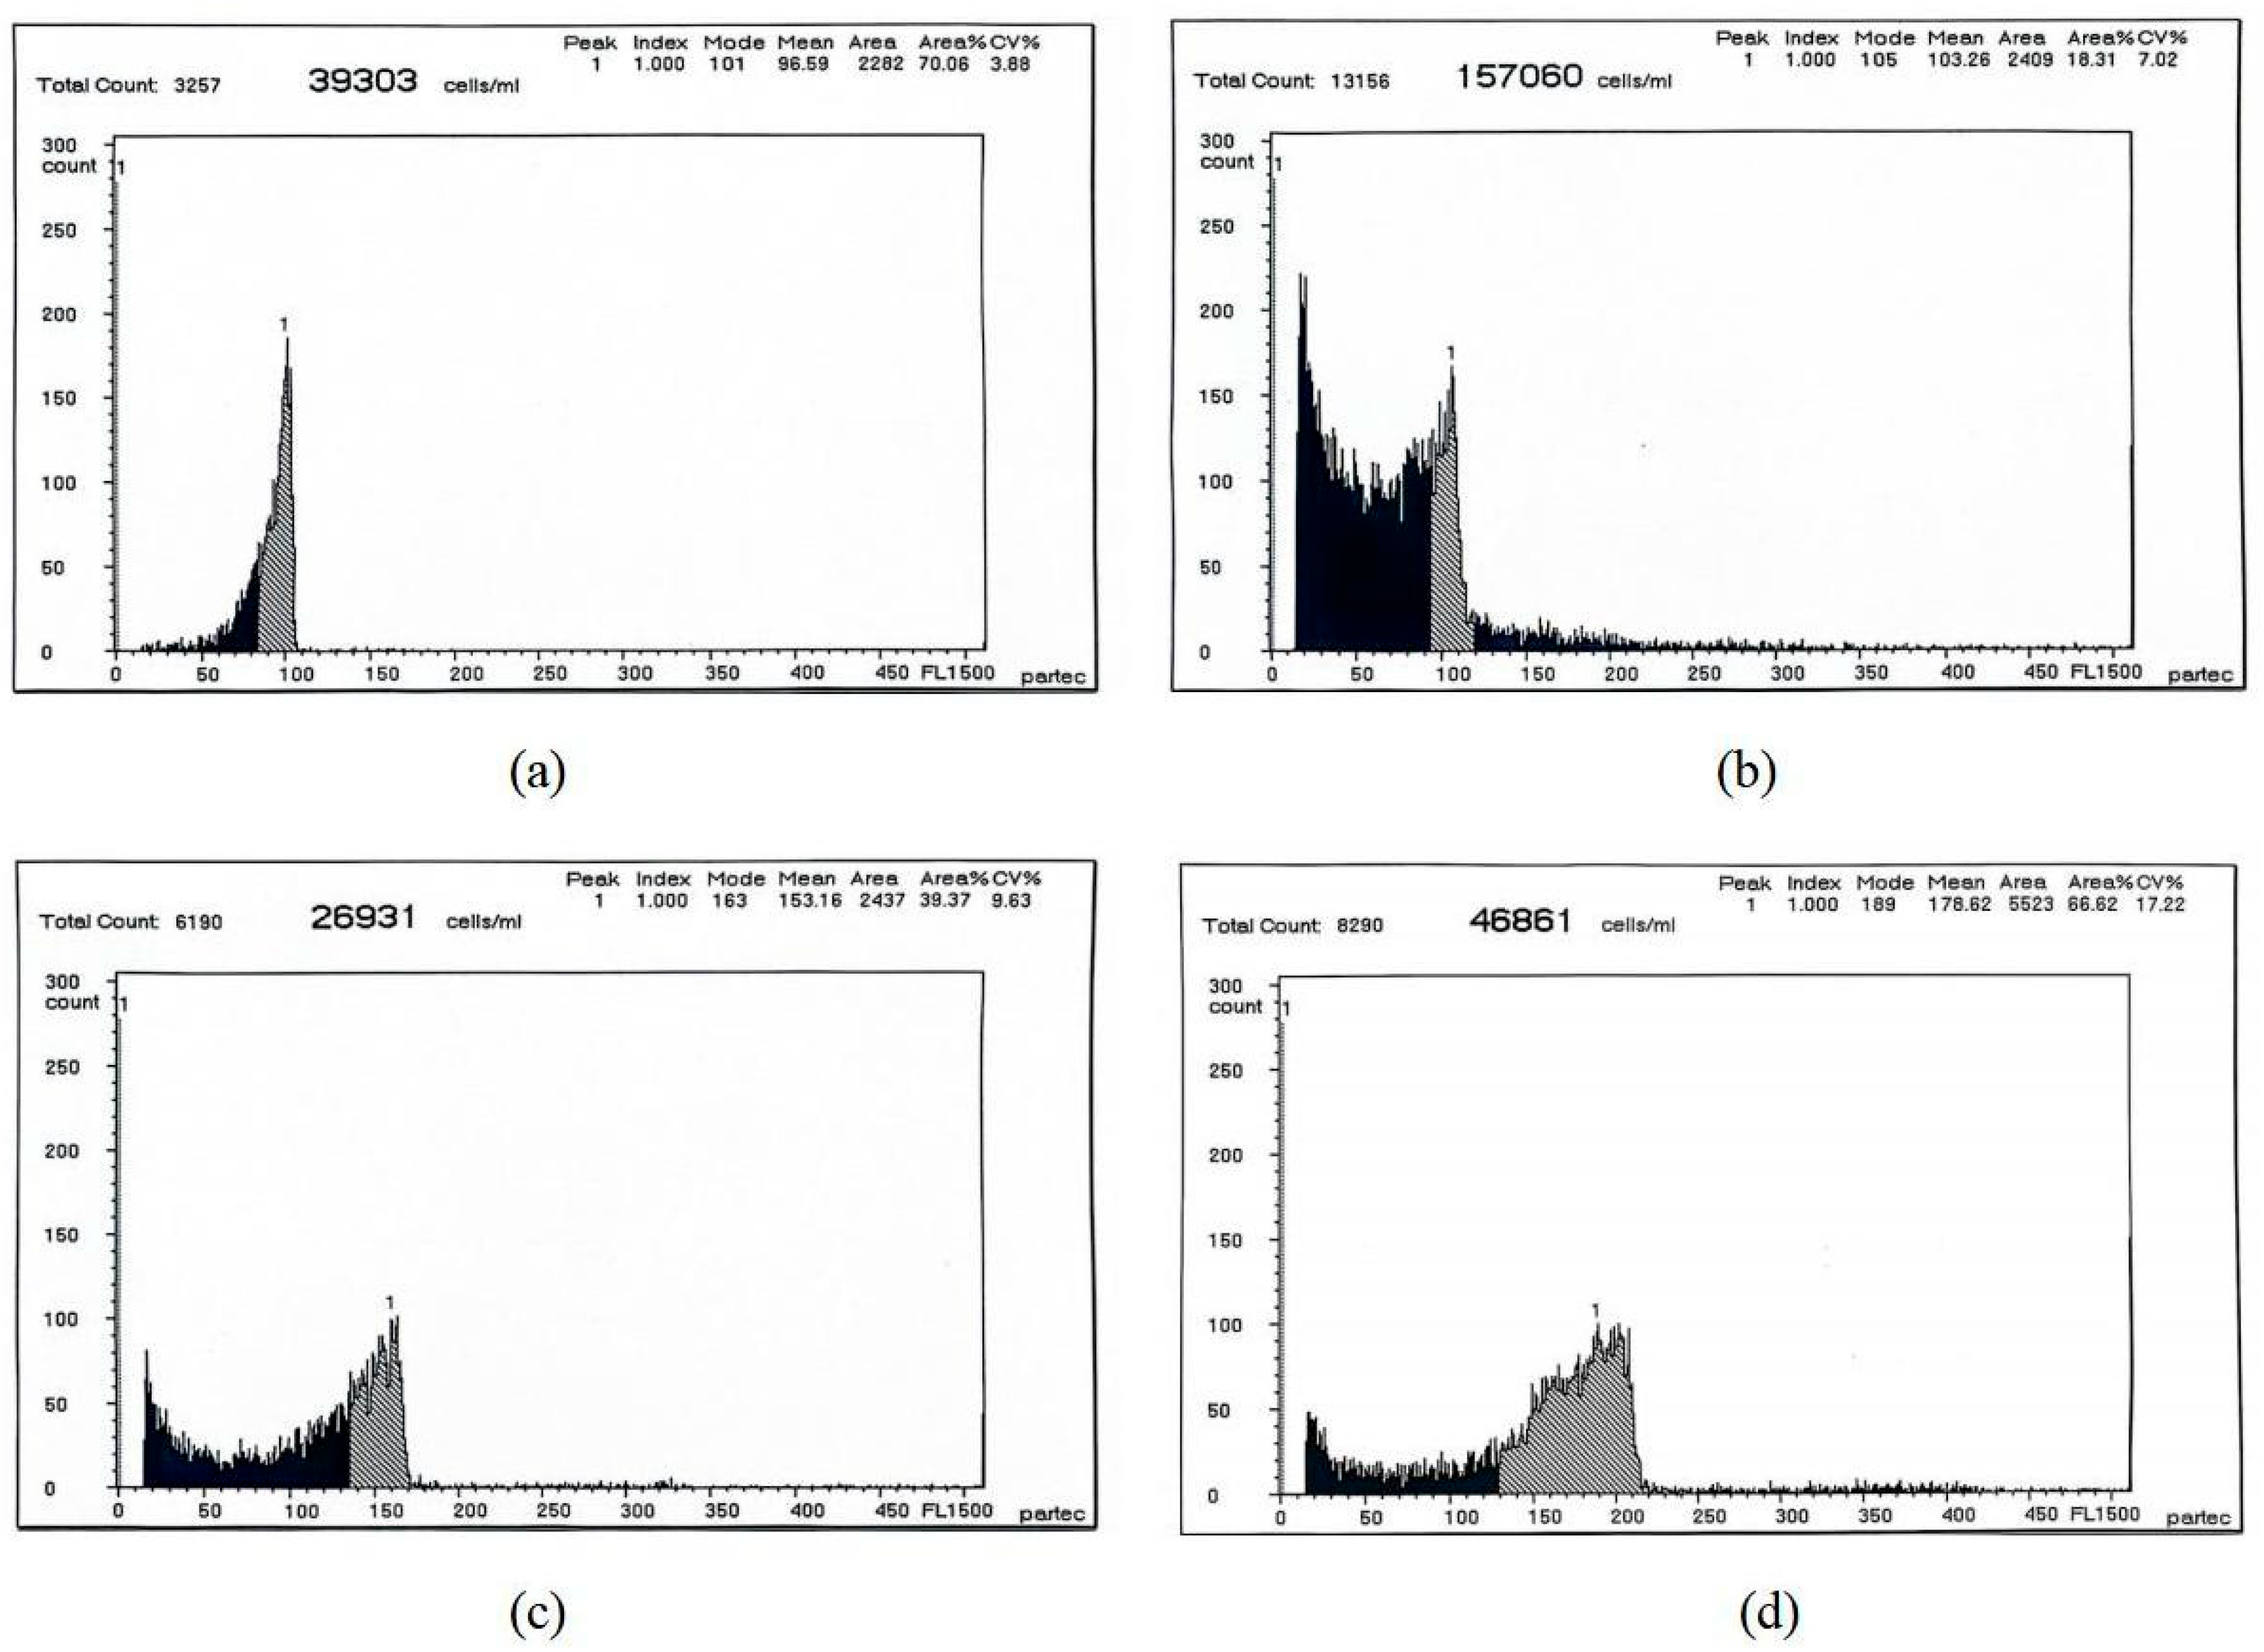
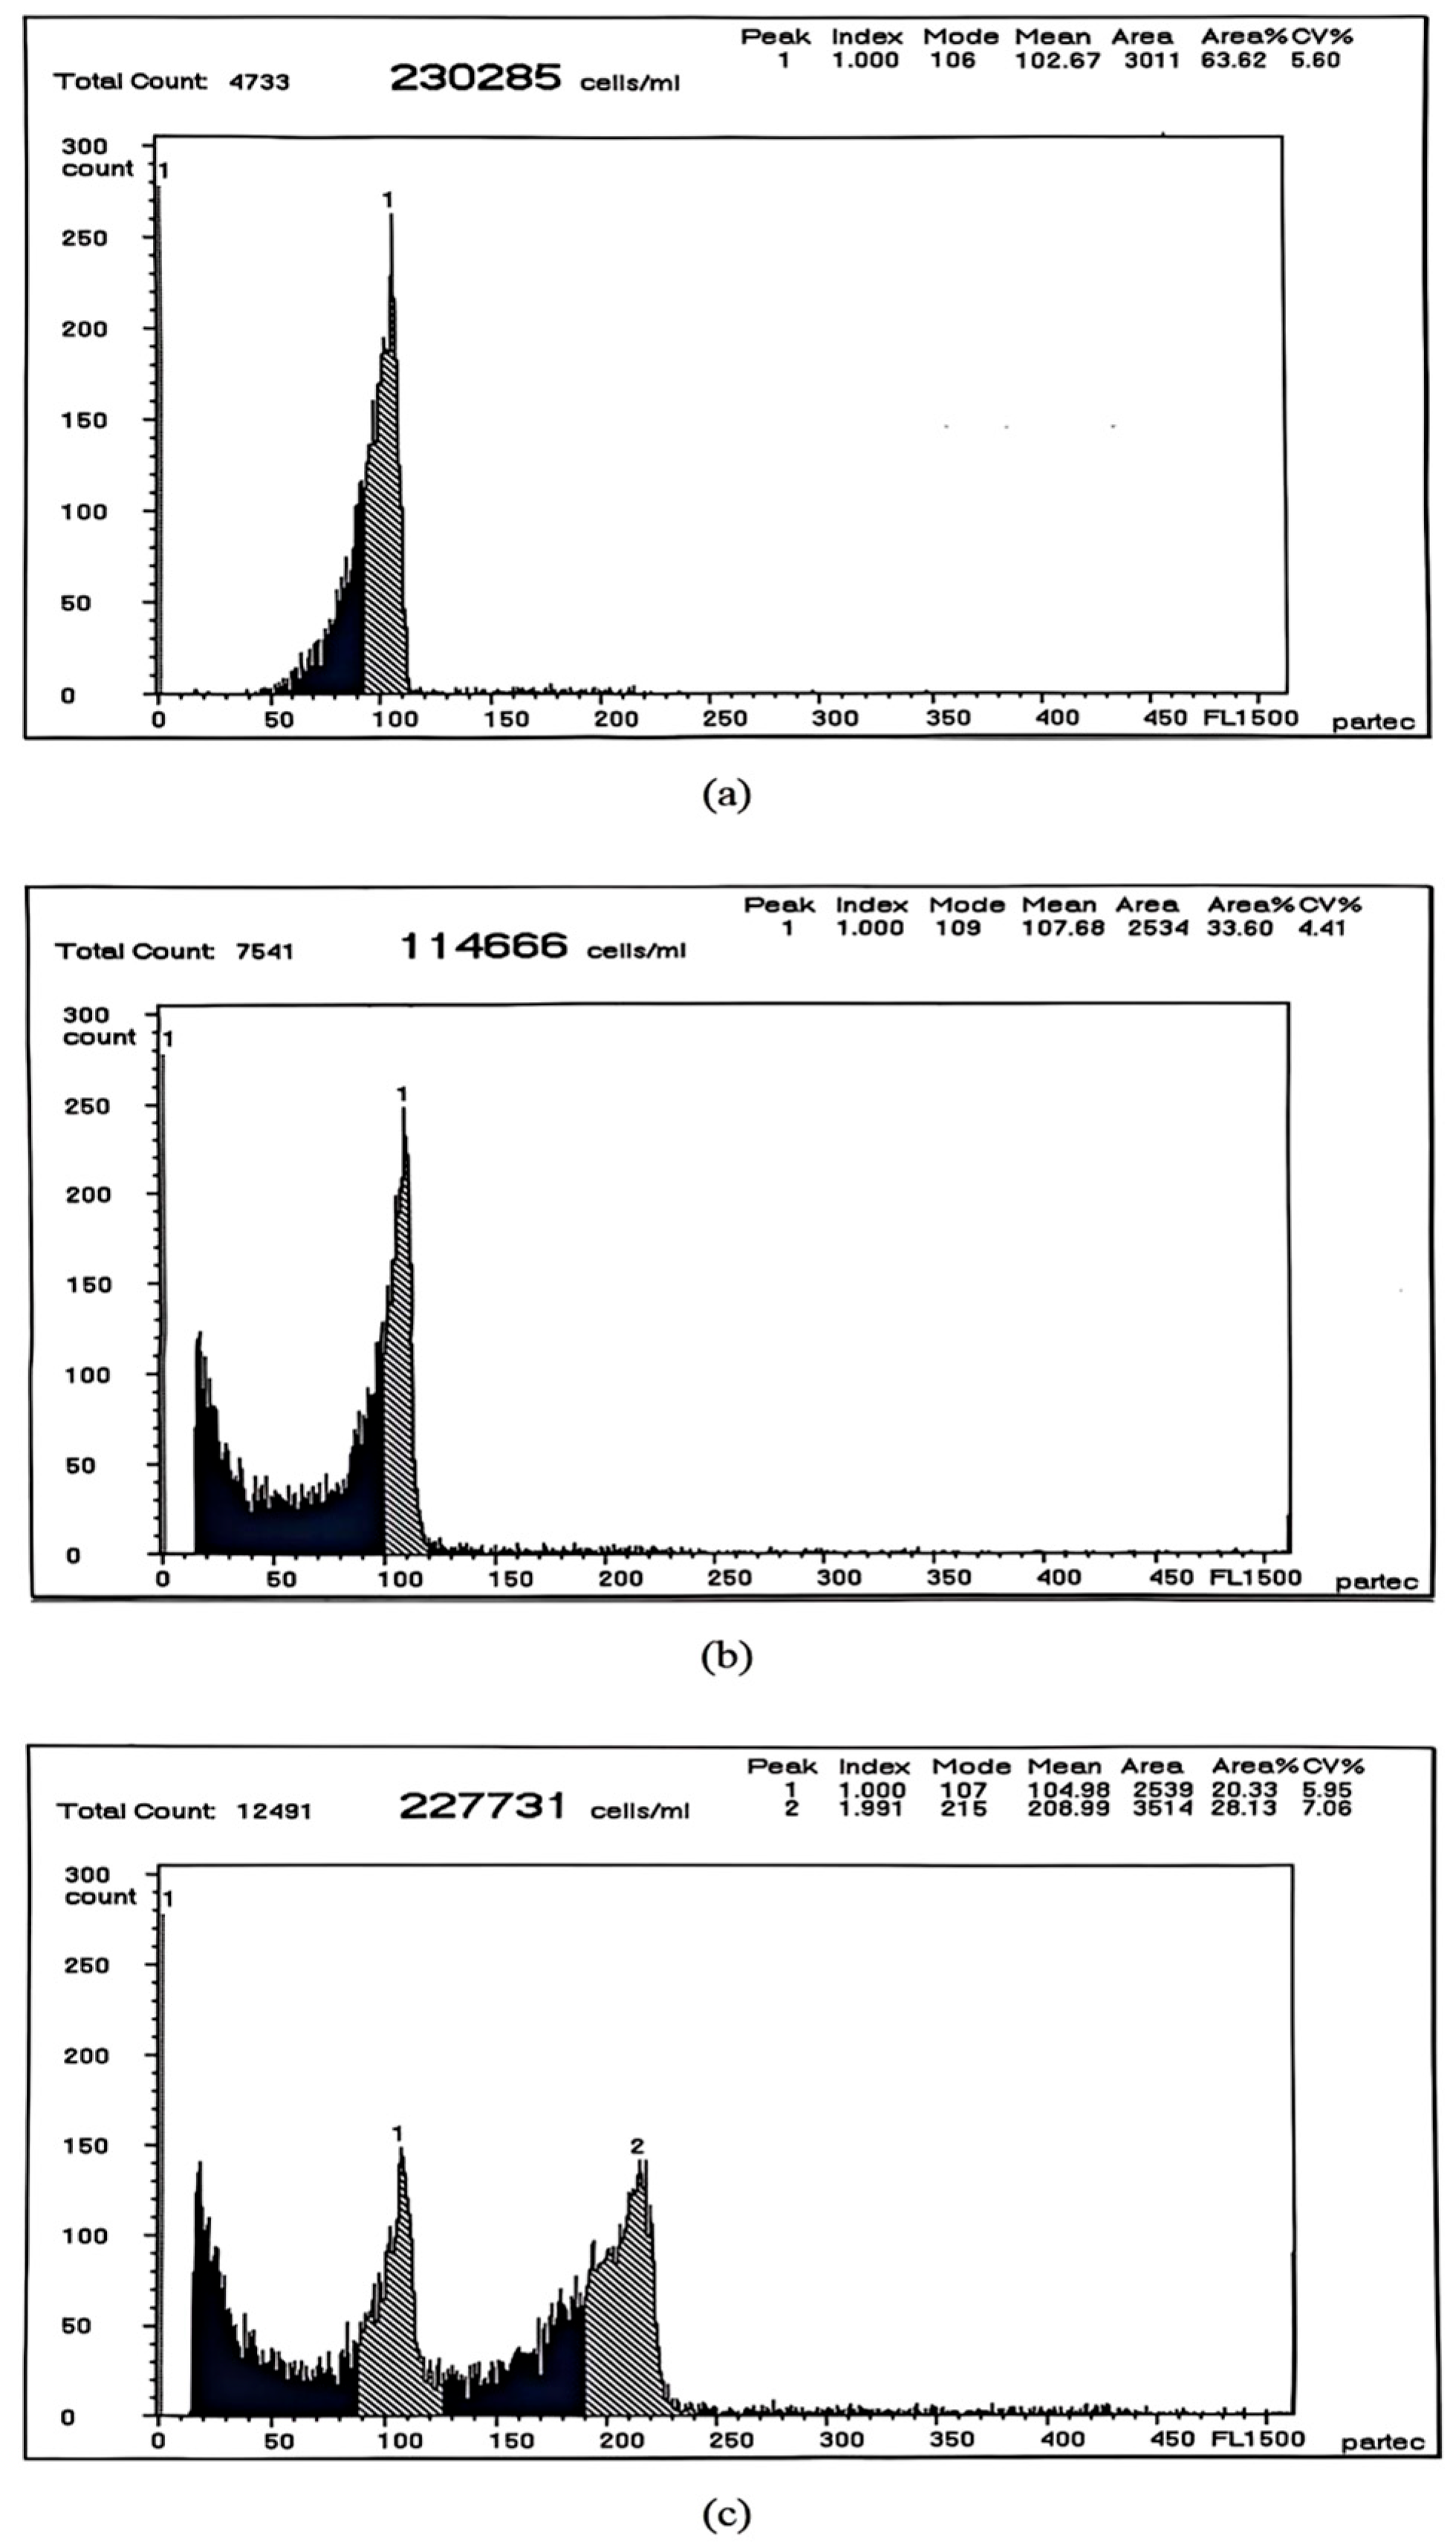
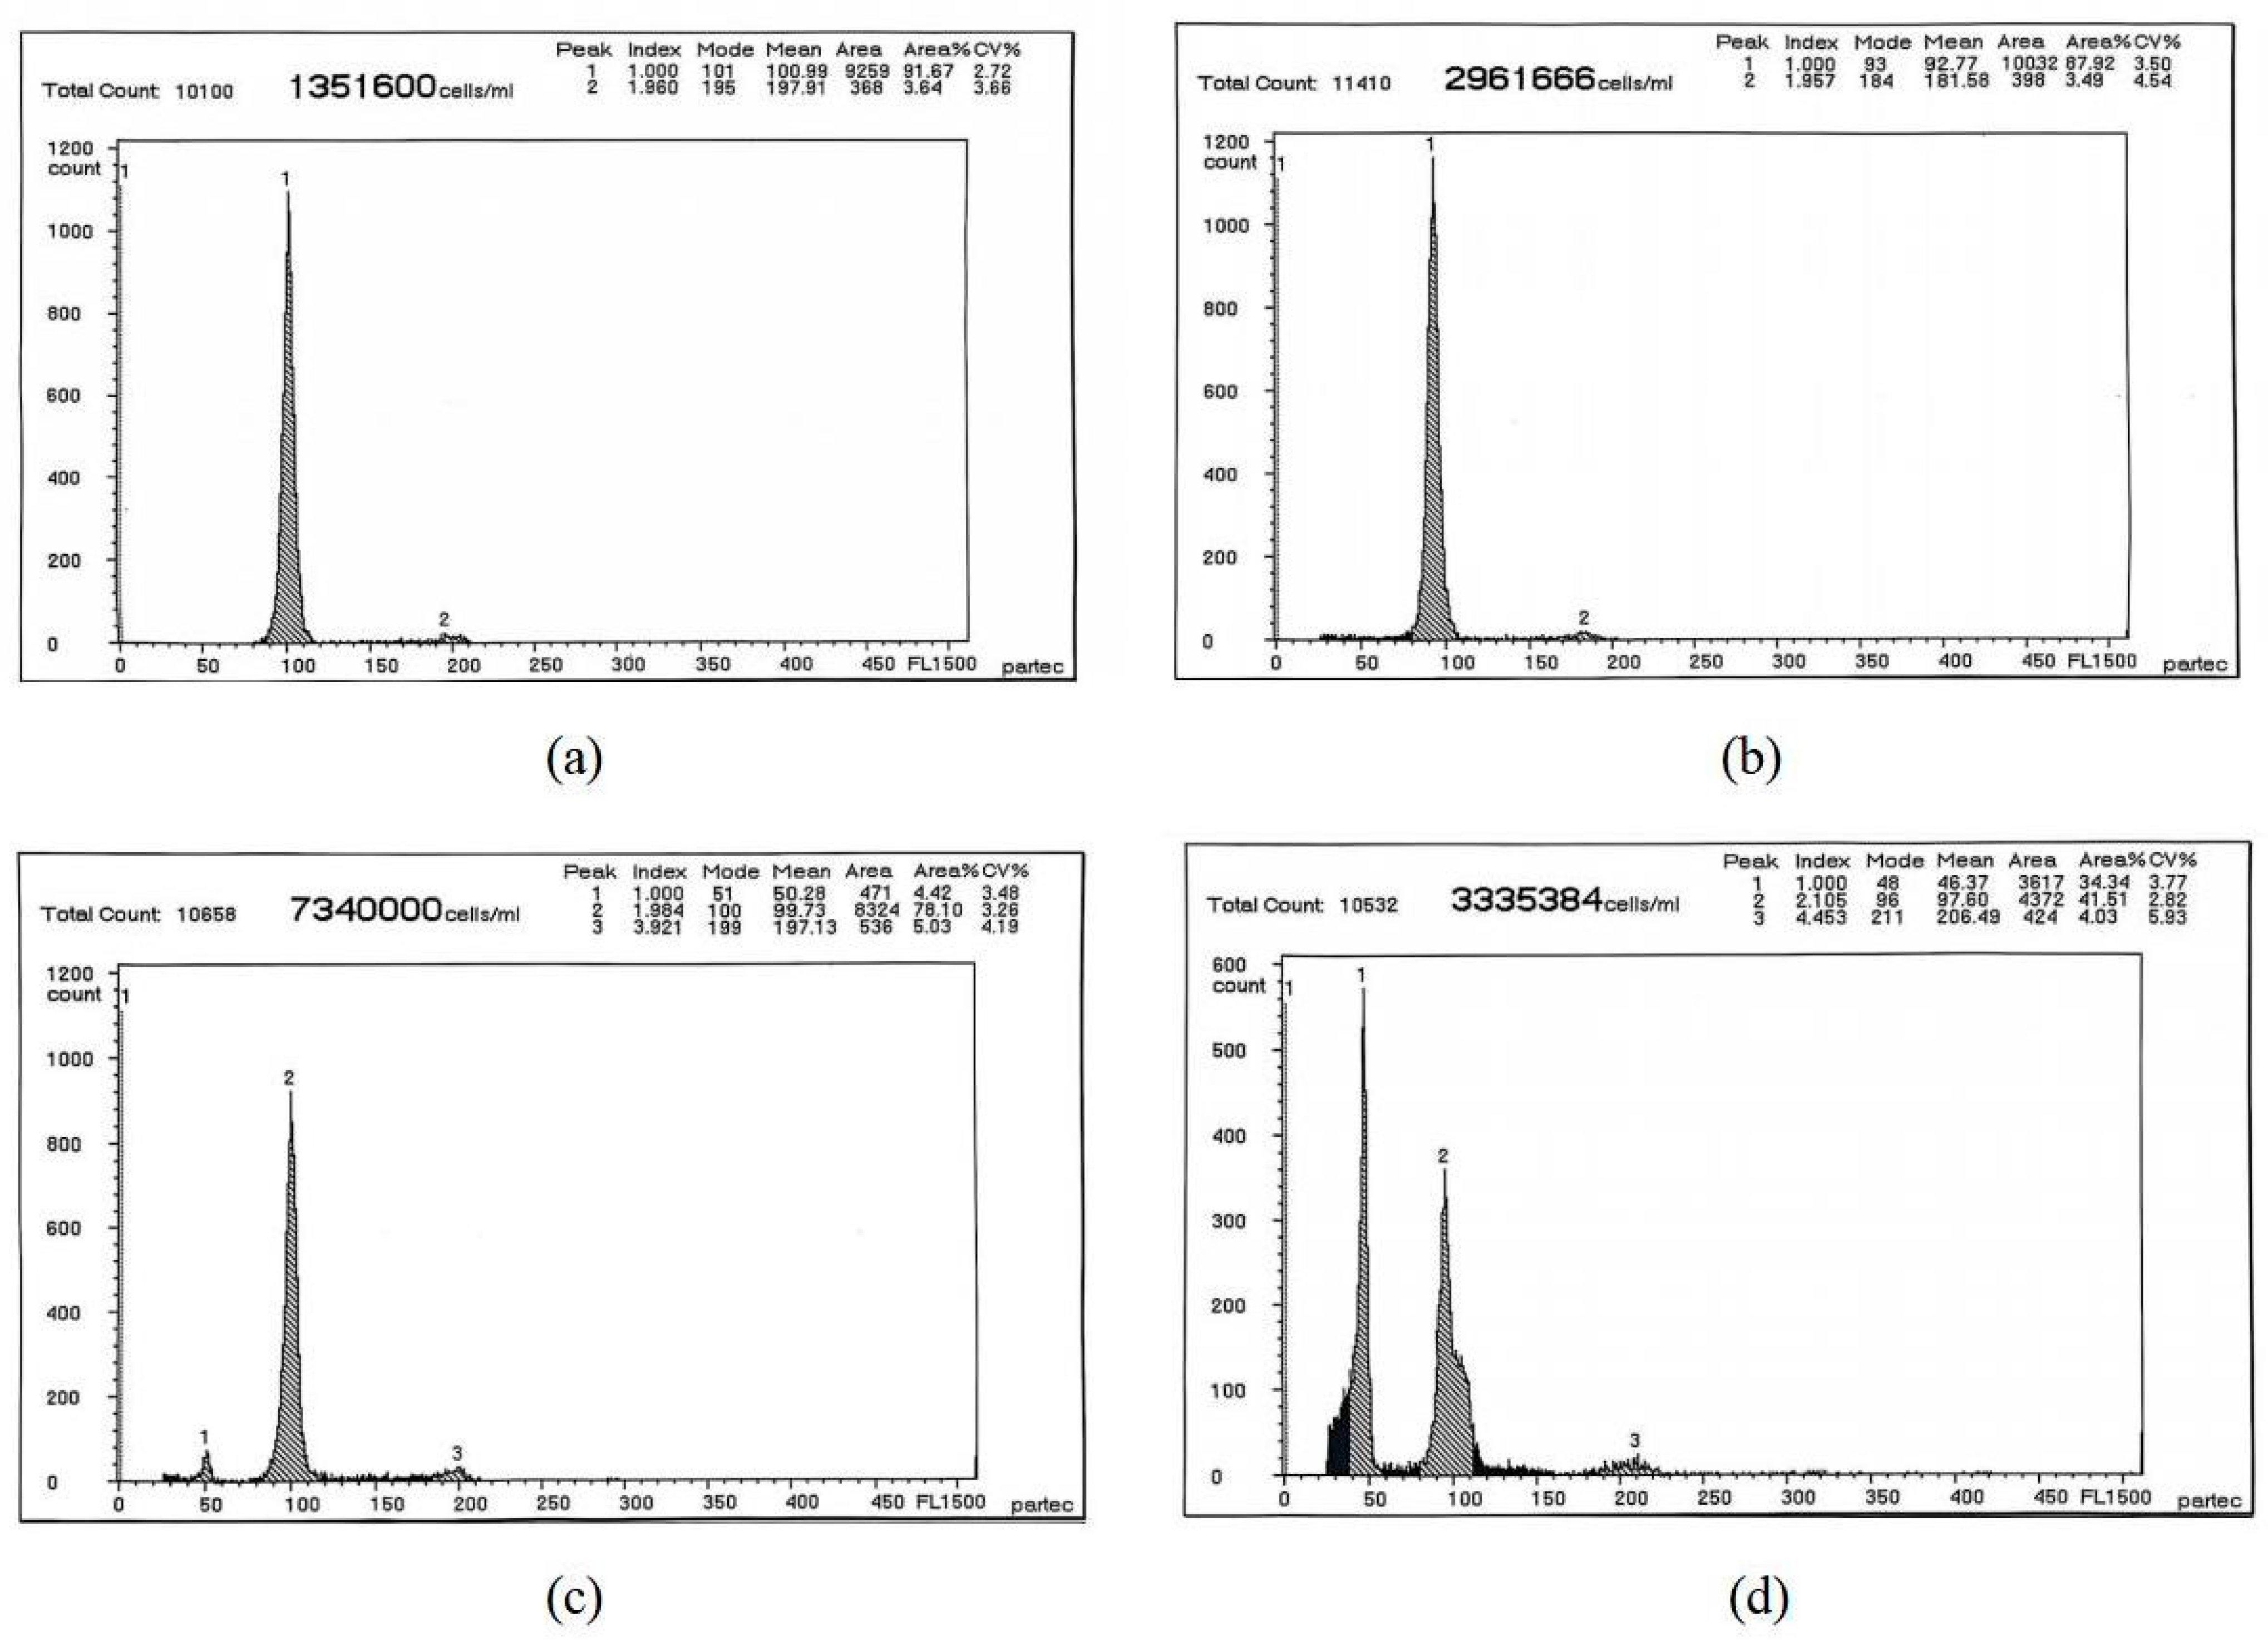
3.3. Detection of Specific Organizations

The detection of specific tissues requires the anatomical sampling of experimental fish, which makes it possible to carry out in-depth cellular mechanism research on specific tissue. Gonads can be divided into testes and ovaries. The DNA content of early ovaries and testes can be used to determine the genetic composition and developmental potential of germ cells. Figure 4 shows the detection of DNA content in the sperm and ovaries of diploid red crucian carp (Carassius auratus red var.) (2n = 100, abbreviated as RCC) (♀) × common carp (Cyprinus carpio L.) (2n = 100, abbreviated as CC) (♂) (abbreviated as JLF1). Generally, the main peak curve of ovarian tissue has a wide span, and a secondary peak with increasing ploidy appears after the main peak (Figure 4a). This reflects the meiosis process of gametes and can also reflect the polyploidy potential to a certain extent. The main peak of sperm is relatively concentrated, and there is a secondary peak with increasing ploidy after the main peak (Figure 4b), the specific values are shown in Table 3.
RCC tissues can also be used for FCM to detect DNA content. Figure 5 presents the DNA content of RCC detected using FCM. It can be seen that the peak characteristics of the gill and spleen tissue cells (Figure 5b,c) and the control blood cells (Figure 5a) are consistent, the main peak is concentrated, the number of cells measured per unit volume is high, and there is only a small number of other miscellaneous ploidy signals on both sides of the main peak. It is worth noting that there are two distinct peaks in the liver tissue cells (Figure 5d). There is the main diploid peak, which is consistent with the diploid blood cells, and a secondary peak with the average DNA content halved. Moreover, the distribution characteristics of the secondary peak are the same as those of the main peak, indicating the existence of equivalent cells with different ploidies. The halved phenomenon may be linked to a loss of liver mass with senescence and/or liver damage or during organ development and the specific values are shown in Table 4.
The measurement results of DNA content in various tissues of RCC were taken as an example to illustrate the relevant statistical methods (Figure 5). In this group, the DNA content of diploid RCC blood cells (Figure 5a) was taken as a reference, and the peak value of the average DNA content of gill (Figure 5b) and spleen tissue cells (Figure 5c) was consistent with that of the diploid blood cells, which were also diploid cells. It is worth noting that the liver tissues (Figure 5d) contain both diploid cells that are consistent with diploid blood cells and cells with half the average DNA content and the specific values are shown in Table 5.

4. Discussion

In this study, FCM was used to determine the DNA content of different tissues from various freshwater fish, and ploidy analysis was carried out. The results show that the use of flow cytometry to measure nuclear DNA content and conduct ploidy analysis has the advantages of high efficiency, fast detection speed, high sensitivity, and high accuracy. Generally, it is also non-destructive and does not affect the normal growth and development of individuals. Compared with the identification of ploidy via chromosome counting, it has obvious advantages when there are more samples or the samples are not suitable for chromosome preparation [46,47,48].
During the detection of embryos and fry cells, using FCM to detect the ploidy of embryos and fry can provide crucial information in the early stage of fish germplasm innovation experiments. Moreover, the detection results are consistent with the data obtained from the blood cell tests of adult fish, indicating that this method is both convenient and reliable for ploidy detection at early stages. For in vivo detection of adult fish, FCM can be used to determine the ploidy of experimental fish by detecting the DNA content of blood, sperm, or caudal fin cells. Among these, the detection of DNA content in blood cells is the most accurate and stable, and it is widely used in the distant hybridization and polyploid breeding of fish. Meanwhile, detecting the DNA content of sperm can directly reflect its ploidy, providing an important basis for studying the reproductive genetics of fish. However, the additional secondary peaks that appear in the detection results may be caused by cell adhesion or other factors. Further research is needed to clarify the specific causes. The detection of specific tissues contributes to in-depth research on cellular mechanisms in experimental fish. The wide span of the main peak curve in ovarian tissue cells and the appearance of secondary peaks reflect the meiosis process of gametes and can, to some extent, help us to judge the polyploid potential. The main peak of testis cells is relatively concentrated, and the existence of secondary peaks is related to the formation and genetic characteristics of sperm. In addition, two distinct peaks appear in the liver tissue cells of red crucian carp, indicating the presence of equivalent cells with different ploidies. This halved phenomenon is in line with mammalian liver cells linked to a loss of liver mass with senescence and/or liver damage during organ development [49].
Moreover, in distant hybridization, gynogenesis, or androgenesis breeding in fish, ploidy diversity usually appears in the offspring. Conducting batch and rapid DNA content detection on the embryos of the fry bred in the current year and the fry at the age of half a month can predict the occurrence of diploids or polyploids in the population and estimate the potential of distant hybridization combinations and the success rate of gynogenesis breeding [50]. Blood, sperm, and caudal fin cells are commonly utilized for the in vivo detection of adult fish. Among these, the sampling data obtained from blood cells and sperm prove to be more accurate [51]. In cases where it is impractical to collect blood or sperm from juvenile fish, sampling the caudal fin can serve as an alternative approach to help ascertain the ploidy of the individuals [43]. This method is suitable for sorting experimental fish according to ploidy at the early stage of fish growth, and is also widely used in distant hybridization and gynogenesis breeding [52]. Ovarian and testicular tissues can be used to isolate relatively discrete cell groups. The detection of their DNA content is often used to judge the developmental potential of the germ cells of experimental fish and is widely applied in studies on the occurrence and mechanisms of polyploidy and hybrid sterility. Diffuse tissues such as gills, spleens, and livers can also be used for DNA content detection via FCM [53]. Due to the lack of sampling in vivo, the application is relatively rare; however, it can be used to assist in the detection of individual ploidy [54,55].
Compared with other fish-related studies, this research comprehensively introduced the detection methods and effects of FCM in different fish tissues (including various tissues of embryos, larvae, and adult fish). The application scenarios of the ploidy detection of different individuals or tissues in the practice of fish genetic breeding were also analyzed. With the development of fish genetic breeding techniques, the integration of traditional biological breeding and molecular-assisted breeding has been increasingly valued. In this process, in vivo ploidy detection of individuals has become an important basic research direction [56,57]. Through in vivo detection techniques, individuals with the target ploidy can be rapidly and non-invasively screened at an early stage, enabling early sorting and subsequent targeted tracking, thus improving the breeding efficiency and accuracy [58,59].

5. Conclusions

In this study, FCM was applied to measure the DNA content of cells from various tissues of freshwater fish with different ploidy levels, highlighting the crucial role of FCM in fish genetic breeding. This technology not only offers robust support for research on the ploidy diversity of offspring during the distant hybridization, gynogenesis, or androgenesis breeding of fish, but it can also effectively differentiate between different fish species and strains, firmly establishing a foundation for the sustainable utilization of fish germplasm resources. Based on breeding requirements, different tissue samples can be selected for detection, and the operation methods are highly flexible. Overall, flow cytometry provides efficient and accurate technical support for fish genetic breeding and serves as a significant driving force for the healthy and sustainable development of the aquaculture industry. With continuous technological advancements and improvements, flow cytometry is expected to play an even greater role in the field of fish genetic breeding, making substantial contributions to addressing global food security and the supply of aquaculture products.

Author Contributions

X.Z. (Xinyan Zhu) and Y.C. conceived and designed the experiments. J.Q. and X.L. performed the bioinformatics analysis and prepared the manuscript, the table, and the figures. B.L., X.Z. (Xiaodie Zhang), L.N. and K.C. conducted the experiment. F.Y., R.Z. and C.Z. collected the samples. All authors have read and agreed to the published version of the manuscript.

Funding

This research was supported by the National Natural Science Foundation of China (grant no. 32293252), The Biological Breeding-Major Projects (grant no. 2023ZD04054/2023ZD0405402), The 111 Project (D20007), and the earmarked fund for the China Agriculture Research System (grant no. CARS-45).

Institutional Review Board Statement

The present study was approved by the Engineering Research Center of Polyploid Fish Reproduction and Breeding of the State Education, Ministry, College of Life Sciences, Hunan Normal University; Yuelushan Laboratory; and Hunan Applied Technology University (ethic code: GB/T 35823/2018). All procedures were strictly carried out according to the regulations and guidelines approved by the committee.

Data Availability Statement

Data are contained within the article.

Conflicts of Interest

The authors declare no conflicts of interest.

References

  1. Wade, D.; Diaw, P.A.; Daneau, G.; Camara, M.; Dieye, T.N.; Mboup, S.; Kestens, L. CD4 T-cell enumeration in a field setting: Evaluation of CyFlow counter using the CD4 easy count kit-dry and Pima CD4 systems. PLoS ONE 2013, 8, e75484. [Google Scholar] [CrossRef] [PubMed]
  2. Adan, A.; Alizada, G.; Kiraz, Y.; Baran, Y.; Nalbant, A. Flow cytometry: Basic principles and applications. Crit. Rev. Biotechnol. 2017, 37, 163–176. [Google Scholar] [CrossRef]
  3. Drescher, H.; Weiskirchen, S.; Weiskirchen, R. Flow cytometry: A blessing and a curse. Biomedicines 2021, 9, 1613. [Google Scholar] [CrossRef] [PubMed]
  4. Nolan, J.P. The evolution of spectral flow cytometry. Cytom. Part A 2022, 101, 812–817. [Google Scholar] [CrossRef]
  5. Fleisher, T.A.; Oliveira, J.B. Flow cytometry. In Clinical Immunology; Elsevier: Amsterdam, The Netherlands, 2019; pp. 1239–1251.e1. [Google Scholar]
  6. Lu, Y.K.; Liu, W.L.; Hu, Z.X. Progress in Standardization of Fluorescence Flow Cytometer. Laser Optoelectron. Prog. 2023, 60, 38–50. [Google Scholar]
  7. Wilkinson, M.G. Flow Cytometry in Microbiology; Wilkinson Department of Life Sciences, University of Limerick: Limerick, Ireland, 2015. [Google Scholar] [CrossRef]
  8. Lei, T.J.; Chen, W.; Chen, Z.C.; Tang, X.H.; Zhang, Z.H.; Tan, C.; Zhu, F.Y.; Liao, A.W.; Xiao, C.L.; Yin, S.M.; et al. Thermal Analysis and Design of Multichannel Flow Cytometry Laser Platform. Laser Optoelectron. Prog. 2024, 61, 326–334. [Google Scholar]
  9. Hu, Z.B.; Li, B.; Qu, S.F. Analysis to the Key Points of Quality Control for Flow Cytometry Detection Reagents. Chin. Pharm. Aff. 2021, 35, 1142–1148. [Google Scholar]
  10. Gonneau, C.; Wang, L.; Mitra-Kaushik, S.; Trampont, P.; Litwin, V. Progress towards global standardization for quantitative flow cytometry. Bioanalysis 2021, 13, 1591–1595. [Google Scholar] [CrossRef]
  11. Zhao, S.T.; Wu, X.D.; Wang, C.; Chen, Y.Q.; Tang, Y.G. Principles, applications and latest developments of flow cytometer. Progress. Mod. Biomed. 2011, 11, 4378–4381. [Google Scholar]
  12. Wang, S.; Tang, C.; Tao, M.; Qin, Q.; Zhang, C.; Luo, K.; Zhao, R.; Wang, J.; Ren, L.; Xiao, J.; et al. Establishment and application of distant hybridization technology in fish. Sci. China Life Sci. 2019, 62, 22–45. [Google Scholar] [CrossRef]
  13. Gala de Pablo, J.; Lindley, M.; Hiramatsu, K.; Goda, K. High-throughput Raman flow cytometry and beyond. Acc. Chem. Res. 2021, 54, 2132–2143. [Google Scholar] [CrossRef] [PubMed]
  14. Zhao, C.; Li, Y.; Ning, H.X.; Wang, T.; Yin, S. Review on genetic breeding progress of Bagridae family in China. J. Fish. China 2024, 48, 93–109. [Google Scholar]
  15. Yang, S.; Zeng, K.; Luo, L.; Qian, W.; Wang, Z.; Doležel, J.; Zhang, M.; Gao, X.; Deng, Z. A flow cytometry-based analysis to establish a cell cycle synchronization protocol for Saccharum spp. Sci. Rep. 2020, 10, 5016. [Google Scholar] [CrossRef]
  16. Feng, X.; Chen, H.; Xiao, B.; Wu, Q.; Zhang, J.; Zhang, N.; Li, P.; Wang, L.; Yin, J.; Sui, Z. Ploidy Identification by Flow Cytometry and Application of the Method to Characterize Seasonal Ploidy Variation of Wild Populations of the Red Alga Gracilariopsis lemaneiformis. Mar. Biotechnol. 2022, 24, 1073–1083. [Google Scholar] [CrossRef]
  17. Chen, H.; Feng, X.; Jiang, M.; Xiao, B.; Zhang, J.; Zhang, W.; Hu, Y.; Sui, Z. Estimating the ploidy of Gracilariopsis lemaneiformis at both the cellular and genomic level1. J. Phycol. 2020, 56, 1339–1348. [Google Scholar] [CrossRef] [PubMed]
  18. Iturri, L.; Coronilla, J.S.; Lallemand, Y.; Perdiguero, E.G. Identification of erythromyeloid progenitors and their progeny in the mouse embryo by flow cytometry. J. Vis. Exp. JoVE 2017, 125, 55305. [Google Scholar]
  19. Yu, Y.-R.A.; O’koren, E.G.; Hotten, D.F.; Kan, M.J.; Kopin, D.; Nelson, E.R.; Que, L.; Gunn, M.D. A protocol for the comprehensive flow cytometric analysis of immune cells in normal and inflamed murine non-lymphoid tissues. PLoS ONE 2016, 11, e0150606. [Google Scholar] [CrossRef]
  20. Doležel, J.; Lucretti, S.; Molnár, I.; Cápal, P.; Giorgi, D. Chromosome analysis and sorting. Cytom. Part A 2021, 99, 328–342. [Google Scholar] [CrossRef]
  21. Kanegane, H.; Hoshino, A.; Okano, T.; Yasumi, T.; Wada, T.; Takada, H.; Okada, S.; Yamashita, M.; Yeh, T.-W.; Nishikomori, R.; et al. Flow cytometry-based diagnosis of primary immunodeficiency diseases. Allergol. Int. 2018, 67, 43–54. [Google Scholar] [CrossRef]
  22. de Azambuja, A.P.; Mion, A.L.V.; Schluga, Y.C.; Beltrame, M.P.; Senegaglia, A.C.; Funke, V.A.M.; Bonfim, C.; Pasquini, R. Comprehensive Analysis of High-Sensitive Flow Cytometry and Molecular Mensurable Residual Disease in Philadelphia Chromosome-Positive Acute Leukemia. Int. J. Mol. Sci. 2025, 26, 2116. [Google Scholar] [CrossRef]
  23. Bonar, M.M.; Tilton, J.C. High sensitivity detection and sorting of infectious human immunodeficiency virus (HIV-1) particles by flow virometry. Virology 2017, 505, 80–90. [Google Scholar] [CrossRef] [PubMed]
  24. Ikoma-Colturato, M.R.V.; Bertolucci, C.M.; Conti-Spilari, J.E.; Oliveira, E.; Simioni, A.J.; Figueredo-Pontes, L.L.; Furtado, F.M.; Alegretti, A.P.; Azambuja, A.P.; Gevert, F.; et al. Multicentric standardization of minimal/measurable residual disease in B-cell precursor acute lymphoblastic leukaemia using next-generation flow cytometry in a low/middle-level income country. Br. J. Haematol. 2022, 200, 381. [Google Scholar] [CrossRef] [PubMed]
  25. Musich, T.; Jones, J.C.; Keele, B.F.; Jenkins, L.M.M.; Robert-Guroff, M. Flow virometric sorting and analysis of HIV quasispecies from plasma. JCI Insight 2017, 2, e90626. [Google Scholar] [CrossRef]
  26. Longin, C.; Petitgonnet, C.; Guilloux-Benatier, M.; Rousseaux, S.; Alexandre, H. Application of flow cytometry to wine microorganisms. Food Microbiol. 2017, 62, 221–231. [Google Scholar] [CrossRef]
  27. Zand, E.; Froehling, A.; Schoenher, C.; Zunabovic-Pichler, M.; Schlueter, O.; Jaeger, H. Potential of flow cytometric approaches for rapid microbial detection and characterization in the food industry—A review. Foods 2021, 10, 3112. [Google Scholar] [CrossRef]
  28. Serpaggi, V.; Remize, F.; Grand, A.S.; Alexandre, H. Specific identification and quantification of the spoilage microorganism Brettanomyces in wine by flow cytometry: A useful tool for winemakers. Cytom. Part A 2010, 77, 497–499. [Google Scholar] [CrossRef]
  29. Atanasova, M.; Yordanova, G.; Nenkova, R.; Ivanov, Y.; Godjevargova, T.; Dinev, D. Brewing yeast viability measured using a novel fluorescent dye and image cytometer. Biotechnol. Biotechnol. Equip. 2019, 33, 548–558. [Google Scholar] [CrossRef]
  30. Wang, Y.; Hammes, F.; De Roy, K.; Verstraete, W.; Boon, N. Past, present and future applications of flow cytometry in aquatic microbiology. Trends Biotechnol. 2010, 28, 416–424. [Google Scholar] [CrossRef] [PubMed]
  31. Almeida, A.C.; Gomes, T.; Habuda-Stanić, M.; Lomba, J.A.B.; Romić, Ž.; Turkalj, J.V.; Lillicrap, A. Characterization of multiple biomarker responses using flow cytometry to improve environmental hazard assessment with the green microalgae Raphidocelis subcapitata. Sci. Total environment 2019, 687, 827–838. [Google Scholar] [CrossRef]
  32. Wang, D.; Reyes, F.L.d.L.; Ducoste, J.J. Enhancing Microalgae Cell Inactivation Through Hydrodynamic Cavitation: Insights from Flow Cytometry Analysis. Water Res. 2025, 277. [Google Scholar] [CrossRef]
  33. Pulikkot, S.; Paul, S.; Hall, A.; Gardner, B.; Liu, W.; Hu, L.; Vella, A.T.; Chen, Y.; Fan, Z. Monitoring Circulating Myeloid Cells in Peritonitis with an In Vivo Imaging Flow Cytometer. Biomolecules 2024, 14, 886. [Google Scholar] [CrossRef] [PubMed]
  34. Linzke, M.; Yan, S.L.R.; Tárnok, A.; Ulrich, H.; Groves, M.R.; Wrenger, C. Live and let dye: Visualizing the cellular compartments of the malaria parasite Plasmodium falciparum. Cytom. Part A 2020, 97, 694–705. [Google Scholar] [CrossRef] [PubMed]
  35. Lal, J.; Vaishnav, A.; Singh, S.K.; Meena, D.K.; Biswas, P.; Mehta, N.K.; Priyadarshini, M.B. Biotechnological innovation in fish breeding: From marker assisted selection to genetic modification. Discov. Biotechnol. 2024, 1, 7–21. [Google Scholar] [CrossRef]
  36. Manohar, S.M.; Shah, P.; Nair, A. Flow cytometry: Principles, applications and recent advances. Bioanalysis 2022, 13, 185–202. [Google Scholar] [CrossRef]
  37. Zhang, X.; Liu, F.; Li, B.; Duan, L.; Yu, J.; Huang, Z.; Huang, S.; Liu, H.; Liu, Q.; Liu, S. Multi-omics reveals the molecular mechanisms of rapid growth in distant hybrid fish. Aquaculture 2025, 596, 741783. [Google Scholar] [CrossRef]
  38. Manan, H.; Hidayati, A.N.; Lyana, N.A.; Amin-Safwan, A.; Ma, H.; Kasan, N.A.; Ikhwanuddin, M. A review of gynogenesis manipulation in aquatic animals. Aquac. Fish. 2022, 7, 1–6. [Google Scholar] [CrossRef]
  39. Liu, Q.; Wang, S.; Tang, C.; Tao, M.; Zhang, C.; Zhou, Y.; Qin, Q.; Luo, K.; Wu, C.; Hu, F.; et al. The Research Advances in Distant Hybridization and Gynogenesis in Fish. Rev. Aquac. 2025, 17, e12972. [Google Scholar] [CrossRef]
  40. Liu, S.J.; Li, S.F.; Liu, Y. The Early Embryonic Development of Allotetraploid Hybrids of Red Crucian Carp (♀) × Common Carp (♂). J. Naturnal Sci. Hunan Norm. Univ. 2001, 24, 55–57. [Google Scholar]
  41. Xiao, J.; Kang, X.; Xie, L.; Qin, Q.; He, Z.; Hu, F.; Zhang, C.; Zhao, R.; Wang, J.; Luo, K.; et al. The fertility of the hybrid lineage derived from female Megalobrama amblycephala × male Culter alburnus. Anim. Reprod. Sci. 2014, 151, 61–70. [Google Scholar] [CrossRef]
  42. Liu, S.J.; Zhao, R.R.; Li, J.H.; Sun, Y.D.; Zhang, C.; Luo, K.K. Comparison of DNA content of blood cells and sperm among the different ploidy level fish. Acta Zool. Sin. 2005, 51, 360–364. [Google Scholar]
  43. Zhang, C.; Liu, S.J.; Wu, Y.H.; Liu, J. DNA contents and cytological analyses of oogenesis of the dipoid gynogenetic progeny of allotetraploid hybrids. J. Fish. China 2015, 39, 1–7. [Google Scholar]
  44. He, W.; Sun, Y.; Qiang, J.; Luo, X.; Zhang, H.; Yang, C.; Luo, K.; Zhao, R.; Qin, Q.; Zhang, C.; et al. Structural Abnormalities of Spermatozoa in Triploid Gynogenetic Crucian Carp (Carassius auratus). Front. Genet. 2021, 12, 783014. [Google Scholar] [CrossRef] [PubMed]
  45. Li, J.Z.; Liu, S.J.; Zhang, X.J.; Feng, H.; Liu, Y. Studies on the ploymorphic of sperm of F2 Hybrids of Red Crucian Carp × Common Carp. Acta Biol. Exp. Sin. 2004, 37, 276–282. [Google Scholar]
  46. Gao, R.C.; Wu, L.Y. The Application of Flow Cytometry in Aquatic Animal Research. Anhui Agric. Sci. Bull. 2010, 16, 15–17+23. [Google Scholar]
  47. Mgwatyu, Y.; Stander, A.A.; Ferreira, S.; Williams, W.; Hesse, U. Rooibos (Aspalathus linearis) genome size estimation using flow cytometry and k-mer analyses. Plants 2020, 9, 270. [Google Scholar] [CrossRef]
  48. Wu, Y.Q.; Chang, R.F.; Cheng, H.H. The Principle and Method of Ploidy Analysis by Flow Cytometr. J. Yunnan Agric. Univ. 2006, 407–409+414. [Google Scholar]
  49. Andrew, W. Duncan, Aneuploidy, polyploidy and ploidy reversal in the liver. Semin. Cell Dev. Biol. 2013, 24, 347–356. [Google Scholar]
  50. Zhang, H.; Luo, M.; Tai, Y.; Li, M.; Cui, J.; Gao, X.; Ren, L.; Liu, S. mtDNA copy number contributes to growth diversity in allopolyploid fish. Reprod. Breed. 2024, 4, 55–60. [Google Scholar] [CrossRef]
  51. Wu, L.; Li, L.; Gao, A.; Ye, J.; Li, J. Antimicrobial roles of phagocytosis in teleost fish: Phagocytic B cells vs professional phagocytes. Aquac. Fish. 2024, 9, 105–114. [Google Scholar] [CrossRef]
  52. Liu, S.; Sun, Y.; Zhang, C.; Luo, K.; Liu, Y. Production of gynogenetic progeny from allotetraploid hybrids red crucian carp × common carp. Aquaculture 2004, 236, 193–200. [Google Scholar] [CrossRef]
  53. Yang, H.X.; Zhang, J.; Pan, H.J. Feasibility of flow cytometry experiments based on fin. South China Fish. Sci. 2017, 13, 121–127. [Google Scholar]
  54. Geng, B.; Sun, X.W. The application of Flow cytometry on the DNA content and ploidy analysis of hydrophily organisms. Chin. J. Fish. 2008, 21, 21–24. [Google Scholar]
  55. Krasznai, Z.; Goda, K. Can flow cytometric DNA content analysis become a routine procedure in aquaculture? Cytom. Part A 2021, 99, 668–670. [Google Scholar] [CrossRef]
  56. Gong, R.; Zhang, J.; Dan, C.; Gui, G.J.; Mei, M.L. Identification of pelteobagrus fulvidraco, pelteobaggrus vachelli and their interspecific hybrid by dna markers. Acta Hydrobiol. Sin. 2017, 41, 321–325. [Google Scholar]
  57. Gui, J.F.; Bao, Z.M.; Zhang, X.J. Development Strategy for Aquaculture Genetic Breeding and Seed Industry. Eng. Sci. China 2016, 18, 8–14. [Google Scholar]
  58. Lin, M.J. Detection technology research of ploidy on live abalone. J. Fish. Res. 2012, 34, 225–230. [Google Scholar]
  59. Jia, C.; Meng, Q.; Chen, S.; Sun, R.; Xu, D.; Zhu, F.; Gao, B.; Zhao, J.; Shen, H. Construction of the first high-density genetic linkage map and QTL mapping for growth traits in black seabream (Acanthopagrus schlegelii). Aquaculture 2025, 595, 741588. [Google Scholar] [CrossRef]
Figure 1. FCM determination of the DNA content in the embryos, fry, and blood cells of 3nDTCC: (a) embryo cells; (b) fry cells; (c) blood cells of adult fish.
Fishes 10 00227 g001
Figure 2. Detection of the DNA content in the sperm of fish with different ploidies: (a) blood cells of RCC; (b) sperm of diploid RCC; (c) sperm of 3nDTCC; (d) sperm of 4nAT.
Fishes 10 00227 g002
Figure 3. Detection of the DNA content in the caudal fin tissue cells of fish with different ploidies: (a) blood cells of RCC; (b) caudal fin cells of RCC; (c) caudal fin cells of 3nDTCC; (d) caudal fin cells of 4nAT.
Fishes 10 00227 g003
Figure 4. Detection of DNA content in the ovarian and testicular tissue cells of JLF1: (a) blood cells of RCC; (b) ovary cells of JLF1; (c) testis cells of JLF1.
Fishes 10 00227 g004
Figure 5. DNA content of diploid RCC tissue cells: (a) blood cells of RCC; (b) gill tissue cells of RCC; (c) spleen tissues of RCC; (d) liver tissue cells of RCC.
Fishes 10 00227 g005
Table 1. Specific values of DNA content in the semen of fish with different ploidy levels.
Different SampleMean DNA ContentCV%
Blood cells of RCC108.99/208.583.44/8.51
The sperm of diploid RCC51.30/101.824.19/6.34
The sperm of 3nDTCC82.35/160.9112.45/12.27
The sperm of 4nAT90.01/184.29/269.932.42/4.48/8.61
Table 2. Specific values of DNA content detected in the caudal fin tissue cells of fish with different ploidy levels.
Different SampleMean DNA ContentCV%
Blood cells of RCC96.593.88
The caudal fin cells of RCC103.287.02
The caudal fin cells of 3nDTCC153.169.63
The caudal fin cells of 4nAT178.6217.22
CV = σ/μ, which reflects the degree of dispersion per unit of the mean value and is often used for comparing the degrees of dispersion when the means of two populations are not equal. If the means of the two populations are equal, then comparing the coefficient of variation is equivalent to comparing the standard deviation.
Table 3. Specific values of DNA content detected in the ovarian and testicular tissues of the diploid crucian carp–carp F1 hybrid.
Different SampleMean DNA ContentCV%
The blood cells of RCC102.675.60
The ovary cells of JLF1107.684.41
The testis cells of JLF1104.98/208.995.95/7.06
Table 4. Specific values of DNA content in various tissues of diploid red crucian carp.
Different SampleMean DNA ContentCV%
The blood cells of RCC100.99/197.912.72/3.66
The gill tissues of RCC92.77/181.583.50/4.54
The spleen tissues of RCC50.28/99.73/197.133.48/3.26/4.19
The liver tissues of RCC46.37/97.60/206.493.77/2.82/5.93
Table 5. Distribution of DNA content in different tissue cells of RCC.
Different TissuesMean DNA ContentExperimental Ratio (Tissues/Blood)Expected Ratio
Blood100.99
Gill92.770.91 *1 *
Spleen99.730.98 *1 *
Liver46.370.45 *0.5 *
97.600.96 *1 *
* There was no significant difference between the experimental ratio and the expected ratio (p > 0.05).
Disclaimer/Publisher’s Note: The statements, opinions and data contained in all publications are solely those of the individual author(s) and contributor(s) and not of MDPI and/or the editor(s). MDPI and/or the editor(s) disclaim responsibility for any injury to people or property resulting from any ideas, methods, instructions or products referred to in the content.

