Abstract
In this study, we developed a novel SERS-active magnetic substrate (MBs@CS@AuNPs) for detecting malachite green (MG) in aquatic products, including shrimp, cod, and aquaculture water. The substrate combines chitosan-functionalized magnetic nanobeads with dense gold nanoparticles. It efficiently enriches MG through electrostatic and π–π interactions, generates high-density plasmonic hotspots for stable signals, and utilizes a superparamagnetic core to concentrate MG molecules. This design achieved an ultralow detection limit of 10−9 M for MG in aquaculture samples, with a linear range spanning from 10−3 to 10−10 M (R2 = 0.999). The substrate demonstrated superior performance in untreated, complex food matrices (e.g., shrimp, cod), outperforming conventional magnetic mass spectrometry systems that are prone to matrix interference. This work introduces an innovative approach for detecting harmful residues in food during environmental safety monitoring.
Keywords:
food detection; gold–magnetic materials; malachite green; surface-enhanced Raman scattering Key Contribution:
This study synthesized an optimized MBs@CS@AuNPs SERS substrate, enhancing signal intensity and uniformity. It enables sensitive, selective detection of malachite green in aquatic products.
1. Introduction
Malachite green (MG, C23H25ClN2) is a cationic triphenylmethane dye [1], which is commonly used in the printing and dyeing industry because of its excellent anti-parasitic and bactericidal properties. It is highly alluring in aquaculture, because it can be used as a fungicide, preservative, insecticide, and antibacterial agent. However, as MG enters the cells, it can easily interact with the negatively charged surfaces of cell membranes and accumulate in the cytoplasm, which is carcinogenic and mutagenic to humans [2]. Thus, it is strictly prohibited in aquaculture in most countries [3]. However, its illegal application still persists, prompting various detecting methods developments for MG. For example, colloidal gold immunochromatography [4], fluorescence spectroscopy [5], high-performance liquid chromatography (HPLC) [6], and electrochemical aptamer sensing [7] have been successfully used to detect the MG. However, these methods typically require expensive equipment, a long time, and complex procedures. Therefore, it is of significant interest to establish a simple and rapid method for detecting MG to guarantee the quality of aquatic products.
Surface-enhanced Raman spectroscopy (SERS) has gained extensive attention and widespread application in the detection of illegal additives due to its exceptional sensitivity [8]. The enhancement observed in SERS primarily originates from two mechanisms, namely local electromagnetic enhancement and chemical enhancement [9], with both driven by the surface plasmon resonance of noble metal nanoparticles, such as gold (Au) and silver (Ag) colloids. A key advancement in SERS research lies in its capability for single-molecule detection, achieved by precisely tuning the size, shape, and interparticle gaps of nanoparticles to generate intense “hotpots”. This capability is enabled by the remarkably high enhancement factor (EF) of SERS, which can reach up to 108–1015 orders of magnitude greater than traditional Raman spectroscopy. Such ultrahigh sensitivity not only underscores the feasibility of single-molecule detection but also drives the development of SERS-active substrates with tunable plasmonic properties, a major focus of current research in the field. Recently, various kinds of substrates have been successfully evolved from simple nanomaterials—such as nanoparticles [10], nanorods [11], nanowires [12], and nanostars [13]—to more complex structures designed to achieve superior SERS activity. Among them, gold nanoparticles can effectively enhance surface-enhanced Raman scattering (SERS) signals. The surface of gold nanoparticles exhibits a localized electric field enhancement effect, which significantly increases the Raman scattering signals of nearby molecules, such as target analytes. Particularly near the “surface plasmon resonance” (SPR) frequency of the gold nanoparticles, the electron cloud of the particles undergoes collective oscillation upon light irradiation, thereby amplifying the local electromagnetic field and significantly enhancing the scattering signal. As a result, prepared composite nanoparticles have increasingly attracted lots of attention from researchers for their high potential applications in SERS [14].
Core–shell nanostructures, as a type of composite material, exhibit novel properties in areas, such as electronics, magnetism, optics, thermal conductivity, and catalysis, compared to their single-component counterparts [15]. These enhanced functional properties can be achieved by simply adjusting the size, chemical composition, or structural order of the nanoparticles, Theoretically, the super-paramagnetic core–metal shell nanostructures not only improve the stability of magnetic particles in solution but also facilitate the formation of bio-coordination bonds on the particle surface [16]. Moreover, this special nanomaterial could be obtained through seed growth, microemulsion, and self-assembly techniques. Among them, MBs can be magnetically concentrated by applying an external magnetic field, resulting in numerous nano-scale gaps, which are known as “resonant cavity” structures [17]. These structures could provide an excellent foundation for assembling AuNPs on their surface. In this context, the design and application of gold–magnetic nanoparticles become particularly significant. The unique advantages of this structure allow it to demonstrate vast potential in various fields, including sensors, drug delivery, and bio-imaging. By properly controlling the size and surface modification of AuNPs, their affinity and selectivity for target molecules can be further enhanced. Moreover, the application of gold–magnetic nanoparticles in SERS detection enables high-sensitivity detection even at extremely low concentrations, thus meeting the demands for high-performance detection platforms in biomedical and environmental monitoring [18].
Therefore, the prepared Fe3O4 coating with AuNPs to form gold–magnetic nanocomposites as SERS substrates allows for dual benefits, as the AuNPs serve as highly active SERS substrates for molecule adsorption [19], as well as showing magnetic properties that could enable the concentration of the nanocomposites under an external magnetic field [20]. Thus, this approach significantly enhances the sensitivity of SERS detection by increasing the local concentration of the target molecules [21]. Consequently, gold–magnetic materials broaden the application of magnetic materials in such fields as biological separation [22], biosensing [23], targeted delivery [24], and bioimaging [25]. Additionally, the core–shell structured gold–magnetic nanoparticles show promising applications in food safety testing.
In our study, Fe3O4-based magnetic beads coated with AuNPs (MBs@CS@AuNPs) were prepared as SERS-active substrates for ultrasensitive MG detection. The integration of magnetic separation with SERS detection enables analyte enrichment and enhanced sensitivity, offering substantial potential for the rapid and sensitive monitoring of aquatic products.
Recent studies have increasingly linked aquatic pollution to complex ecological and health risks. For instance, microplastic pollution has been shown to alter fish behavior and physiology, potentially exacerbating susceptibility to chemical and biological stressors. Additionally, heavy metal contamination has been correlated with genotoxic and cytotoxic effects in aquatic organisms [26], while MG’s antimicrobial properties raise concerns over resistance development among aquatic pathogens. Therefore, the detection of MG residues is not only critical from a food safety perspective but also integral to understanding broader environmental and public health implications.
Moreover, considering the frequent occurrence of environmental contaminants, such as microplastics and heavy metals in aquaculture systems, the choice of aquaculture water, shrimp, and cod as experimental matrices is highly relevant. Shrimp and cod are among the most widely consumed seafood species and are vulnerable to environmental pollutants, including dyes, like MG, as well as microplastic-induced behavioral toxicity [27], heavy metal accumulation [28], and parasitic infections [29]. Furthermore, MG has been historically used to combat fungal and bacterial infections in aquaculture species [30], thus emphasizing the importance of detecting residual MG in such matrices to safeguard both consumer health and ecological balance.
In this context, the development of sensitive and selective SERS-based detection methods aligns with urgent needs in both food quality control and environmental monitoring.
2. Materials and Methods
2.1. Reagents
Analytical grade tetrachloroauric acid was purchased from Sigma Aldrich (Shanghai, China) Trading Co., Ltd. Tri-sodium citrate and 1-(3-dimethylaminopropyl)-3-ethylcarbodiimide hydrochloride (EDC) were purchased from Shanghai Titan Technology Co., Ltd. (Shanghai, China). Super-paramagnetic nanoparticles were purchased from Shanghai Orun Micro Nano Technology Co., Ltd. (Shanghai, China). Tween-20 and 2-Morpholinoethanesulphonic acid (MES) were purchased from Shanghai Aladdin Biochemical Technology Co., Ltd. (Shanghai, China). Chitosan (CS) was purchased from Zesheng Technology Co., Ltd. (Dongguan, China). Analytical grade methyl blue was purchased from Tianjin Huasheng Chemical Reagent Co., Ltd. (Tianjin, China). Methylene blue was purchased from Shanghai Sanshis Reagent Co., Ltd. (Shanghai, China). Copper sulfate was purchased from National Medicines Chemical Reagents Co., Ltd. (Beijing, China). Zinc sulfate was purchased from National Medicines Chemical Reagents Co., Ltd. (Beijing, China). Ferrous sulfate was purchased from Tianjin Ruijintet Chemicals Co., Ltd. (Tianjin, China). Potassium permanganate was purchased from Huaxu Biotechnology Co., Ltd. (Zhengzhou, China). Malachite Green was purchased from Shanghai Maclin Biochemical Technology Co., Ltd. (Shanghai, China). Silver colloidal was purchased from Qingdao Lican District Qinke Nano New Materials Technology Center, Qingdao, China. The aquaculture water samples were obtained from the pilot codfish farm in Ningbo University (Ningbo, China). South American white shrimp samples and cod samples were purchased from a local market (Ningbo, China).
2.2. Instrumentation
In this study, UV–Vis spectra were recorded using a UV spectrometer (UV–Vis, TU 1810, Beijing Puxitongyong Instrument Co., Ltd., Beijing, China). A Fourier transform infrared spectrometer (FT/IR-4700, JASCO Corporation, Tokyo, Japan) and transmission electron microscope (TEM-HT7700, Hitachi, Tokyo, Japan) were also used. Raman spectroscopy was performed using a HORIBA JOBIN YVON Raman spectrometer (HORIBA, HORIBA JOBIN YVON S.A.S., Paris, France) equipped with a 785 nm excitation laser. Magnetic separation was carried out using a 24-well magnetic rack purchased from Beijing Qiyansci Biotechnology Co., Ltd. (Beijing, China).
2.3. Raman Substrate Preparation
2.3.1. Activation of Carboxylated Beads
Briefly, 10 μL of 10 mg/mL MBs were added to a 2 mL capacity glass bottle and then washed with 500 μL MEST buffer (pH 6.0, 10 mM MES with 0.05% Tween-20) through magnetic separation using the external magnetic stand for 2 min. After decanting the supernatant, the MBs were resuspended in 500 μL of MEST buffer, vortexed thoroughly, and subjected to another 2 min magnetic separation using the magnetic stand. The supernatant was removed again, and the obtained activated carboxylated MBs were collected for further experiments.
2.3.2. Preparation of MBs@CS
We added 10 μL of the activated MB solution to 1 mL of 0.4% chitosan (CS) solution and incubated the solution for 30 min on a rotary mixer at room temperature (RT). We then added 2 mg/mL EDC and continued the incubation for another 30 min to obtain MBs@CS. We washed the solution thoroughly three times with deionized water, then stored it at 4 °C for later use.
2.3.3. Preparation of MBs@CS@AuNPs
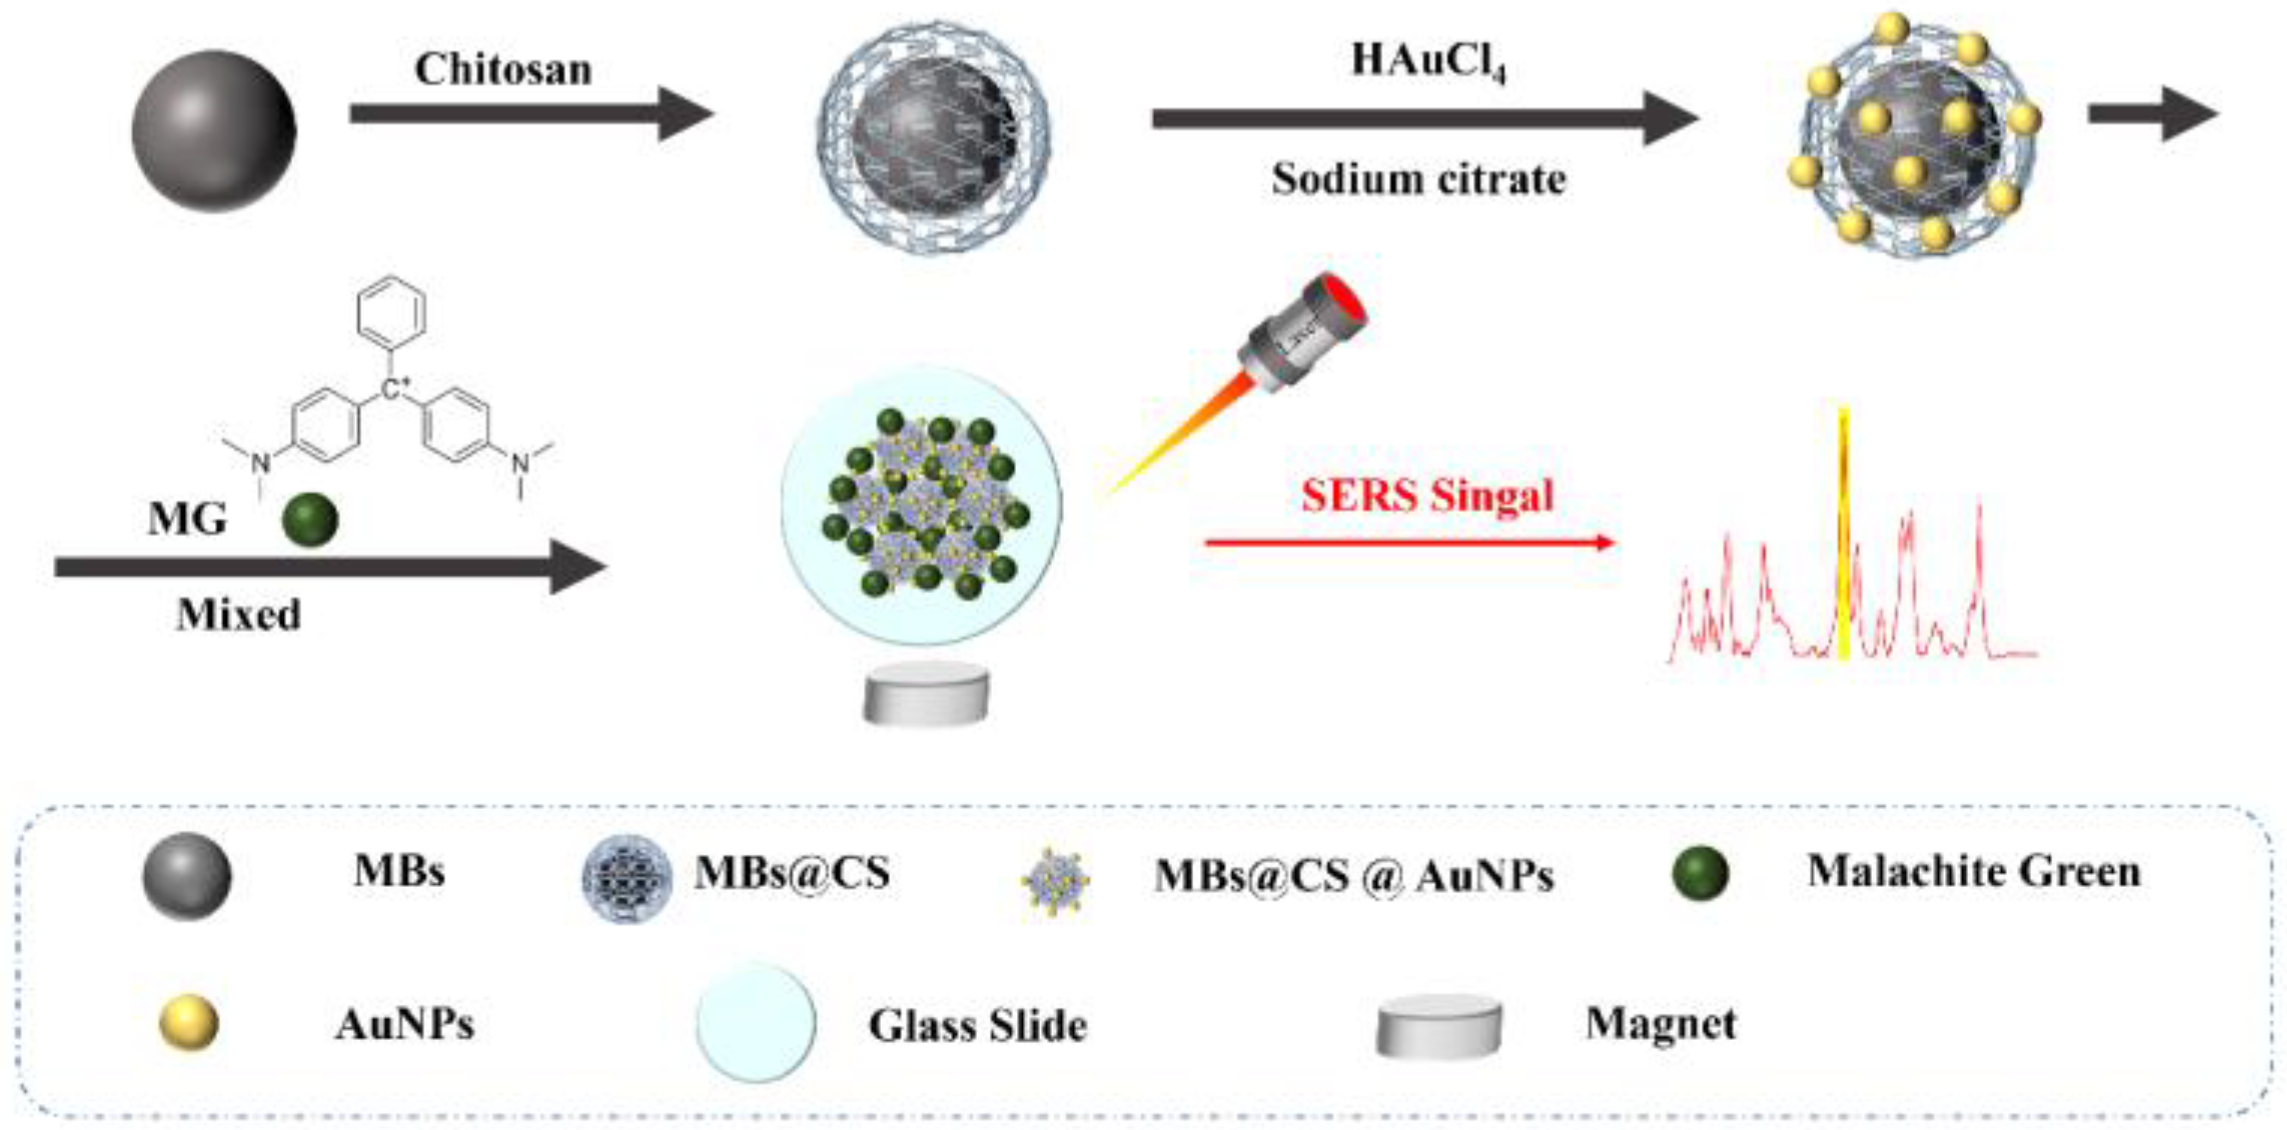
The schematic diagram for preparing the MBs@CS@AuNPs was shown in Figure 1. The MBs@CS were resuspended in 200 μL of ultrapure water, followed by the addition of 200 μL of growth solution (20 μL of 5% HAuCl₄ and 180 μL of 38.8 mM sodium citrate). Then, the mixture was reacted on the rotary mixer for 1 h. Then, the obtained MBs@CS@AuNPs were washed twice with deionized water under an external magnetic field to remove any residual citrate, chloroauric acid, and unbound AuNPs. Then, the MBs@CS@AuNPs were resuspended in ultrapure water and stored at 4 °C until use.
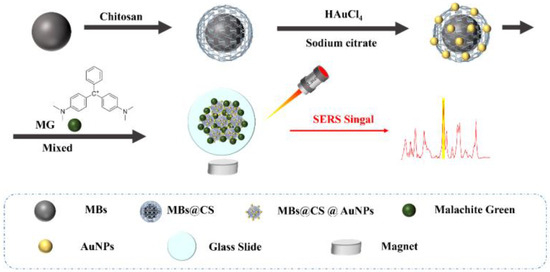
Figure 1.
Schematic diagram of the principle of the SERS substrate based on MBs@CS@AuNPs for detecting MG in aquatic products.
2.4. Samples Pretreatment
The water samples were filtered through a 0.22 µm membrane to remove large particles (such as mud and sand) before SERS testing. This filtration step is crucial for minimizing matrix effects, as large particulate matters can interfere with SERS signal acquisition and lead to inconsistent results. As reported in the literature, the presence of such particles can cause light scattering and absorption, distorting the SERS spectra. Additionally, these particles may adsorb or interact with the target analyte, affecting the recovery rate. By removing them through filtration, the sample matrix becomes more homogeneous, reducing the variability in SERS responses [31].
According to previously reported literature [32], 10 g of shelled South American white shrimp flesh samples were added to 90 mL of buffered peptone solution, homogenized for 1 min using a high-speed homogenizer. Homogenization is essential for ensuring that the sample is well-mixed and that the analyte is uniformly distributed, which helps to reduce matrix-related biases in the subsequent analysis. This step also increases the surface area available for extraction, potentially improving the extraction efficiency and recovery consistency. Following homogenization, the mixture was left to stand for 30 min to remove the precipitate, and the supernatant was filtered through a 0.45 µm filter membrane. This filtration step further purifies the sample by removing any remaining insoluble substances that could interfere with the analysis. As demonstrated in [33], proper filtration can significantly enhance the accuracy and reproducibility of analytical results by reducing matrix-induced signal fluctuations.
Cod samples were pretreated according to the national standard (GB/T 19857-2005) with some modifications. Firstly, codfish skin and bones were removed and then stirred to form flesh surimi. Then, 50 mL of acetonitrile was added to the 10 g prepared sample, and the mixture was extracted ultrasonically for 5 min. Then, the sample was shaken for 1 min using a vortex mixer, following by centrifugation at 9500 rpm for 5 min, and, finally the supernatant was transferred to another centrifuge tube. The residue was mashed to repeat the above operation. The two extracts were mixed together and evaporated by rotary evaporation at 40 °C until only the non-evaporated liquid remained. Finally, the residual solution was dissolved in 250 mL of deionized water and filtered through a 0.22 μm organic filter membrane. This modified protocol ensures efficient extraction and reduces matrix effects, which is crucial for accurate SERS detection.
The treated aquaculture water, South American white shrimp, and cod were stored at 4 °C. Afterwards, different concentrations of MG (10−2 to 10−10 M) were added to the prepared samples, and the solutions were mixed well for further experiments.
2.5. SERS Signal Collection
The schematic diagram of the MBs@CS@AuNP-generating Raman hot spot is shown in Figure 1. Here, 10 µL of the nanomaterials (MBs, MBs@CS, and MBs@CS@AuNPs) and MG solution were incubated together for 30 min. After incubation, the nanomaterials were subjected to an external magnetic field to induce aggregation and subsequently dried. The laser wavelength used was 785 nm, and Raman scattering signals were collected using a 50× objective lens with a relatively long working distance. The laser power for sample excitation was set at 10 mW, with an integration time of 30 s for each SERS spectrum. The measurement was conducted by randomly selecting three points on a silicon wafer and detecting the spectral region from 800 to 1800 cm−1. The Raman intensity was measured at the wavelength of 1172 cm−1. For the analysis of real samples, 10 μL of the sample was taken, and the detection procedure followed the same steps as described above.
3. Results and Discussion
3.1. Morphological and Structural Characterization
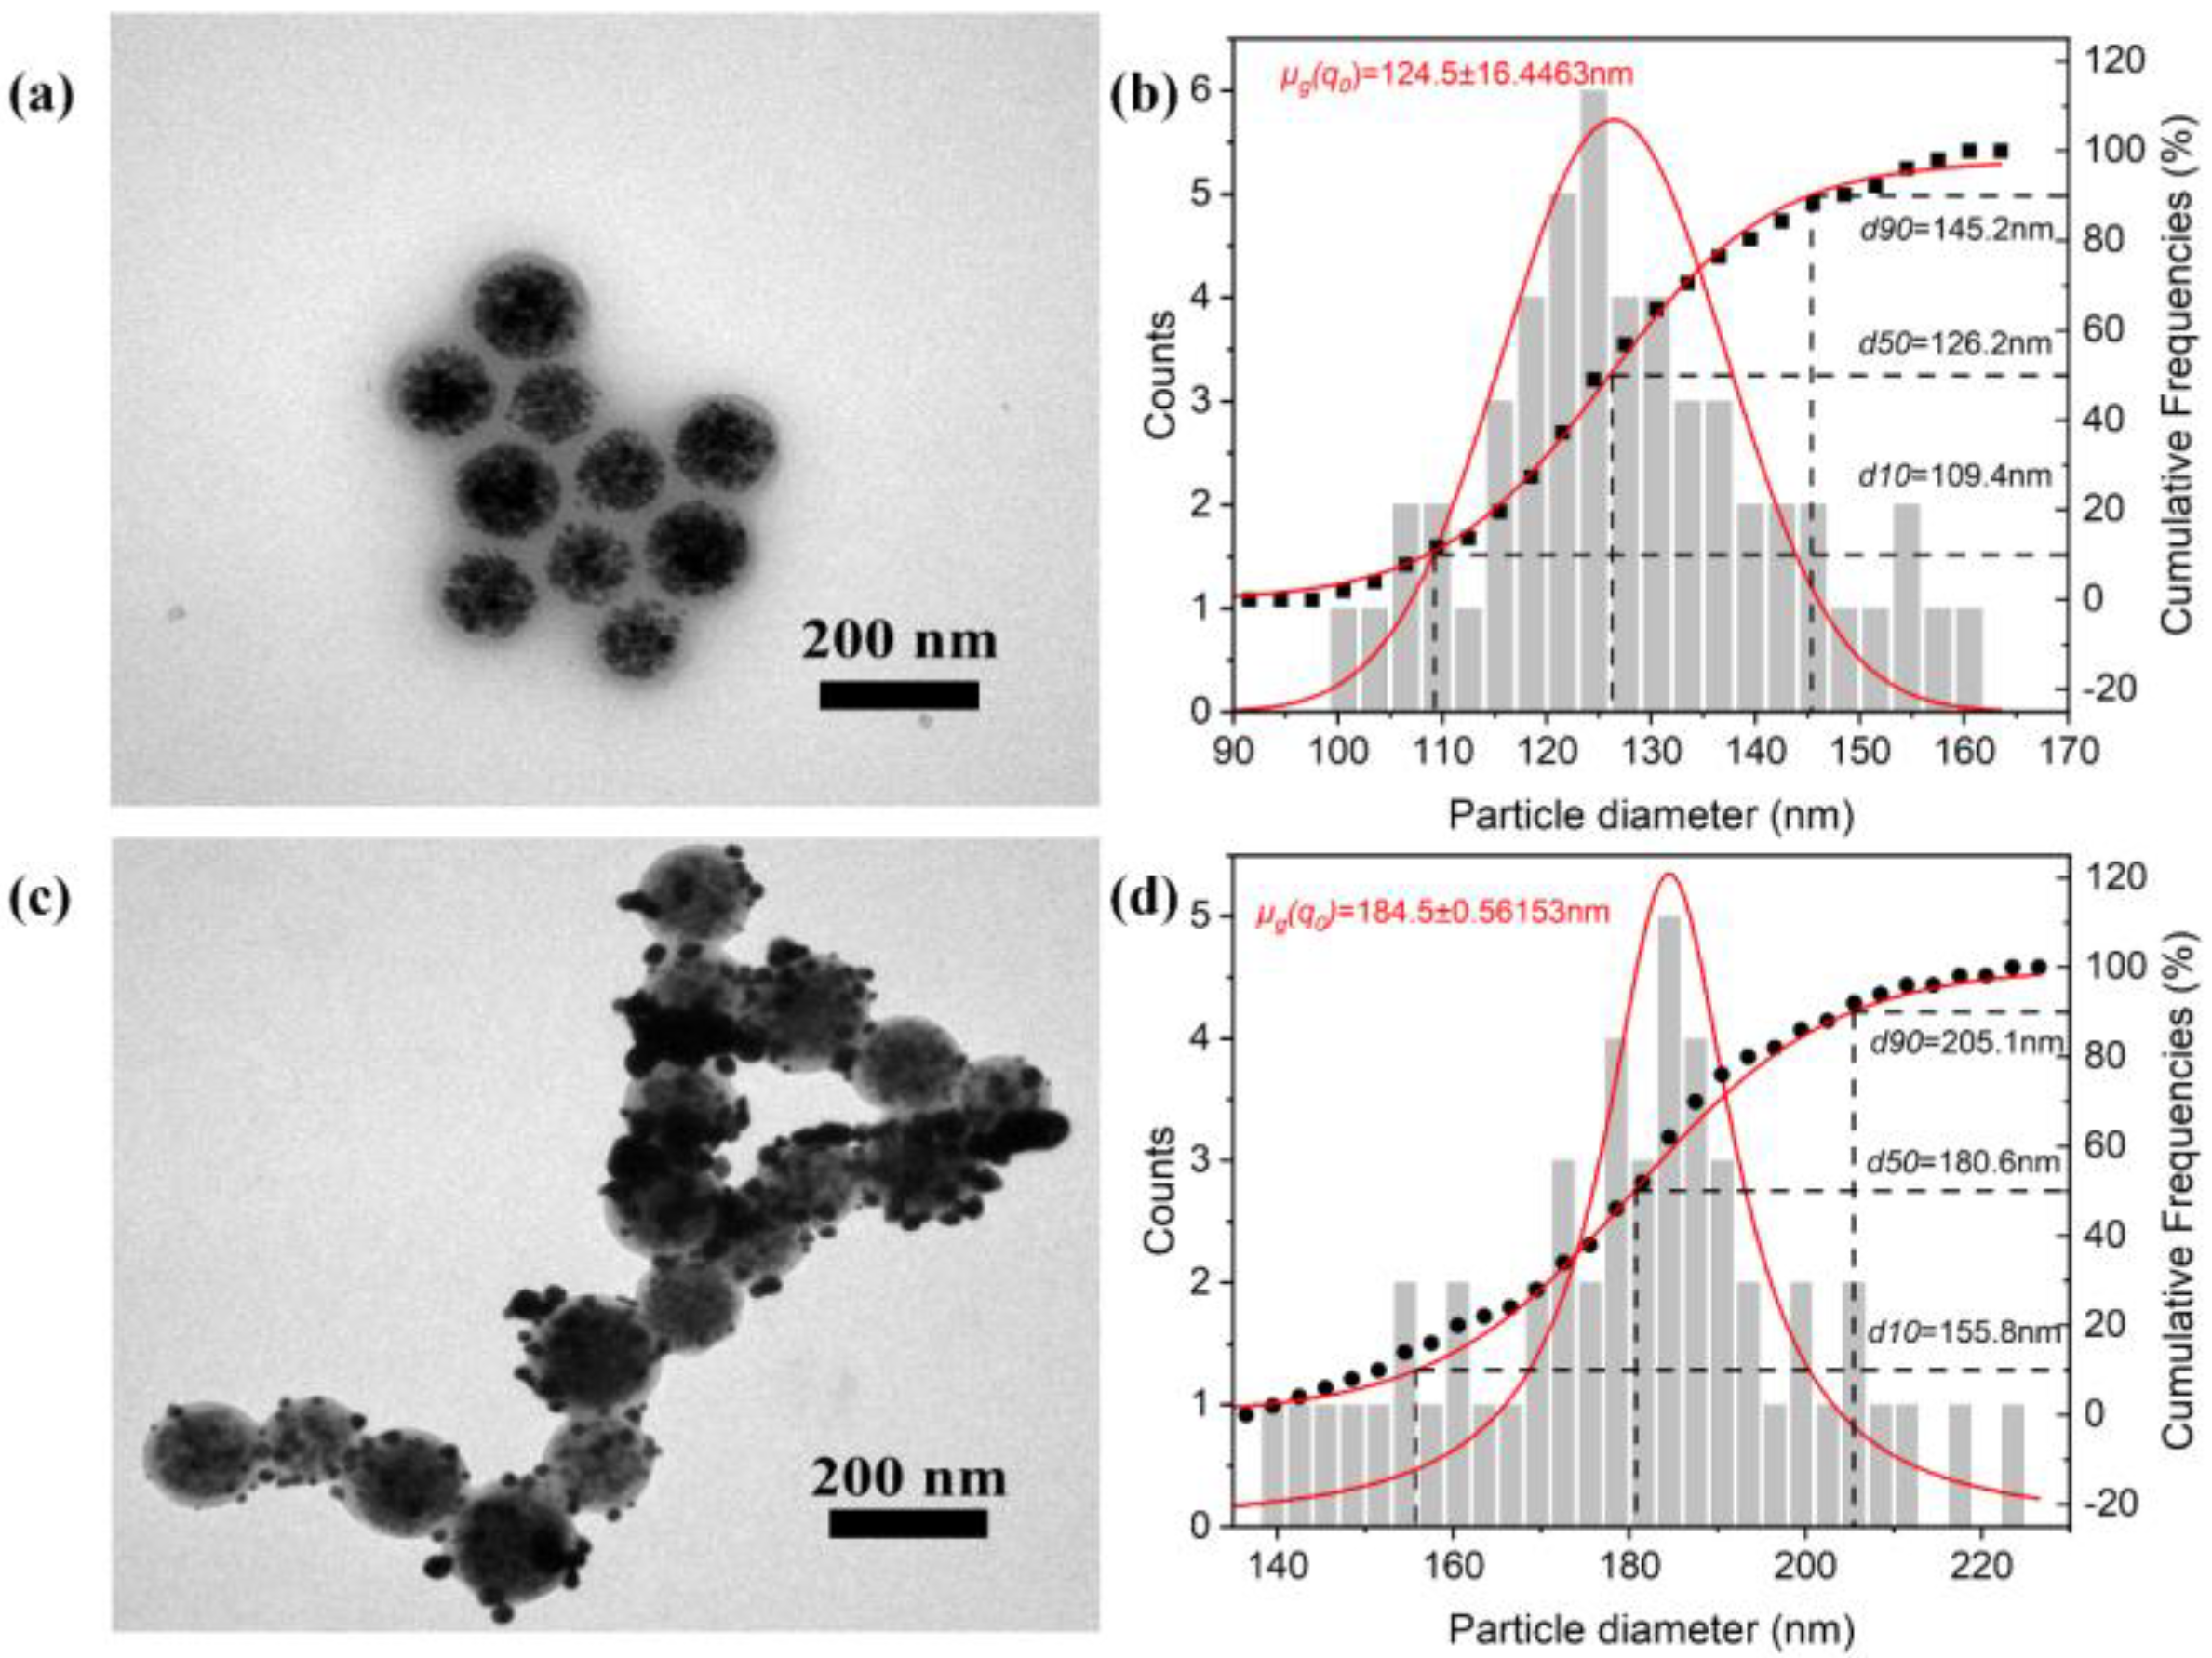
Transmission electron microscopy (TEM) images of the MBs@CS and MBs@CS@AuNPs are shown in Figure 2. The diameters of the nanoparticles were measured and analyzed using ImageJ (x64) software [34], with the size distribution histograms presented in Figure 2b,d. The geometric mean diameter ± standard deviation for MB nanoparticles is 124.50 ± 16.45 nm. Although some unavoidable particle aggregation was observed during the drying process, the images still reveal a nearly spherical geometric shape. Figure 2c shows that numerous irregular and uneven AuNPs are modified on the surface of MBs. It is also noteworthy that the MBs@CS@AuNPs exhibit a very uniform size distribution, with a geometric mean diameter of 184.5 ± 0.56 nm.
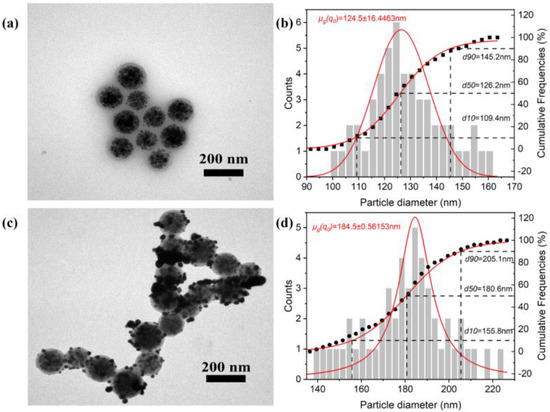
Figure 2.
(a,c) show the morphologies of MBs and MBs@CS@AuNPs, respectively. (b,d) present the size distribution histograms of MBs and MBs@CS@AuNPs, respectively, highlighting their size distribution characteristics.
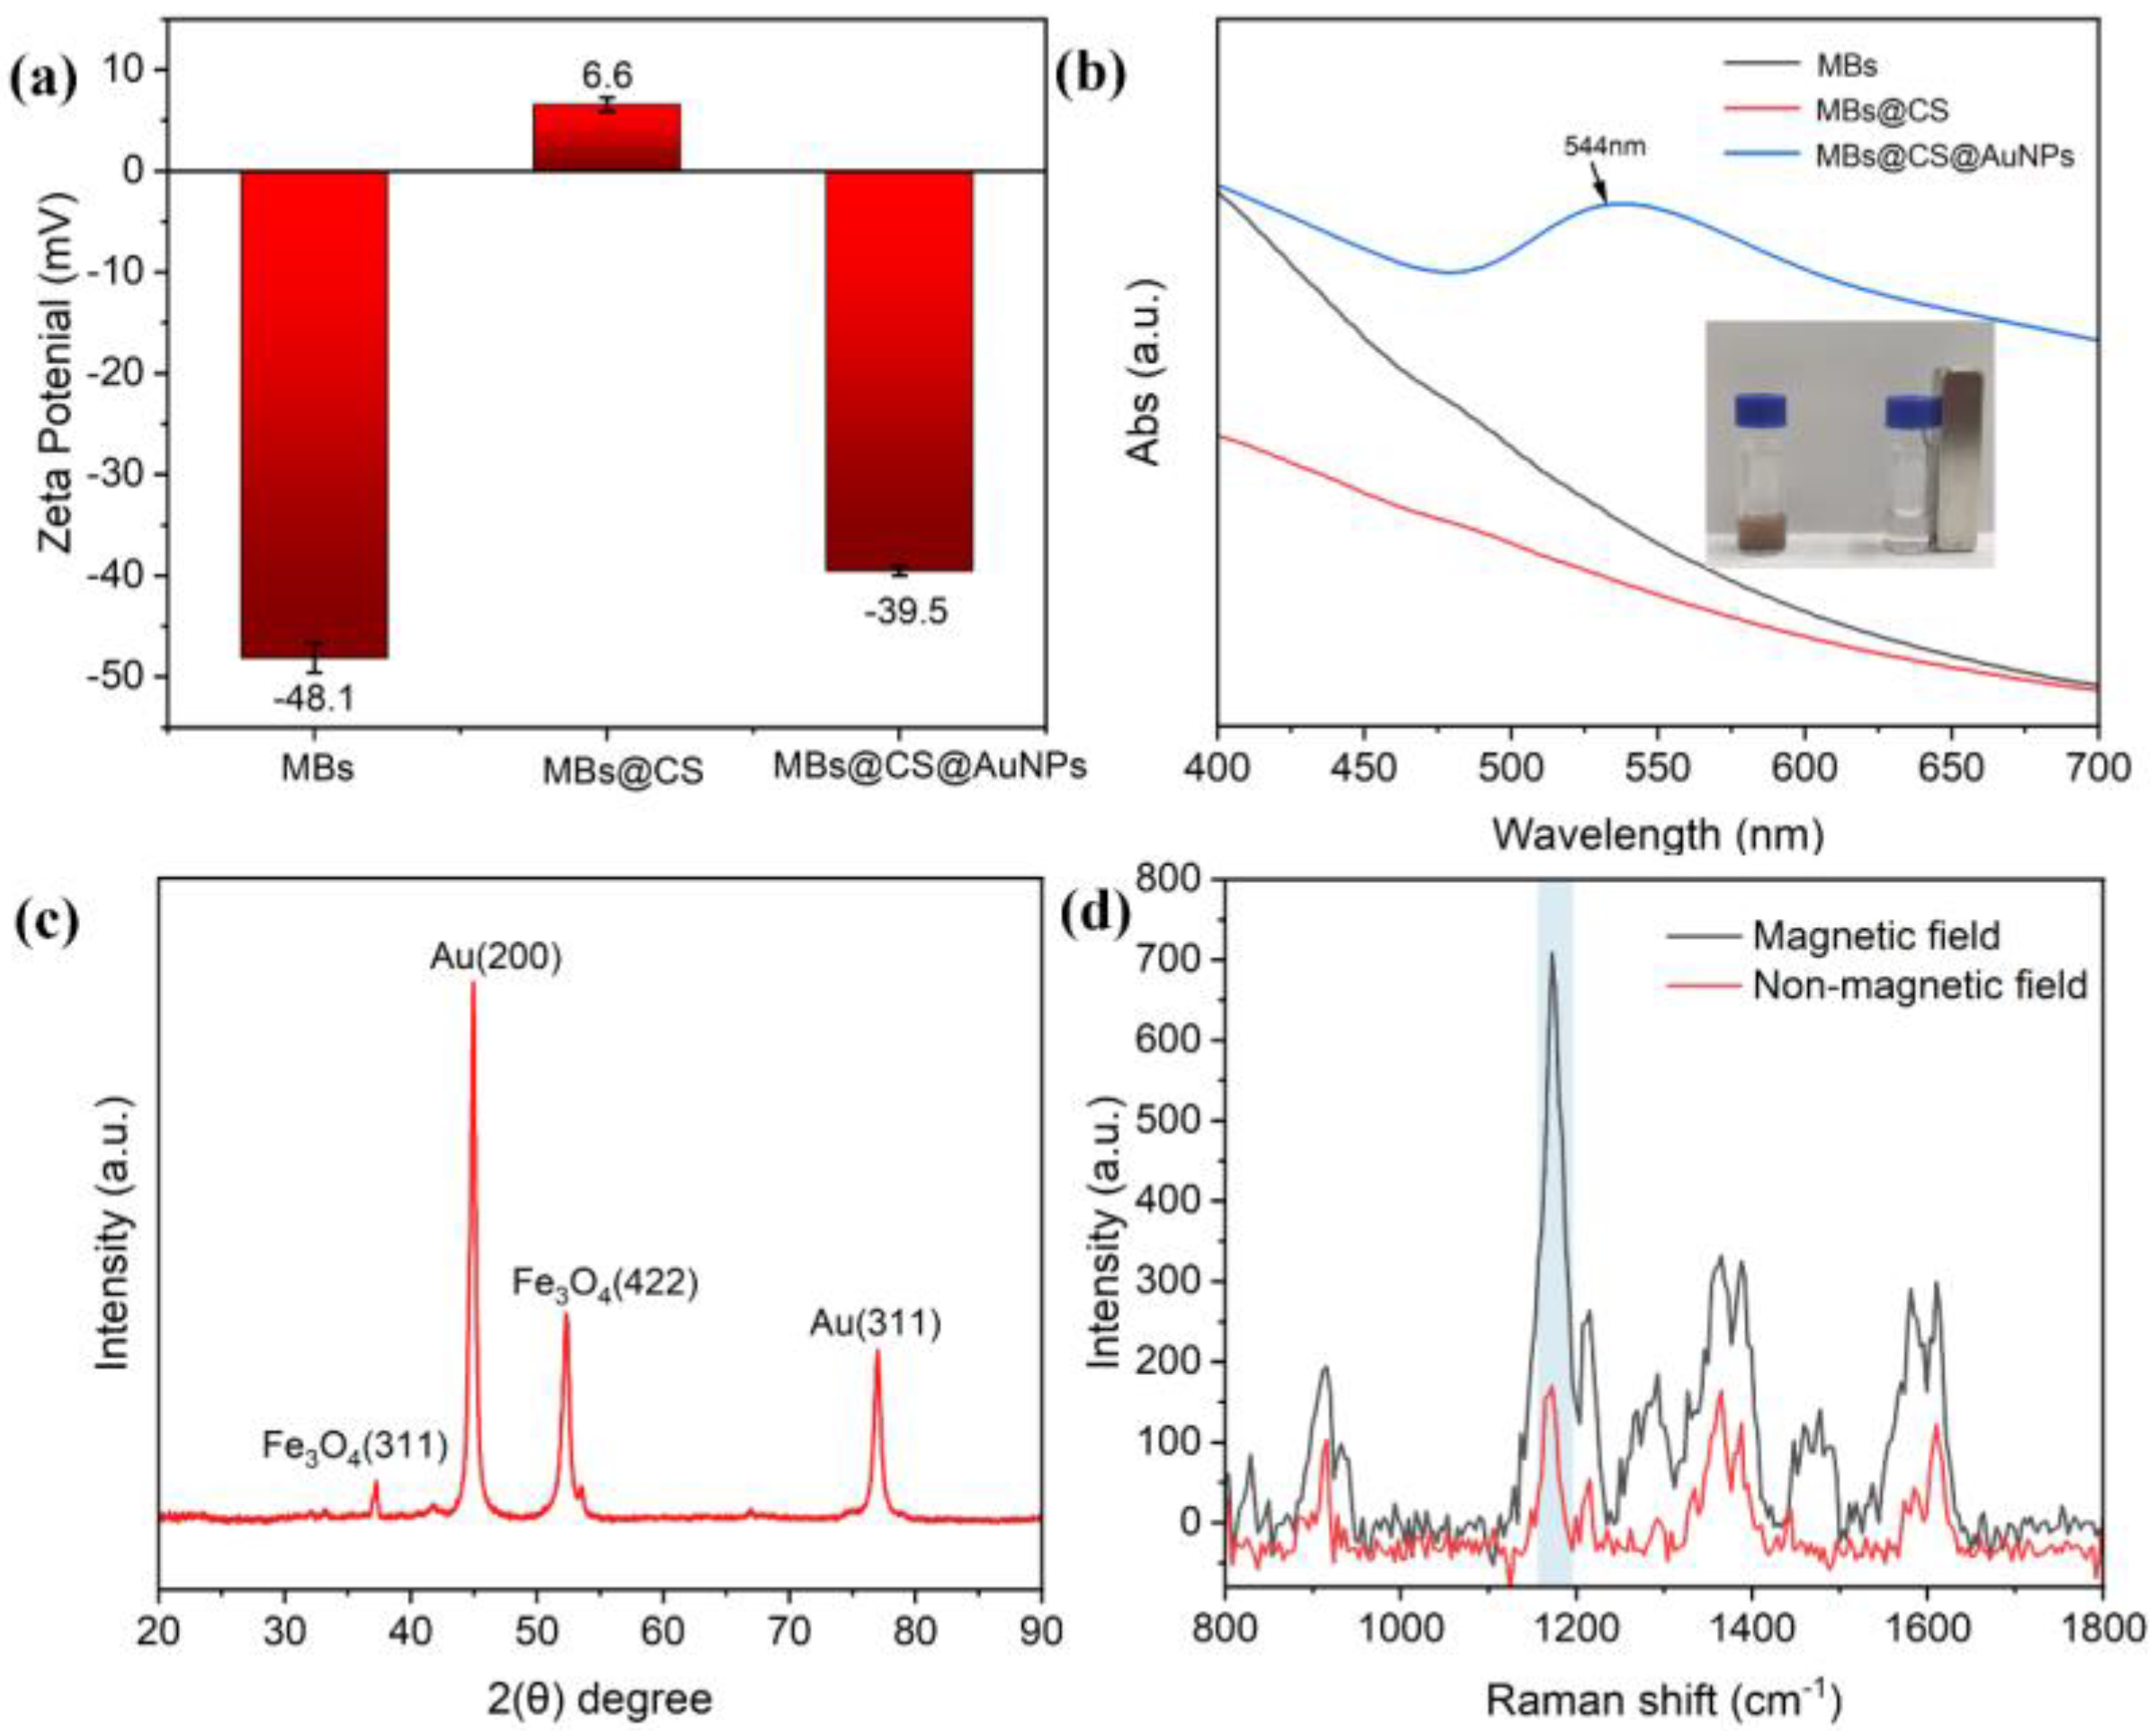
The ζ potential of MBs@CS@AuNPs is illustrated in Figure 3a. It shows that the zeta potential of MBs is −48.1 mV, while the zeta potential of MBs@CS is 6.6 mV, indicating that the negatively charged MBs electrostatically adsorbed the positively charged chitosan. In contrast, the zeta potential of MBs@CS@AuNPs was decreased to −39.5 mV, which may be attributed to the electrostatic adsorption of negatively charged AuNPs onto the CS@MBs. The optical properties of MBs@CS@AuNPs were further characterized using UV–Vis spectroscopy. As shown in Figure 3b, the UV–Vis absorption spectrum of MBs@CS@AuNPs displays a maximum absorption peak at 544 nm, which is higher than the typical absorption peak of gold materials at 530 nm [35], indicating a red shift. This shift may result from interactions between MBs or CS and AuNPs, which enhance the conjugation effect and reduce the energy of electron transitions, leading to the observed red shift of the absorption peak. The inset image demonstrates that the prepared MBs@CS@AuNPs can be separated under an external magnetic field within 2 min. This efficient separation highlights the nanoparticles’ responsiveness to external magnetic fields, making them suitable for applications requiring rapid and effective separation processes.
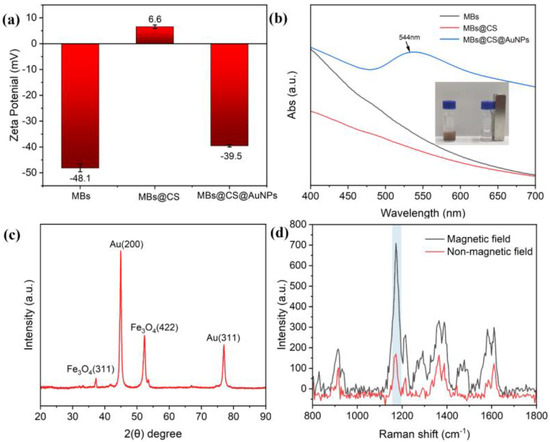
Figure 3.
Characterization of MBs@CS@AuNPs. (a) Zeta potential of carboxylated MBs nanoparticles, MBs@CS nanoparticles prepared with 0.4% (w/v) chitosan, and MBs@CS@AuNPs; (b) UV–Vis spectra of MBs (black), MBs@CS (red), and MBs@CS@AuNPs (blue) nanoparticles (inset: the separation of MBs@CS@AuNPs; (c) XRD pattern of MBs@CS@AuNPs; (d) Raman signal of 10−5 M MG with/without the action of a magnetic field.
Figure 3c further characterizes the crystal phase of the synthesized MBs@CS@AuNPs. The distinct diffraction peaks observed at 2θ values of 35.50° and 52.30° correspond to the (311) and (422) crystal planes of Fe3O4, respectively, while peaks at 44.92° and 76.97° align with the (200) and (311) planes of Au crystals [36], confirming the composite structure of Fe3O4 and Au. The weak Au diffraction peaks can be mainly attributed to the thin Au coating (<10 nm). In addition, low AuNP loading due to suboptimal reaction conditions, reduced crystallinity caused by interactions between AuNPs and MBs, and preferential orientation growth of AuNPs on MBs could further weaken the signals. The small size of AuNPs may induce also lattice distortions, reducing diffraction intensity. Moreover, the dominant Fe3O4 signals at lower angles and overlapping diffraction patterns due to XRD resolution constraints further suppress weaker Au peaks. Despite this, the observed crystalline phases and favorable charge properties of MBs@CS@AuNPs validate their suitability for biosensing and drug delivery applications. Figure 3d presents the Raman spectra of the MG solution with a concentration of 10−5 M measured under two conditions, namely with and without the application of a magnetic field. Clearly, the intensity of the characteristic peak of the MG molecules at 1172 cm−1 without the application of a magnetic field is significantly lower than that with a magnetic field. This is because the action of the externally applied magnetic field promotes the aggregation of MBs@CS@AuNPs, thereby leading to the local concentration of the molecular signal.
3.2. Factors Influencing the Ultrasensitive SERS Detection of MG
In this study, the MBs@CS@AuNPs were synthesized and used as substrates for SERS analysis to detect target substances (Figure 1). The positively charged MG molecules were efficiently adsorbed onto the negatively charged citrate acid-surfaced AuNPs through electrostatic interactions. Additionally, the AuNPs on the surface of MBs@CS@AuNPs effectively bind with the dimethylamino groups of MG, further facilitating its adsorption. The application of an external magnetic field allowed the gathering of MG molecules, while the localized surface plasmon resonance (LSPR) of the AuNPs generated significant electromagnetic enhancement, resonating with MG molecules. This increased the concentration of MG at “hot-spots”, thereby enhancing the Raman signal [37].
The SERS spectrum of MG standard solution (10−3 M) is shown in the schematic diagram of Figure 1. The most prominent peaks of MG are observed at 438, 798, 916, 1172, 1365, and 1613 cm−1, corresponding to phenyl-C-phenyl out-of-plane bending (438 cm−1), ring C-H out-of-plane bending (798, 916 cm−1), ring C-H in-plane bending (1172 cm−1), N-phenyl stretching (1365 cm−1), and ring C-C stretching (1613 cm−1) [38]. The characteristic peak at 1172 cm−1 will be the focus of further discussion in this study.
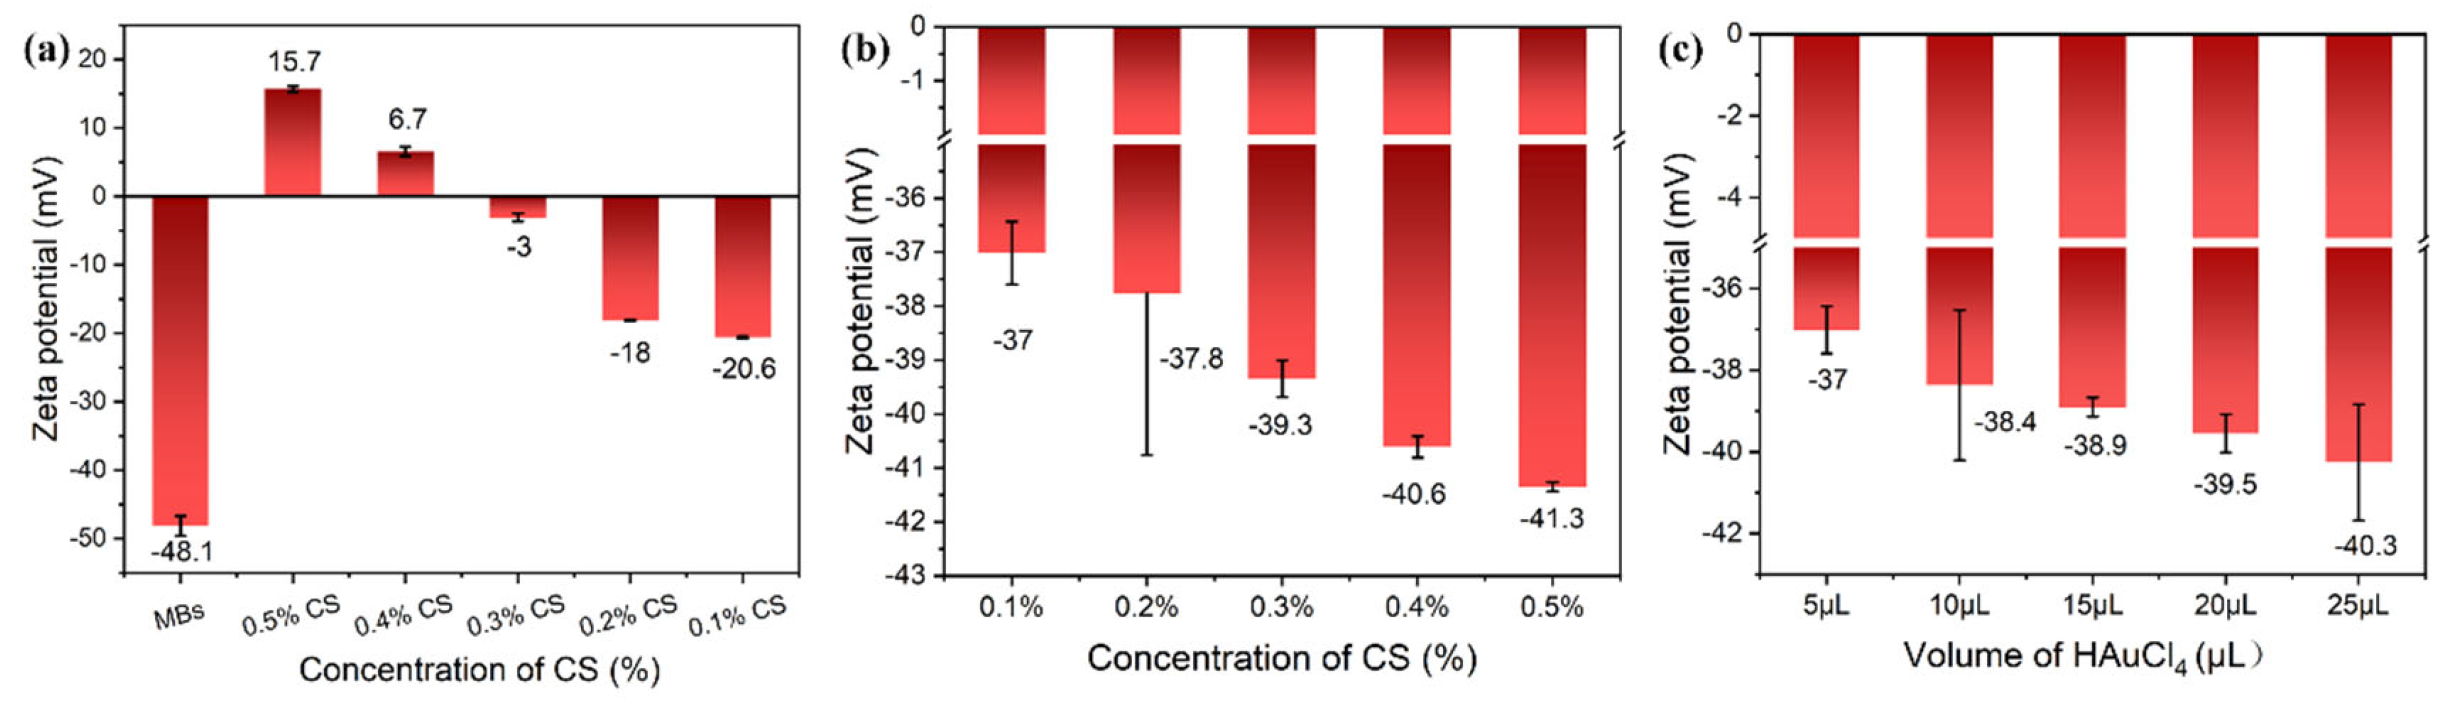
Several factors, including the concentration of CS, the volume of HAuCl4, and the incubation volume ratio of MBs@CS@AuNPs to MG influence the SERS intensity of MG detection. In this study, we utilized zeta potential measurements and Raman spectroscopy to evaluate the effects of these factors on the SERS intensity. CS, derived from the deacetylation of chitin, contains active hydroxyl and amino groups within its polymer matrix [39]. In a weak acid aqueous solution (e.g., acetic acid), chitosan carries a positive charge. This positive charge enables the biopolymer to electrostatically bind with the negatively charged MBs surface. Figure 4a explores the effect of varying chitosan concentrations on the SERS intensity of 10−3 M MG. The results show that increasing the chitosan concentration enhances the SERS intensity, with the highest Raman signal at 1172 cm−1 observed at a 0.4% chitosan concentration. However, further increasing the chitosan concentration leads to a thicker polymer matrix, increasing the distance between plasmonic arrays and molecules and thereby reducing their interaction and the Raman intensity. Additionally, as shown in Figure 5a, the zeta potential of the MBs@CS solution shifts from negative to positive with increasing chitosan concentration, promoting greater AuNP adsorption. This results in stronger negative nanoparticle charges in the MBs@CS@AuNP solution, as depicted in Figure 5b.
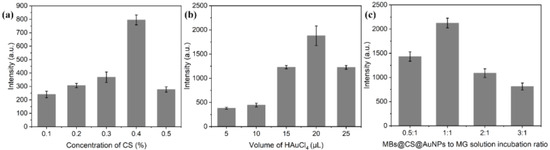
Figure 4.
The optimization of synthesis conditions of the MBs@CS@AuNPs to achieve the best SERS signal. (a) SERS spectra of MBs@CS@AuNPs prepared by using CS concentrations of 0.1%, 0.2%, 0.3%, 0.4%, and 0.5%, with MG concentration of 10−3 M; (b) SERS spectra of MBs@CS@AuNPs prepared with varying HAuCl₄ volumes of 5 μL, 10 μL, 15 μL, and 20 μL, with an MG concentration of 10−3 M; (c) SERS spectra of MBs@CS@AuNPs and MG solution at volume ratios of 0.5:1, 1:1, 2:1, and 3:1, respectively.

Figure 5.
(a) ζ-potential profiles of MBs@CS nanoparticles prepared from chitosan-modified MBs at different concentrations in water. (b) ζ-potential profiles of MBs@CS@AuNPs synthesized from chitosan-modified MBs at various concentrations in water. (c) ζ-potential profiles of MBs@CS@AuNPs prepared from chitosan-modified MBs with varying volumes of chloroauric acid in water.
As shown in Figure 4b, the Raman enhancement effect of MBs@CS@AuNPs generated by different volumes of HAuCl4 initially increased with thickness and began to decrease after reaching a certain concentration. This phenomenon may be related to the surface plasmon resonance (SPR) effect of AuNPs. Lower concentrations of HAuCl4 facilitate the formation of AuNPs with an optimal size, thereby enhancing the Raman signal. In contrast, excessively high concentrations may lead to particle aggregation and the formation of thicker polymer layers, which, in turn, diminish the enhancement of the signal [19].
Changes in incubation volume also significantly affect Raman intensity. As shown in Figure 4c, the optimal Raman signal at 1172 cm−1 is achieved when the volume ratio of MBs@CS@AuNPs to 10−3 malachite green (MG) is 1:1. This is because a proper incubation volume ensures effective molecular contact and binding, thereby increasing the signal intensity.
3.3. SERS Determination of MG Based on MBs@CS@AuNPs Substrate
Under optimal synthesis conditions, various concentrations of MG ranging from 10−3–10−11 M were prepared and analyzed using the MBs@CS@AuNPs substrate and magnetic enrichment method for SERS detection. As shown in Figure 6a, the SERS spectra of MG solutions show a gradual increase in Raman signal intensity with increasing concentration. Furthermore, efforts have been made to establish a quantitative relationship between MG concentration and Raman signal intensity. Figure 6b presents the correlation between Raman intensity at 1172 cm−1 and MG concentration. By plotting the logarithm of the inverse MG concentration against the logarithm of the characteristic peak, the following linear relationship was obtained: y = −0.259x + 4.115 (R2 = 0.9812). The linear detection range was determined to be 10−3 to 10−10 M.
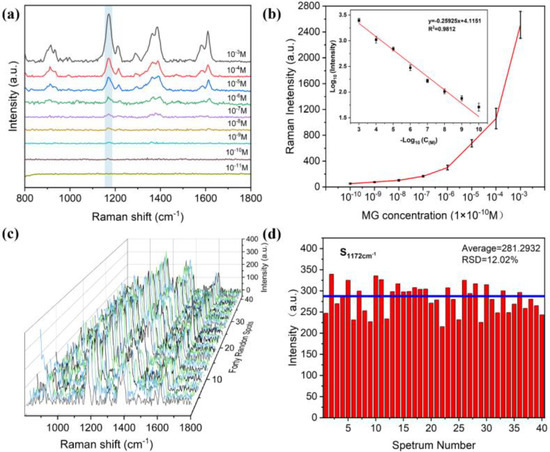
Figure 6.
Sensitivity analysis and uniformity of the MG substrate based on MBs@CS@AuNPs. (a) SERS spectra of MG with concentrations ranging from 10−3 M to 10−11 M. (b) Correlation between Raman intensity at 1172 cm−1 and MG concentration, with a linear fit curve of the logarithm of the peak integral area at 1172 cm−1 plotted against MG concentration. (c) 3D SERS spectral waterfall plot of 10−6 M MG obtained from 40 distinct positions on the substrate. (d) Histogram showing the integrated intensity of the 1172 cm−1 peak.
The reproducibility of the SERS signal generated by the MBs@CS@AuNPs substrate for MG detection was evaluated, which is crucial for SERS applications. The procedure was as follows: equal volumes of 10−6 M MG solution and MB@CS@AuNPs substrate solution were incubated at room temperature. The mixture was spotted and concentrated on a glass slide under an external magnetic field, then air-dried. Raman spectra were collected from 40 random positions of the sample. As shown in Figure 6c, the three-dimensional waterfall plot visually demonstrated the uniformity of the signal, with highly consistent spectral trends and no significant changes in the intensity of characteristic peaks. Figure 6d presents the histogram of the integrated intensity of the 1172 cm−1 peak. The relative standard deviation (RSD) of the SERS peak intensity, used as an indicator of experimental reproducibility, was calculated to be approximately 12.02% (below 20% [40]), indicating that MBs@CS@AuNPs function as a SERS substrate with good reproducibility and can serve as a reliable platform for sensitive detection.
3.4. Specificity
To evaluate the specificity of prepared SERS detection method for MG, several commonly used aquaculture drugs—including methylene blue, methyl violet, potassium permanganate, copper sulfate, ferrous sulfate, and zinc sulfate—were selected as negative controls, and their Raman signal intensities were also measured. The concentration of these other drugs was maintained at 10−3 M, which was ten times higher than that of MG. As shown in Figure 7a, the Raman intensities of these compounds at the characteristic peak of 1172 cm−1 were significantly lower than that of MG, indicating that the method is highly reliable for MG detection.
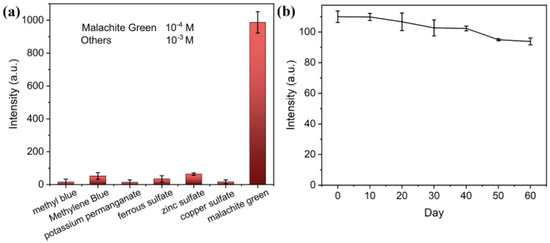
Figure 7.
(a) Histogram of SERS intensity at 1172 cm−1 for various aquaculture drugs. (b) SERS intensity of MG (10−8 M) at 1172 cm−1 using the MBs@CS@AuNPs substrate after different storage periods.
3.5. Stability
To assess the storage stability of the Raman substrates, MBs@CS@AuNPs were stored at 4 °C for varying durations and subsequently used for the detection of 10−8 M MG in aquaculture water samples. As shown in Figure 7b, after two months of storage, the MBs@CS@AuNPs substrates retained approximately 90% of their original SERS intensity, indicating excellent storage stability.
3.6. Real Sample Detection
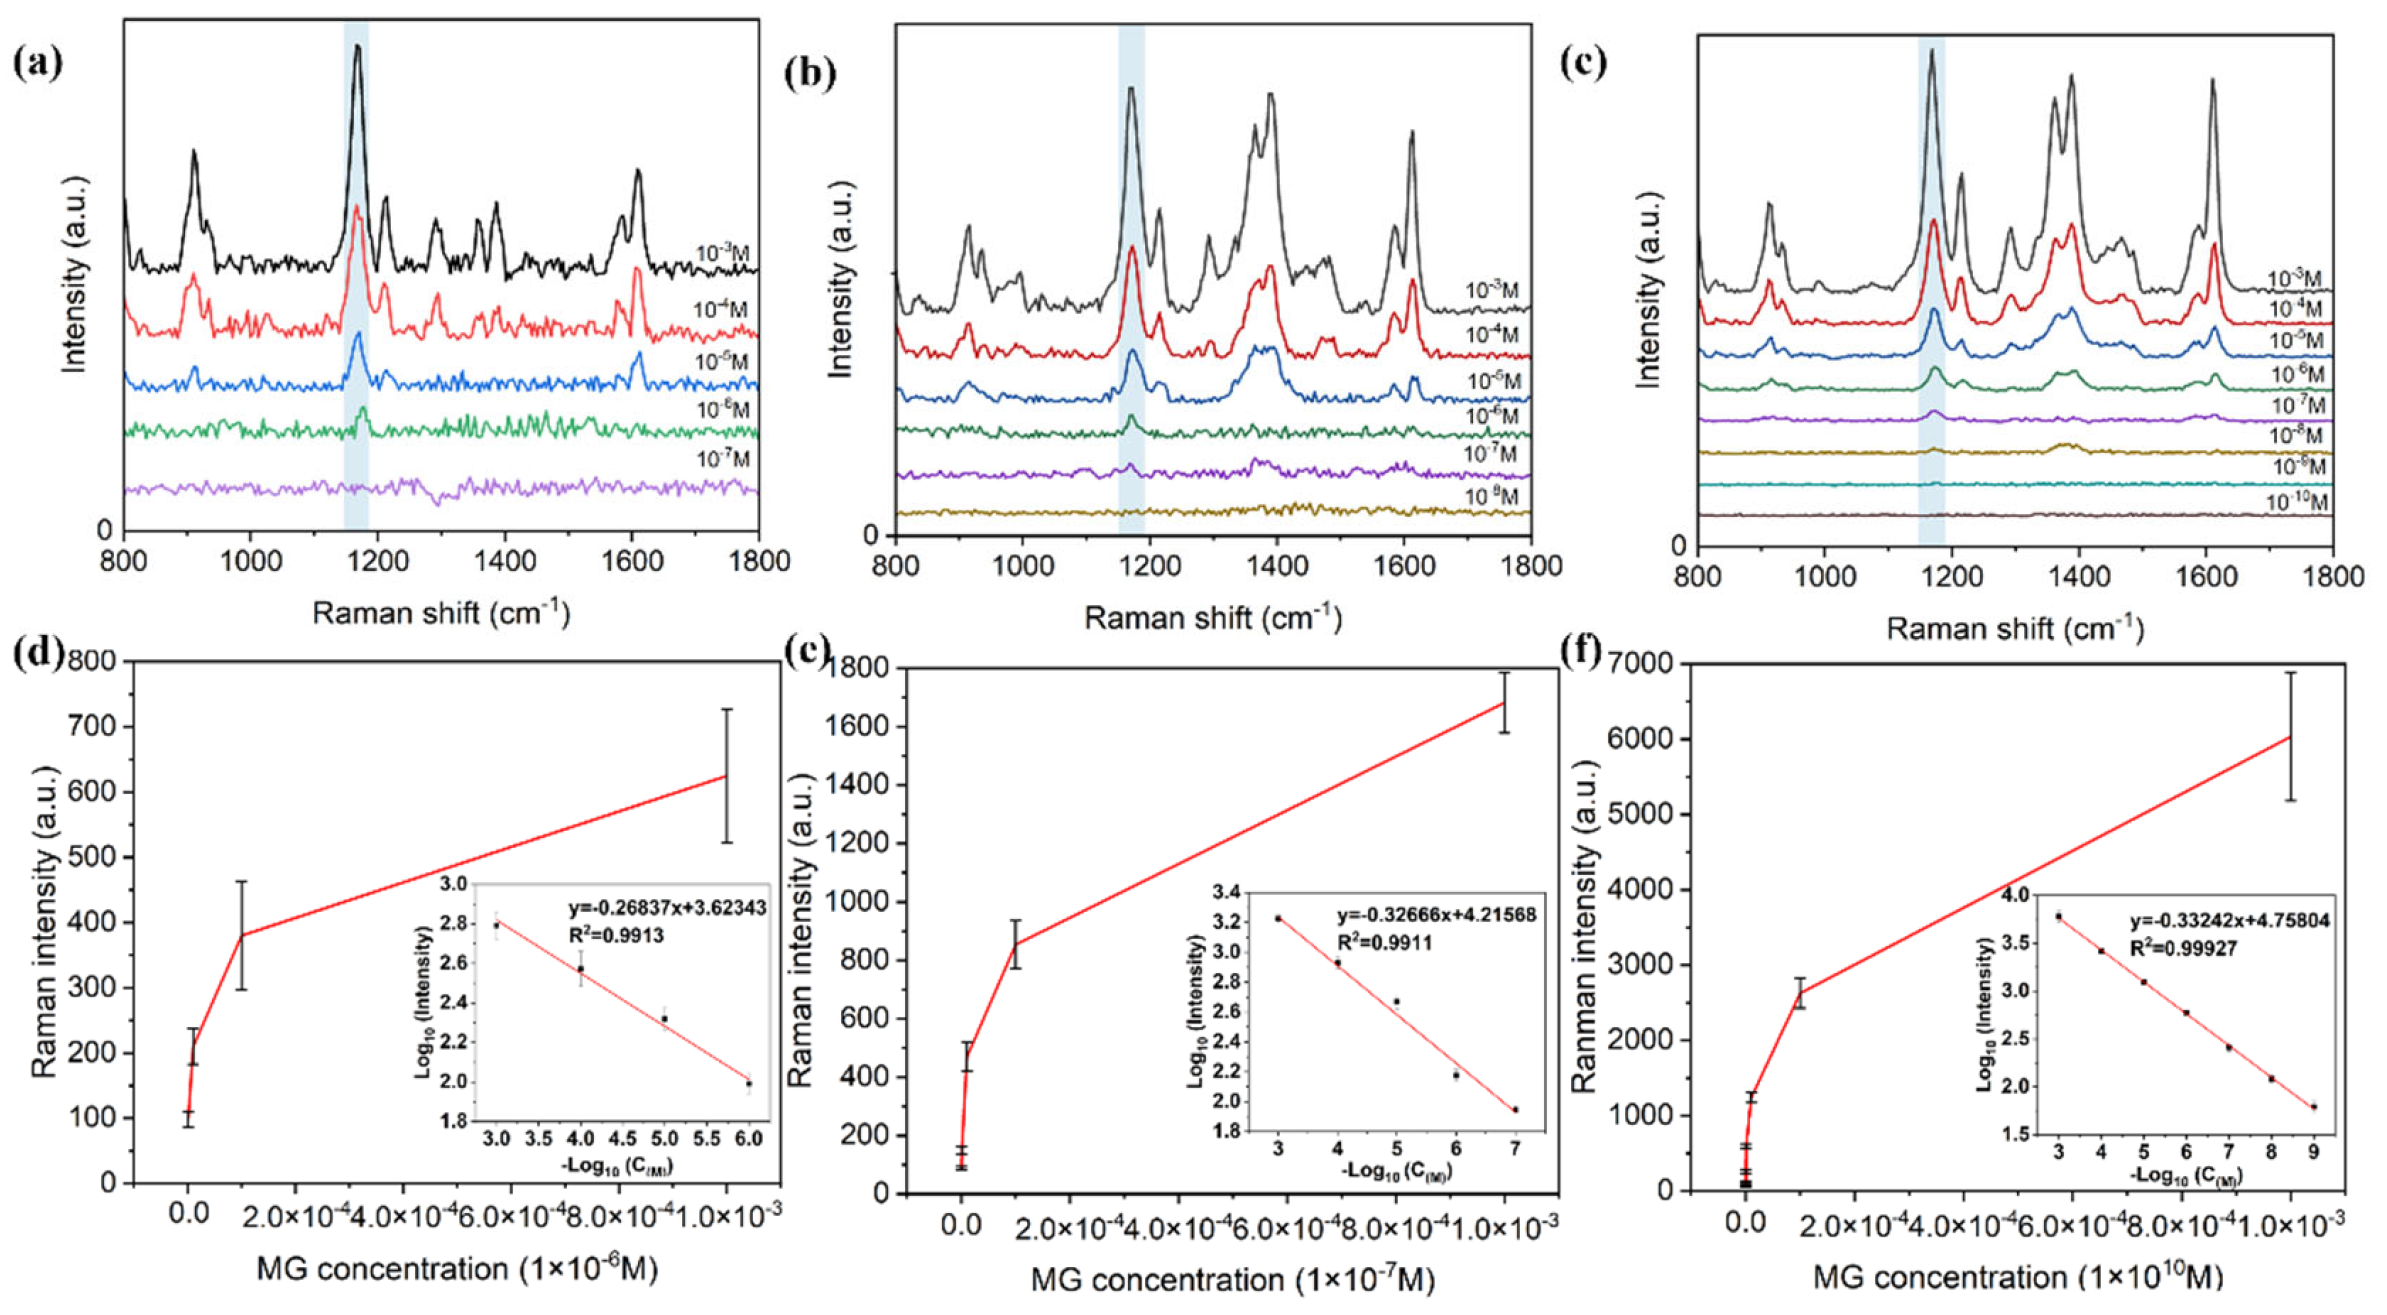
We selected shrimp, cod, and aquaculture water as food matrices to further evaluate the performance of the established method for detecting actual food samples. As shown in Figure 8, MG exhibits four characteristic peaks at 917, 1172, 1361, and 1618 cm−1. The peak at 1172 cm−1 has the highest intensity, indicating that it corresponds to a principal vibrational mode of the MG molecule. This intensity trend aligns with experimental results, showing a significant increase in peak intensity with rising MG concentration. By plotting the logarithm of the peak intensity at 1172 cm−1 against MG concentration, a strong linear relationship is observed. This provides a reliable basis for subsequent quantitative analysis. This approach is also supported by references which highlight the use of characteristic peaks for quantitative analysis in SERS spectroscopy.
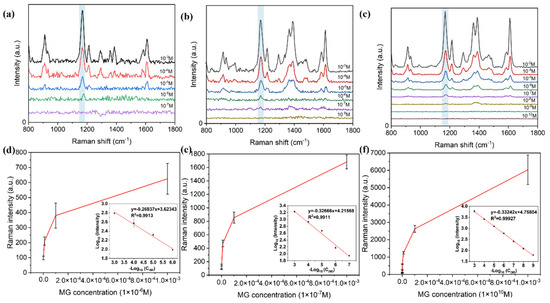
Figure 8.
SERS spectra of MG at different concentrations in (a) shrimp samples, (b) codfish samples, and (c) aquaculture water samples. (d–f) illustrate the relationship between the Raman intensity at 1172 cm−1 and the MG concentration in the three sample types. The linear fit curves of the logarithm of the peak integral area at 1172 cm−1 and the corresponding MG concentrations are depicted.
In shrimp samples, the MG concentrations ranged from 10−3 M to 10−6 M. As shown in Figure 8a, a strong linear relationship was observed between the logarithm of the Raman peak intensity at 1172 cm−1 and MG concentration, with the linear equation y = −0.2684x + 3.6234 (R2 = 0.9913) (Figure 8d). In codfish samples, the added MG concentration ranged from 10−3 M to 10−7 M (Figure 8b), and the linear equation was y = −0.3267x + 4.2157 (R2 = 0.9911) (Figure 8e). For aquaculture water samples, the MG concentrations ranged from 10−3 M to 10−9 M (Figure 8c), and the linear equation was y = −0.3324x + 4.758, R2 = 0.9993 (Figure 8f).
Thus, similar results were obtained across three different types of samples. This demonstrates that the SERS method offers a simple, rapid, and highly sensitive approach for detecting MG in aquaculture, contributing to the control of its misuse in farming practices.
A recovery test was also conducted using MG standard solutions and the established method, with the results presented in Table 1. The recovery rates of MG in the aquaculture water, codfish, and shrimp samples ranged from 93.4% to 114.8%, 109.1% to 114.9%, and 80.3% to 105.4%, respectively. These results indicate that the prepared MBs@CS@AuNPs-based Raman substrate provides a reliable, rapid, and accurate method for detecting MG in various aquatic samples.

Table 1.
Detection of malachite green in different samples.
3.7. Methodological Comparison
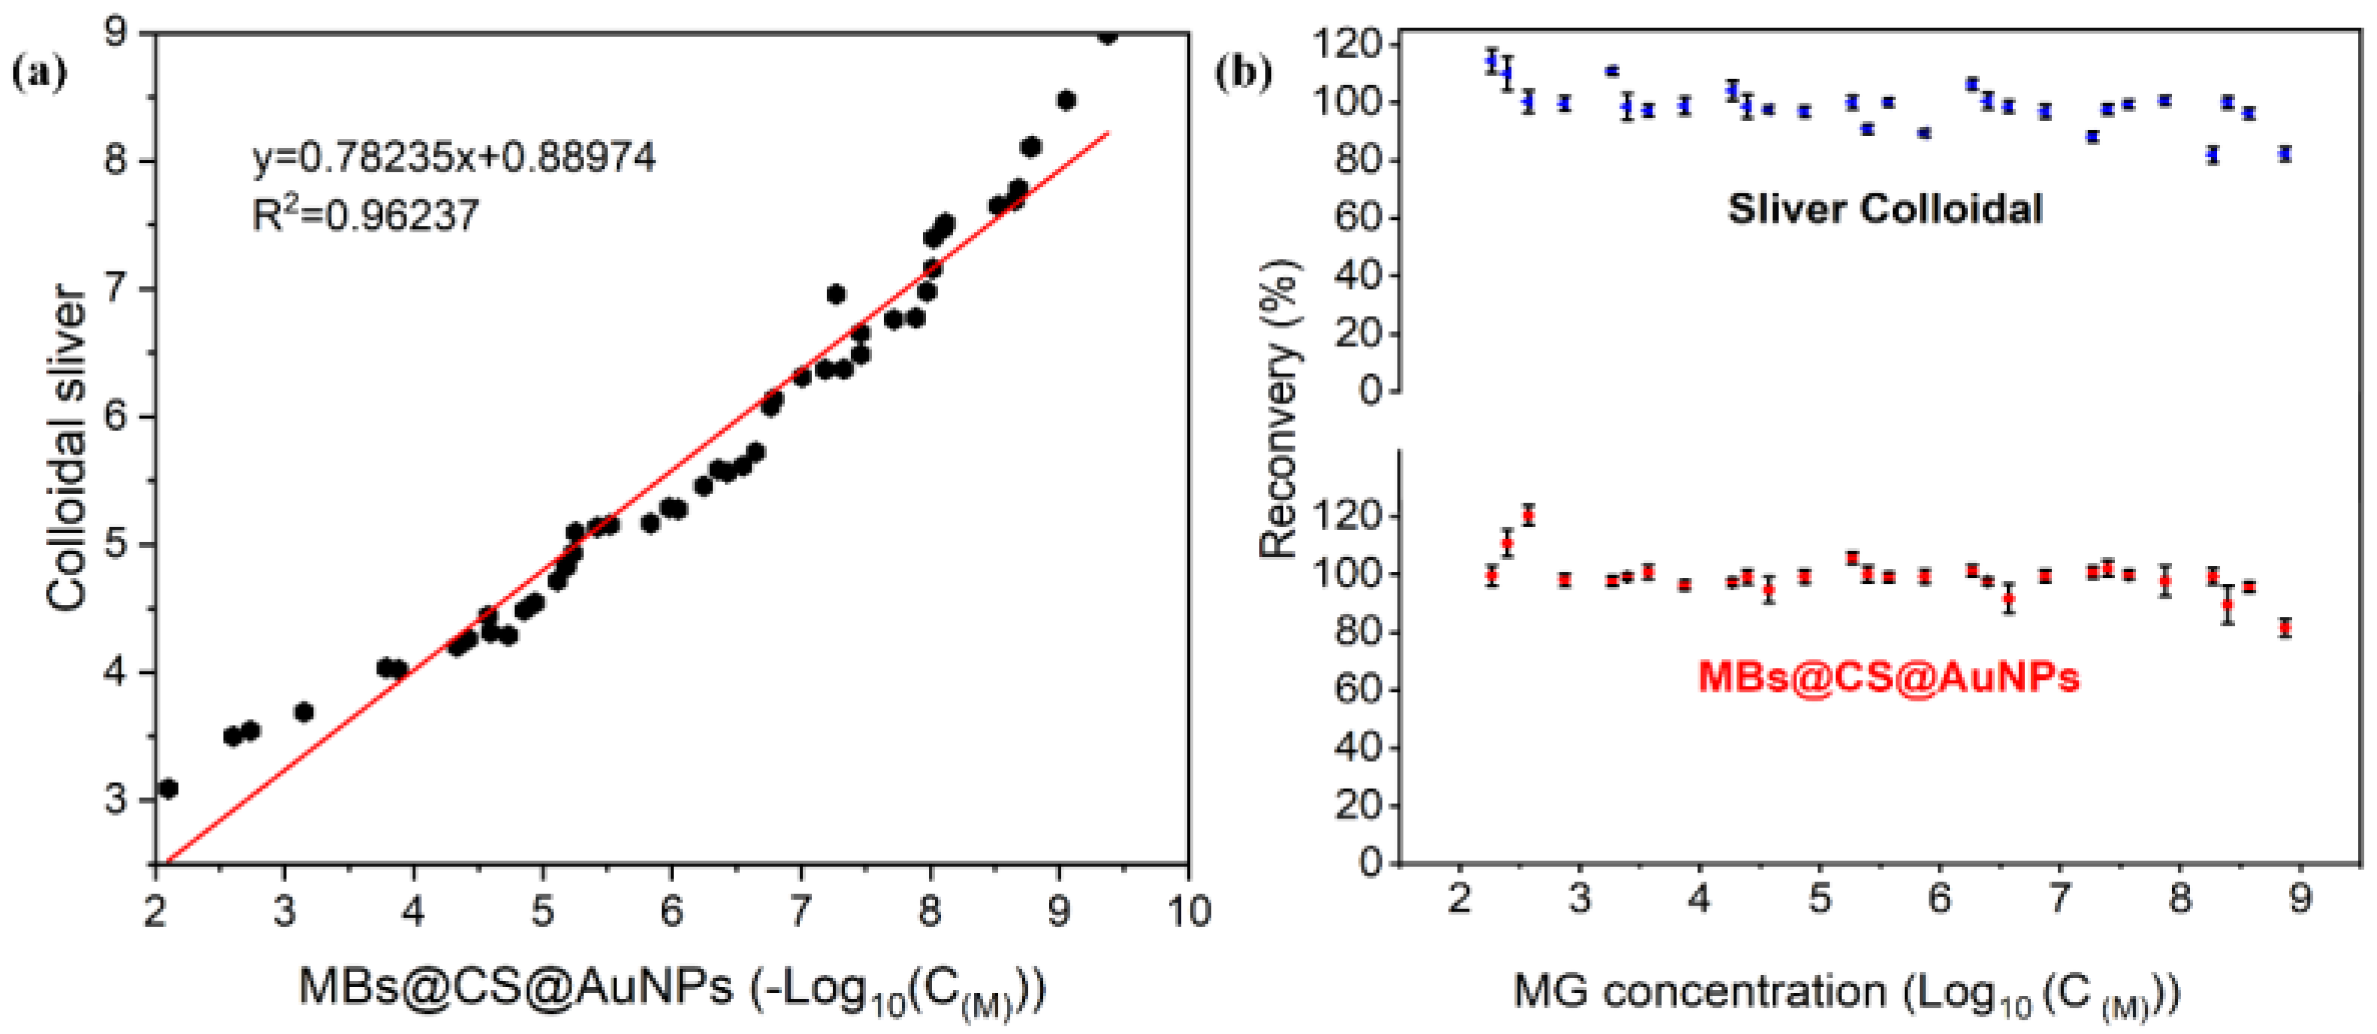
To further evaluate the accuracy of the established method, a total of 50 aquaculture water samples were randomly spiked with varying concentrations of MG (10−3 M to 10−8 M). The MG concentrations in the samples were tested using both the MBs@CS@AuNPs-based Raman substrate developed in this study and silver colloidal-based method. The latter was performed according to the local standard DB13/T 1358-2011, which specifies a rapid detection procedure for malachite green in aquaculture water using laser Raman spectroscopy with colloidal silver as the enhancement substrate. The colloidal silver used in this study was purchased from Qingdao Licheng District Qinke Nano New Materials Technology Center, Qingdao, Shandong, China, as described in the Materials and Methods section. As shown in Figure 9a, both two methods exhibited a strong correlation (R2 = 0.9623). Additionally, the developed gold–magnetic nanoparticle substrate demonstrated a similar recovery rate (89–120%) compared to standard silver colloidal method (82–114%) (Figure 9b).
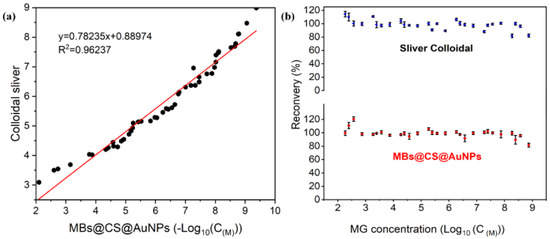
Figure 9.
Comparative analysis of detection results between the commercial silver colloidal SERS substrate and the MBs@CS@AuNPs substrate. (a) Linear correlation analysis of MG concentrations detected by both methods; (b) comparison of the recovery rates between the two methods (The blue symbols represent the recycling experiment using the colloidal silver method, and the red symbols correspond to the recycling experiment employing the MBs@CS@AuNPs substrate used in this experiment).
The significance of the methodology comparison lies in demonstrating that the materials developed in this study, compared with the commercially available silver colloidal, also possess excellent application value. By conducting a side-by-side comparison with the widely-used standard silver colloidal method, we can clearly see that the MBs@CS@AuNPs-based Raman detection system not only has a strong correlation with the traditional method in terms of detection results but also maintains a comparable recovery rate. This implies that our developed method can achieve similar detection performance in practical applications, even when compared with the well-established and commercially available products. Furthermore, a comparison between the proposed Raman detection method with previously published MG detection techniques was also conducted. As shown in Table 2, the Raman detection method presented in this study outperformed other methods reported by various research groups in terms of detection efficiency and lower detection limits. These results demonstrate that the developed substrate offers superior analytical performance for MG detection.
Table 2.
Comparison with other methods.
4. Conclusions
In this study, we synthesized MBs@CS@AuNPs as SERS substrates for the detection of MG. By optimizing the concentration of chitosan, the volume of colloidal gold, and the incubation volume ratio, an optimal SERS substrate were developed. The method demonstrated excellent detection performance for MG across various matrices. This approach offers a low detection limit, rapid analysis time, and high accuracy and reliability, making it suitable for the efficient detection of MG residues in shrimp, codfish, and aquaculture water.
Author Contributions
Y.Y.: Writing—original draft, Visualization, Validation, Methodology, Investigation, Conceptualization. T.H.: Formal analysis, Writing—original draft, Supervision, Visualization. S.H.: Writing—review and editing, Resources. H.Y.: Formal analysis. J.X.: Formal analysis. S.Z.: Writing—review and editing, Conceptualization, Methodology, Supervision, funding acquisition. All authors have read and agreed to the published version of the manuscript.
Funding
This research was funded by National Natural Science Foundation of China [Grant No. 32302209], Natural Science Foundation of Zhejiang Province [Grant No. LQ24C200001], Natural Science Foundation of Ningbo [Grant No. 2023J104], and Ningbo University graduate science and technology innovation program [Grant No. 2024SRIP3605].
Institutional Review Board Statement
Our paper has no experiment which is closely related to Ethical Questions Confirmation. White shrimp samples and cod samples were purchased from a local market (Ningbo, China).
Informed Consent Statement
Not applicable.
Data Availability Statement
All data generated or analyzed during this study are included in this published article.
Acknowledgments
This study was financially supported by the National Natural Science Foundation of China (32302209), Natural Science Foundation of Zhejiang Province (LQ24C200001), Natural Science Foundation of Ningbo (2023J104), and the Ningbo University graduate science and technology innovation program (2024SRIP3605).
Conflicts of Interest
The authors declare that they have no known competing financial interests or personal relationships that could have appeared to influence the work reported in this paper.
References
- Wang, J.; Zhao, C.; Hong, C.; Lin, Z.; Huang, Z. Rapid detection of malachite green in fish and water based on the peroxidase-like activity of Fe3O4NPs enhanced with aptamer. J. Food Compos. Anal. 2021, 104, 104162. [Google Scholar] [CrossRef]
- Chen, Z.; Fu, Z.; Du, X.; Xie, J.; Ding, Z. Novel aptamer fluorescence assays for malachite green and leucomalachite green detection. Microchem. J. 2024, 205, 111391. [Google Scholar] [CrossRef]
- Nanjappa, M.D.; Jayaprakash, G.K. Some progress in voltammetric methods to detect malachite green in real samples using carbon electrodes. J. Electrochem. Sci. Eng. 2023, 13, 437–449. [Google Scholar] [CrossRef]
- Teepoo, S.; Jantra, J.; Panapong, K.; Ajayi, D.T. A highly sensitive hyperbranched Au plasmonic blackbody immunochromatographic assay for detection of leucomalachite green in fish and shrimp. Anal. Chim. Acta 2024, 1285, 342031. [Google Scholar] [CrossRef]
- Karthik, P.; Jose, P.A.; Chellakannu, A.; Gurusamy, S.; Ananthappan, P.; Karuppathevan, R.; Vasantha, V.S.; Rajesh, J.; Ravichandran, S.; Sankarganesh, M. Green synthesis of MnO2 nanoparticles from Psidium guajava leaf extract: Morphological characterization, photocatalytic and DNA/BSA interaction studies. Int. J. Biol. Macromol. 2024, 258, 128869. [Google Scholar] [CrossRef]
- Meng, E.-Q.; Nian, Q.-X.; Li, F.; Zhang, Q.-P.; Xu, Q.; Wang, C.-M. Sulfonated magnetic graphite carbon nitride solid-phase extraction-ultra performance liquid chromatography-tandem mass spectrometry for screening malachite green and leucomalachite green in freshwater fish. Se Pu Chin. J. Chromatogr. 2023, 41, 673–682. [Google Scholar] [CrossRef]
- Yu, Z.; Gong, H.; Li, Y.; Xu, J.; Zhang, J.; Zeng, Y.; Liu, X.; Tang, D. Chemiluminescence-derived self-powered photoelectrochemical immunoassay for detecting a low-abundance disease-related protein. Anal. Chem. 2021, 93, 13389–13397. [Google Scholar] [CrossRef]
- Mikac, L.; Rigó, I.; Himics, L.; Tolić, A.; Ivanda, M.; Veres, M. Surface-enhanced Raman spectroscopy for the detection of microplastics. Appl. Surf. Sci. 2023, 608, 155239. [Google Scholar] [CrossRef]
- Almaviva, S.; Artuso, F.; Giardina, I.; Lai, A.; Pasquo, A. Fast detection of different water contaminants by Raman spectroscopy and surface-enhanced Raman spectroscopy. Sensors 2022, 22, 8338. [Google Scholar] [CrossRef]
- Darienzo, R.E.; Chen, O.; Sullivan, M.; Mironava, T.; Tannenbaum, R. Au nanoparticles for SERS: Temperature-controlled nanoparticle morphologies and their Raman enhancing properties. Mater. Chem. Phys. 2020, 240, 122143. [Google Scholar] [CrossRef] [PubMed]
- Chen, Q.; Zhao, L.; Liu, H.; Ding, Q.; Jia, C.; Liao, S.; Cheng, N.; Yue, M.; Yang, S. Nanoporous silver nanorods as surface-enhanced Raman scattering substrates. Biosens. Bioelectron. 2022, 202, 114004. [Google Scholar] [CrossRef] [PubMed]
- Gebavi, H.; Ristić, D.; Baran, N.; Mikac, L.; Mohaček-Grošev, V.; Gotić, M.; Ivanda, M. Silicon nanowires as sensory material for surface-enhanced Raman spectroscopy. Silicon 2019, 11, 1151–1157. [Google Scholar] [CrossRef]
- Parmigiani, M.; Albini, B.; Pellegrini, G.; Genovesi, M.; De Vita, L.; Pallavicini, P.; Dacarro, G.; Galinetto, P.; Taglietti, A. Surface-enhanced raman spectroscopy chips based on silver coated gold nanostars. Nanomaterials 2022, 12, 3609. [Google Scholar] [CrossRef] [PubMed]
- Yang, Z.; Yang, L.; Liu, Y.; Chen, L. Photocatalytic deposition of Au nanoparticles on Ti3C2Tx MXene substrates for surface-enhanced Raman scattering. Molecules 2024, 29, 2383. [Google Scholar] [CrossRef]
- Michałowska, A.; Kudelski, A. Plasmonic substrates for biochemical applications of surface-enhanced Raman spectroscopy. Spectrochim. Acta Part A Mol. Biomol. Spectrosc. 2023, 308, 123786. [Google Scholar] [CrossRef]
- Berganza, L.B.; Litti, L.; Meneghetti, M.; Lanceros-Méndez, S.; Reguera, J. Enhancement of magnetic surface-enhanced Raman scattering detection by tailoring Fe3O4@ Au nanorod shell thickness and its application in the on-site detection of antibiotics in water. ACS Omega 2022, 7, 45493–45503. [Google Scholar] [CrossRef]
- Juang, R.-S.; Chen, W.-T.; Cheng, Y.-W.; Wang, K.-S.; Jeng, R.-J.; Zeng, Z.-L.; Liu, S.-H.; Liu, T.-Y. Fabrication of in situ magnetic capturing and Raman enhancing nanoplatelets for detection of bacteria and biomolecules. Colloids Surf. A Physicochem. Eng. Asp. 2022, 648, 129189. [Google Scholar] [CrossRef]
- Jing, Z.; Zhang, L.; Xu, X.; Zhu, S.; Zeng, H. Carbon-assistant nanoporous gold for surface-enhanced Raman scattering. Nanomaterials 2022, 12, 1455. [Google Scholar] [CrossRef]
- Hinds, D.T.; Belhout, S.A.; Colavita, P.E.; Ward, A.D.; Quinn, S.J. Microsphere-supported gold nanoparticles for SERS detection of malachite green. Mater. Adv. 2023, 4, 1481–1489. [Google Scholar] [CrossRef]
- Han, L.; Wang, X.; Yu, B.; Qin, X.; Liu, B.; Han, X.; Yuan, H.; Zhao, Z. Development of Fe3O4/DEX/PDA@ Au (Raman reporters)@ Au-MPBA nanocomposites based multi-hotspot SERS probe for ultrasensitive, reliable, and quantitative detection of glucose in sweat. Spectrochim. Acta Part A Mol. Biomol. Spectrosc. 2025, 326, 125192. [Google Scholar] [CrossRef]
- Xiao, Y.; Luo, S.; Qiu, J.; Zhang, Y.; Liu, W.; Zhao, Y.; Zhu, Y.; Deng, Y.; Lu, M.; Liu, S. Highly sensitive SERS platform for pathogen analysis by cyclic DNA nanostructure@ AuNP tags and cascade primer exchange reaction. J. Nanobiotechnol. 2024, 22, 75. [Google Scholar] [CrossRef] [PubMed]
- Li, Z.H.; Bai, J.H.; Zhang, X.; Lv, J.M.; Fan, C.S.; Zhao, Y.M.; Wu, Z.L.; Xu, H.J. Facile synthesis of Au nanoparticle-coated Fe3O4 magnetic composite nanospheres and their application in SERS detection of malachite green. Spectrochim. Acta Part A Mol. Biomol. Spectrosc. 2020, 241, 118532. [Google Scholar] [CrossRef] [PubMed]
- He, H.; Sun, D.-W.; Pu, H.; Chen, L.; Lin, L. Applications of Raman spectroscopic techniques for quality and safety evaluation of milk: A review of recent developments. Crit. Rev. Food Sci. 2019, 59, 770–793. [Google Scholar] [CrossRef] [PubMed]
- Muntean, C.M.; Cuibus, D.; Boca, S.; Falamas, A.; Tosa, N.; Brezeştean, I.A.; Bende, A.; Barbu-Tudoran, L.; Moldovan, R.; Bodoki, E. Gold vs. Silver colloidal nanoparticle films for optimized SERS detection of propranolol and electrochemical-SERS analyses. Biosensors 2023, 13, 530. [Google Scholar] [CrossRef]
- Hu, B.; Sun, D.-W.; Pu, H.; Wei, Q. Rapid nondestructive detection of mixed pesticides residues on fruit surface using SERS combined with self-modeling mixture analysis method. Talanta 2020, 217, 120998. [Google Scholar] [CrossRef]
- Machado Da Silva Acioly, T.; Francisco Da Silva, M.; Iannacone, J.; Viana, D.C. Levels of potentially toxic and essential elements in Tocantins River sediment: Health risks at Brazil’s Savanna-Amazon interface. Sci. Rep. 2024, 14, 18037. [Google Scholar] [CrossRef]
- Alves, M.B.; Da Silva Acioly, T.M.; Oliver, J.I.; Jawad, L.J.; De Sousa, A.L.; Dos Santos, D.A.; Viana, D.C. Microplastics and behavioral changes in fish: An integrative review. Cad. Pedagóg. 2024, 21, e8613. [Google Scholar] [CrossRef]
- Alvariño, L.; Guabloche, A.; Da Silva Acioly, T.M.; Viana, D.C.; Iannacone, J. Assessment of potentially toxic metals, metalloids, and non-metals in muscle and liver tissue of two fish species (Mugil cephalus Linnaeus, 1758 and Odontesthes regia (Humboldt, 1821) from the Coastal Area of Callao, Peru. Reg. Stud. Mar. Sci. 2024, 71, 103423. [Google Scholar] [CrossRef]
- Morey, G.M.; Viana, D.C.; Chota, H.R.; Chero, J.D. Three new species of Jainus (Monogenoidea: Dactylogyridae) from the gills of Triportheus angulatus (Characiformes: Triportheidae) collected in the Peruvian Amazonia. Syst. Parasitol. 2025, 102, 1. [Google Scholar] [CrossRef]
- Araújo, K.S.D.S.; Acioly, T.M.D.S.; Nascimento, I.O.; Costa, F.N.; Corrêa, F.; Gagneten, A.M.; Viana, D.C. Biomonitoring of waters and tambacu (Colossoma macropomum × Piaractus mesopotamicus) from the Amazônia Legal, Brazil. Water 2024, 16, 2588. [Google Scholar] [CrossRef]
- He, Q.; Wang, D.; Shao, J.; Li, Y.; Cheng, M.; Dong, L.; Li, Y.; Zhu, J.; Li, H. Multicomponent SERS imprinted bio-membrane based on eggshell membrane for selective detection of spiramycin in water. J. Mol. Struct. 2023, 1289, 135883. [Google Scholar] [CrossRef]
- Xu, Z.; Bi, X.; Huang, Y.; Che, Z.; Chen, X.; Fu, M.; Tian, H.; Yang, S. Sensitive colorimetric detection of Salmonella enteric serovar typhimurium based on a gold nanoparticle conjugated bifunctional oligonucleotide probe and aptamer. J. Food Saf. 2018, 38, e12482. [Google Scholar] [CrossRef]
- Puttige, K.; Nooralabettu, K.P. Effect of homogenization speed and time on the recovery of alkaline phosphatase from the hepatopancreatic tissues of shrimps. Food Sci. Biotechnol. 2012, 21, 461–466. [Google Scholar] [CrossRef]
- Debut, A.; Vizuete, K.; Pazmiño, K.; Calderón, J.; Gallegos, C.; Gaona, V. Effect of visual cognition on the measurement of particle size using ImageJ software. Curr. Mater. Sci. 2021, 14, 141–154. [Google Scholar] [CrossRef]
- Liu, J.; Liu, Y.; Cao, Y.; Sang, S.; Guan, L.; Wang, Y.; Wang, J. Preparation of Fe3O4@ PDA@ Au@ GO composite as SERS substrate and its application in the enrichment and detection for phenanthrene. Micromachines 2022, 13, 128. [Google Scholar] [CrossRef]
- Yaroslavtsev, R.N.; Tyumentseva, A.V.; Velikanov, D.A.; Vazhenina, I.G.; Volochaev, M.N.; Stolyar, S.V. Fe3O4/Au nanocomposites: Characterization and cytotoxicity effects in vitro. Mater. Chem. Phys. 2024, 322, 129524. [Google Scholar] [CrossRef]
- Raj, D.; Tayyaba, N.; De Vita, G.; Scaglione, F.; Rizzi, P. Ultrasensitive detection of malachite green isothiocyanate using nanoporous gold as SERS substrate. Materials 2023, 16, 4620. [Google Scholar] [CrossRef]
- Wicaksono, W.P.; Dang, H.; Lee, S.; Choo, J. Electrochemical surface-enhanced Raman spectroscopy analysis of malachite green on gold substrates. Appl. Surf. Sci. 2024, 649, 159163. [Google Scholar] [CrossRef]
- Yuan, Y.; Tan, W.; Zhang, J.; Li, Q.; Guo, Z. Water-soluble amino functionalized chitosan: Preparation, characterization, antioxidant and antibacterial activities. Int. J. Biol. Macromol. 2022, 217, 969–978. [Google Scholar] [CrossRef]
- He, R.X.; Liang, R.; Peng, P.; Norman Zhou, Y. Effect of the size of silver nanoparticles on SERS signal enhancement. J. Nanopart. Res. 2017, 19, 267. [Google Scholar] [CrossRef]
- Zhao, L.; Lin, X.; Duan, N.; Khan, I.M.; Wang, Z.; Wu, S. A sensitive fluorescent assay based on gold-nanoclusters coated on molecularly imprinted covalent organic frameworks and its application in malachite green detection. Food Chem. 2023, 410, 135425. [Google Scholar] [CrossRef] [PubMed]
- Li, Z.; Zhou, Y.; Cui, Y.; Liang, G. Dual-potential electrochemiluminescent film constructed from single AIE luminogens for the sensitive detection of malachite green. Nanoscale 2022, 14, 7711–7719. [Google Scholar] [CrossRef] [PubMed]
- Panapong, K.; Wechakorn, K.; Binhayeeniyi, N.; Teepoo, S. Dual-color immunochromatographic test strip for simultaneous sensitive detection of malachite green and leucomalachite green residues in fish and shrimp meat samples. Food Chem. 2025, 463, 141427. [Google Scholar] [CrossRef] [PubMed]
- Du, H.; He, L.; Zhang, M.; Manyande, A.; Chen, H. Carbon quantum dots derived from fish scales as fluorescence sensors for detection of malachite green. J. Food Meas. Charact. 2023, 17, 3368–3376. [Google Scholar] [CrossRef]
- Singh, R.; Singh, R.K. Detection of malachite green in water using edge excited label free fluorescent probe NCQDs. J. Fluoresc. 2020, 30, 1281–1285. [Google Scholar] [CrossRef]
- Fu, G.; Weng, H.; Lai, Z.; Lin, Z.; Huang, Z. Detection of malachite green residue in aquaculture water by using a rare earth fluorescence probe. J. Chem. Sci. 2021, 133, 54. [Google Scholar] [CrossRef]
- Liu, Y.-N.; Li, J.-J.; Liu, Q.-A.; Weng, G.-J.; Zhu, J.; Zhao, J.-W. Sensitive detection of malachite green in aquaculture water by surface enhanced Raman scattering using silver coated urchin-like gold nanoparticles. Colloids Surf. A Physicochem. Eng. Asp. 2023, 668, 131485. [Google Scholar] [CrossRef]
- Zeng, W.-Y.; Wang, Z.-F.; Lin, D.-Z.; Cheng, I.-C. Pore evolution and size effect of nanoporous silver on SERS for malachite green detection. Appl. Surf. Sci. 2023, 640, 158306. [Google Scholar] [CrossRef]
- Tian, X.; Fan, Q.; Guo, J.; Yu, Q.; Xu, L.; Kong, X. Surface-enhanced Raman scattering of flexible cotton fiber-Ag for rapid adsorption and detection of malachite green in fish. Spectrochim. Acta Part A Mol. Biomol. Spectrosc. 2021, 263, 120174. [Google Scholar] [CrossRef]


Disclaimer/Publisher’s Note: The statements, opinions and data contained in all publications are solely those of the individual author(s) and contributor(s) and not of MDPI and/or the editor(s). MDPI and/or the editor(s) disclaim responsibility for any injury to people or property resulting from any ideas, methods, instructions or products referred to in the content. |
© 2025 by the authors. Licensee MDPI, Basel, Switzerland. This article is an open access article distributed under the terms and conditions of the Creative Commons Attribution (CC BY) license (https://creativecommons.org/licenses/by/4.0/).