Article

Effects of Stocking Density on Phytoplankton Community and Water Quality in Polyculture Ponds of Tegillarca granosa and Litopenaeus vannamei

by
Jing He
1,2,
Lin He
2,
Zhihua Lin
2,* and
Yongjian Xu
1,*
1
School of Marine Sciences, Ningbo University, Ningbo 315211, China
2
Ninghai Institute of Maricultue Breeding and Seed Industry, Zhejiang Wanli University, Ninghai 315604, China
*
Authors to whom correspondence should be addressed.
Fishes 2025, 10(5), 222; https://doi.org/10.3390/fishes10050222
Submission received: 8 March 2025 / Revised: 5 May 2025 / Accepted: 9 May 2025 / Published: 12 May 2025
(This article belongs to the Section Sustainable Aquaculture)

Abstract

This study investigated the effects of culture density on the phytoplankton communities in an integrated culture model of the blood clam Tegillarca granosa and Pacific white shrimp Litopenaeus vannamei. Two treatments were set up: L (L. vannamei 18 ind/m2, T. granosa 33 ind/m2) and H (L. vannamei 36 ind/m2, T. granosa 66 ind/m2). The management methods were the same during the experimental period, and the feed intake was determined according to L. vannamei. The results showed that there were more than 38 species of phytoplankton in the ponds, belonging to six phyla and 28 genera; the diversity index of the phytoplankton was higher in the early stage of the experiment and lower in the later stage; the average biomass of phytoplankton was 21.74 × 10⁴ ind/L; and the culture density had no significant effect on water quality. This study showed that a reasonable increase in culture density would not cause significant adverse effects on the environment. It is possible to increase the stocking density of shrimp with the mollusk without causing inadequate conditions for the phytoplankton community and water quality.
Key Contribution: The results showed that a reasonable increase in culture density of Tegillarca granosa and Litopenaeus vannamei would not cause more adverse effects on the water quality.

1. Introduction

Integrated multi-trophic aquaculture (IMTA) is an aquaculture strategy that incorporates species from different trophic levels within a single system, aiming to achieve both ecological sustainability and economic viability [1]. The fundamental principle of IMTA lies in the efficient reutilization of nutrients: waste produced by one species is utilized as a resource by another, thereby enhancing nutrient cycling within the system and reducing environmental burdens. Initially developed for land-based aquaculture systems, IMTA has been successfully extended to open-water environments. In these marine systems, phytoplankton, as primary producers, play a pivotal role in the biogeochemical cycling of carbon (C), nitrogen (N), and silicon (Si) [1,2].
Existing studies have demonstrated that synergistic interactions among species at different trophic levels in IMTA systems contribute significantly to water quality improvement. Cultured bivalves, by actively pumping water through their filtering apparatus, are capable of capturing particles larger than 4 μm with near 100% efficiency at optimal filtration rates of 6–11 L·h⁻1·g⁻1 dry weight [3]. Benthic suspension feeders have been shown to exert substantial top-down control over phytoplankton populations in well-defined coastal waters, thereby modulating primary producer abundance and enhancing ecosystem stability [4]. Furthermore, bivalves can markedly reduce concentrations of inorganic nitrogen (NH4⁺ and NO3⁻) and phosphate in the water column through their filtration activities, while also promoting the abundance of ammonia-oxidizing bacteria (AOB) and the expression of denitrification-associated genes such as nosZ in sediments [5]. In addition, macroalgae such as Ulva lactuca can absorb up to 41.4% of nitrate and 90.8% of ammonium nitrogen from the water [6]. Organic particulates released from finfish farming have also been shown to alter phytoplankton community composition, often increasing the relative dominance of Chlorophyta (green algae) [7]. Through these nutrient-complementary mechanisms, IMTA systems can reduce ammonia nitrogen emissions by up to 75% and improve energy use efficiency by 14% compared to conventional monoculture systems [8].
China has been an early adopter of IMTA practices. In the 1990s, Zhejiang Province pioneered seawater pond-based integrated shrimp-bivalve aquaculture technology, achieving substantial economic gains in intertidal bivalve farming through the ecological synergy between the blood clam (T. granosa) and the Pacific white shrimp (L. vannamei) [9]. As a filter-feeding bivalve, T. granosa regulates aquatic environments by removing 60–80% of suspended particles, including plankton and organic detritus [10,11]. Studies demonstrate that filter-feeding bivalves exert dual regulatory effects on phytoplankton communities: (1) biomass reduction, exemplified by mussels lowering chlorophyll-a (Chl-a) concentrations by 30–50%, and (2) structural modification via selective feeding, such as oysters promoting diatom dominance over dinoflagellates under phosphorus-limited conditions [2,11]. Furthermore, functional group differences influence phytoplankton diversity, with filter-feeding fish potentially enhancing diversity indices [12], whereas benthic bivalves may reduce diversity through competitive exclusion [11].
While IMTA ecological benefits—such as 20–40% improvements in nitrogen and phosphorus removal—have been validated in bay-based cage systems [5], the mechanistic underpinnings in land-based pond systems remain poorly understood. Current research predominantly focuses on single-species filtration effects, lacking dynamic analyses of multi-trophic synergies, particularly regarding water quality-biological community responses across stocking density gradients [13]. This study investigates the impacts of varying stocking densities on water quality parameters and phytoplankton community structure within a T. granosaL. vannamei integrated aquaculture system, aiming to optimize blood clam cultivation practices through density-dependent ecological regulation.

2. Materials and Methods

2.1. Experimental Conditions

The experimental site was located in Xianxiang Experimental Base, Ningbo City, Zhejiang Province (121°48′ 43 ″ E, 29°40′30″ N). Six 550 m2 earthen ponds were selected as experimental ponds, which were divided into a low-density group (L) and a high-density group (H), with three replicates in each group. In the low-density group, each pond was stocked with 18,000 T. granosa and 10,000 L. vannamei, which are 36,000 and 20,000 in the high-density group. The initial weights of T. granosa and L. vannamei were 5.73 g and 1.92 g, respectively; the seedlings of T. granosa and L. vannamei were purchased from Ningde, Fujian Province, and Ningbo, Zhejiang Province, respectively.

2.2. Methods of Sample Collection and Measurement of Environmental Parameters

2.2.1. Measurement of Environmental Parameters

Water temperature, pH, and dissolved oxygen were collected on-site using a multi-parameter water quality analyzer (Hach HQ30d, Loveland, CO, USA), and pond water transparency was measured using a transparency disk.
A total of five water sampling points were set up at the midpoint of the four sides of the pond, 2 m from the shore, and in the center of the pond, and 2 L water samples were collected at 30 cm underwater at each point, which were evenly mixed and used for the determination of ammoniacal nitrogen (NH4+), nitrate nitrogen (NO3), nitrite nitrogen (NO2), phosphate (PO43−), total nitrogen (TN), total phosphorus (TP), and iron (Fe). The samples were collected, stored, transported, and processed with reference to the “Marine Monitoring Specification Part 4: Seawater Analysis” (GB17378.4-2007) [14]. The samples were filtered using a 0.45 μm cellulose acetate microporous filter for the detection of ammonia, nitrate, nitrite, and soluble reactive phosphorus.

2.2.2. Collection of Phytoplankton Samples

Phytoplankton samples were collected from 10 June to 10 October, seven times in total. A 5 L water sample was taken from the site, concentrated, and fixed in Ruggier’s solution for phytoplankton detection. The sample was precipitated in a separatory funnel for 48 h and concentrated to 100 mL to be examined. The phytoplankton species and biomass were determined according to the literature.
Quantitative analysis: Before testing the samples, make sure the samples were well shaken, take 1 mL by pipette, put it into a 1 mL phytoplankton counting frame, and repeat the results twice to take the average value. The dominant species were identified to species as far as possible [15].
Qualitative analysis: Refer to relevant materials for species identification. Observe 3–5 samples per sample until no new species appear in the last observation.

2.3. Data Analysis

Calculation of biomass: Volume was calculated based on similar geometric shapes corresponding to the shapes of phytoplankton.
Abundance (ind/mL): D = n/v;
where n is number of individuals and v is volume of water sampled.
Shannon–Wiener Diversity Index: H′ = −∑PilnPi
where Pi represents the proportion of individuals belonging to the i-th species, Pi = Ni/N, Ni is the number of individuals of the i-th species, and N is the total number of individuals observed.
Simpson Diversity Index: D = (S − 1)/lnN
where S is the total number of species in the community and N is the total number of all individuals.
Pielou evenness index: J′ = H′/Hmax
where H′ is the diversity index of the species that was actually observed, Hmax is the maximum diversity index of the species, and Hmax = lnS (S is the total number of species in the community).
Advantage: Y = ni/N × fi
where ni is the number of individuals of species I, and fi is the frequency of occurrence of the species in the area, and N is the total number of all individuals.
Among them, the number of individuals accounted for more than 10% of the total number of species as dominant species, more than 40% of the total number as strongly dominant species, 1–10% of the total number as common species, and less than 1% of the total number as rare species [16].
Differences among treatments were analyzed using one-way ANOVA and independent samples t-tests. The biomass of dominant phytoplankton species with Y > 0.01 (dominant species) was subjected to Detrended Correspondence Analysis (DCA), and then the relationships between phytoplankton biomass and ammoniacal nitrogen, nitrite nitrogen, nitrate nitrogen, reactive phosphorus, total nitrogen, total phosphorus, and Fe were evaluated by using Typical Correlation Analysis (CCA). The log lg (A+1) transformation was performed before data analysis. A value of p < 0.05 was assumed as the significance level of the difference. ANOVA t-tests were performed using SPSS 25.0 (IBM SPSS Statistics) software, and DCA and RDA were performed using Canoco for Windows 5.0 software.

3. Results

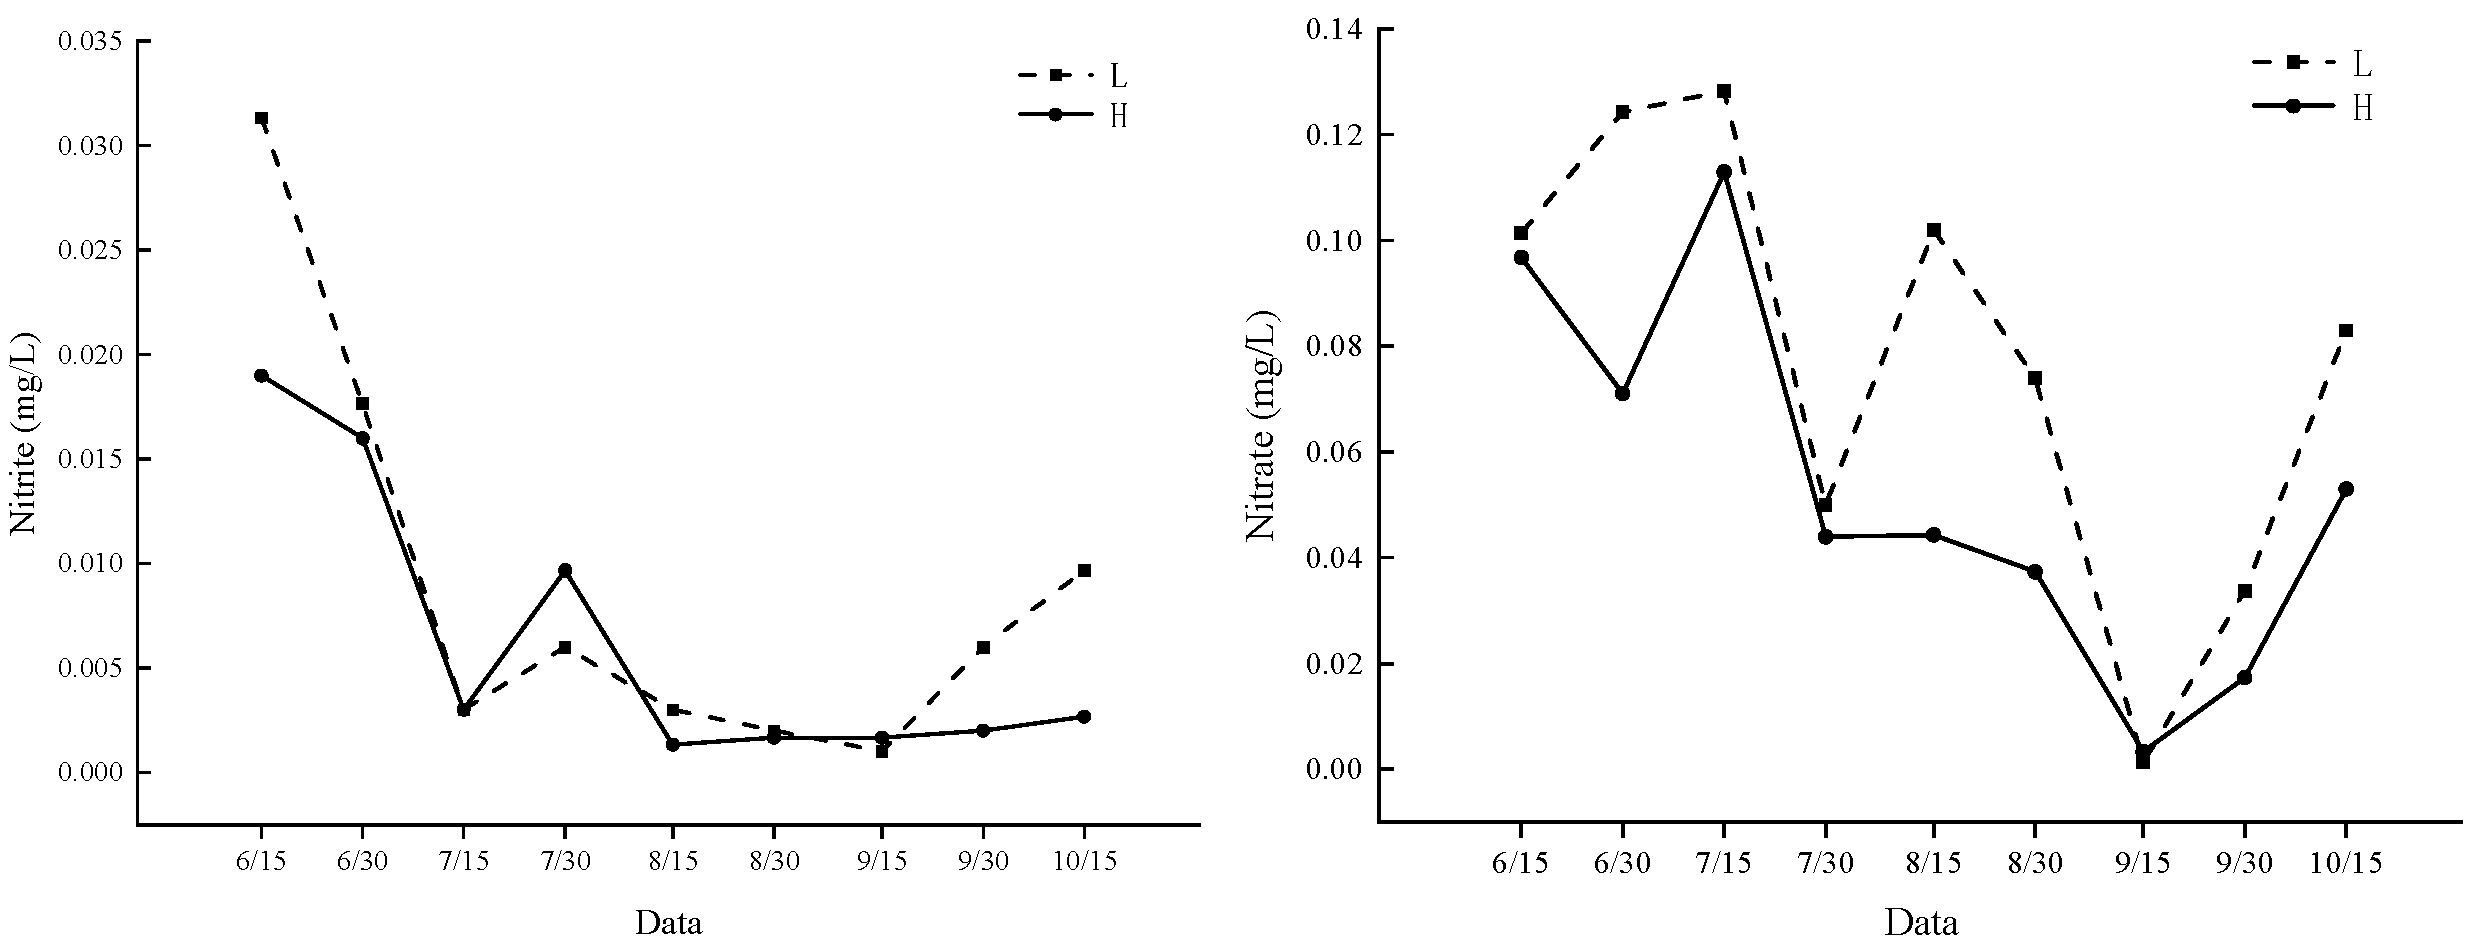
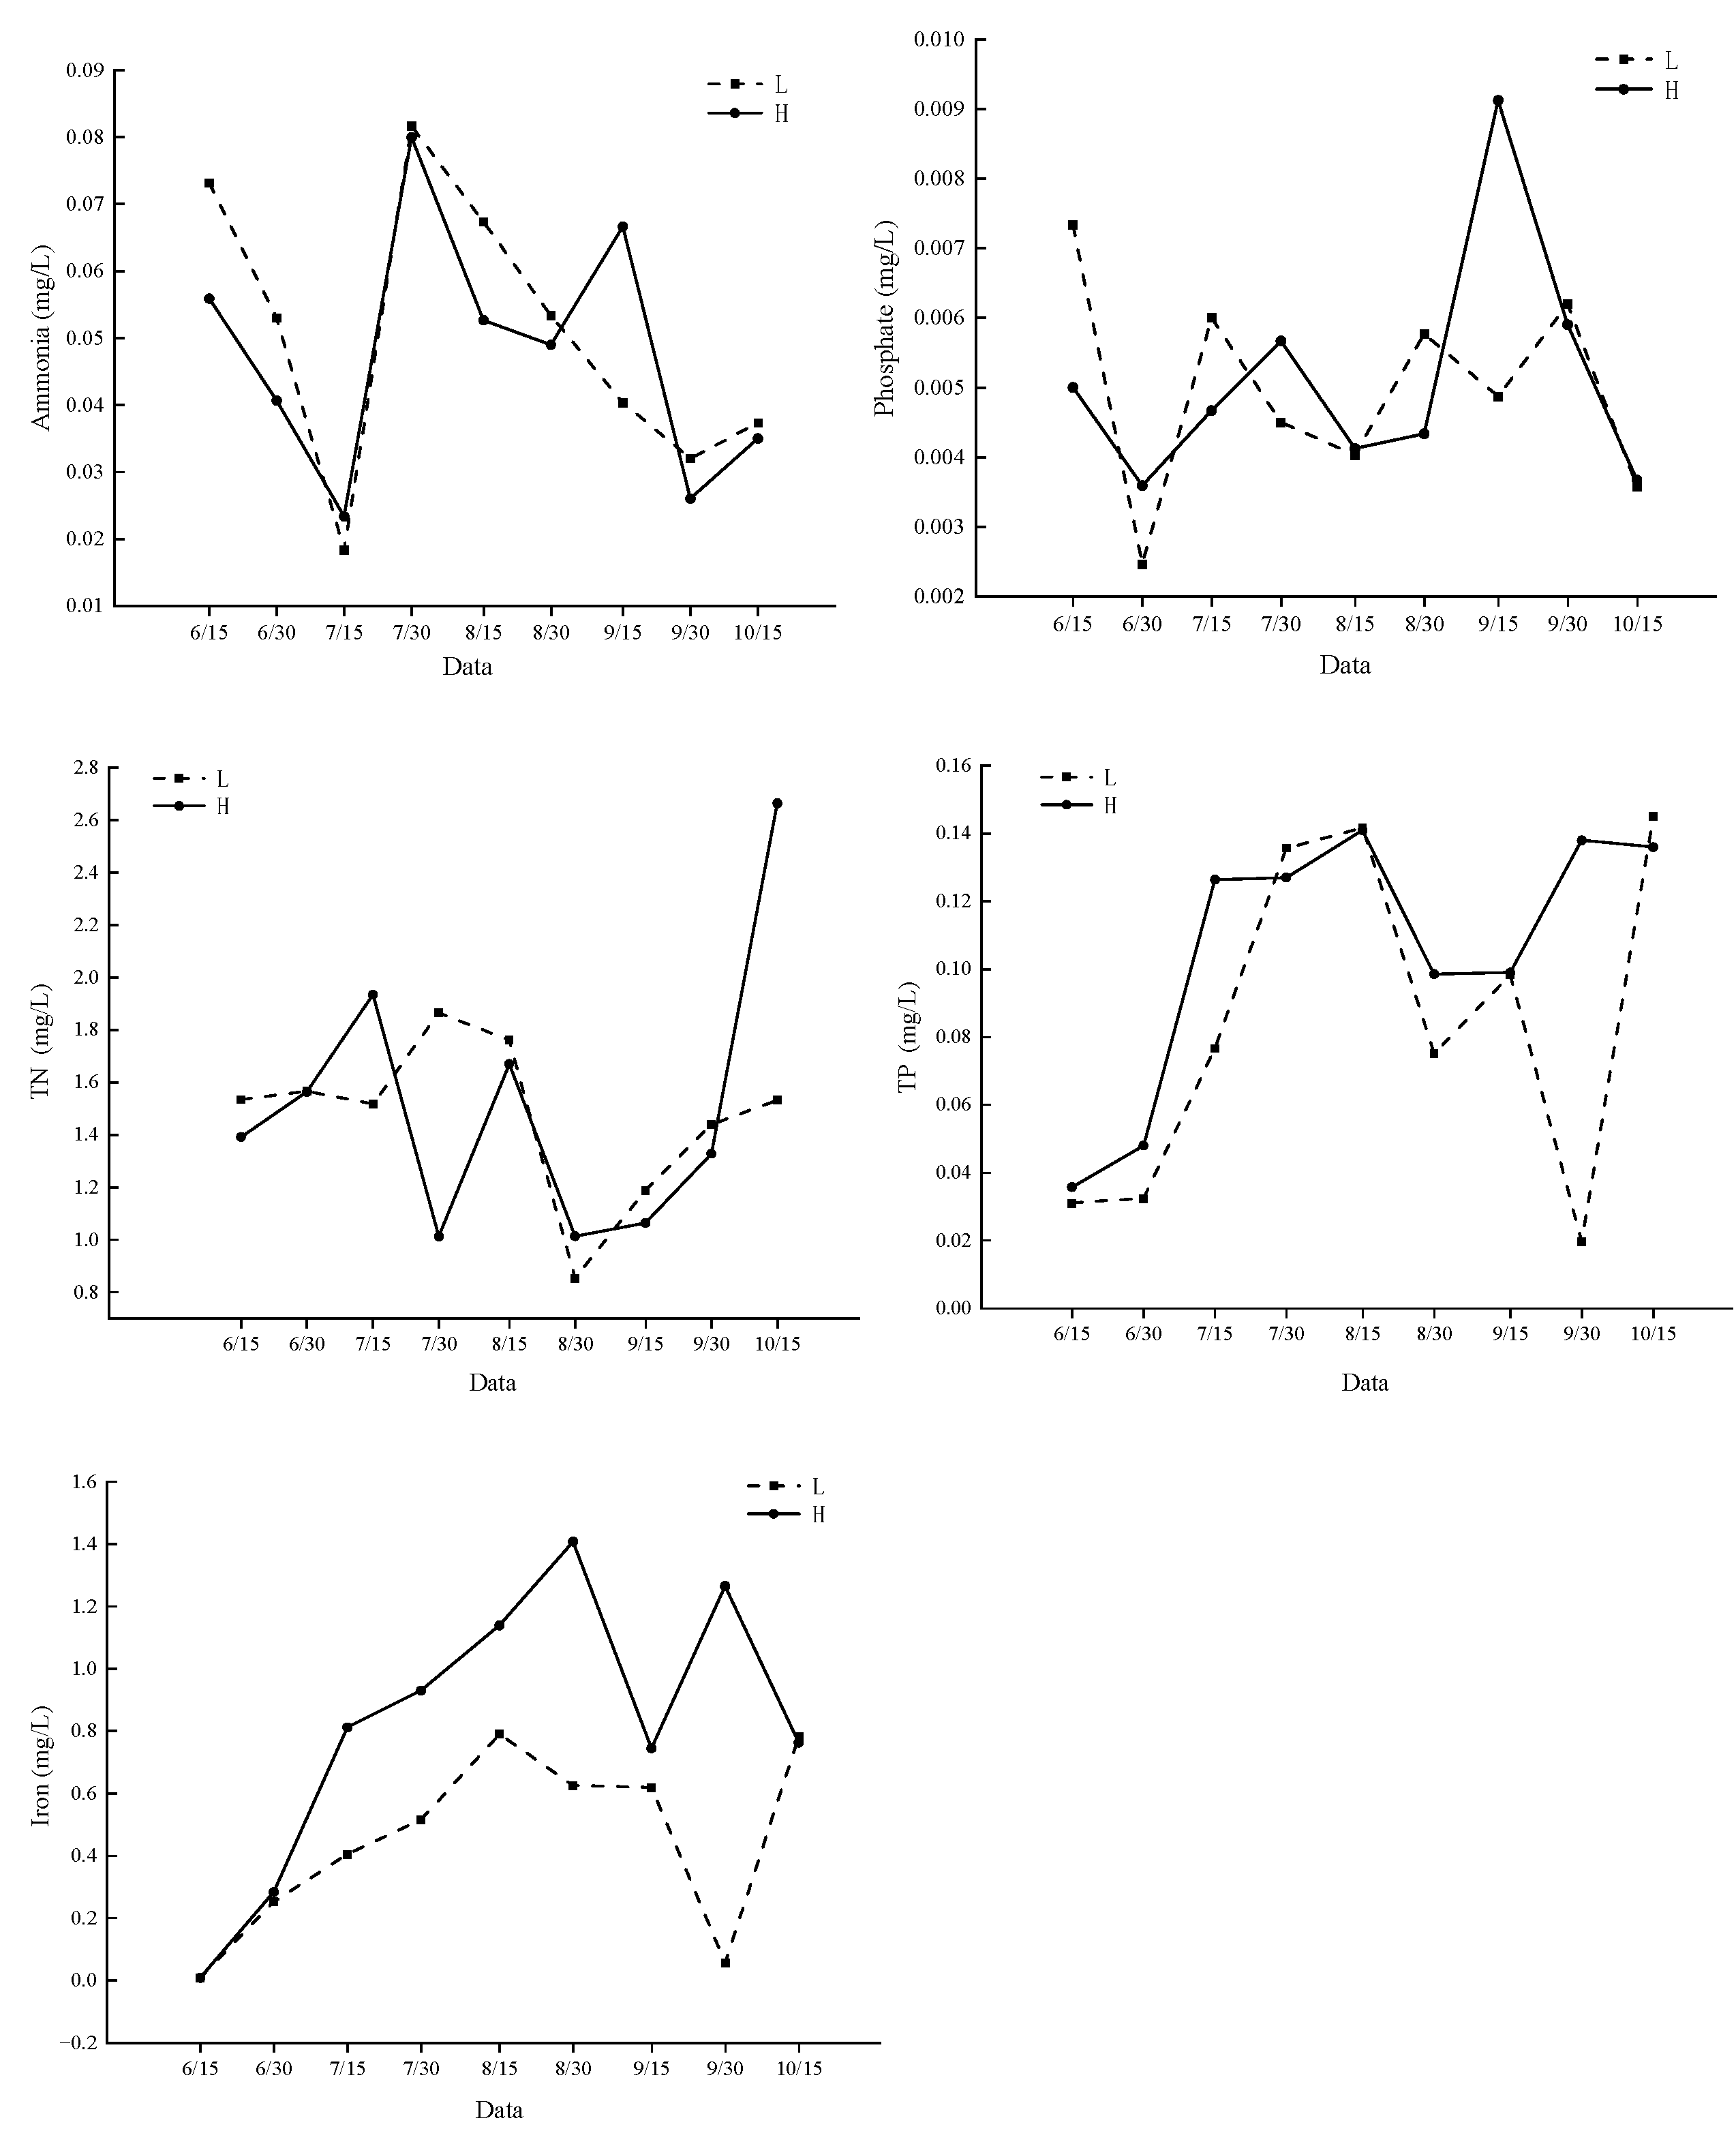
3.1. Water Quality Factors in Ponds

The nutrient concentrations in ponds with different stocking densities are presented in Table 1. Nitrite, nitrate, ammonia nitrogen, and inorganic phosphorus remained at relatively low levels. Analysis of variance (ANOVA) indicated that the iron concentration in the low-density (L) treatment (0.482 ± 0.335 mg/L) was significantly lower than that in the high-density (H) treatment (0.818 ± 0.565 mg/L), whereas no significant differences were observed between the two treatments for the other parameters. The physicochemical parameters measured in situ are summarized in Table 2. No significant differences were detected between the two groups, and the mean values of each parameter exhibited minimal variation throughout the culture period.
Temporal variations in nutrient parameters during the experimental period are illustrated in Figure 1. ANOVA results demonstrated significant differences in nutrient concentrations across different sampling times (p < 0.05). Nitrite levels were relatively high at the beginning of the culture period and declined thereafter. Nitrate concentrations were consistently higher in the low-density (L) treatment than in the high-density (H) treatment. Ammonia nitrogen exhibited a similar temporal trend in both groups. Phosphate concentrations also showed a comparable pattern between the two treatments, with the exception of 15 September, when the high-density group (H) exhibited higher values than the low-density group (L). Total nitrogen concentrations fluctuated more markedly in the high-density treatment (H) compared to the low-density group (L), with notable differences observed on 30 July and 15 October. The trend in total phosphorus concentrations was generally consistent between the two groups, except on 30 September, when values in the low-density treatment (L) were lower than those in the high-density group (H). Iron concentrations differed significantly, with consistently higher levels observed in the high-density treatment (H) throughout the culture period.
The nitrogen-to-phosphorus (N:P) ratios over time for the two stocking density treatments are presented in Table 3. Overall, the low-density (L) exhibited a higher average N:P ratio (27.89 ± 23.07) compared to the high-density (H) (17.44 ± 11.08). In group L, the N:P ratio demonstrated substantial temporal fluctuations, with relatively high values in the early phase of the culture period. A sharp decline followed in mid-July (19.82) and continued through August (11.37 on 30 August) before peaking abruptly on 30 September (73.17). A final decline was observed by 15 October (10.56). Group H, by contrast, displayed more stable N:P ratios throughout the culture period. The ratio decreased from 39.01 on 15 June to a minimum of 7.97 on 30 July, then fluctuated within a narrow range from August to September (10.28–11.84), with a modest increase noted on 15 October (19.59).

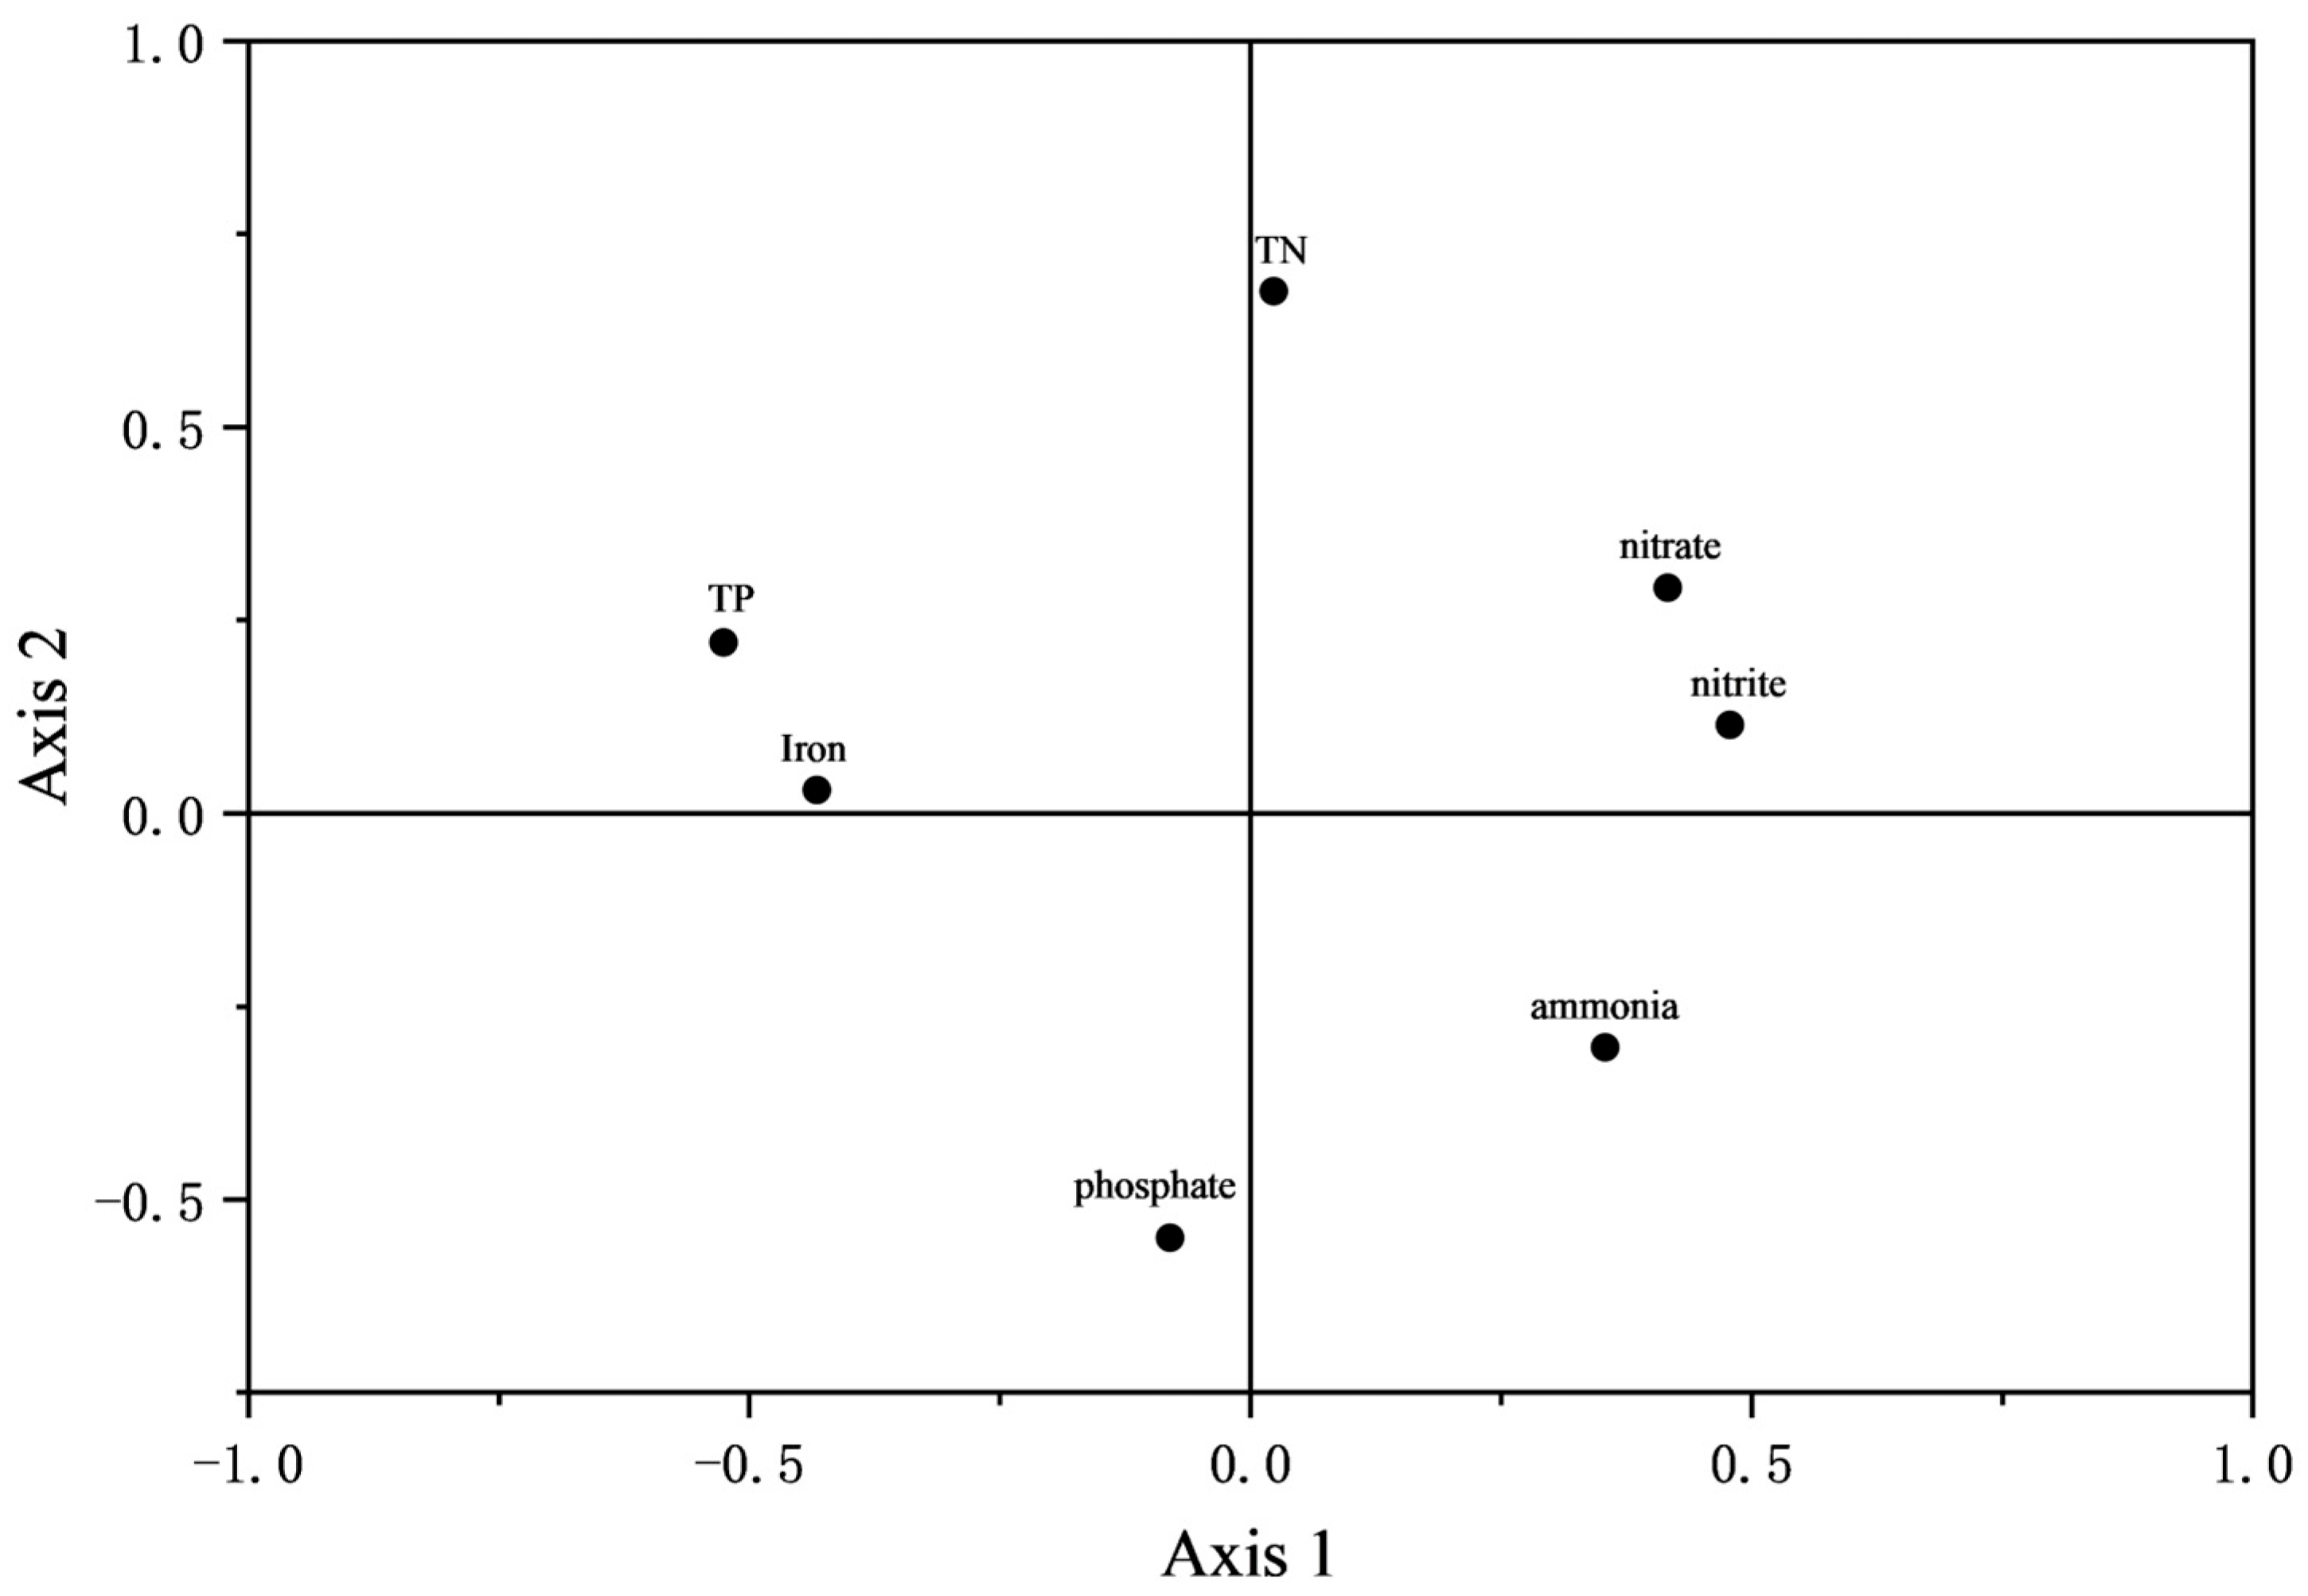
3.2. Water Quality Principal Component Analysis

In order to assess the water quality, seven parameters (nitrite, nitrate, ammoniacal nitrogen, inorganic phosphorus, total nitrogen, total phosphorus, and iron) were selected as independent variables for the principal component analysis, with a principal component greater than 1 being significant. As shown in Figure 2, the principal component analysis yielded three principal components, which cumulatively explained 75.29% of the variation in water quality. The first principal component (axis 1) had higher loading values for total phosphorus (0.555), iron (0.526), and nitrite (−0.435), while the second principal component (axis 2) had higher loading values for inorganic phosphorus (0.828), nitrate (0.360), and iron (0.284).

3.3. Phytoplankton Species Composition and Distribution of Dominant Species

During the experimental period, a total of six phyla, 28 genera, and 38 species of phytoplankton were identified in the experimental ponds. The phytoplankton richness is shown in Table 4. Among them, 17 genera and 20 species of diatoms accounted for 53%; six genera and seven species of Cyanobacteria accounted for 18%; five genera and five species of green algae accounted for 13%; two genera and three species of Dinophyta accounted for 8%; two genera and two species of Euglenophyta accounted for 5%; and one genus and one species of Cryptophyta accounted for 3%. Among them, the dominant species were Pleurosigma sp., Gymnodiniaceae sp., Glenodinium sp., Pleurosigma Formosum, Cyclotella sp., Navicular sp., Climacosphenia moniligera, and Cryptomonas sp.

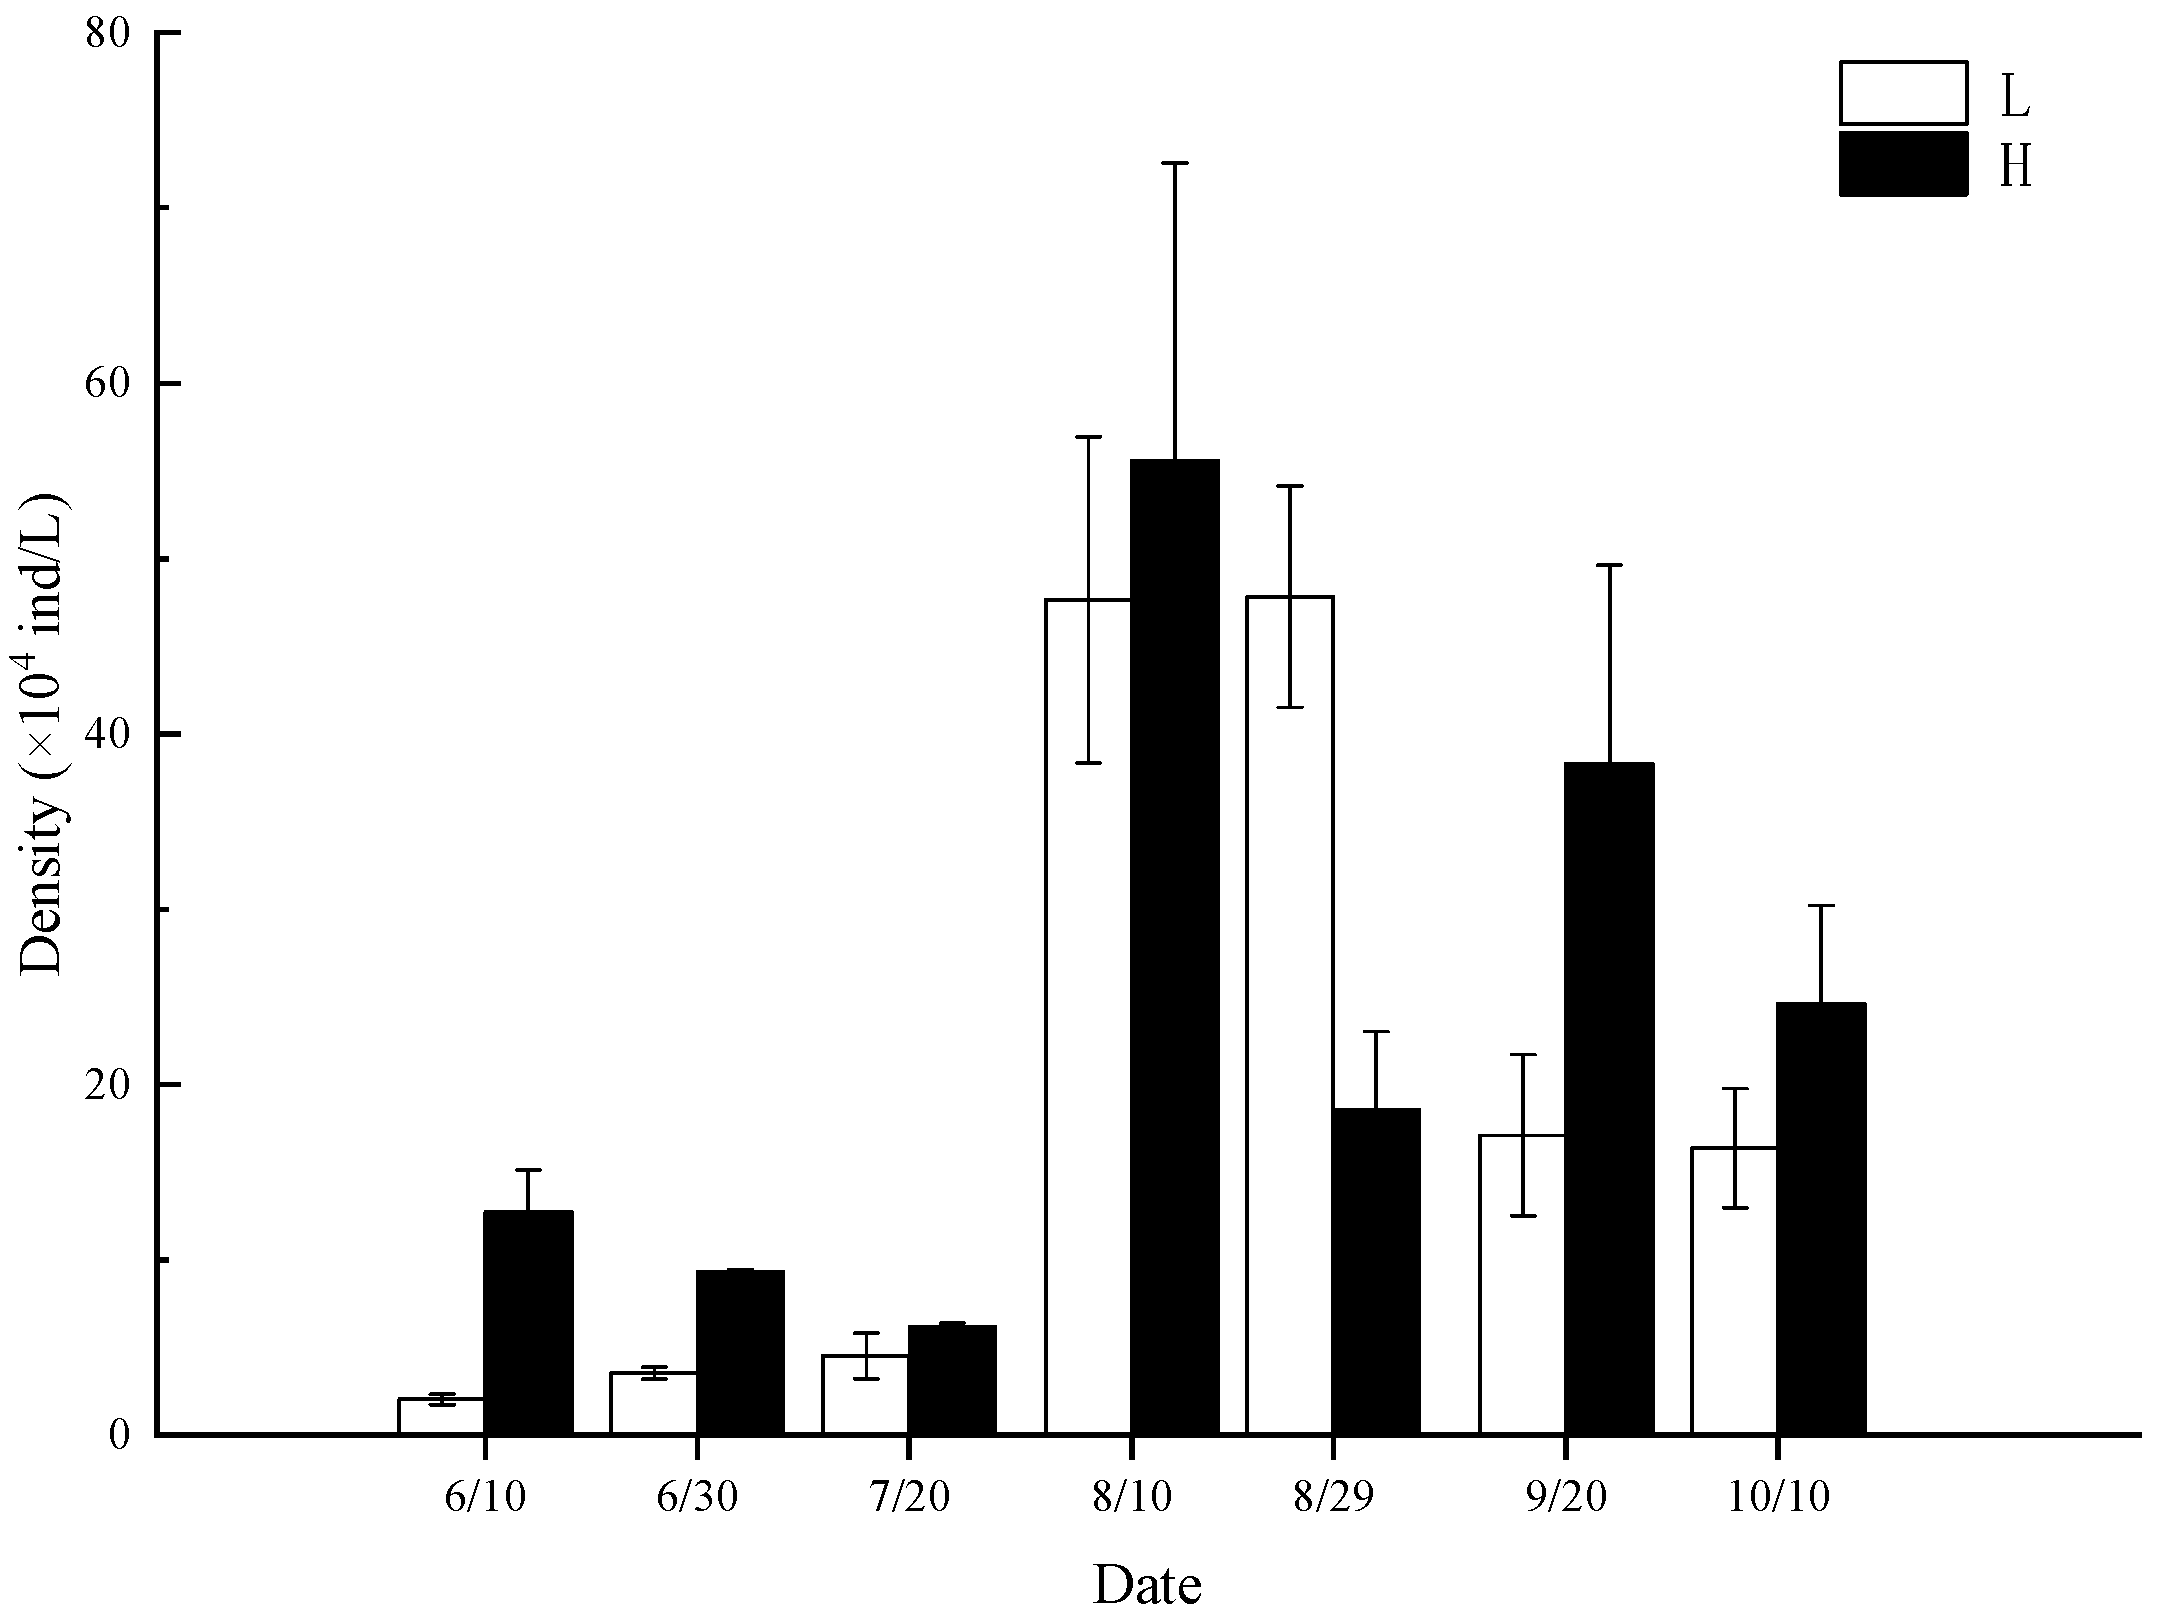
3.4. Changes in Abundance

The changes in phytoplankton abundance in different groups are shown in Figure 3. In the early stage of aquaculture, the phytoplankton abundance in both of the L and H groups was relatively low, and H was higher than L. In the middle and later stages of aquaculture, the phytoplankton abundance increased significantly when sampled on 10 August, reaching a maximum value of 55.58 × 10⁴ ind/L. After that, it gradually decreased. In the samples collected on 29 August, the abundance of L was higher than that of H. The average abundance of L was 19.87 × 10⁴ ind/L, and H was 23.61 × 10⁴ ind/L, which was higher than that of L.

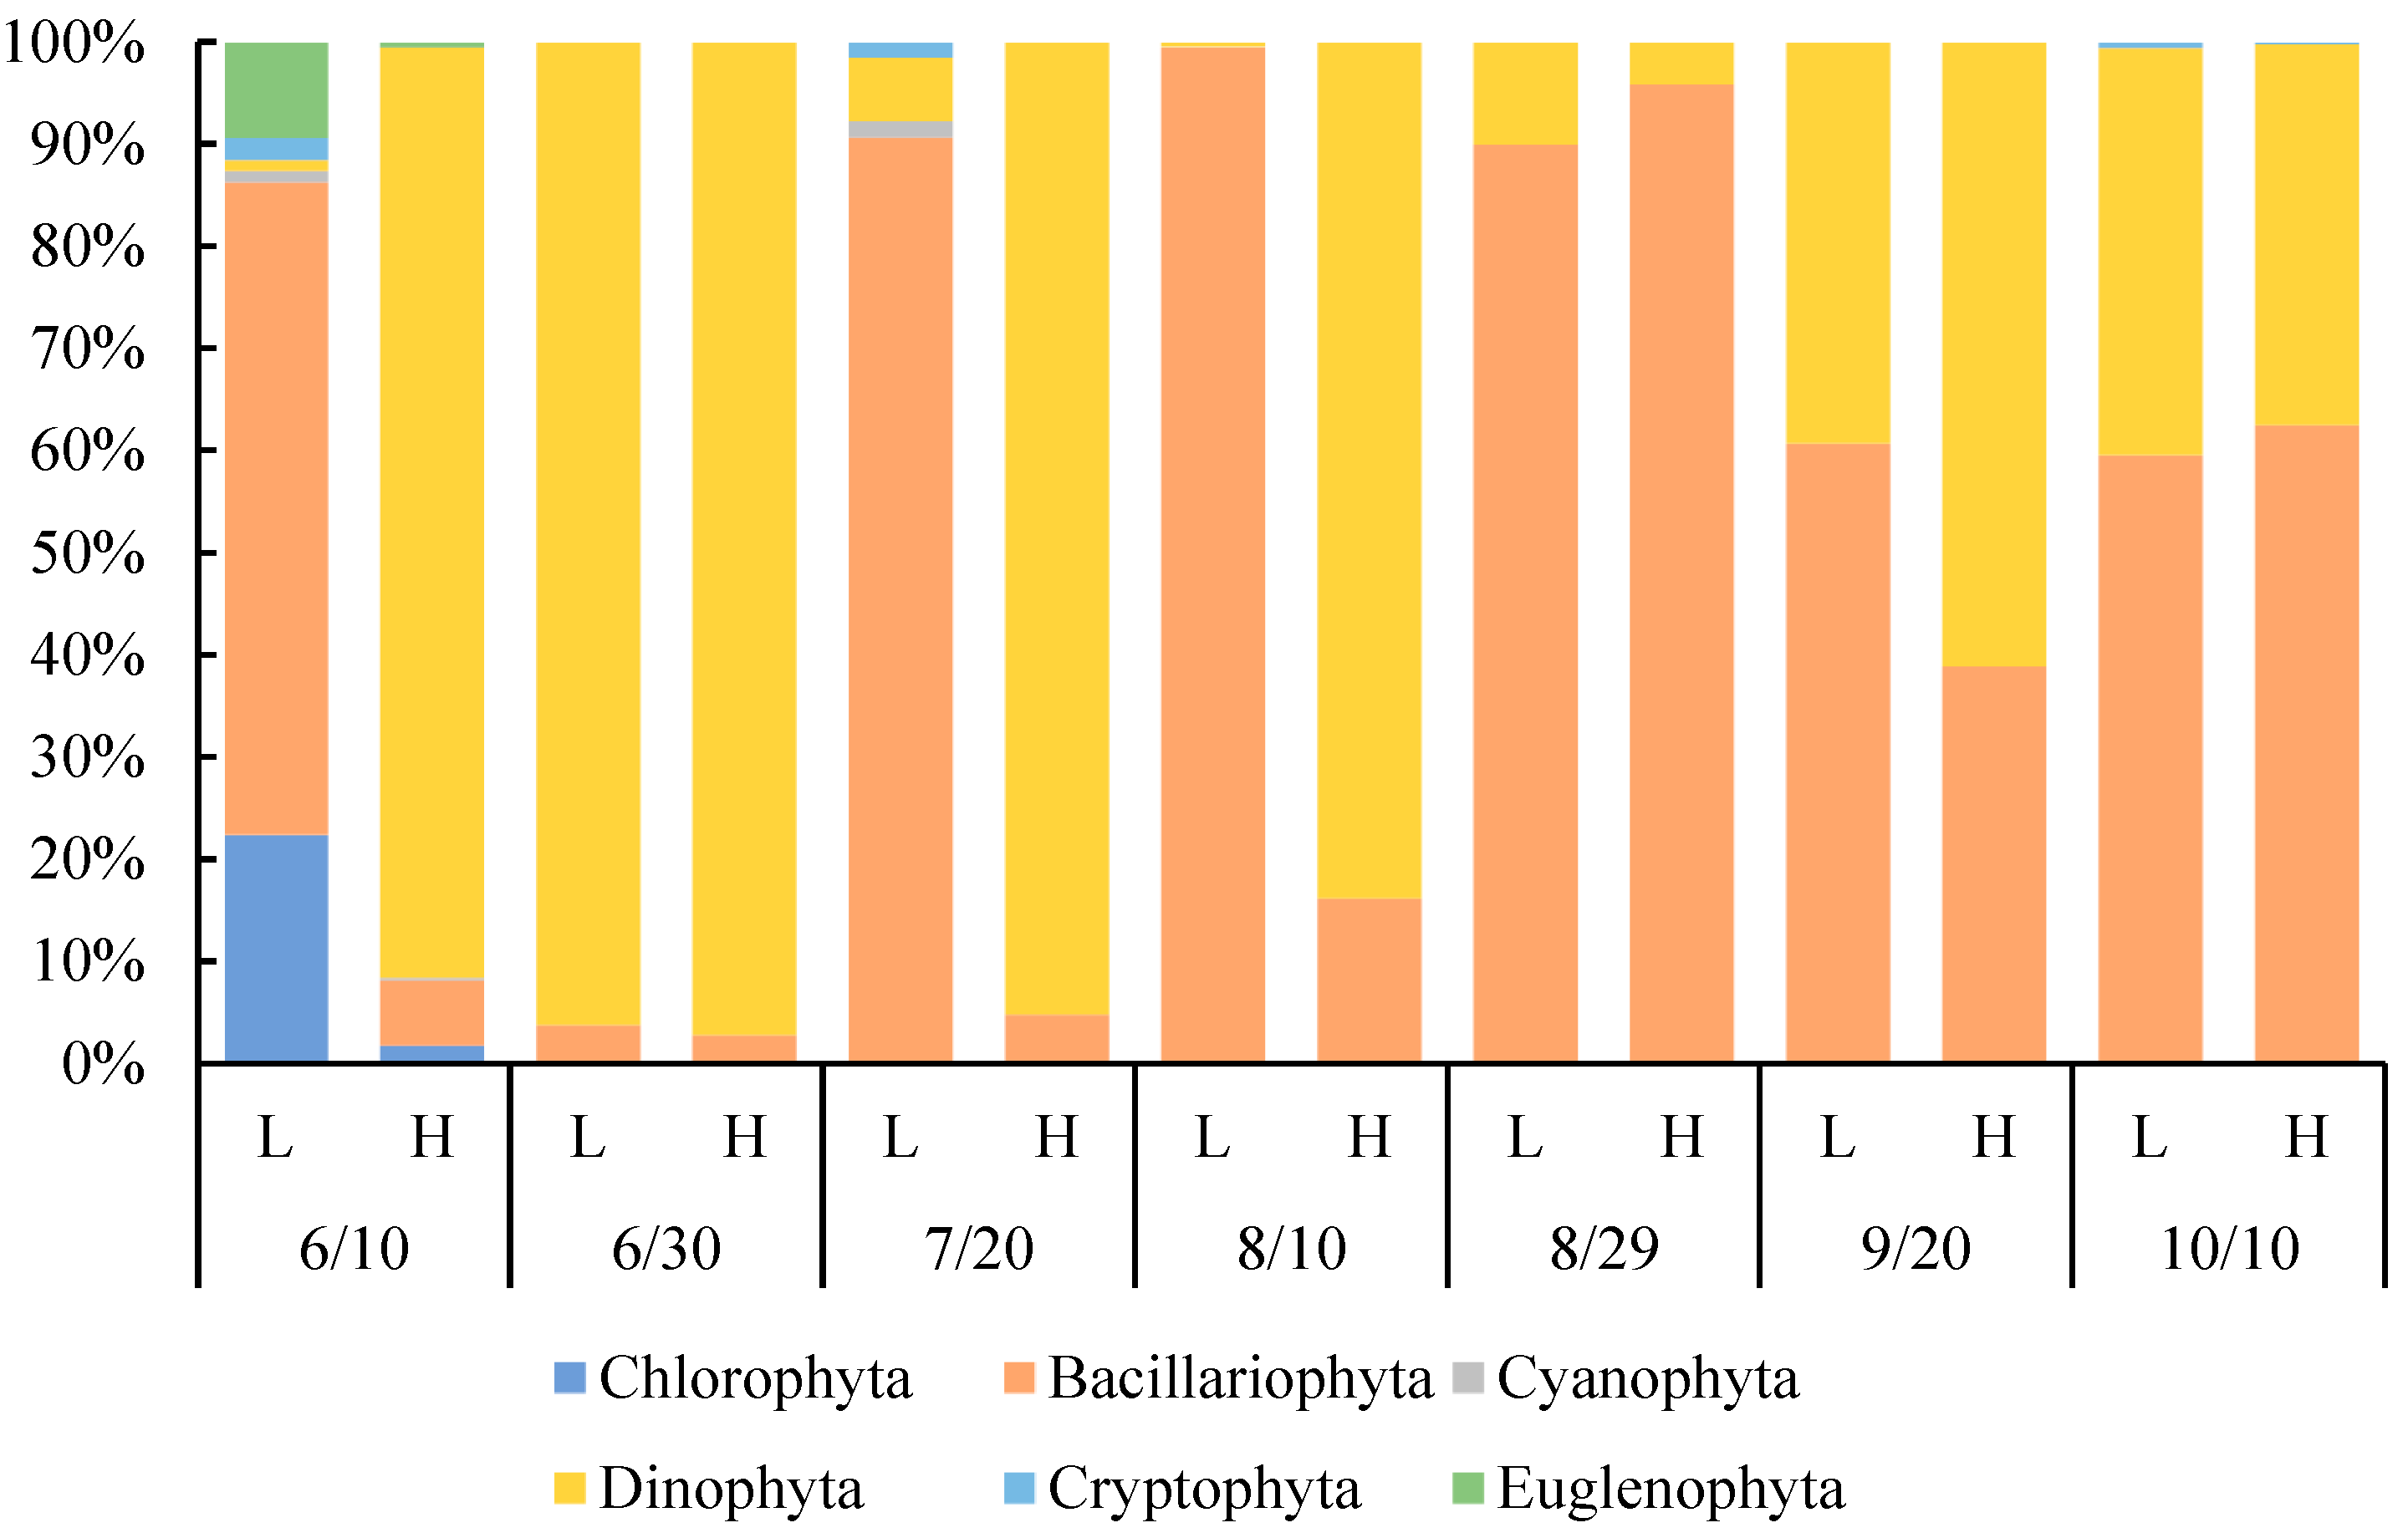
3.5. Changes in Species Composition

The percentage of phytoplankton composition in each group is shown in Figure 4. In the sampling on 10 June, L was mainly composed of diatoms and H was Dinophyta. Afterwards, Dinophyta became the dominant species. In the later stage of cultivation, diatoms gradually replaced Dinophyta as the main algae species. Overall, the phytoplankton species in the pond are mainly composed of diatoms and Dinophyta.

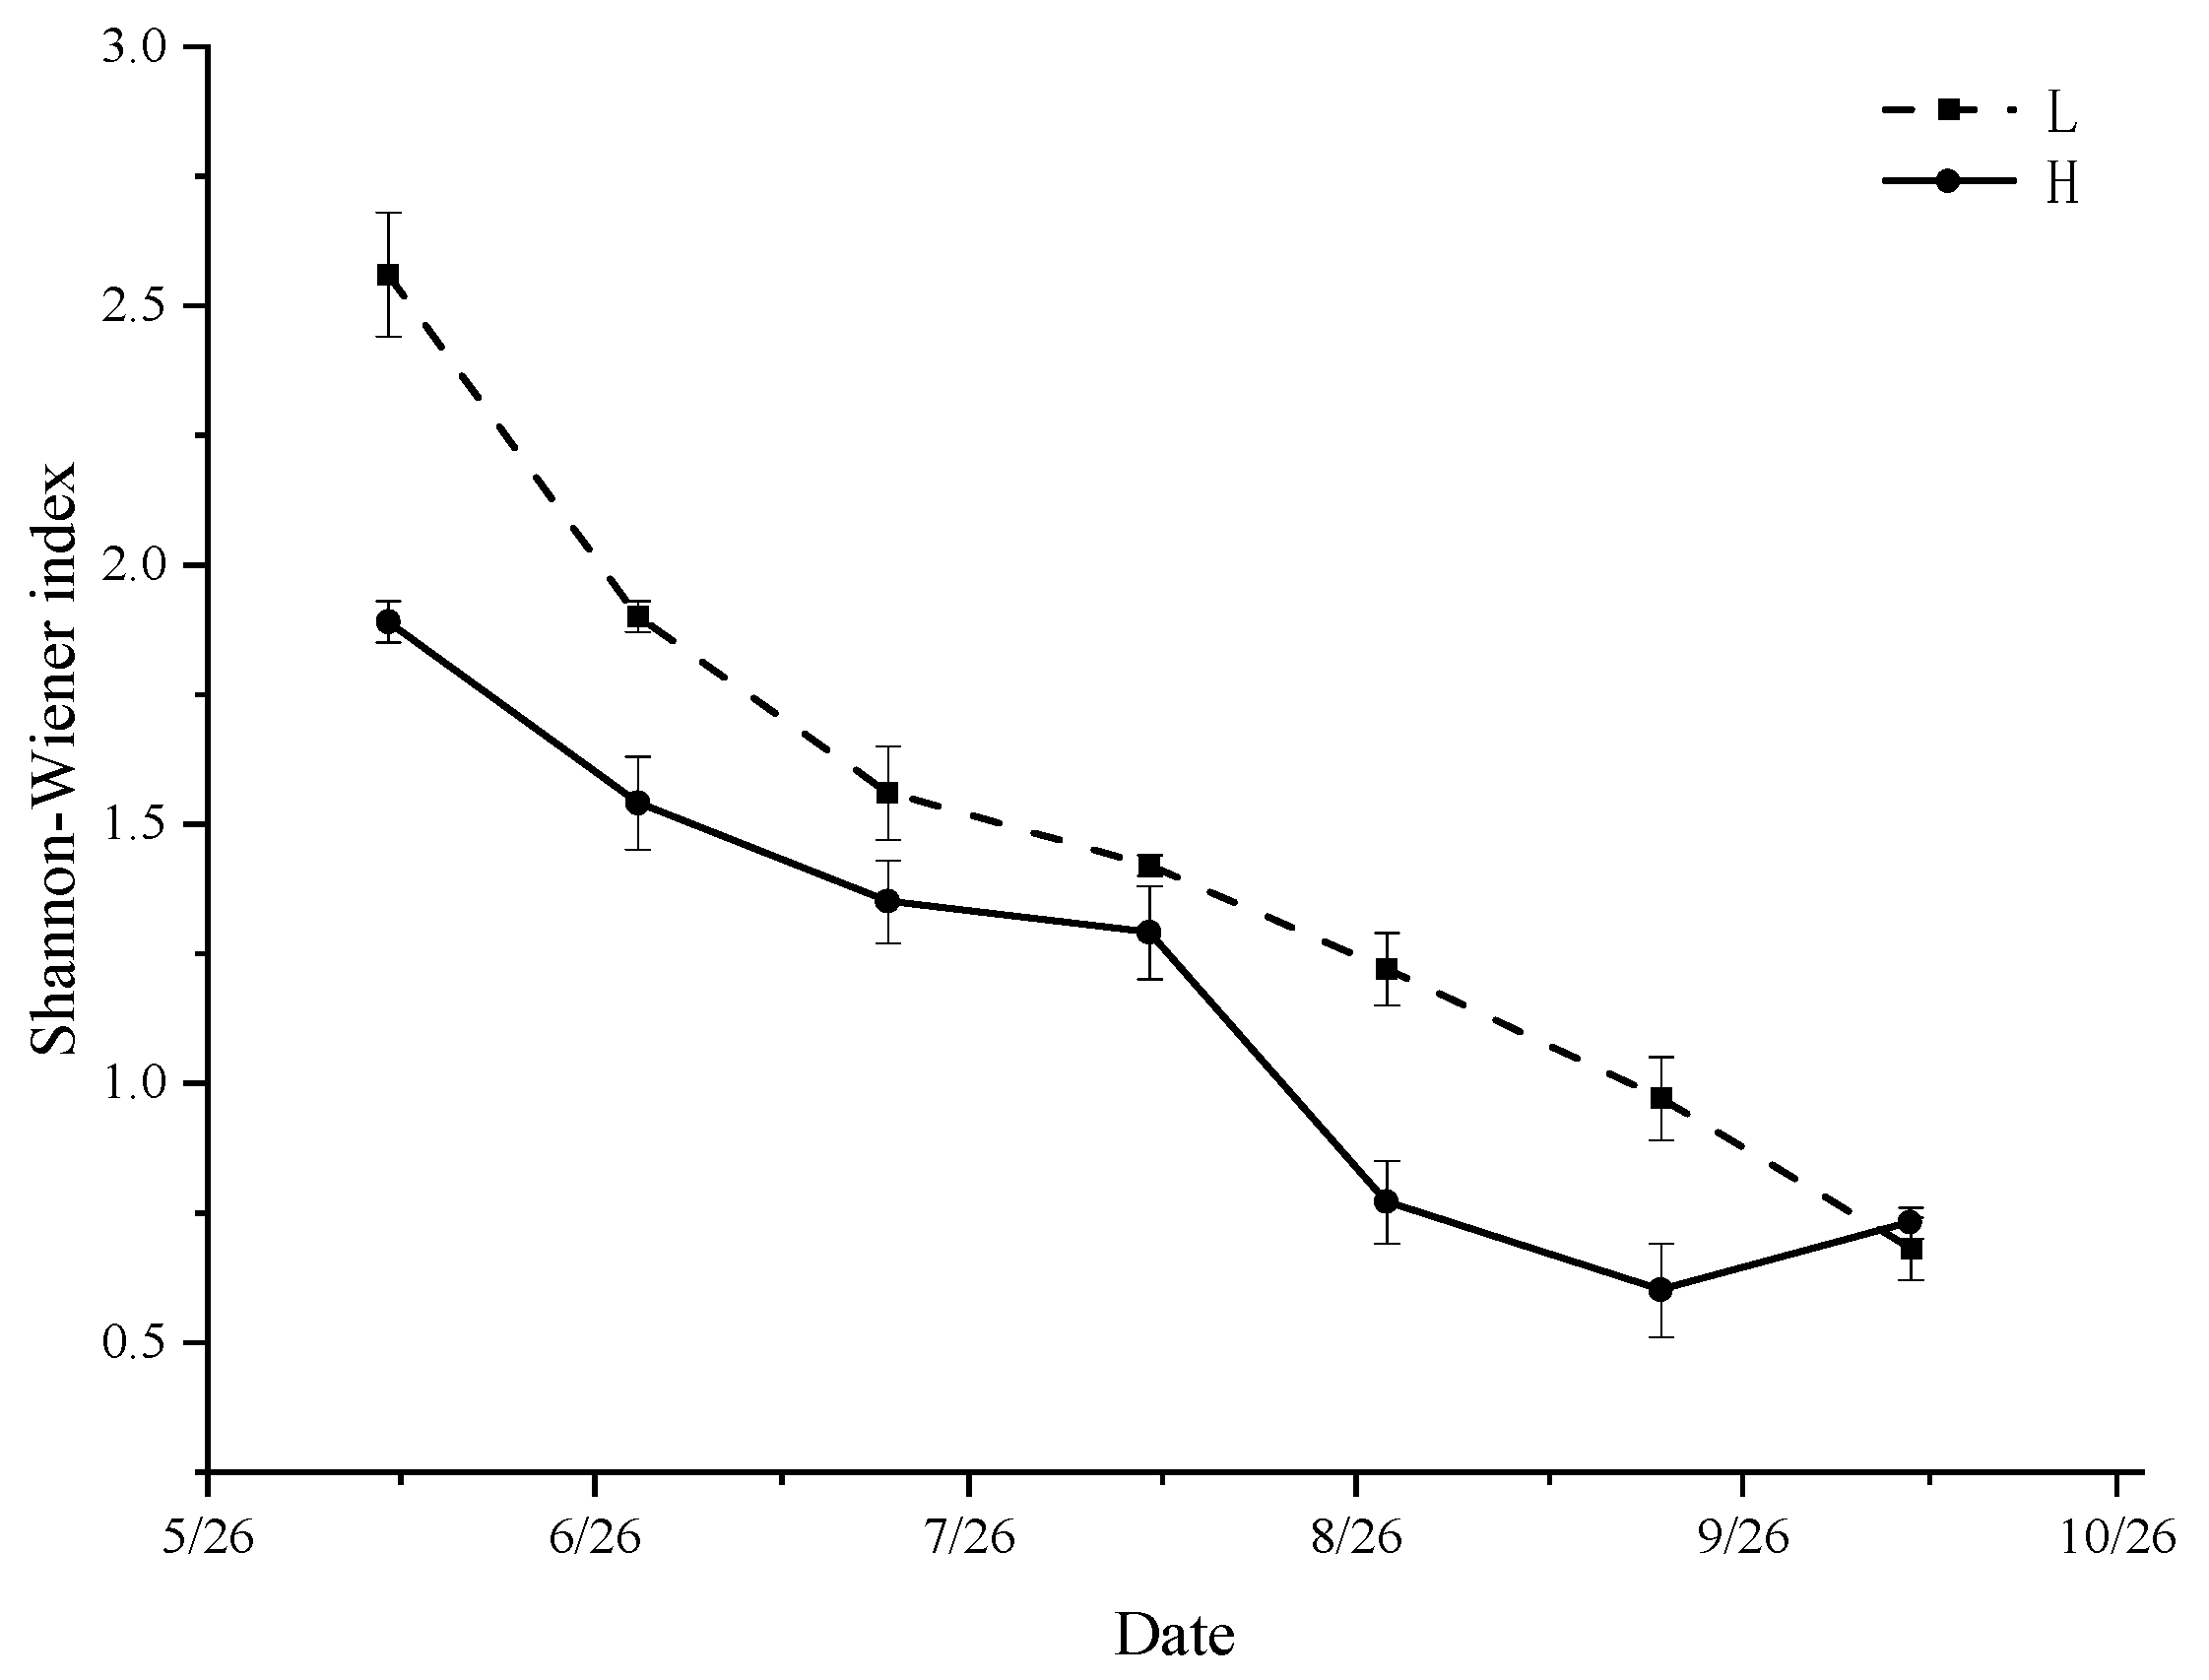
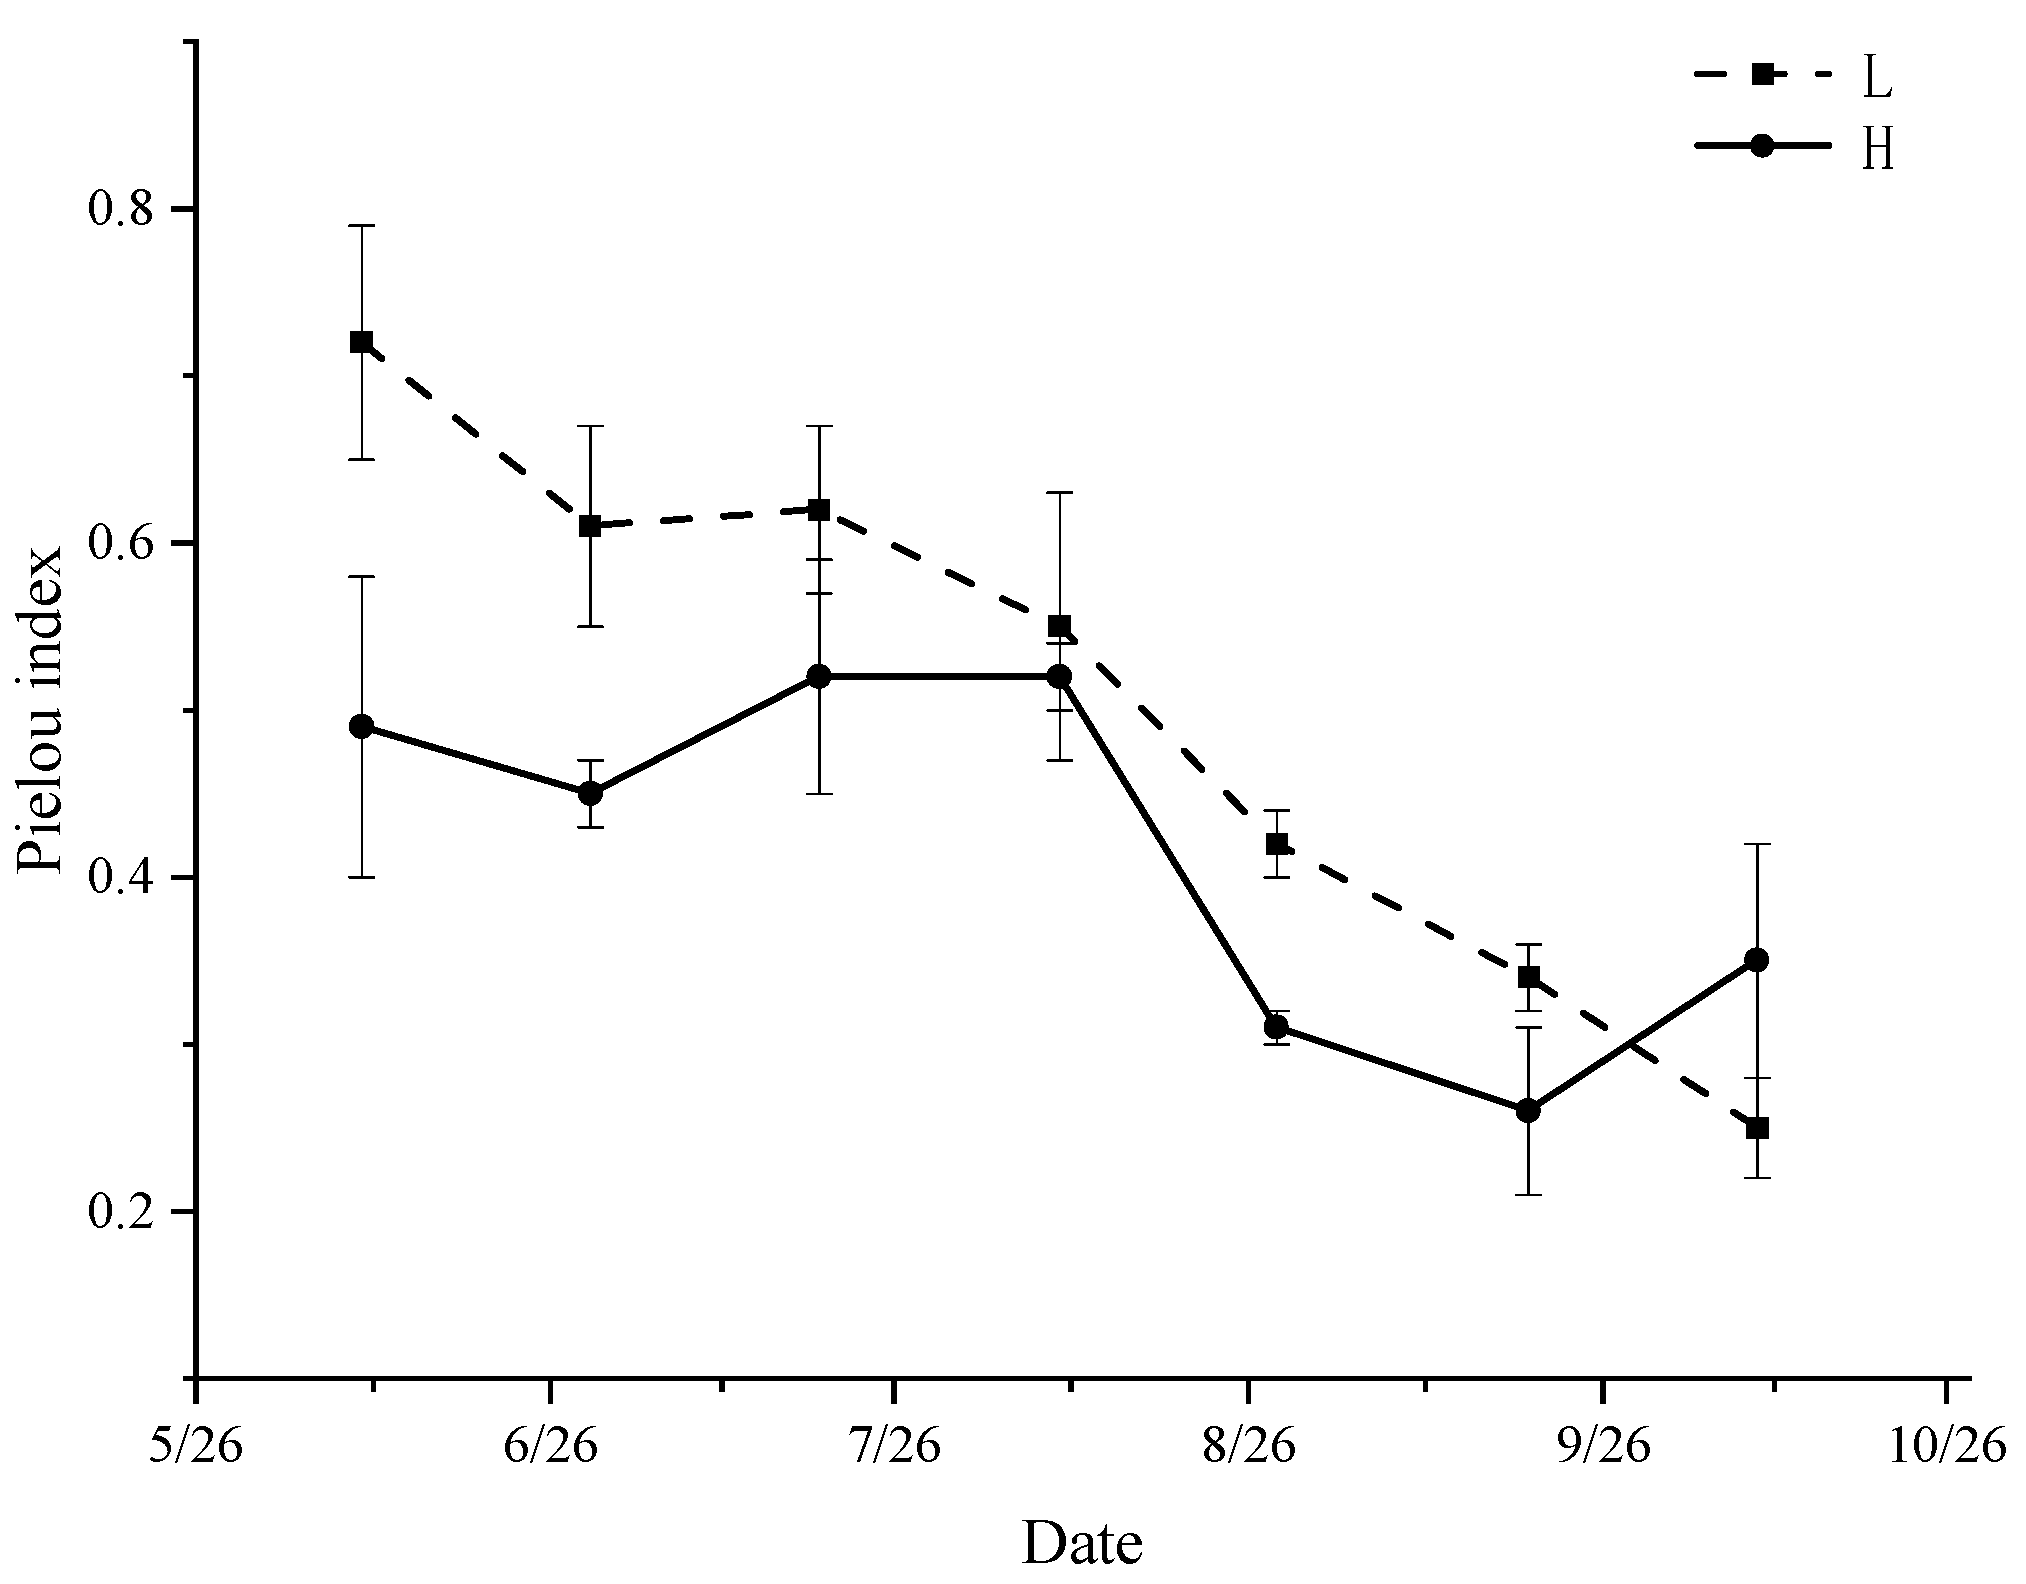
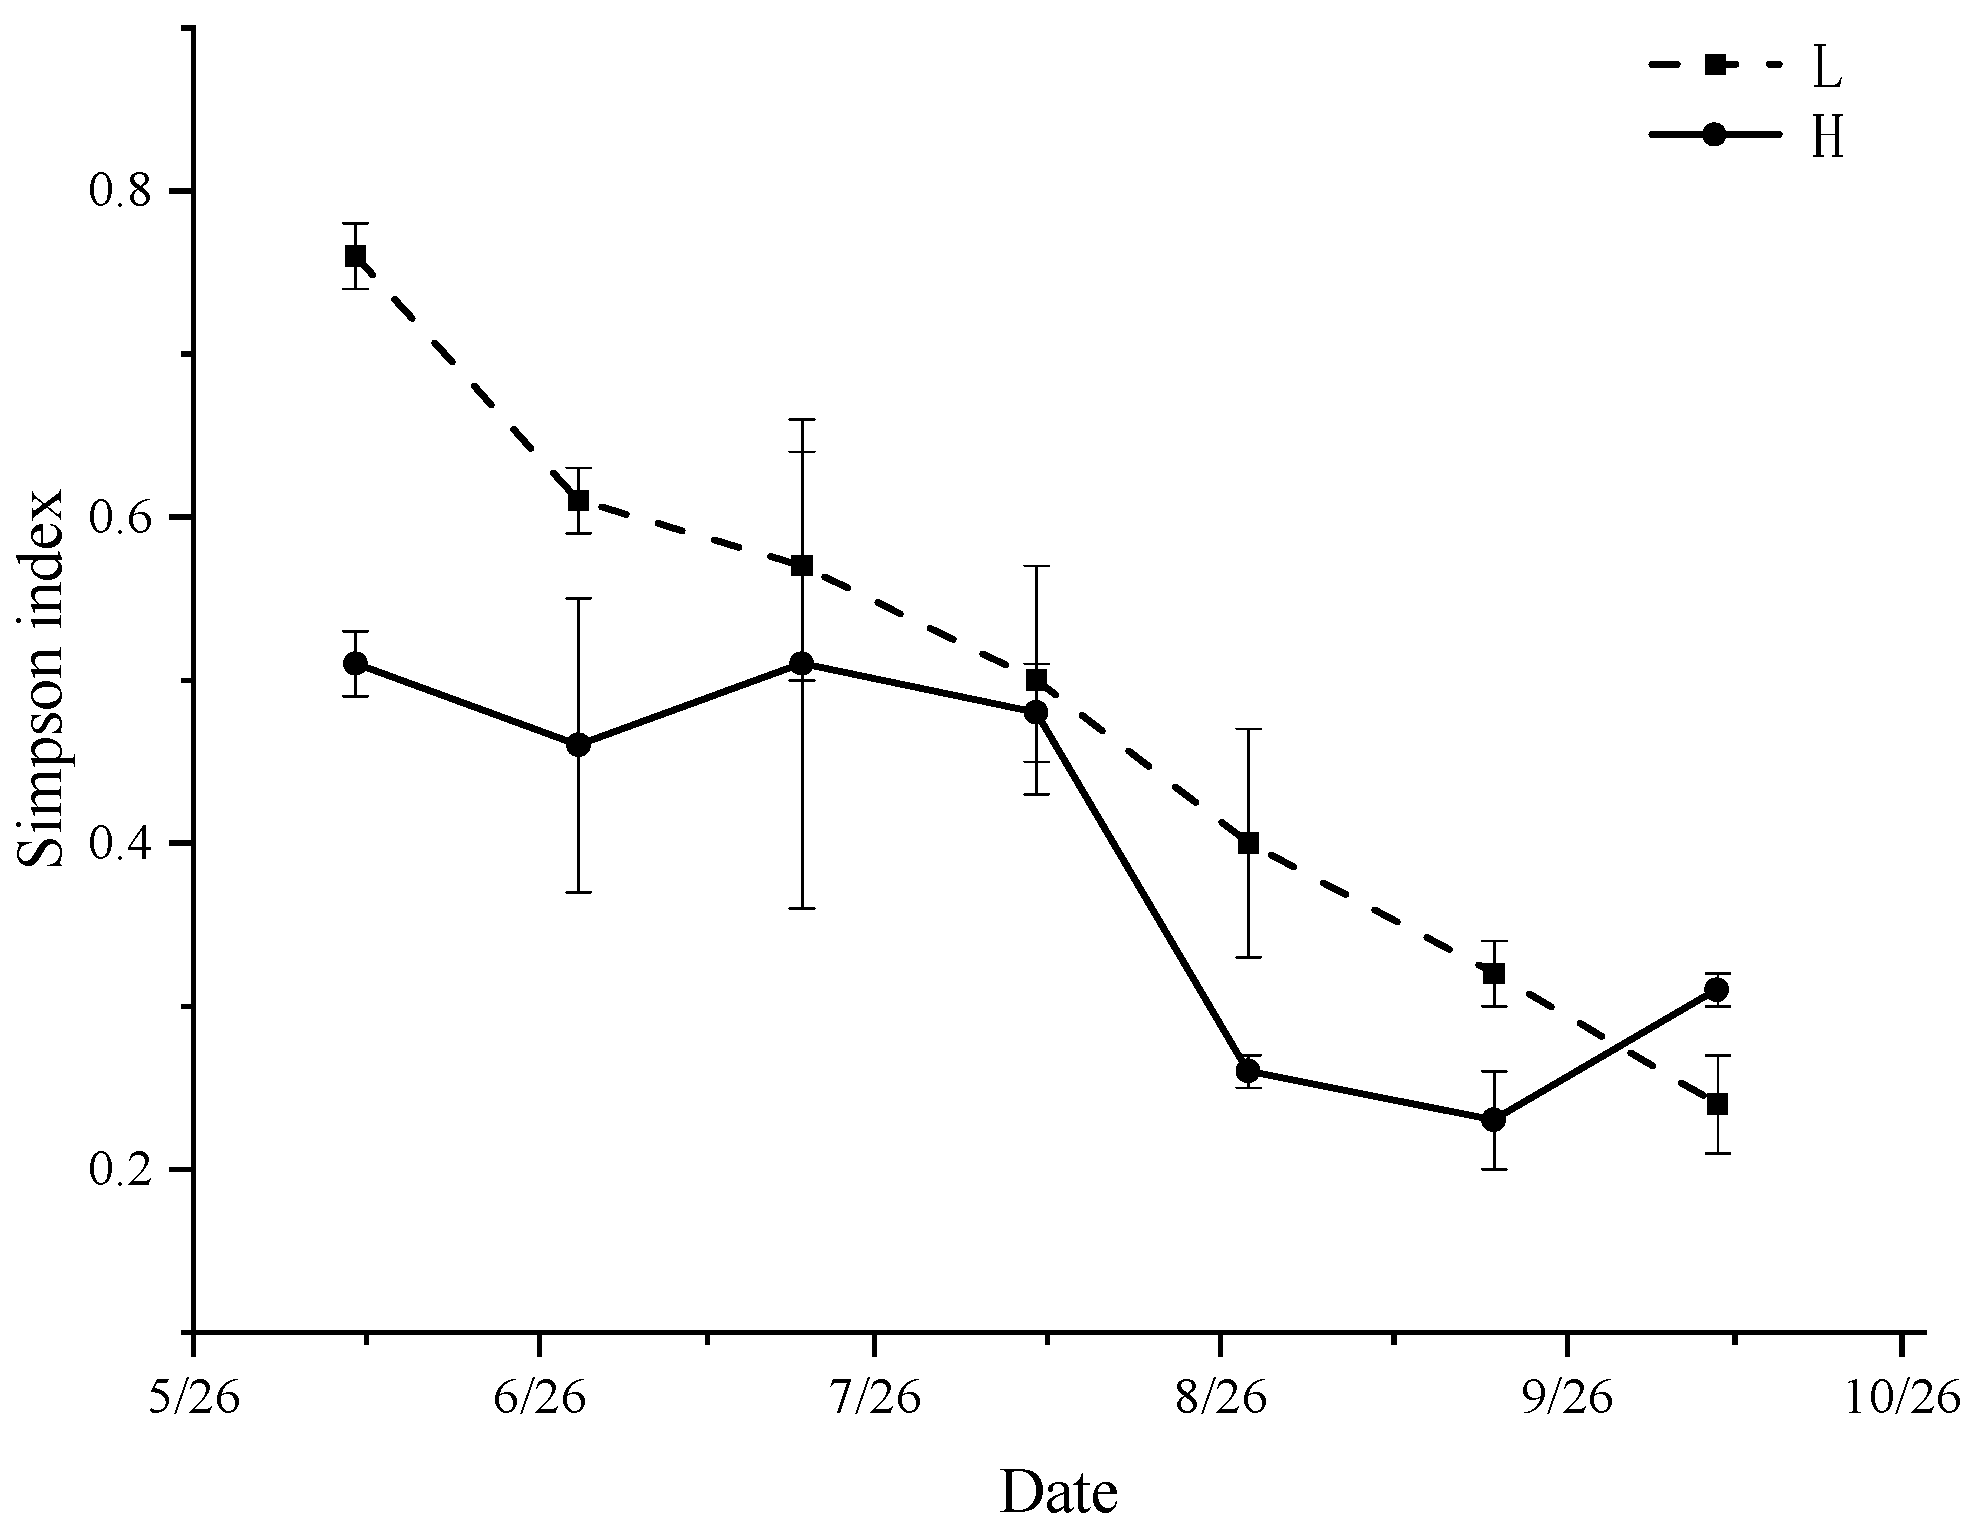
3.6. Diversity Index

The biodiversity index can comprehensively reflect the species richness and uniformity, and the larger the value, the better the water quality. The changes of the plankton Shannon–Wiener index, Simpson index, and evenness index in the experimental ponds were shown in Figure 5, Figure 6 and Figure 7. The trends of L and H were the same, with the early stage being higher than the late stage, and L was higher than H. There was no significant difference between the two groups by the independent samples t-test.

3.7. Analysis of the Relationship Between Phytoplankton and Environmental Factors

There were 10 phytoplankton species with dominance Y > 0.02. DCA analysis showed that the length of the gradient axis was less than 3, so RDA was chosen. Results of RDA are shown in Figure 8, and the length of the arrows represents the relative explanatory power of the phytoplankton species in the sorting. The eigenvalues of constrained axes 1 and 2 were 0.8336 and 0.5731, respectively, of which total phosphorus, phosphate, nitrite, and nitrate mainly contributed to constrained axis 1, and iron, total nitrogen, and ammonia nitrogen mainly contributed to constrained axis 2. The cross-tabulation test showed that phosphate had a highly significant effect on the phytoplankton community (p < 0.01), and the other physicochemical indexes did not have a significant effect on the phytoplankton community.

4. Discussion

Water quality directly affects the health and yield of cultured organisms [17,18]. In this study, nutrient concentrations exhibited statistically significant differences across sampling time points (p < 0.05), whereas no significant differences were observed between the two groups for other parameters. Principal component analysis (PCA), as a traditional multivariate analysis technique, can obtain the main factors affecting water quality. Three to six indicators are generally selected as principal components [19,20,21]. In this study, three indicators were extracted as principal components (total phosphorus, iron, and nitrite), indicating that these three indicators are the major factors affecting water quality. Nitrogen and phosphorus contents in water are closely related to the changes of phytoplankton [10,22,23]. Phytoplankton play an important role in maintaining stable water quality, in which nutrient concentrations, dissolved oxygen, and primary productivity are affected [24]. Studies have shown that total nitrogen and total phosphorus in water are significantly correlated with the biomass of phytoplankton [25]. In this study, both total nitrogen and total phosphorus reached peak concentrations in August and September, coinciding with the highest observed phytoplankton abundance. A positive correlation was observed between nutrient concentrations and phytoplankton abundance. However, there are some research results that contradict this; the increase of total nitrogen and phosphorus in the enclosure will not affect the total biomass of phytoplankton [22].
In the water, the ratio of nitrogen to phosphorus is not constant. Some researchers believe that the nitrogen–phosphorus ratio can have a great influence on the phytoplankton species composition; a higher nitrogen–phosphorus ratio will inhibit the growth of cyanobacteria [23,26], and excessive nitrogen will cause nitrogen-fixing cyanobacteria to lose their competitive advantage [27,28]. In this experiment, the N:P ratios of all groups were high, with the average N:P ratio of group L being (27.89 ± 23.07) and that of group H being (17.44 ± 11.08). In this phytoplankton identification process, fewer cyanobacterial species and quantities were detected only in the early stage of the culture, which is the same as the above results. Iron is an essential trace element for phytoplankton and plays an important role in photosynthesis, nitrogen reduction, and chlorophyll synthesis. In this study, the iron concentration in the high-density group (H) was 0.818 mg/L, significantly higher than that in the low-density group (L), which measured 0.482 mg/L. Correspondingly, phytoplankton abundance was greater in the high-density group than in the low-density group. Iron is a potential limiting factor for the growth of marine phytoplankton. Previous studies have demonstrated that iron not only regulates phytoplankton growth but also influences community composition; the addition of high concentrations of iron can lead to a rapid proliferation of diatoms, resulting in their dominance within the phytoplankton community [29]. These findings are consistent with the results of the present study.
A total of 38 species of phytoplankton in six phyla and 28 genera were identified in the phytoplankton samples in this study. In terms of phytoplankton species, diatoms and Dinophyta dominated, while other algae were less common. Previous studies have shown that green algae and cyanobacteria dominate phytoplankton in freshwater or low-salinity shrimp ponds, while diatoms and Dinophyta dominate phytoplankton in seawater shrimp ponds [30,31], which is in line with the present results. Although no significant difference was observed in community diversity indices between the two groups, the index was consistently higher in the low-density group (L) compared to the high-density group (H), indicating a more stable phytoplankton community structure under low-density conditions. The diversity of phytoplankton in the early stage of culture was higher than that in the late stage of culture, and the trends of both groups were the same. The stability of the community structure was closely related to the diversity of the community, and the higher the diversity, the more stable the community structure. Unstable community structure can easily lead to the proliferation or death of algae in a short time [32]. Under the influence of bait feeding and shrimp excretion, the cultured water becomes eutrophic, providing sufficient nutrients for phytoplankton growth. Under such conditions, it is possible for certain species, especially opportunistic species, to proliferate and become dominant in the pond. This is also the main reason why the phytoplankton communities are different under the same management conditions. In addition, phytoplankton species are related to the salinity of the water environment [33].
Studies have shown that changes in environmental factors in ecosystems directly affect phytoplankton community structure [34]. Analyzing the relationship between phytoplankton community and environmental factors through RDA can help us understand the main drivers of phytoplankton community structure. The lengths of the environmental variable arrows represent the relative explanatory power of phytoplankton species within the ordination [35]. In this study, phosphate, total phosphate, and nitrate represented the most important environmental variables to influence the density-based community of phytoplankton. Phosphate was significantly correlated with the phytoplankton community, indicating that the phosphorus content in the culture water can influence the composition of the phytoplankton community, which is basically the same as the findings of previous studies [36].

5. Conclusions

In this study, we investigated the changes in water quality and phytoplankton community structure in the integrated culture mode of T. granosa and L. vannamei under different culture densities. Under the conditions of this study, no significant differences in nutrient concentrations were observed between the two groups, indicating no distinction in terms of water eutrophication. Phytoplankton abundance was positively correlated with nutrient concentrations, reaching peak levels between August and September. The diversity index of the phytoplankton community was higher in the early stages and declined over time, suggesting a decrease in community structural stability. Although the difference in diversity indices between the two groups was not statistically significant, the low-density group (L) consistently exhibited higher values than the high-density group (H), indicating greater community stability under low-density conditions. High stocking density appears to be unfavorable for maintaining a stable phytoplankton community structure. In addition, variations in nutrient concentrations also played a significant role in shaping community structure. The results showed that a reasonable increase in culture density would not cause more adverse effects on the environment, and the effects of culture density on the structure and function of the phytoplankton community still need to be further evaluated.

Author Contributions

Conceptualization, J.H. and L.H.; methodology, J.H.; software, J.H.; validation, J.H. and L.H.; formal analysis, J.H.; data curation, J.H.; writing—original draft preparation, J.H.; writing—review and editing, J.H.; supervision, L.H.; project administration, L.H. and Y.X.; funding acquisition, Z.L. All authors have read and agreed to the published version of the manuscript.

Funding

This work was supported by the Zhejiang Science and Technology Project (2022C02027, 2023C02011); the China Agriculture Research System of MOF and MARA(CARS-49); the research was funded by National Key Research and Development Program of China (2023YFD2401702 and 2024YFD2401703) and the Leading Talents in Scientific and Technological Innovation Project of Ningbo (2024QL065).

Institutional Review Board Statement

The animal study was reviewed and approved by the Institutional Animal Care and Use Committee (IACUC) of Zhejiang Wanli University, China (approval code: 20221003001).

Informed Consent Statement

Not applicable.

Data Availability Statement

Our research data is available to be shared.

Conflicts of Interest

The authors declare no conflicts of interest. The funders had no role in any of the following: the design of this study; the collection, analyses, or interpretation of data; the writing of the manuscript; or in the decision to publish the results.

References

  1. Luo, D.L. Quantitative distribution characteristics of zooplankton from three important mariculture areas of Xiamen. J. Oceanogr. Taiwan Strait 2004, 23, 458–468. [Google Scholar]
  2. Borghese, J.; Giangrande, A.; Arduini, D.; Trani, R.; Doria, L.; Anglano, M.; Aguilo-Arce, J.; Toso, A.; Putignano, M.; Rizzo, L.; et al. Exploring the Potential Effects of IMTA on Water Column Seston through Intensive Short-Time Cycles Approach. Mar. Pollut. Bull. 2025, 212, 117580. [Google Scholar] [CrossRef] [PubMed]
  3. Riisgård, H. Efficiency of Particle Retention and Filtration Rate in 6 Species of Northeast American Bivalves. Mar. Ecol. Prog. Ser. 1988, 45, 217–223. [Google Scholar] [CrossRef]
  4. Cloern, J. Does the Benthos Control Phytoplankton Biomass in South San Francisco Bay? Mar. Ecol. Prog. Ser. 1982, 9, 191–202. [Google Scholar] [CrossRef]
  5. Yuan, S.-Y.; Zhu, W.-J.; Neori, A.; Zhang, Y.; Li, M.; Li, J.; Chang, Z.-Q. Benthic Suspension-Feeding Clams Affect Sedimentary Microbial Communities and Nitrogen Cycling in Seawater Pond IMTA. Aquaculture 2023, 563, 738907. [Google Scholar] [CrossRef]
  6. Batır, E.; Metin, Ö.; Yıldız, M.; Özel, O.T.; Fidan, D. Sustainable Land-Based IMTA: Holistic Management of Finfish, Mussel, and Macroalgae Interactions, Emphasizing Water Quality and Nutrient Dynamics. J. Environ. Manag. 2024, 372, 123411. [Google Scholar] [CrossRef]
  7. Ni, M.; Yuan, J.; Liu, M.; Gu, Z. Assessment of Water Quality and Phytoplankton Community of Limpenaeus Vannamei Pond in Intertidal Zone of Hangzhou Bay, China. Aquac. Rep. 2018, 11, 53–58. [Google Scholar] [CrossRef]
  8. Cunha, M.E.; Quental-Ferreira, H.; Parejo, A.; Gamito, S.; Ribeiro, L.; Moreira, M.; Monteiro, I.; Soares, F.; Pousão-Ferreira, P. Understanding the Individual Role of Fish, Oyster, Phytoplankton and Macroalgae in the Ecology of Integrated Production in Earthen Ponds. Aquaculture 2019, 512, 734297. [Google Scholar] [CrossRef]
  9. Lin, Z.H.; You, Z.H. Intensive mudflat bivalves culture in Zhejiang. Mar. Sci. 2005, 29, 95–99. [Google Scholar]
  10. Smith, D.W. Biological Control of Excessive Phytoplankton Growth and the Enhancement of Aquacultural Production. Can. J. Fish. Aquat. Sci. 1985, 42, 1940–1945. [Google Scholar] [CrossRef]
  11. Lu, J.; Li, S.D.; Dong, S.L. The impact of the polycultured filter-feeding animals with peneid shrimp on plankon community. Period. Ocean Univ. China 1999, 29, 75–80. [Google Scholar]
  12. Li, Q. Influence of silver carp (Hypophthalmichys molitrix C et V) on plankton community in reservoir enclosures. Acta Ecol. Sin. 1993, 13, 30–37. [Google Scholar]
  13. Tan, K.; Xu, P.; Huang, L.; Luo, C.; Huang, J.; Fazhan, H.; Kwan, K.Y. Effects of Bivalve Aquaculture on Plankton and Benthic Community. Sci. Total Environ. 2024, 914, 169892. [Google Scholar] [CrossRef] [PubMed]
  14. GB 17378.4-2007; Marine Monitoring Specification—Part 4: Seawater Analysis. Standards Press of China: Beijing, China, 2007.
  15. Hu, H.J.; Wei, Y.X. The Freshwater Algae of China; Science Publishing Company: Beijing, China, 2006; pp. 56–95. [Google Scholar]
  16. Mai, X.W. Study on the Ecological Characteristics of Water Bodies in Greenhouse Desalinated Cultivation of Litopenaeus vannamei; Zhongshan University: Guangzhou, China, 2003. [Google Scholar]
  17. Ferreira, N.C.; Bonetti, C.; Seiffert, W.Q. Hydrological and Water quality indices as management tools in marine shrimp culture. Aquaculture 2011, 318, 425–433. [Google Scholar] [CrossRef]
  18. Ma, Z.; Song, X.; Wan, R.; Gao, L. A modified water quality index for intensive shrimp ponds of Litopenaeusvannamei. Ecol. Indic. 2013, 24, 287–293. [Google Scholar] [CrossRef]
  19. Babalola, O.G. Pollution Studies of Ogun River at Isheri Along Lagos-Ibadan Express Road, Nigeria. Master’s Thesis, University of Ibadan, Ibadan, Nigeria, 2006. [Google Scholar]
  20. Oketola, A.A.; Osibanjo, O.; Ejelonu, B.C.; Oladimeji, Y.B.; Damazio, O.A. Water quality assessment of River Ogun around the cattle market of Isheri, Nigeria. J. Appl. Sci. 2006, 6, 511–517. [Google Scholar] [CrossRef]
  21. Ismail, N.I.A.; Amal, M.N.A.; Shohaimi, S.; Saad, M.Z.; Abdullah, S.Z. Associations of water quality and bacteria presence in cage cultured red hybrid tilapia, Oreochromis niloticus × O. mossambicus. Aquaculture 2016, 4, 57–65. [Google Scholar] [CrossRef]
  22. Lynch, M.; Shapiro, J. Predation, enrichment, and phytoplankton community structure. Limnol. Oceanogr. 1981, 26, 86–102. [Google Scholar] [CrossRef]
  23. Schindler, D.W. Evolution of phosphorus limitation in lakes. Science 1977, 195, 260–262. [Google Scholar] [CrossRef]
  24. Chien, Y.H. Water Quality Requirements and Management for Marine Shrimp Culture; World Aquaculture Society: Baton Rouge, LA, USA, 1992; pp. 30–42. [Google Scholar]
  25. Li, K.Y.; Liu, Z.Y. Plankton of fish and shrimp culture ponds in saline-alkaline wetland. J. Lake Sci. 2002, 14, 369–373. [Google Scholar]
  26. Li, Y.; Li, Z.; Geng, Y. Effect of N, P concentration on growth rate and biomass of phytoplankton in eutrophical water. Acta Ecol. Sin. 2006, 26, 317–325. [Google Scholar] [CrossRef]
  27. Sun, W.M.; Dong, S.L.; Zhao, X.D.; Jie, Z.L.; Zhang, L.C.; Zhang, H.W. Plankton community responses to various fertilization combinations in saline-alkaline pond of shrimp (Penaeus vannamei). J. Fish. Sci. China 2007, 14, 30–34. [Google Scholar]
  28. Martin, J.H.; Gordon, R.M.; Fitzwater, S.E. The case for iron. Limnol. Oceanogr. 1991, 36, 1793–1802. [Google Scholar] [CrossRef]
  29. Guo, F.; Lin, J.M.; Huang, L.F.; Zhou, S.Q.; Shen, G.Y. Ecological characteristics of phytoplankton in shrimp cultivation area from Pantu, Xiamen. J. Oceanogr. Taiwan Strait 2002, 21, 469–482. [Google Scholar]
  30. Jiao, X.Y. Species diversity of aquerrantia in the prawn pool and coast of Dongxiaomo. Chin. Biodivers. 1996, 4, 7–13. [Google Scholar]
  31. Reynolds, C.S. The Ecology of Freshwater Phytoplankton; Cambridge University Press: Cambridge, UK, 1984; pp. 143–165. [Google Scholar]
  32. Zhang, H.H.; Li, Z.J.; Guo, Z.X.; Jia, X.P. Study on the influences of probiotics on ecological characteristics of plankton in the maricultural ponds. South China Fish. Sci. 2005, 1, 7–14. [Google Scholar]
  33. Proulx, M.; Pick, F.R.; Mazumder, A.; Hamilton, P.B.; Lean, D.S. Experimental evidence for interactive impacts of human activities on lake algalspecies richness. Oikos 1996, 76, 191–195. [Google Scholar] [CrossRef]
  34. Li, Q.H.; Chen, L.L.; Chen, F.F.; Gao, T.J.; Li, X.F.; Liu, S.P.; Li, C.X. MaixiRiverestuary to the Baihua Reservoir in the Maotiao River catchment: Phytoplankton community and environmental factors. Chin. J. Oceanol. Limnol. 2013, 31, 290–299. [Google Scholar] [CrossRef]
  35. Jiang, Y.J.; He, W.; Liu, W.X.; Qin, N.; Ouyang, H.L.; Wang, Q.M.; Kong, X.Z.; He, Q.S.; Yang, C.; Yang, B.; et al. The seasonal and spatial variations of phytoplankton community and their correlation with environmental factors in a largeeutrophic Chinese lake (Lake Chaohu). Ecol. Indic. 2014, 40, 58–67. [Google Scholar] [CrossRef]
  36. Peng, C.C.; Li, Z.J.; Cao, Y.C.; Wen, G.D.; Liu, X.Z.; Hu, X.J. Characteristics of the evolutionary influence of the planktonic microalgae community survival on the Penaeus monodon’s tidal shrimp culture. J. Saf. Environ. 2012, 12, 95–101. [Google Scholar]
Figure 1. Temporal variation of nutrients in water. TN: total nitrite; TP: total phosphate. L stands for the low-density treatment, H stands for the high-density treatment.
Fishes 10 00222 g001aFishes 10 00222 g001b
Figure 2. Principal component analysis ordination diagram of water quality parameters. TN: total nitrite; TP: total phosphate.
Fishes 10 00222 g002
Figure 3. The changes in phytoplankton abundance of each group.
Fishes 10 00222 g003
Figure 4. Phytoplankton composition of each group (average percentage).
Fishes 10 00222 g004
Figure 5. Shannon–Navi index of each group.
Fishes 10 00222 g005
Figure 6. Simpson index of each group.
Fishes 10 00222 g006
Figure 7. Pielou index of each group.
Fishes 10 00222 g007
Figure 8. 3D RDA plot of plankton indicators versus environmental factors. TN: total nitrogen; TP: total phosphorus; S1: Navicular sp.; S2: Cyclotella sp.; S3: Pleurosigma. Formosum; S4: Gymnodiniaceae sp.; S5: Climacosphenia moniligera; S6: Glenodinium sp.; S7: Gyrosigma sp.; S8: Pleurosigma sp.; S9: Cymbella sp.; S10: Cryptomonas sp.
Fishes 10 00222 g008
Table 1. Concentrations of major nutrient parameters.
TeamMean (mg/L)SDMinimun (mg/L)Maximum (mg/L)
NitriteL0.0120.0150.0000.061
H0.0060.0060.0010.022
NitrateL0.0930.0990.0010.343
H0.0840.0800.0010.291
AmmoniaL0.0660.0490.0090.203
H0.0550.0310.0170.142
PhosphateL0.0050.0030.0020.015
H0.0050.0020.0010.008
Total nitriteL1.4730.4120.7352.353
H1.4590.6310.6793.969
Total phosphateL0.0840.0500.0110.187
H0.1060.0420.0290.180
IronL0.482 *0.3350.0071.382
H0.818 *0.5650.0022.330
Note: * denotes significant difference, p < 0.05.
Table 2. Water physico-chemical parameters among different sample site.
TeamMeanSDMinimunMaximum
TransparencyL412226106
(cm)H422127103
pHL7.880.367.198.32
H7.930.407.288.51
SalinityL22.642.2418.9826.57
H22.772.1118.6626.00
DO (mg/L)L5.611.563.989.96
H5.461.284.108.73
Table 3. Nitrogen-to-phosphorus ratio at different time.
TeamDataMeanSD
6/156/307/157/308/158/309/159/3010/15
L49.4748.3419.8213.7512.4411.3712.0873.1710.5627.8923.07
H39.0132.5915.307.9711.8410.2810.759.6219.5917.4411.08
Table 4. The species composition of phytoplankton in each treatment.
PhylumSpeciesRichness
BacillariophytaGyrosigma+
Pleurosigma sp.+++
Pleurosigma. formosum+++
Synedra. tabulata++
Coscinodiscus. lineatus+
Nitzschia. pungens++
Navicula. cryptocephala+
Synedra. ulna+
Triceratium sp.+
Melosira. moniliformis++
Cyclotella sp.+++
Rhizosoleniales sp.+
Climacosphenia moniligera+++
Nitzschia. cocconeiformis+
Navicular sp.+++
Amphora sp.+
Cymbella sp.++
Asteromphalus sp.+
Licmophora sp.++
CyanophytaPhormidium sp.+
Aphanocapsa sp.+
Oscillatoria. princeps+
Aphanothece sp.+
Lyngbya sp.++
Dactylococcopsis sp.+
ChlorophytaClosteriopsis sp.+
Eudorina. elegans+
Chlorella. ellipsoidea++
Chlorococcum sp.+
Platymonas sp.+
Cladopgoraceae sp.+
DinophytaGymnodiniaceae sp.+++
Glenodinium sp.+++
Dactyliosolen. mediterraneus+
CryptophytaCryptomonas sp.+++
EuglenophytaAstasia sp.+
ChrysophytaCocconeiaceae sp.+
Note: “+” means the lesser species, “++” means the common species, and “+++”means the dominant species.
Disclaimer/Publisher’s Note: The statements, opinions and data contained in all publications are solely those of the individual author(s) and contributor(s) and not of MDPI and/or the editor(s). MDPI and/or the editor(s) disclaim responsibility for any injury to people or property resulting from any ideas, methods, instructions or products referred to in the content.

