Article

Bacterial Community Composition and Prevalence of Aeromonas dhakensis in Four Tilapia Freshwater Aquaculture Systems in Malaysia

by
Sook Ling Lim
1,
Suat Moi Puah
1,*,
Siti Nursyuhada Baharudin
2,
Nur Insyirah Mohd Razalan
1,
Kieng Soon Hii
2,
Wei Ching Khor
3,
Yen Ching Lim
3,
Kyaw Thu Aung
3,4,5,
Kek Heng Chua
1,
Po Teen Lim
2 and
Chui Pin Leaw
2,*
1
Department of Biomedical Science, Faculty of Medicine, Universiti Malaya, Kuala Lumpur 50603, Malaysia
2
Bachok Marine Research Station, Institute of Ocean and Earth Sciences, Universiti Malaya, Bachok 16310, Kelantan, Malaysia
3
National Centre for Food Science, Singapore Food Agency, 7 International Business Park, Singapore 609919, Singapore
4
Department of Food Science and Technology, National University of Singapore, Science Drive 2, Singapore 117543, Singapore
5
School of Biological Sciences, Nanyang Technological University, 60 Nanyang Dr, Singapore 637551, Singapore
*
Authors to whom correspondence should be addressed.
Fishes 2025, 10(5), 204; https://doi.org/10.3390/fishes10050204
Submission received: 11 March 2025 / Revised: 24 April 2025 / Accepted: 28 April 2025 / Published: 1 May 2025
(This article belongs to the Section Welfare, Health and Disease)

Abstract

The tilapia (Oreochromis) aquaculture industry in Malaysia has expanded rapidly to meet the increasing demand for animal protein. However, this growth is challenged by microbial infections, particularly those caused by the emerging pathogen Aeromonas dhakensis. This study aimed to investigate the microbial community composition across four distinct tilapia farming systems and assess associated water physicochemical parameters, with a focus on detecting the presence of A. dhakensis and elucidating its environmental associations. Water physicochemical parameters were measured to evaluate environmental conditions, microbial communities were characterized through 16S rDNA metabarcoding, and A. dhakensis was detected using both microbiological and molecular approaches. Principal component analysis (PCA) and canonical correspondence analysis (CCA) were employed to explore the influence of environmental variables and microbial community dynamics on pathogen occurrence. Our results indicated that floating cages exhibited higher levels of temperature, ammonium, and fecal coliform, while cement tanks showed signs of nutrient accumulation. PCA revealed that both systems were associated with degraded water quality. A total of 45 A. dhakensis strains with distinct fingerprints were isolated. The 16S metabarcoding revealed Proteobacteria, Actinobacteria, and Planctomycetota as the dominant phyla. Alpha diversity did not differ significantly among pond systems, while beta diversity revealed variations in microbial assemblages across aquaculture systems. CCA identified dissolved oxygen, temperature, macronutrients (phosphate, ammonium, nitrate, and nitrite), and turbidity as significant environmental drivers shaping the microbial community structure across the pond systems. In conclusion, this study highlights the importance of environmental factors, particularly dissolved oxygen, temperature, and nutrient levels, in shaping microbial community composition and potentially influencing the presence of pathogenic bacteria such as A. dhakensis. These findings underscore the need for improved environmental management in tilapia aquaculture to mitigate disease risks and support fish health.
Key Contribution: To the best of our knowledge, this study is the first to integrate 16S rDNA metabarcoding, comprehensive physicochemical water profiling, and targeted detection of A. dhakensis across four distinct tilapia farming systems in Malaysia. Our findings demonstrate that variations in water quality parameters among pond systems are associated with distinct microbial community structures, which may influence the occurrence of pathogenic bacteria such as A. dhakensis, with potential implications for fish health and aquaculture sustainability.

1. Introduction

Fish constitute an important component of the global food supply, accounting for 20% of global protein intake [1]. The global demand for fish increased from 93.6 to 152 million tonnes between 1998 and 2018. This trend is expected to continue, with projections indicating that fish consumption will reach 184 million tonnes by 2032 [2]. Aquaculture farming has emerged as a sustainable feed alternative to mitigate the excessive demand for wild marine fish feed and to accommodate the anticipated population growth. To meet the growing demand, freshwater aquaculture has expanded globally [3,4], especially in Southeast Asia [5]. Malaysia plays a significant role in the region’s freshwater fish production, showing a 10.2% increase from 102,596.83 tonnes in 2017 to 113,070.59 tonnes in 2023 [6].
Tilapia (Oreochromis spp.), the second most farmed fish species by production in Malaysia, with a total production of 35 thousand tonnes in 2023, is gaining popularity in aquaculture due to its fast growth rate and substantial yield, with harvestable sizes typically reached within six months [7]. However, the rapid expansion of the aquaculture industry in Malaysia has been challenged by fish diseases, which have significantly impacted fish survival and production [8]. Globally, fish diseases are estimated to cause economic losses exceeding USD 6 billion annually, underscoring the severity of this issue [9]. In Malaysia, several reports have been documented on disease outbreaks in red hybrid tilapia farms [10,11]. One of the most severe disease outbreaks resulted in 70% mortality of adult fish, which was attributed to a co-infection involving Tilapia Lake Virus (TiLV), Aeromonas hydrophila, and Streptococcus agalactiae [12]. Such multi-pathogen infections exacerbate the difficulty of disease management in aquaculture. The scale of these losses highlights the urgent need for improved aquaculture management practices and robust disease monitoring systems to mitigate the economic impacts of disease outbreaks in the industry.
The bacterium Aeromonas dhakensis, a member of the Aeromonas genus, has emerged as a significant pathogen in aquaculture, responsible for a range of diseases, including hemorrhagic septicaemia (Motile Aeromonas Septicaemia, MAS) and ulcerative infections [11,13]. This bacterium has been linked to mass mortalities in aquaculture settings, particularly in those with poor water quality. A. dhakensis has been reportedly isolated from various farmed fish, including tilapia, catfish, pacu fish, and eel in Malaysia, Vietnam, India, Brazil, Mexico, and South Korea [11,14,15,16,17,18]. Clinically, fish with MAS show deep ulcers, scale loss, fin erosion, and abscess formation, as the bacterium can disseminate systemically, leading to septicaemia or bacteraemia [19]. A study reported cumulative mortalities of 95% and 55% after 24 h for A. dhakensis 4PS2 (107 CFU mL−1) and A. dhakensis 1P11S3 (107 CFU mL−1) in red hybrid tilapia fish [20]. Despite its known pathogenicity, there is a lack of comprehensive studies exploring the prevalence of A. dhakensis in different aquaculture systems and its interactions with the broader microbial community. This knowledge gap is particularly evident in Malaysian aquaculture, where different farming systems, each with distinct water quality profiles, may harbor unique microbial assemblages that influence the prevalence of pathogens including A. dhakensis.
The increasing need for sustainable aquaculture practices has driven the development of various farming systems, including pond systems, recirculating aquaculture systems (RAS), and net pen or cage systems [21,22]. In Malaysia and most Southeast Asian countries, earthen ponds are popular for small-scale rural aquaculture. These ponds are characterized by more natural, soil-based environments that support diverse microbial community assemblages. In contrast, cement and canvas tanks, due to their artificial nature, may have reduced buffering capacity and different microbial compositions. Net cage aquaculture, typically conducted in larger water bodies, utilizes ecosystem services for the degradation of nutrients and organic waste but can be subject to fluctuating environmental conditions [23,24]. These different farming systems offer distinct ecological carrying capacities, which are likely to influence the diversity and structure of microbial communities and, in turn, alter water quality and pathogen dynamics.
Water quality is critical to fish health and overall performance in aquaculture production systems [25]. The stability of key physicochemical parameters such as temperature, pH, dissolved oxygen, and macronutrient concentrations directly influences the physiological health of fish [26,27]. When water quality deviates from optimum ranges, fish experience physiological stress, which weakens their immunity and increases their vulnerability to diseases [28]. In addition to these abiotic factors, microbial communities play a fundamental role in the health of aquaculture systems. These communities are essential for nutrient cycling, organic matter decomposition, and maintaining the balance of energy flow within the aquaculture environment [29]. Healthy microbial communities can act as bioindicators of system stability, reflecting the overall condition of the water and the capacity of the system to support sustainable fish production. Conversely, imbalances in microbial compositions, often triggered by poor water quality, can lead to the proliferation of harmful pathogens, further compromising fish health [30]. Therefore, studying microbial assemblages in freshwater aquaculture systems could provide valuable insights into how different aquaculture environments shape microbial ecology and pathogen prevalence. Several molecular approaches have been employed to study microbial communities in freshwater environments, and metabarcoding is a powerful and highly effective tool for diversity profiling. This method relies on amplifying the 16S rRNA gene, a highly conserved region across bacterial taxa, allowing for detailed taxonomic profiling and species-level identification of complex microbial assemblages [31].
In recent years, statistical analyses have become integral to aquaculture microbiome studies, offering valuable insights into the diversity and structural dynamics of microbial communities in relation to environmental factors. These approaches provide a robust framework for elucidating the complex interactions between environmental stressors and microbial diversity, which is crucial for promoting sustainable aquaculture practices. For example, a study on farmed Asian seabass (Lates calcarifer) used various statistical methods, like Shannon, Simpson, and Chao1 indices to measure alpha diversity and Bray–Curtis and UniFrac metrics for beta diversity, to evaluate how different farming systems affected the gut microbes [32]. The study authors further applied PERMANOVA, revealing that containment type, farm location, and batch significantly contributed to microbial variation, with containment type alone accounting for 10.4% of the observed diversity. Additionally, multivariate analyses (PCA and CCA) have been widely used to pinpoint key water quality parameters that shape microbial assemblages in different aquaculture environments [30,33,34].
The aquaculture industry in Malaysia faces increasing pressure to improve water quality management and mitigate disease outbreaks to ensure sustainable production. While microbial communities play a pivotal role in regulating water quality and pathogen load, there is limited understanding of how different aquaculture systems influence microbial dynamics, particularly relating to A. dhakensis. This study addresses this gap by applying 16S rDNA metabarcoding to characterize the microbial community structure across different aquaculture systems used in tilapia farming. Microbial profiles were analyzed in conjunction with key physicochemical water parameters to assess their impact on microbial diversity and composition. Additionally, the prevalence of A. dhakensis in these systems was evaluated using species-specific PCR amplification, providing insights into how environmental conditions and microbial community shifts may contribute to the occurrence of this pathogen.

2. Materials and Methods
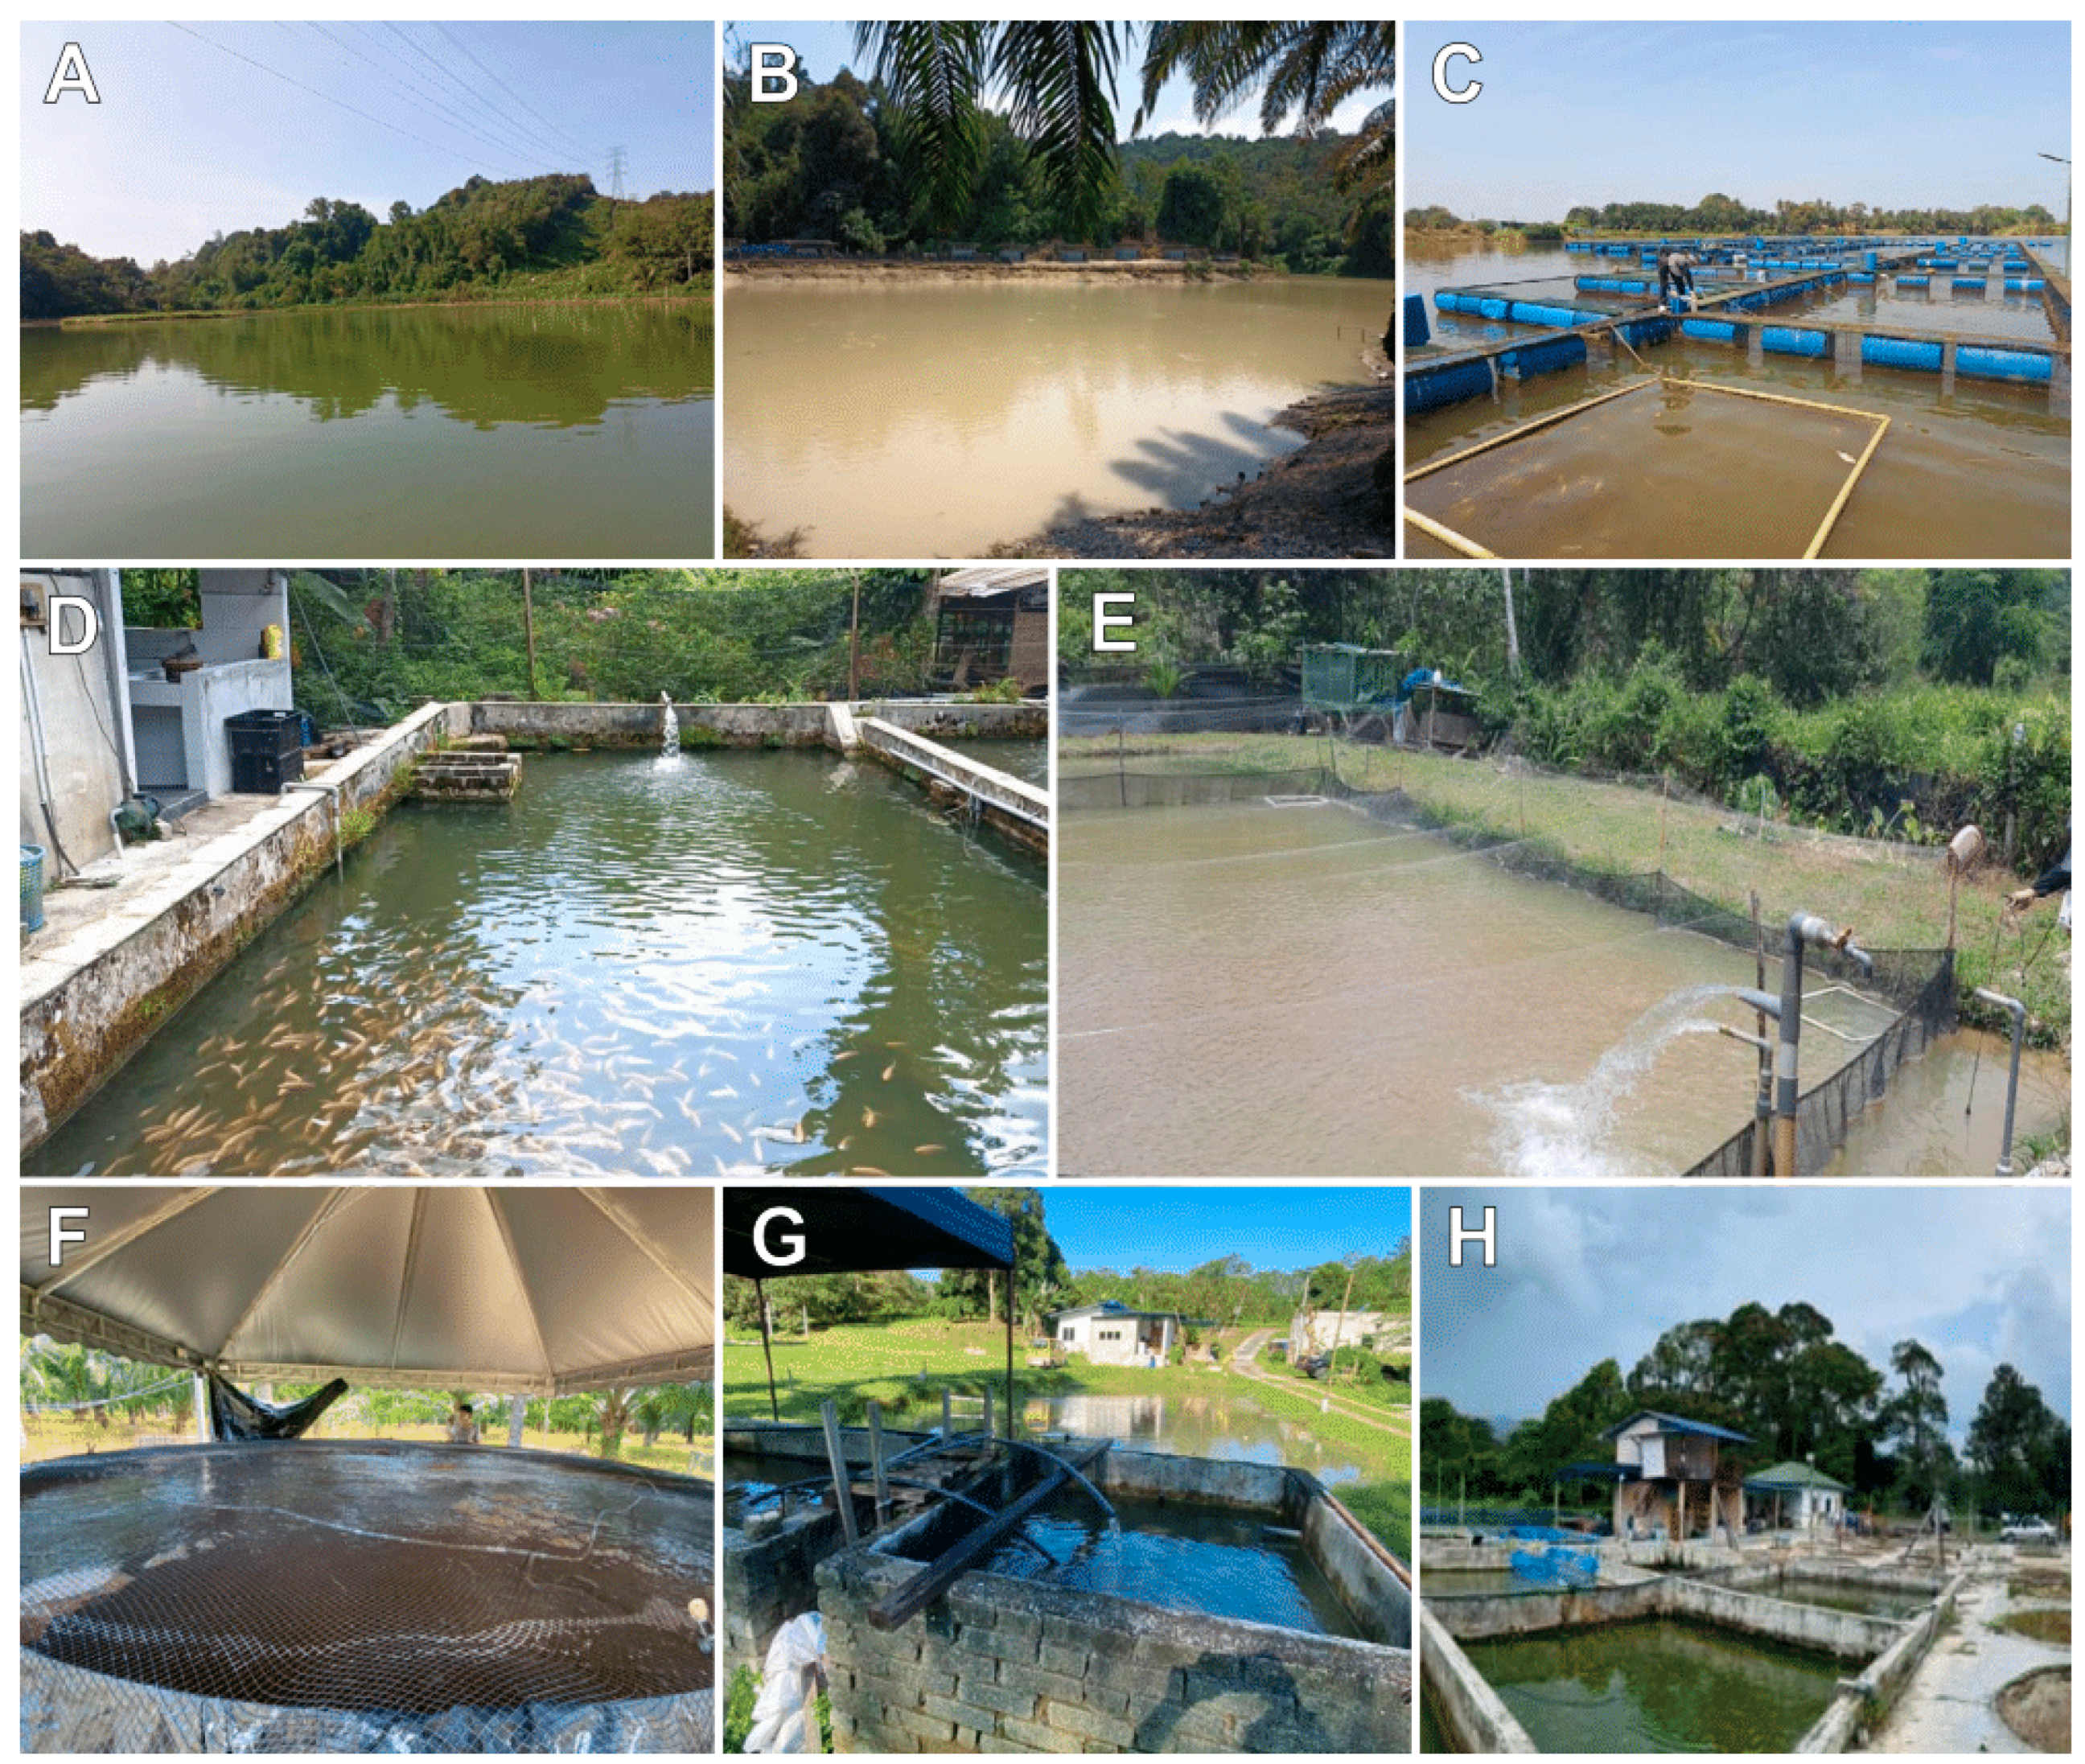
2.1. Study Sites

Field sampling was undertaken on eight freshwater farms of Nile tilapia (Oreochromis niloticus) in Malaysia, with a total of 30 water samples collected between March and September 2023—five from earthen ponds, thirteen ex-mining pools with floating cages, ten cement tanks, and two canvas tanks (Figure 1). Surface water samples (0–1 m depth) were collected using 1-L sterile bottles from the farms and were immediately transported to the laboratory under cold conditions for subsequent processing.

2.2. Determination of Physicochemical Water Parameters

Water parameters of in situ temperature (°C), dissolved oxygen (DO; mg L−1), turbidity (mg L−1), and pH were measured with a YSI multiparameter sonde (YSI, Yellow Springs, OH, USA). Water samples were taken for in situ macronutrient quantification. Macronutrients of phosphate–phosphorus (PO4-P), nitrate–nitrogen (NO3-N), nitrite–nitrogen (NO2-N), and ammonium–nitrogen (NH4-N) were determined spectrophotometrically using a DR3900 spectrophotometer following the manufacturer’s instructions (Hach Company, Loveland, CO, USA). Fecal coliform (FC) (CFU 100 mL−1) was determined using a Coliform Group Testing Sheet (SIBATA, Saitama, Japan). For each sample, 1 mL of water was dripped onto the sheet, followed by incubation at 37 °C. Colonies were counted based on the average number of spots formed.

2.3. Bacterial Isolation

A total of 30 water samples were collected from the four different aquaculture pond systems (canvas tank, TX, n = 2; cement tank, CT, n = 10; earthen pond, EP, n = 5; floating cages, FC, n = 13). Each water sample (100 mL) was subjected to bacterial isolation via the membrane filtration method. The membranes were transferred into Luria–Bertani (LB) broth and grown at 30 °C for 24 h. The culture was subjected to a 10-fold dilution, and 100 µL of bacterial suspension was plated onto the Aeromonas selective agar (Biolife, Milano, Italy) and incubated at 30 °C for 24 h. The isolated, presumed yellow-colored colonies were transferred onto the LB agar. The purified colonies were cultured in LB broth overnight and underwent DNA extraction via the boiling method.

2.4. Identification (Biochemical and Molecular Tests) and Clonality Assessment

The yellow colonies identified as potential Aeromonas species were further tested for oxidase activity and growth in 6.5% (w/v) NaCl-LB broth [35]. Colonies that exhibited oxidase positivity but no growth in 6.5% NaCl-LB broth were further subjected to molecular confirmation. Molecular identification was performed using a polymerase chain reaction assay, targeting the gene rpoD using self-designed primers, AD1 (5′-CTC AGCGAGGAAGATCTG-3′) and AD2 (5′-AACTTCTCGCGAGCAACT-3′), based on the specific region identified after AluI digestion [36]. The 122 bp in length amplicons were examined using gel electrophoresis. The colonies that yielded the 122-bp amplicons were confirmed as A. dhakensis.
Enterobacterial repetitive intergenic consensus (ERIC)-PCR was used to investigate the clonal and genetic diversity of recovered A. dhakensis isolates using primers and PCR conditions as described previously [35,37]. Amplicons were electrophoresed in 1.5% (w/v) agarose gel at 60 V for 4 h and 100 bp Plus II DNA Ladder (TransGen Biotech Co., Ltd., Beijing, China) as a molecular size marker. Visualization of bands was achieved using a UV light transilluminator. Subsequently, the digitized profiles were analyzed using GelJ software v2.3 [38]. The similarity between the fingerprints was quantified using the band-matching Dice similarity coefficient and the Unweighted Pair Group Method with Arithmetric Mean (UPGMA) clustering algorithm.

2.5. Determination of Microbial Community Composition

Environmental DNA (eDNA) from each water sample was extracted using a NucleoMag Plant Kit (Macherey-Nagel, Düren, Germany). The complete bacterial 16S rRNA gene was amplified using the following primer pair: 27f (5′-TTTCTGTTGGTGCTGATATTGCAGRGTTYG ATYMTGGCTCAG-3′) and 1492r (5′-ACTTGCCTGTCGCTCTATCTTCTACGGYTACCT TGTTACGACTT-3′) [39]. The 22 nt 5′ tails were added to the primers to serve as the annealing sites for the barcoding primers.
Gene amplification was performed in a 25 µL PCR mixture containing KOD buffer (TOYOBO, Osaka, Japan), 1 U of KOD polymerase (TOYOBO), 400 nM of each primer, and 2 µL eDNA. PCR was run in a peqSTAR thermal cycler (VWR International GmbH, Darmstadt, Germany). The initial denaturation at 94 °C for 2 min was followed by 35 cycles of 94 °C for 15 s, 48 °C for 30 s, and 68 °C for 90 s. The final extension was 5 min at 68 °C. The PCR products were checked for successful amplification on 2% agarose gel and purified with a TOYOBO PCR and gel cleanup kit (TOYOBO, Japan).
Barcodes were added in a second PCR run using primers from the Nanopore PCR Barcoding Expansion Kit EXP-PBC001 (Oxford Nanopore Technologies, Oxford, UK). The reactions (16.5 µL) contained 7.5 µL of the WizBio HotStart 2x Mastermix (WizBio, Seongnam, Republic of Korea), 7.5 µL of barcoding primer mix, and 1.5 µL of the amplicon. The reactions were run in an Axygen Maxygene II thermal cycler (Corning, AZ, USA) with initial denaturation at 95 °C for 3 min; 12 cycles of 95 °C for 15 s, 55 °C for 15 s, and 72 °C for 120 s; and a final extension at 72 °C for 60 s. The amplicons were electrophoresed on 2% agarose gel and purified with 0.5× Omega Mag-Bind ® Total NGS (Omega Bio-tek, Norcross, GA, USA) and quantified with a Denovix QFX Fluorometer (DeNovix Inc., Wilmington, DE, USA).
The libraries (containing 1 µg DNA) were pooled and subjected to adapter attachment and end-prep with 60 µL of the NEBNext Companion Module for ONT Ligation Sequencing (New England Biolabs, Ipswich, MA, USA). The reactions were incubated in an Axygen Maxygene II thermal cycler at 20 °C for 30 min, followed by 65 °C for 30 min. The libraries were purified with 0.8× Omega Mag-Bind ® Total NGS and prepared for sequencing with the Nanopore Ligation Sequencing Kit SQK-LSK112. The libraries were sequenced on separate Flongle R10.4.1 flow cells and run on a MinION sequencing device (Oxford Nanopore Technologies, Oxford, UK).
The raw sequence data from MinION sequencing were analyzed using the base calling method in MinKNOW 21.11.7 with Guppy 6.4.2, followed by quality score filtering of average Q-score 10. Barcode demultiplexing and primer trimming were performed using Cutadapt v4.9, FASTQC v0.12.1 [40] and FASTP software v0.24.1 [41]. Each sample was classified according to its taxonomic group using KRAKEN 2 [42].

2.6. Statistical Analysis

Graphic illustrations of physicochemical variables and protist community compositions across various tilapia farming systems were performed in R v4.3.2 [43] using ggplot2 [44] and Chiplot [45]. Data normality was tested with the Shapiro-Wilk test prior to analysis, and a non-parametric Wilcoxon test was used to test the significance of differences in physicochemical variables among different farming systems. To explore the underlying structure and variation among the physicochemical parameters in the tilapia farming systems, principal component analysis (PCA) was performed using FactoMineR [46] in R.
To assess alpha diversity, the species richness, Chao1, and Shannon–Wiener indices were calculated. Differences in diversity metrics between farming systems were tested using the Kruskal–Wallis test followed by Dunn’s post hoc test. To visualize the beta diversity patterns in the structure of the microbial community, non-metric multidimensional scaling (nMDS) was performed using vegan [47] in R on the Bray–Curtis dissimilarity matrix constructed from the Hellinger-transformed abundance data. The statistical significance of clusters was assessed through multivariate tests of permutational analysis of variance (perMANOVA) using the adonis function with 999 permutations.
To reveal the associations among environmental physicochemical variables and bacterial communities, a canonical correspondence analysis (CCA) was performed with vegan. The bacterial abundance data were Hellinger-transformed to ensure it met the statistical assumptions of normality and linearity.

3. Results

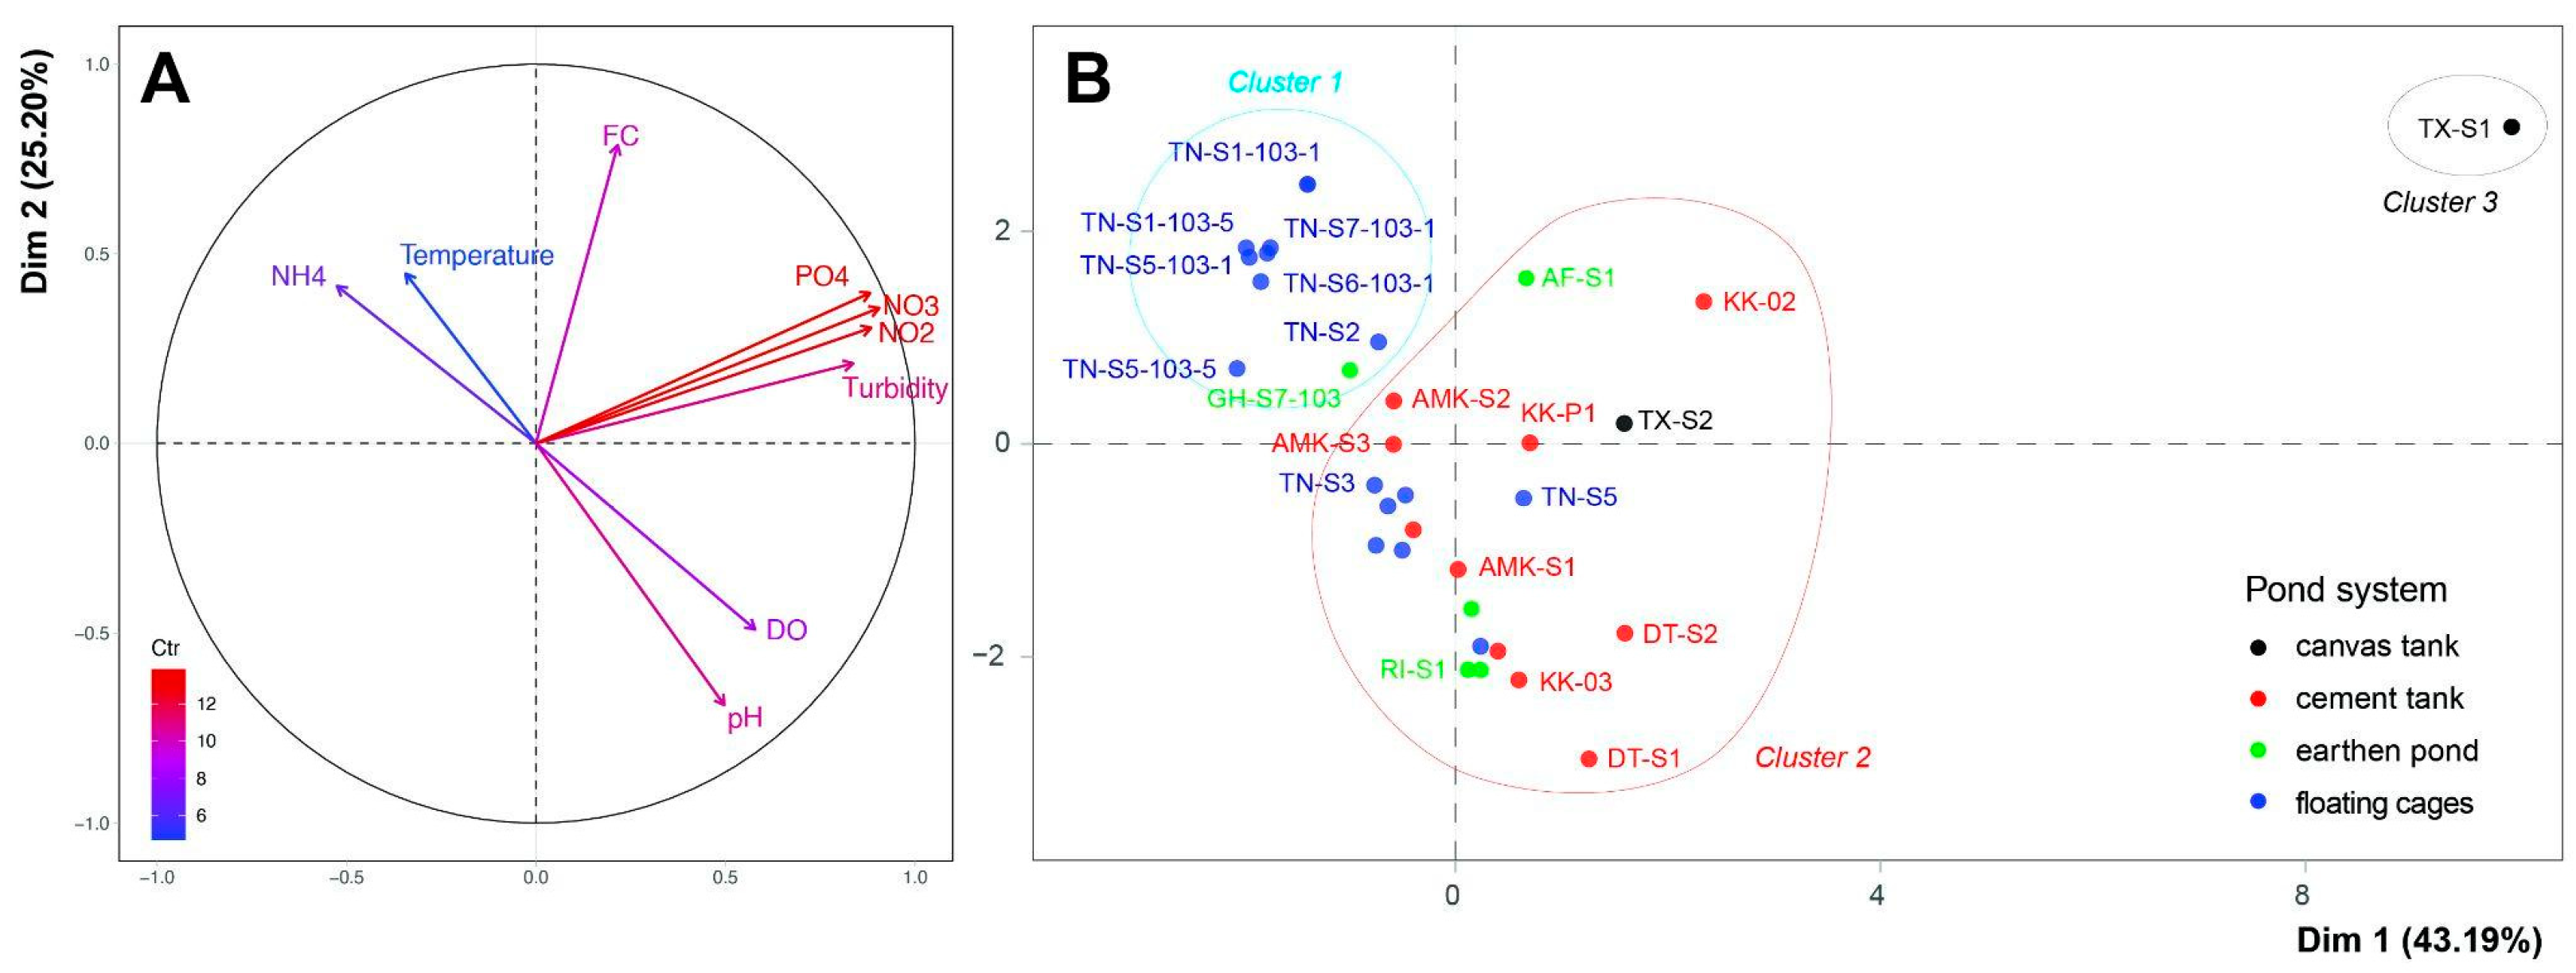
3.1. Physicochemical Variability in Various Tilapia Farming Systems

The summary data of physicochemical water parameters, including temperature, pH, dissolved oxygen, and fecal coliform, are presented in Table 1 and detailed in Table S1. Water temperatures varied from 25.5 to 38.0 °C, with floating cages exhibiting significantly higher temperatures as compared to other pond systems (Wilcoxon test, p < 0.05; Table S1). Nitrate and nitrite concentrations across most pond samples ranged from 0.30 to 1.50 mg L−1 and from 0.002 to 0.102 mg L−1, respectively, with one sample from a canvas tank (TX-S1) showing notably higher levels of nitrate (48.20 mg L−1) and nitrite (0.591 mg L−1). Phosphate concentrations across all pond samples ranged from 0.01 to 0.10 mg L−1, except for TX-S1, which was recorded at 5.46 mg L−1. Ammonium levels across all pond samples ranged from 0.00 to 1.27 mg L−1. The highest concentration was observed in samples from floating cages (1.27 mg L−1), which was significantly higher than the other three systems (Wilcoxon test, p < 0.01; Table S1). Notably, most samples demonstrated high fecal coliform levels (up to 24,100 CFU 100 mL−1).
The results of PCA ordinations revealed that the first two principal components, Dim1 (43.19%) and Dim2 (25.20%), accounted for a high value of 68.40% of the explained variance (Figure 2). Key variables such as NO3, NO2, PO4, and turbidity were strongly positively correlated with Dim1, while NH4, temperature, and fecal coliform were negatively correlated. The analysis revealed distinct clustering by pond type (Wilks test, p < 0.0001), whereby the physicochemical parameters of floating cages were primarily clustered in the lefthand panel of Dim1, characterized by higher levels of NH4, temperature, and fecal coliform but lower values of DO, pH, and turbidity (Figure 2). Conversely, earthen ponds and cement tanks were distributed across Dim1 and Dim2, some were characterized by higher levels of DO and pH, while some ponds were associated with higher levels of turbidity, PO4, NO3, and NO2. The sites were clustered into three distinct clusters (Figure 2B). The clustering implies that floating cages that were characterized by high levels of NH4 in this study may be more prone to poorer water quality conditions due to nutrient accumulation. While Cluster 2 comprised mainly earthen ponds and cement tanks, it appeared less clustered, with intermediate water quality characteristics. Cluster 3 included the canvas tank TX-S1, which showed high values of NO2, NO3, PO4, and turbidity (Figure 2B).

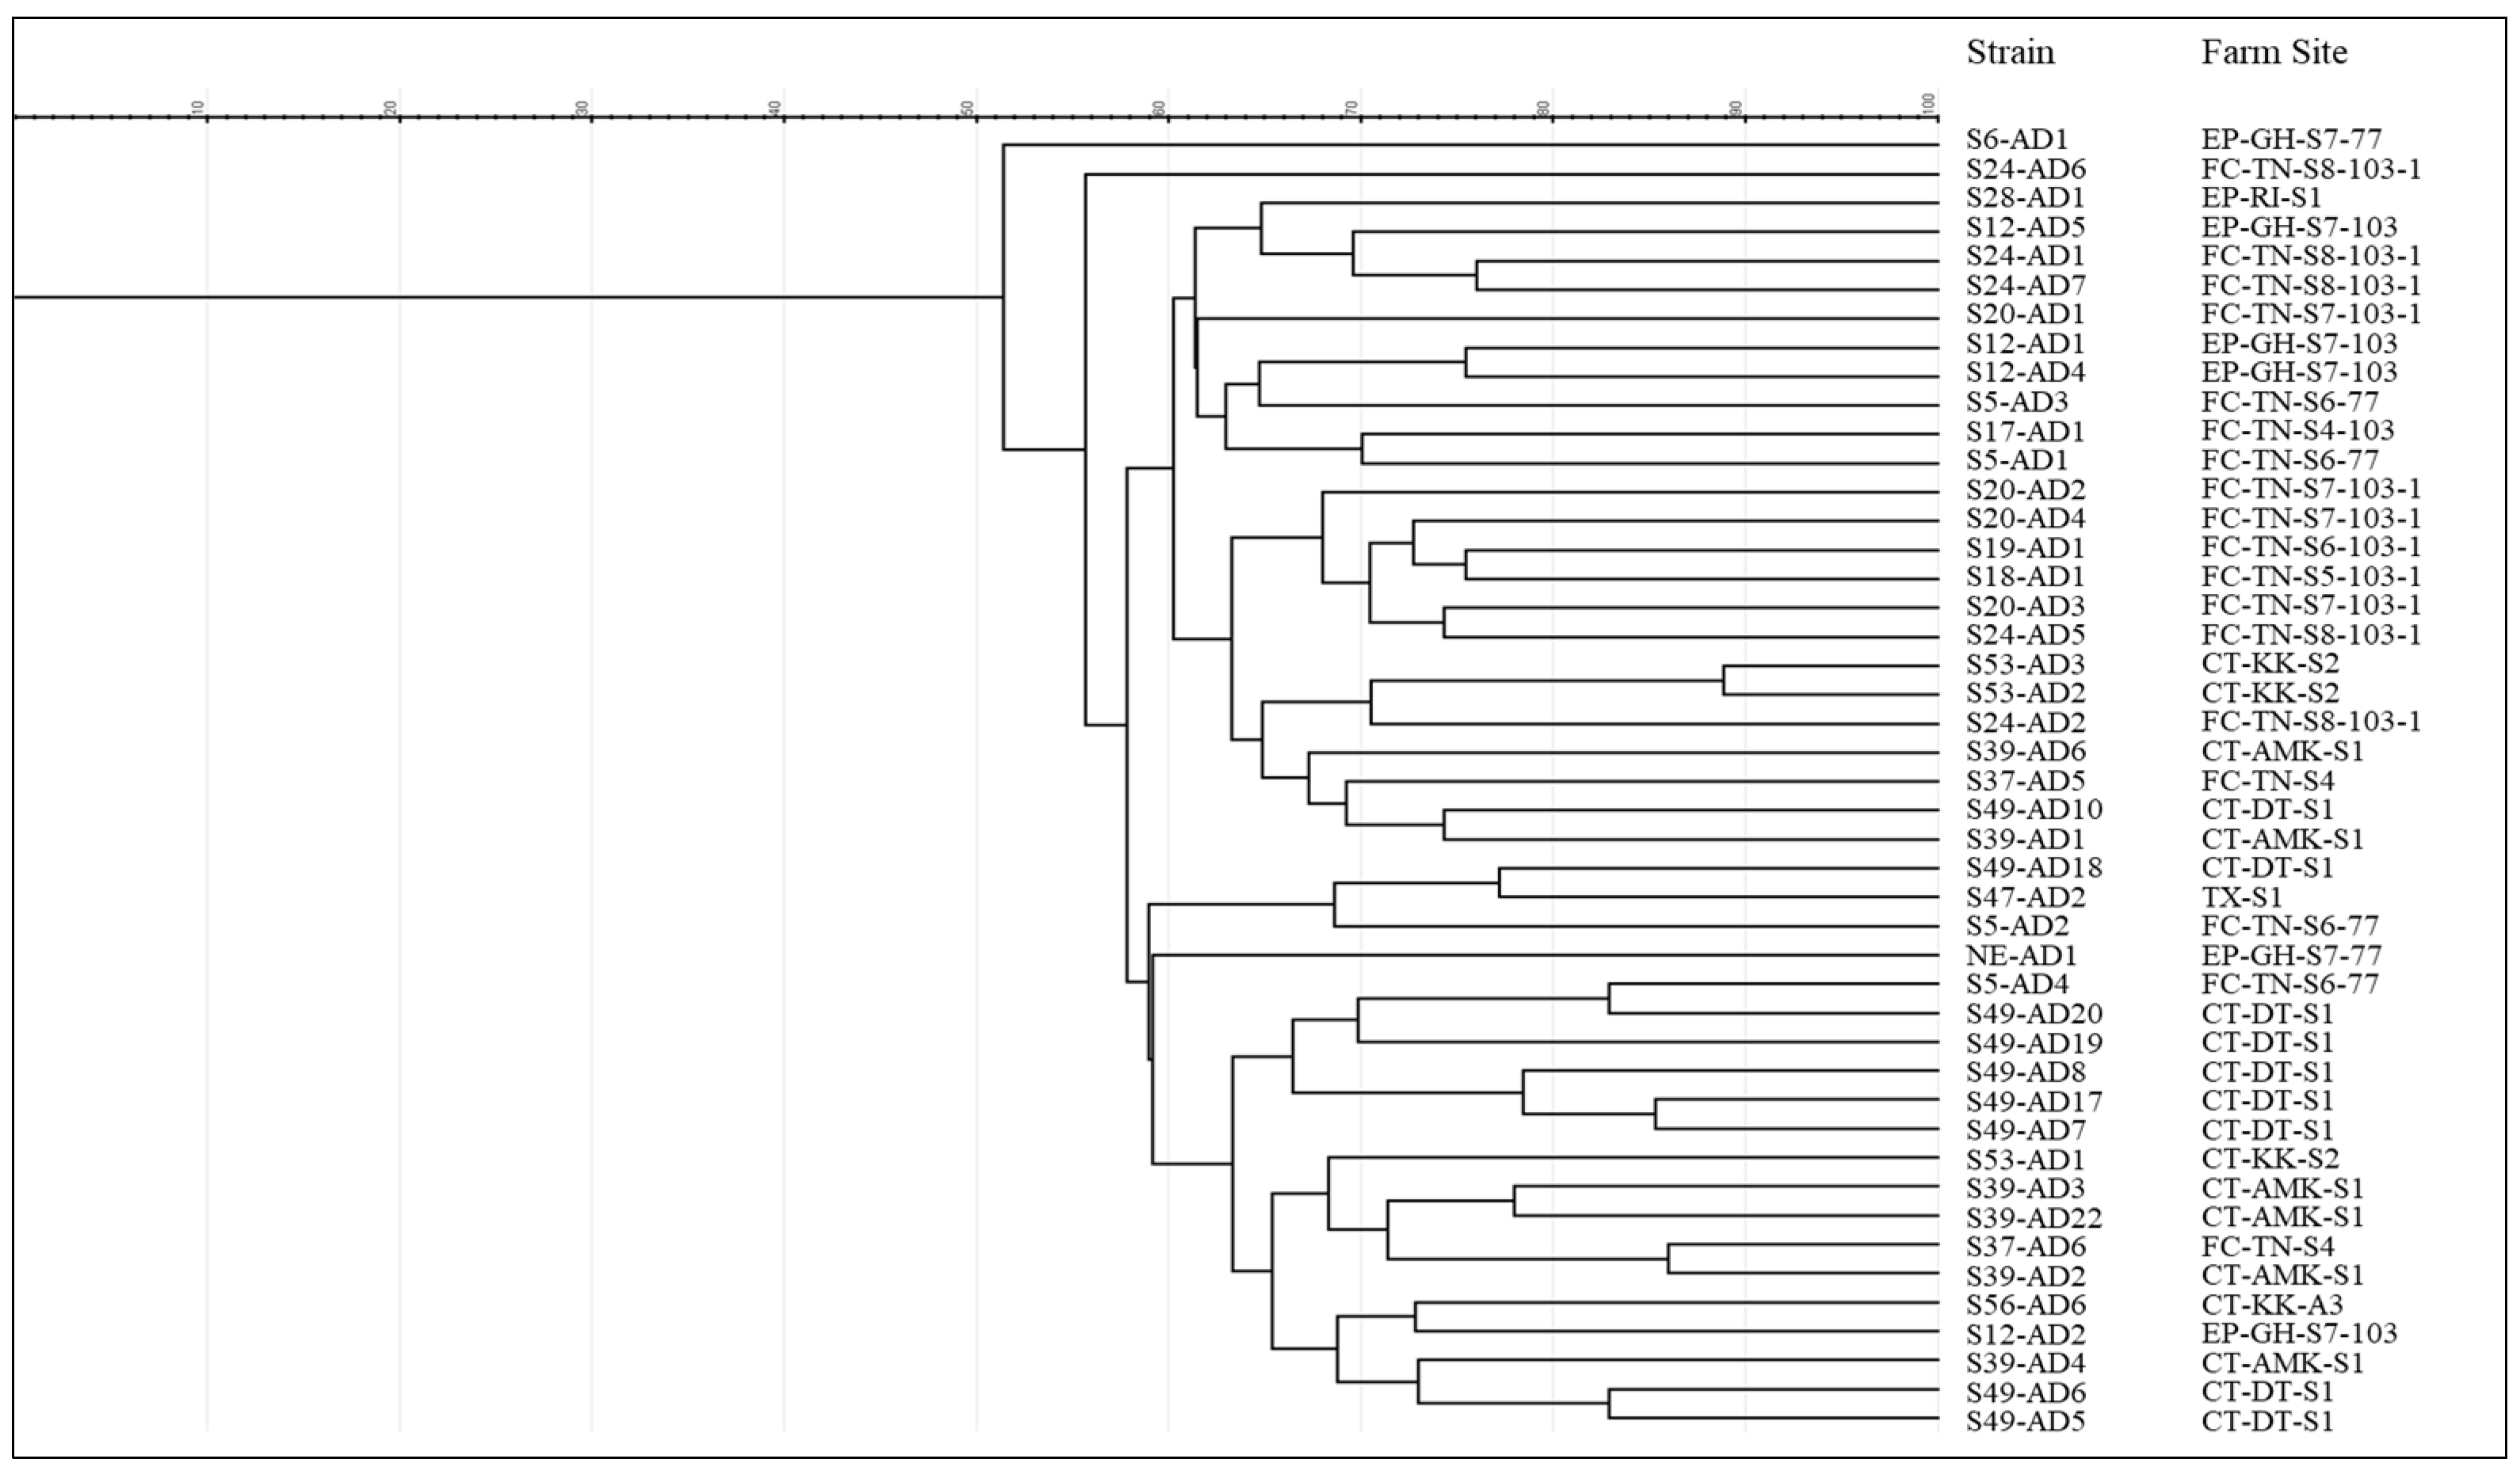
3.2. Isolation of Aeromonas dhakensis

Of the total 1076 presumptive yellow colonies obtained from the various farming systems in this study, 935 tested positive for oxidase activity, while there was no growth in the 6.5% NaCl-LB broth. Subsequent rpoD amplification of these isolates confirmed that 5% (45/935) of the isolates were A.dhakensis (Table 2, Figure S1).
Of the 45 A. dhakensis isolates, the ERIC-PCR assay showed amplification bands of various lengths, ranging from approximately 100 bp to 5 kb (Figure S2). Similarities between the fingerprints of A. dhakensis based on the band-matching Dice coefficient revealed non-replicate fingerprint patterns among the isolates, with 1% tolerance matching (Figure 3). At 70% and 80% similarity coefficients, the isolates were divided into 25 and 39 distinct clusters, respectively, indicating high genetic diversity of A. dhakensis across various tilapia pond systems.

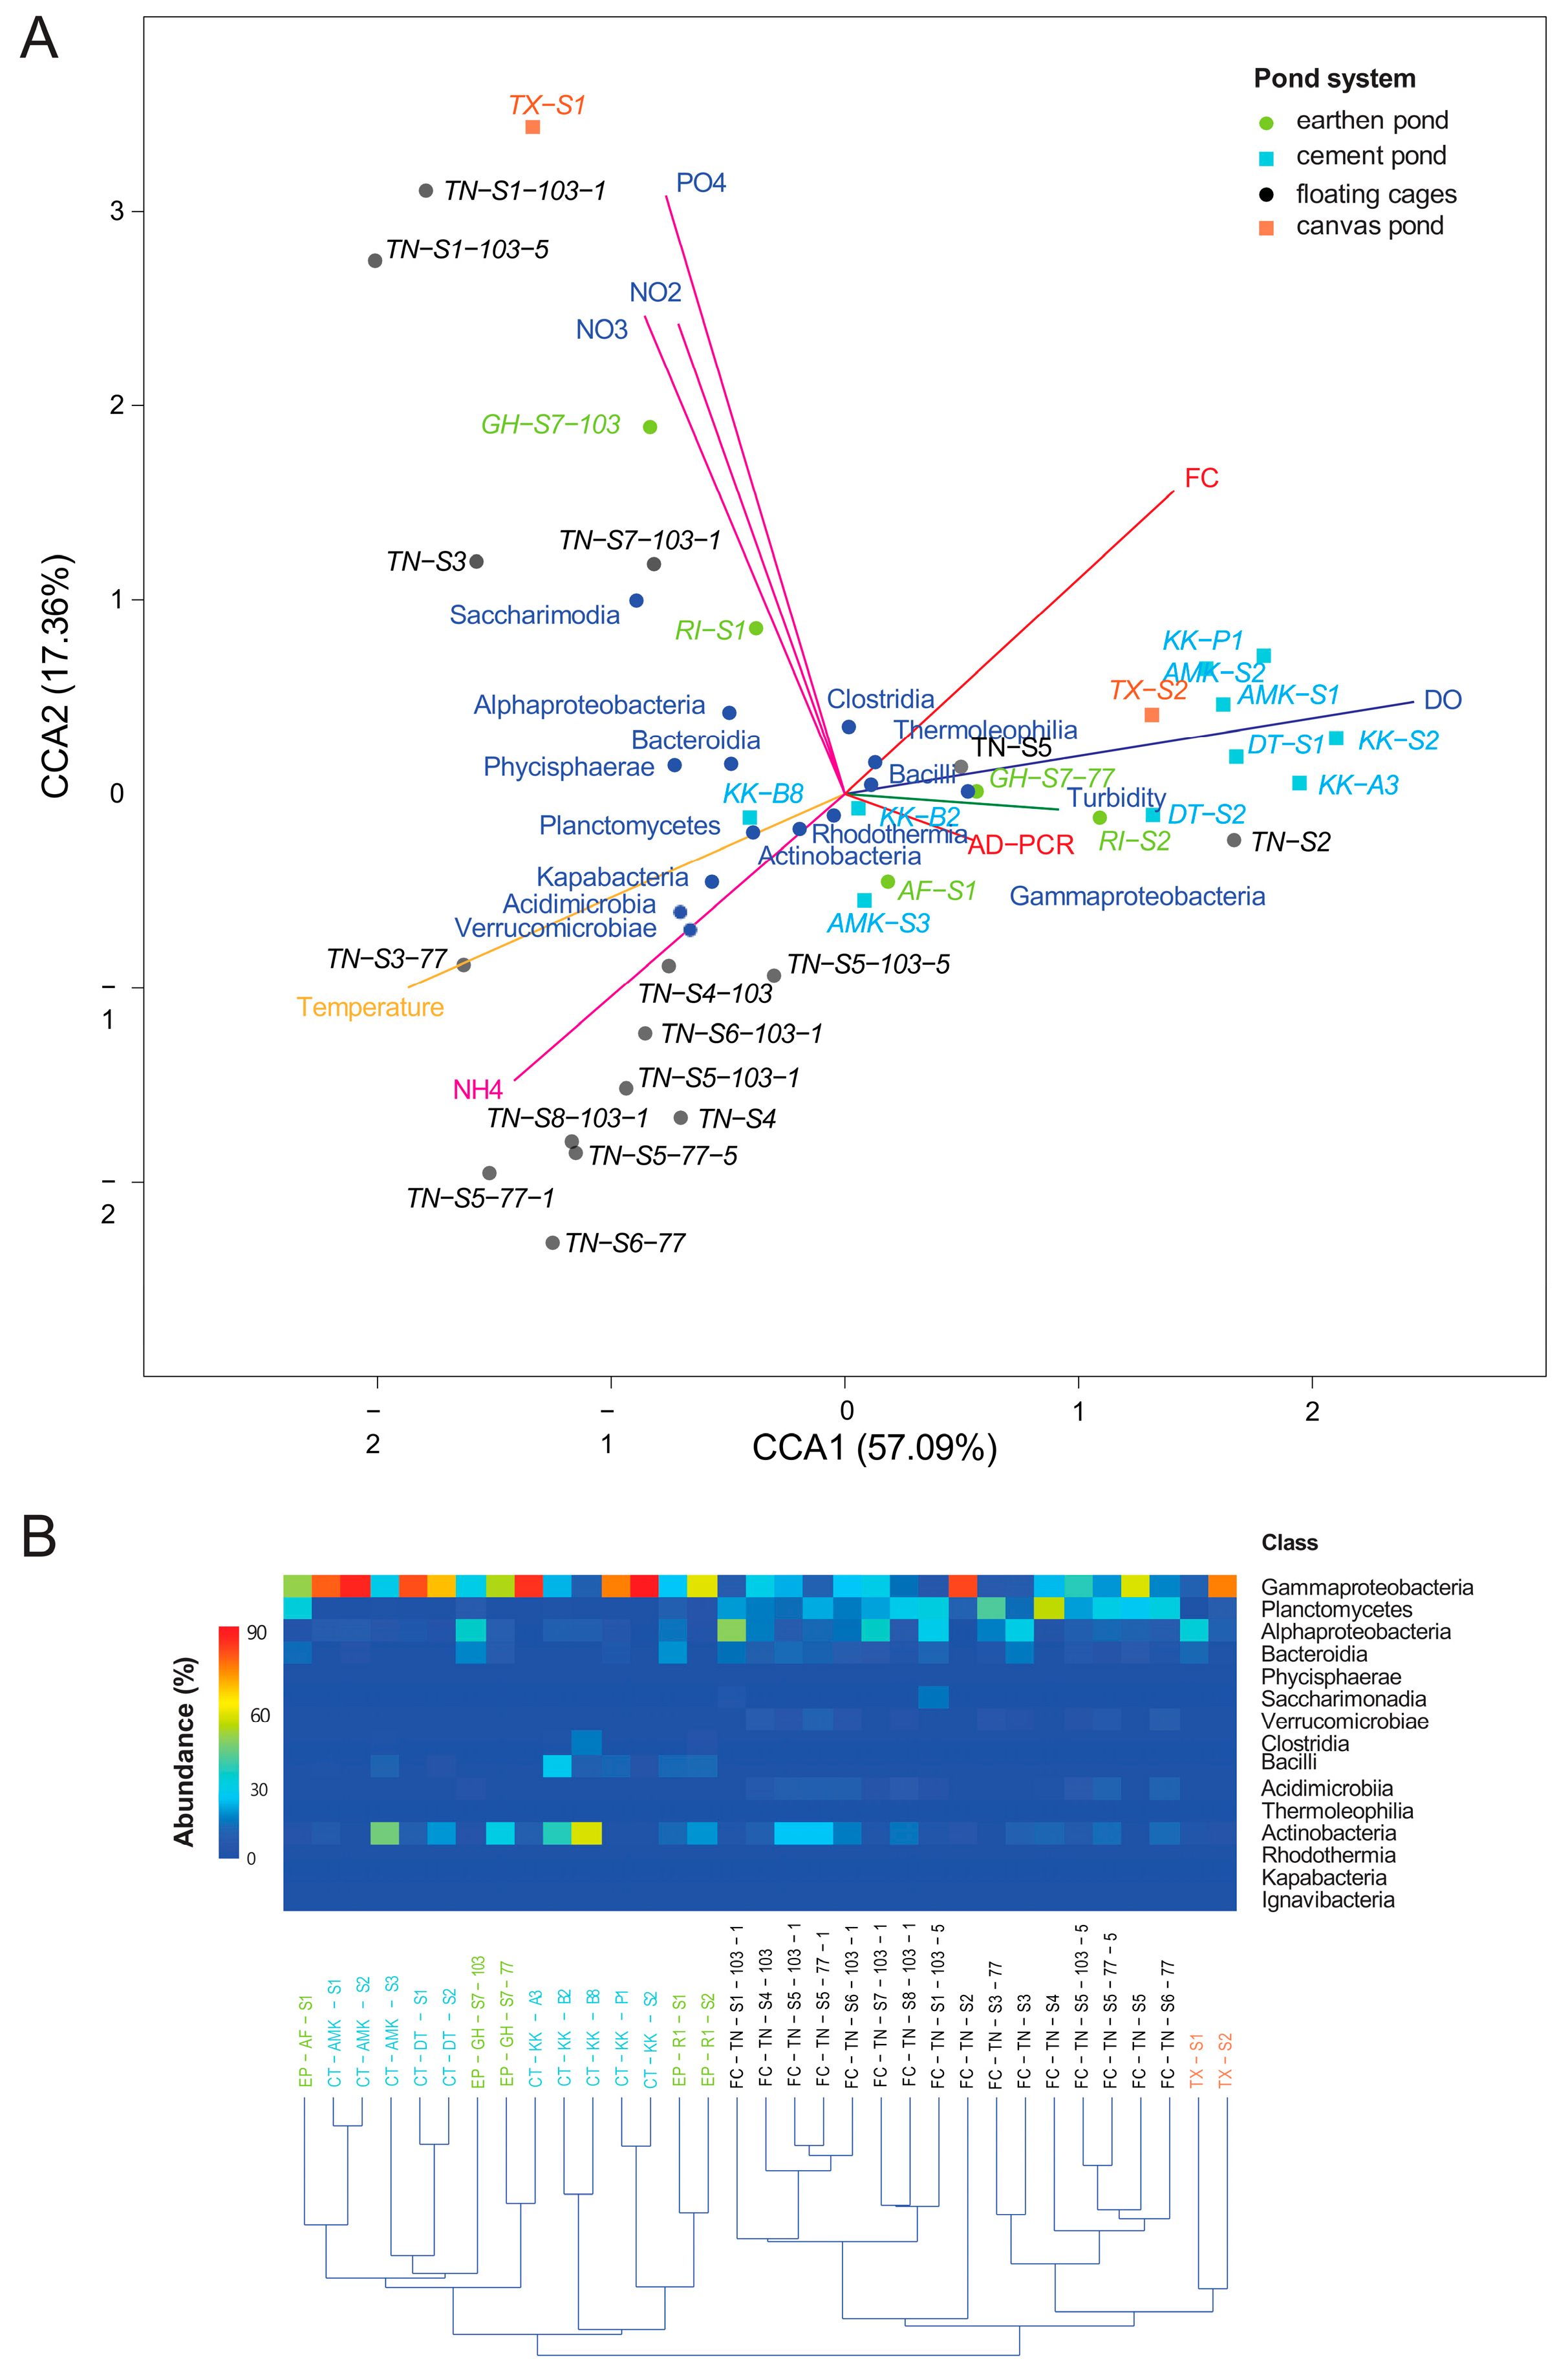
3.3. Microbial Diversity and Community Composition in Tilapia Farming Systems

Following sequence quality control and filtering, the 16S metabarcoding revealed a total of 828,333 sequences from 33 samples collected from different farming systems, with an average of 24,216 reads per sample (Table S2). These sequences were annotated and classified into 40 phyla, 294 families, and 452 genera. Proteobacteria, Actinobacteria, and Planctomycetota were the predominant phyla among the samples, accounting for the maximum compositions of up to 94%, 54%, and 52% of the total bacterial communities, respectively (Figure 4).
The microbial complexity in the various pond systems was assessed based on alpha-diversity and beta-diversity analyses. The results of Chao1 and Shannon diversity showed that there were no obvious differences in the microbial diversity and richness in the different pond systems (Figure 5A). Nonetheless, the species richness, as indicated by the Chao1 index, showed that the earthen pond and floating cage systems exhibited the highest median values (Figure 5A), indicating greater microbial richness compared to canvas and cement tanks. The canvas tank system had the lowest richness (Figure 5A). The Shannon diversity index, which accounts for both richness and evenness, showed that the cement tanks exhibited the lowest median diversity as compared to other systems (Wilcoxon test, p < 0.05; Figure 5A), suggesting that microbial communities in the cement tanks are less diverse and potentially less balanced in species evenness.
On the other hand, this study also revealed a degree of heterogeneity in the microbial community assemblages in different pond systems based on the beta diversity that was inferred from the nMDS analysis (Figure 5B).

3.4. Relationship Between Microbial Communities and Environmental Variables

The impact of physicochemical parameters on microbial communities in different tilapia pond systems was evaluated through canonical correlation analysis (CCA), with both axes explaining the majority of the variance (75.05%), as shown in Figure 6A. Overall, distinct clustering of microbial compositions was observed among pond types, as depicted in the heatmap (Figure 6B), suggesting that each pond system harbored unique microbial communities influenced by specific environmental factors.
Earthen ponds displayed a relatively more diverse microbial community with significant representations from Bacteroidia, Alphaproteobacteria, and Actinobacteria. These bacterial classes are associated with physicochemical indicators of better water quality, such as moderate DO and temperature. Floating cages were primarily associated with Alphaproteobacteria and Planctomycetia, as well as Bacteroidia. These classes are found to be associated with higher temperature and moderate nutrients. Cement and canvas tanks also displayed diverse communities, with high compositions of Gammaproteobacteria, Clostridia, and Bacilli. These bacterial classes are associated with nutrient-rich conditions, as seen in their close relationship with high levels of PO4, NO3, NO2, and turbidity (Figure 6A). The hierarchical clustering further supports the CCA results, as the heatmap revealed distinct microbial community structures among the pond systems (Figure 6B).

4. Discussion

Water quality in aquaculture systems is a critical factor for maintaining balanced ecosystems and ensuring the health of aquatic organisms. It influences not only the growth, disease susceptibility, and survival of cultured species but also plays a significant role in determining the composition and dynamics of microbial communities within these systems [29]. Past studies have shown that fluctuations in water quality parameters, including temperature, dissolved oxygen, pH, and nutrient levels, can lead to shifts in microbial community structure, potentially favoring pathogenic species or creating conditions conducive to dysbiosis, which is an imbalance in microbial populations [48,49]. This interplay between water quality and microbial dynamics directly impacts the resilience of aquaculture environments, as a balanced microbiome is essential for nutrient cycling, pathogen resistance, and overall ecosystem stability. Herein, we characterized the microbial communities within different tilapia aquaculture systems to develop a baseline understanding of the relationships between microbial communities and their respective environmental niches across different pond types. This foundational knowledge can serve as a reference for future research, enabling comparisons to assess how shifts in microbial community balance, or dysbiosis, may contribute to disease onset in aquaculture settings.

4.1. Characteristics of Microbial Communities and Water Quality in Different Pond Systems

In tilapia farming, the environmental factors of temperature and dissolved oxygen are among the important determinants of animal health. The optimum growth temperature of this warm-water fish ranged from 24 to 32 °C; elevated temperatures above the optima could cause abnormal stress responses and disrupt the physiological balance [50]. Notably, one of the earthen ponds in this study exhibited an extremely high temperature of 38 °C, which was likely to increase metabolic rates and eventually create a hypoxic condition, evidenced by the extremely low DO level (1.33 mg L−1), which can adversely impact the growth of tilapia as fish and increase the mortality rate of farmed animals [51]. Furthermore, six out of thirteen floating cages were recorded with critically low DO levels, ranging from 0.17 to 0.23 mg L−1 (Table S1), despite having relatively low water temperatures. Such DO levels may impair fish growth and feed intake, compromising immune responses and increasing susceptibility to pathogenic infections. Low DO levels will also increase ammonium concentration by inhibiting nitrification, causing ammonia toxicity and further weakening the innate immunity in fish [50,51,52,53].
The different tilapia aquaculture systems investigated in this study exhibited varying water quality conditions, likely due to different farm management practices being applied. Of the four pond systems, excessive ammonium accumulation in the water was recorded in floating cages in the ex-mining pools, likely due to the contaminated water source from poultry farms upstream, as the pools were connected by a river in the study area. Moreover, excessive loading of nitrogenous compounds from feed residues or excreta from farmed fish may also contribute to high ammonium levels in farming water [52,54]. This can impair the ability of farmed animals to efficiently excrete metabolic waste [54,55], resulting in physiological stress, lethargy, and, in severe cases, mortality [56]. This metabolic disturbance will induce chronic effects on the immune response of fish, thus increasing the risk of infections [54]. Planctomycetes, which were originally identified as freshwater bacteria, were found to prevail in these high ammonium ponds (Figure 4 and Figure 6). This group of microorganisms is known for its ability to oxidize ammonium and contribute to the nitrogen cycle [57]. Therefore, although a non-optimal level of ammonium was observed in some ponds studied, their presence may be important for preventing the water quality from becoming detrimental to fish health.
Among the four pond systems, canvas tanks apply the recirculating aquaculture system and reuse farm water by continuously filtering and circulating it through nitrifying biofilters [58]. As observed in this study, one of the canvas tanks was detected to have high levels of nitrite and nitrate and high levels of fecal coliform. The deteriorated water quality could be attributed to poor water treatment and/or improper management of the recirculating system [59]. This canvas tank (TX-S1) exhibited a very distinct microbial community (Figure 4), which harbored non-nitrifying Gammaproteobacteria and Alphaproteobacteria, which may reduce nitrification efficacy. However, this study had limited canvas tank samples; therefore, future research will require additional samples to substantiate the findings further.
In contrast, most earthen ponds and cement tanks in this study had optimal water quality, featured by high DO levels and low levels of nutrients, with some exceptional earthen ponds that showed high nutrient levels (Figure 5 and Figure 6). We observed the prevalence of beneficial bacterial communities like Actinobacteria and Bacilli in the ponds with optimal water quality. Both are beneficial bacteria, where Actinobacteria can decompose organic matter, while Bacilli are generally known for their probiotic characteristics [60,61].
This study highlights the need for targeted aquaculture management practices prioritizing water quality control and nutrient management. In future, further investigations should collect additional information, such as stocking densities, biomass, and feeding protocols, as these parameters influence nutrient availability, stress levels, and the composition and activity of microbial populations in different cultural systems. Regular monitoring of nutrient levels could help in implementing strategies to prevent microbial shifts toward dysbiosis, thereby managing the aquaculture environment for safer food fish production.

4.2. Prevalence of Aeromonas dhakensis in Tilapia Pond Systems

Disease outbreaks caused by Aeromonas species have become a significant constraint to sustainable aquaculture globally, with A. dhakensis emerging as a potential threat in aquaculture systems [62]. In this study, A. dhakensis was isolated from all four tilapia pond systems, including those with both high and low water quality indicators, suggesting that the presence of this pathogen is not related to a particular water quality parameter alone. Previous studies have shown that A. dhakensis is commonly found in various aquatic environments and hosts, including river water, lagoons, drinking water, and a range of aquatic animals, highlighting its ability to thrive under different environmental conditions [61]. Its resilience in various aquaculture pond systems suggests that this pathogen poses an adaptable survival strategy, enabling it to persist under both optimal and suboptimal water quality conditions.
Nonetheless, our findings also further reiterate the importance of nutrient management in aquaculture ponds, as a relatively high proportion of A. dhakensis was detected in tilapia ponds with high levels of turbidity or nutrients (Figure 6). Elevated nutrient levels may promote shifts in the microbial community structure that lead to dysbiosis, a condition marked by reduced microbial diversity and altered community balance. Dysbiosis can create favorable conditions for opportunistic pathogens, including A. dhakensis, to proliferate, potentially increasing the risk of disease outbreaks. For example, as demonstrated in numerous past studies [63,64] and this study, high levels of nitrogen compounds and phosphate can fuel microbial imbalances that disrupt normal pond microbiota. This disruption can make fish more susceptible to pathogenic invasions, as microbial stability is a key factor in maintaining the overall health of aquaculture systems.
In this study, ERIC-PCR successfully differentiated between clonally related and unrelated A. dhakensis isolates, indicating that this ERIC-PCR technique remains feasible, easy to perform, and cost-effective, with an acceptable outcome for molecular typing of the Aeromonas genus [35,65]. The fingerprints showed a high level of genetic diversity among A. dhakensis isolates recovered from 15 freshwater tilapia ponds. With greater genetic diversity in the A. dhakensis population, there are more genetic variations among individuals to help them adapt to the changes in the environment and strengthen their survival ability to resist disease and other stresses. This possibly explained our results in detecting A. dhakensis from ponds with high or low water quality in this study.
Overall, the ERIC-PCR results suggest that the 45 A. dhakensis isolates warrant further investigation via whole-genome sequencing to gain a better understanding of their population structure, including the sequence types (STs) and virulome diversity for them to thrive and evolve in different aquatic environments. Thus far, 86 STs have been deposited in the PubMLST Aeromonas dhakensis database, of which 8 STs have been associated with freshwater fish species, especially those economically valuable as cultivated food sources (https://pubmlst.org/aeromonas/, accessed on 14 October 2024). Documented examples include ST530 in climbing perch and bass (Vietnam), ST656 in striped catfish (Vietnam), ST812 and ST2518 in tilapia (Brazil), ST2495 in snakehead fish (China), ST2519 in redtail catfish (Brazil), ST2520 in zebrafish (China), and ST2727 in eel (Vietnam). The ST distribution underscores the pathogen’s capacity to infect various hosts in aquaculture, posing a substantial risk to food security. Therefore, sequence typing on the 45 A. dhakensis isolates in the future may add new inputs to the existing PubMLST database, help understand molecular epidemiology, and support genomic surveillance efforts to mitigate infection risks, especially MAS in aquaculture settings.

5. Conclusions

Our findings highlight the need for aquaculture management practices that prioritize maintaining balanced nutrient levels to prevent microbial community shifts toward pathogenic dominance. Different pond systems with varying water parameters can significantly influence microbial communities and their stability, thereby promoting pathogenic invasions. Moreover, future research could investigate the adaptive mechanism of A. dhakensis and its interactions with other microbial community members. Understanding these dynamics may help in developing tools for the mitigation of dysbiosis, such as probiotic applications [66,67]. Additionally, more comprehensive, long-term monitoring across diverse aquaculture systems could provide insights into seasonal or environmental factors that influence microbial community resilience, further supporting sustainable and pathogen-free aquaculture practices for safe food production.

Supplementary Materials

The following supporting information can be downloaded at: https://www.mdpi.com/article/10.3390/fishes10050204/s1. Figure S1. A gel file showing positive amplification of rpoD from presumptive aeromonad colonies. Lane 1, positive control (A. dhakensis, strain DSM 17689); Lane 2, negative control (A. hydrophila ATCC 7966); Lane 3, non-template control; Lanes 4–6, presumptive colonies with positive amplicons. Figure S2. A gel file showing representatives of ERIC-PCR profiles. Lanes 1–19, ERIC-PCR amplicons from different Aeromonas dhakensis strains. Table S1. Information on the sampling sites of the aquaculture farms in Malaysia. Table S2. BioSample accession numbers for 16S rRNA sequencing data from freshwater aquaculture water samples.

Author Contributions

S.L.L.: Writing—original draft, methodology, and investigation. S.M.P.: Conceptualization, writing—review and editing, formal analysis, funding acquisition, methodology, validation, and supervision. S.N.B.: Methodology and investigation. N.I.M.R.: Investigation. K.S.H.: Methodology and investigation. W.C.K.: Conceptualization, project administration, writing—review and editing, and validation. Y.C.L.: Conceptualization, project administration, writing—review and editing, and validation. K.T.A.: Conceptualization, project administration, writing—review and editing, and validation. K.H.C.: Conceptualization, writing—review and editing, funding acquisition, resources, and supervision. P.T.L.: Conceptualization, writing—review and editing, funding acquisition, methodology, resources, and supervision. C.P.L.: Conceptualization, writing—review and editing, formal analysis, funding acquisition, visualization, validation, and supervision. All authors have read and agreed to the published version of the manuscript.

Funding

This work was supported by the Singapore Food Agency through Grant No. IF076-2022 to S.M. Puah. This study forms part of S.L. Lim’s postgraduate project.

Institutional Review Board Statement

Not applicable.

Informed Consent Statement

Not applicable.

Data Availability Statement

The sequencing data obtained from water samples across the four freshwater aquaculture systems have been deposited in the NCBI Sequence Read Archive (SRA) database under BioProject ID PRJNA1224308 with the accession numbers SAMN46195145–SAMN46195177. Data from this study are available within the article and its Supplementary Materials. Data can also be obtained from the corresponding author upon reasonable request.

Conflicts of Interest

The authors declare no conflict of interest.

References

  1. Food and Agriculture Organization of the United Nations. The State of World Fisheries and Aquaculture 2020. Available online: https://www.fao.org/interactive/state-of-fisheries-aquaculture/2020/en/#:~:text=Fish%20is%20crucial%20to%20a (accessed on 31 August 2024).
  2. Food and Agriculture Organization of the United Nations. Fisheries and Aquaculture Projections, 2022–2032. Available online: https://openknowledge.fao.org/server/api/core/bitstreams/66538eba-9c85-4504-8438-c1cf0a0a3903/content/sofia/2024/fisheries-aquaculture-projections.html (accessed on 11 November 2024).
  3. Tacon, A.G.J. Trends in global aquaculture and aquafeed production: 2000–2017. Rev. Fish. Sci. Aquac. 2019, 28, 43–56. [Google Scholar] [CrossRef]
  4. Naylor, R.L.; Kishore, A.; Sumaila, U.R.; Issifu, I.; Hunter, B.P.; Belton, B.; Bush, S.R.; Cao, L.; Gelcich, S.; Gephart, J.A.; et al. Blue food demand across geographic and temporal scales. Nat. Commun. 2021, 12, 5413. [Google Scholar] [CrossRef]
  5. Garlock, T.; Asche, F.; Anderson, J.; Bjørndal, T.; Kumar, G.; Lorenzen, K.; Ropicki, A.; Smith, M.D.; Tveterås, R. A global blue revolution: Aquaculture growth across regions, species, and countries. Rev. Fish. Sci. Aquac. 2019, 28, 107–116. [Google Scholar] [CrossRef]
  6. Department of Fisheries Malaysia. Annual Fisheries Statistics. Available online: https://www.dof.gov.my/en/resources/fisheries-statistics-i/ (accessed on 31 August 2024).
  7. Mohamad, S.N.; Noordin, W.N.M.; Ismail, N.F.; Hamzah, A. Red hybrid tilapia (Oreochromis spp.) broodstock development programme in Malaysia: Status, challenges and prospects for future development. Asian Fish. Sci. 2021, 34, 73–81. [Google Scholar] [CrossRef]
  8. Kurniawan, S.B.; Ahmad, A.; Mohd Rahim, N.F.; Mohd Said, N.S.; Alnawajha, M.M.; Imron, M.F.; Abdullah, S.R.S.; Othman, A.R.; Ismail, N.I.; Abu Hasan, H. Aquaculture in Malaysia: Water-related environmental challenges and opportunities for cleaner production. Environ. Technol. Innov. 2021, 24, 101913. [Google Scholar] [CrossRef]
  9. Kelly, A.M.; Renukdas, N.N. Disease management of aquatic animals. In Aquaculture Health Management; Academic Press: Cambridge, MA, USA, 2020; pp. 137–161. [Google Scholar] [CrossRef]
  10. Azzam-Sayuti, M.; Ina-Salwany, M.Y.; Zamri-Saad, M.; Yusof, M.T.; Annas, S.; Najihah, M.Y.; Liles, M.R.; Monir, M.S.; Zaidi, Z.; Amal, M.N.A. The prevalence, putative virulence genes and antibiotic resistance profiles of Aeromonas spp. isolated from cultured freshwater fishes in peninsular Malaysia. Aquaculture 2021, 540, 736719. [Google Scholar] [CrossRef]
  11. Bartie, K.L.; Ngo, T.P.H.; Bekaert, M.; Hoàng Oanh, D.T.; Hoare, R.; Adams, A.; Desbois, A.P. Aeromonas hydrophila ST251 and Aeromonas dhakensis are major emerging pathogens of striped catfish in Vietnam. Front. Microbiol. 2023, 13, 1067235. [Google Scholar] [CrossRef]
  12. Basri, L.; Nor, R.M.; Salleh, A.; Md. Yasin, I.S.; Saad, M.Z.; Abd. Rahaman, N.Y.; Barkham, T.; Amal, M.N.A. Co-Infections of Tilapia Lake Virus, Aeromonas hydrophila and Streptococcus agalactiae in Farmed Red Hybrid Tilapia. Animals 2020, 10, 2141. [Google Scholar] [CrossRef]
  13. Erickson, V.I.; Khoi, L.M.; Hounmanou, Y.M.G.; Dung, T.T.; Phú, T.M.; Dalsgaard, A. Comparative genomic analysis of Aeromonas dhakensis and Aeromonas hydrophila from diseased striped catfish fingerlings cultured in Vietnam. Front. Microbiol. 2023, 14, 1254781. [Google Scholar] [CrossRef]
  14. Soto-Rodriguez, S.A.; Cabanillas-Ramos, J.; Alcaraz, U.; Gomez-Gil, B.; Romalde, J.L. Identification and virulence of Aeromonas dhakensis, Pseudomonas mosselii and Microbacterium paraoxydans isolated from Nile tilapia, Oreochromis niloticus, cultivated in Mexico. J. Appl. Microbiol. 2013, 115, 654–662. [Google Scholar] [CrossRef]
  15. Yi, S.W.; Chung, T.H.; Joh, S.J.; Park, C.; Park, B.Y.; Shin, G.W. High prevalence of BlaCTX-M group genes in Aeromonas dhakensis isolated from aquaculture fish species in South Korea. J. Vet. Med. Sci. 2014, 76, 1589–1593. [Google Scholar] [CrossRef] [PubMed]
  16. Carriero, M.M.; Mendes Maia, A.A.; Moro Sousa, R.L.; Henrique-Silva, F. Characterization of a new strain of Aeromonas dhakensis isolated from diseased pacu fish (Piaractus mesopotamicus) in Brazil. J. Fish Dis. 2016, 39, 1285–1295. [Google Scholar] [CrossRef] [PubMed]
  17. Preena, P.G.; Dharmaratnam, A.; Kumar, V.J.R.; Swaminathan, T.R. Plasmid-mediated antimicrobial resistance in motile aeromonads from diseased Nile tilapia (Oreochromis niloticus). Aquac. Res. 2020, 52, 237–248. [Google Scholar] [CrossRef]
  18. Azzam-Sayuti, M.; Ina-Salwany, M.Y.; Zamri-Saad, M.; Annas, S.; Liles, M.R.; Xu, T.; Amal, M.N.A.; Yusof, M.T. Draft genome sequence of myo-inositol utilizing Aeromonas dhakensis 1P11S3 isolated from striped catfish (Pangasianodon hypopthalmus) in a local fish farm in Malaysia. Data Brief 2022, 41, 107974. [Google Scholar] [CrossRef]
  19. Hanson, L.A.; Hemstreet, W.G.; Hawke, J.P. Motile Aeromonas Septicemia (MAS) in Fish. Available online: https://srac.msstate.edu/pdfs/Fact%20Sheets/478%20Motile%20Aeromonas%20Septicemia%20(MAS)%20in%20Fish%202019.pdf (accessed on 31 August 2024).
  20. Azzam-Sayuti, M.; Ina-Salwany, M.Y.; Zamri-Saad, M.; Annas, S.; Yusof, M.T.; Monir, M.S.; Mohamad, A.; Muhamad-Sofie, M.H.N.; Lee, J.Y.; Chin, Y.K.; et al. Comparative pathogenicity of Aeromonas spp. in cultured red hybrid tilapia (Oreochromis niloticus × O. mossambicus). Biology 2021, 10, 1192. [Google Scholar] [CrossRef]
  21. Chiquito-Contreras, R.G.; Hernandez-Adame, L.; Alvarado-Castillo, G.; Martínez-Hernández, M.d.J.; Sánchez-Viveros, G.; Chiquito-Contreras, C.J.; Hernandez-Montiel, L.G. Aquaculture—Production system and waste management for agriculture fertilization—A review. Sustainability 2022, 14, 7257. [Google Scholar] [CrossRef]
  22. Verdegem, M.; Buschmann, A.H.; Win Latt, U.; Dalsgaard, A.J.T.; Lovatelli, A. The contribution of aquaculture systems to global aquaculture production. J. World Aquac. Soc. 2023, 54, 206–250. [Google Scholar] [CrossRef]
  23. Masser, M.P. Cage culture in freshwater and protected marine areas. In Aquaculture Production Systems; John Wiley & Sons, Inc.: Hoboken, NJ, USA, 2012; pp. 119–134. [Google Scholar] [CrossRef]
  24. David, G.S.; Carvalho, E.D.; Lemos, D.; Silveira, A.N.; Dall’Aglio-Sobrinho, M. Ecological carrying capacity for intensive tilapia (Oreochromis niloticus) cage aquaculture in a large hydroelectrical reservoir in Southeastern Brazil. Aquacult. Eng. 2015, 66, 30–40. [Google Scholar] [CrossRef]
  25. Menon, S.; Kumar, A.; Middha, S.K.; Paital, B.; Mathur, S.; Johnson, R.; Kademan, A.; Usha, T.; Hemavathi, K.N.; Dayal, S.; et al. Water physicochemical factors and oxidative stress physiology in fish, a review. Front. Environ. Sci. 2023, 11, 1240813. [Google Scholar] [CrossRef]
  26. Abdel-Tawwab, M.; Hagras, A.E.; Elbaghdady, H.A.M.; Monier, M.N. Effects of dissolved oxygen and fish size on Nile tilapia, Oreochromis niloticus (L.): Growth performance, whole-body composition, and innate immunity. Aquac. Int. 2015, 23, 1261–1274. [Google Scholar] [CrossRef]
  27. Sundh, H.; Finne-Fridell, F.; Ellis, T.; Taranger, G.L.; Niklasson, L.; Pettersen, E.F.; Wergeland, H.I.; Sundell, K. Reduced water quality associated with higher stocking density disturbs the intestinal barrier functions of Atlantic salmon (Salmo salar L.). Aquaculture 2019, 512, 734356. [Google Scholar] [CrossRef]
  28. McMurtrie, J.; Alathari, S.; Chaput, D.L.; Bass, D.; Ghambi, C.; Nagoli, J.; Delamare-Deboutteville, J.; Mohan, C.V.; Cable, J.; Temperton, B.; et al. Relationships between pond water and tilapia skin microbiomes in aquaculture ponds in Malawi. Aquaculture 2022, 558, 738367. [Google Scholar] [CrossRef]
  29. Sun, F.; Wang, C.; Yang, H. Physicochemical factors drive bacterial communities in an aquaculture environment. Front. Environ. Sci. 2021, 9, 709541. [Google Scholar] [CrossRef]
  30. Liu, Z.; Iqbal, M.; Zeng, Z.; Lian, Y.; Zheng, A.; Zhao, M.; Li, Z.; Wang, G.; Li, Z.; Xie, J. Comparative analysis of microbial community structure in the ponds with different aquaculture model and fish by high-throughput sequencing. Microb. Pathog. 2020, 142, 104101. [Google Scholar] [CrossRef] [PubMed]
  31. Rieder, J.; Kapopoulou, A.; Bank, C.; Adrian-Kalchhauser, I. Metagenomics and metabarcoding experimental choices and their impact on microbial community characterization in freshwater recirculating aquaculture systems. Environ. Microbiome 2023, 18, 8. [Google Scholar] [CrossRef]
  32. Soh, M.; Er, S.; Low, A.; Jaafar, Z.; de Boucher, R.; Seedorf, H. Spatial and temporal changes in gut microbiota composition of farmed Asian seabass (Lates calcarifer) in different aquaculture settings. Microbiol. Spectr. 2025, e01989-24. [Google Scholar] [CrossRef]
  33. Ismail, N.I.A.; Amal, M.N.A.; Shohaimi, S.; Saad, M.Z.; Abdullah, S.Z. Associations of water quality and bacteria presence in cage cultured red hybrid tilapia, Oreochromis niloticus × O. mossambicus. Aquac. Rep. 2016, 4, 57–65. [Google Scholar] [CrossRef]
  34. Niu, S.; Zhang, K.; Li, Z.; Xie, J.; Wang, G.; Li, H.; Yu, E.; Xia, Y.; Tian, J.; Gong, W. Analysis of the structure and function of microbial community in late-stage of grass carp (Ctenopharyngodon idella) farming ponds. Aquac. Rep. 2023, 30, 101556. [Google Scholar] [CrossRef]
  35. Khor, W.C.; Puah, S.M.; Tan, J.; Puthucheary, S.D.; Chua, K.H. Phenotypic and genetic diversity of Aeromonas species isolated from freshwater lakes in Malaysia. PLoS ONE 2015, 10, e0145933. [Google Scholar] [CrossRef]
  36. Puah, S.M.; Khor, W.C.; Kee, B.P.; Tan, J.A.M.A.; Puthucheary, S.D.; Chua, K.H. Development of a species-specific PCR-RFLP targeting rpoD gene fragment for discrimination of Aeromonas species. J. Med. Microbiol. 2018, 67, 1271–1278. [Google Scholar] [CrossRef]
  37. Szczuka, E.; Kaznowski, A. Typing of clinical and environmental Aeromonas sp. strains by random amplified polymorphic DNA PCR, repetitive extragenic palindromic PCR, and enterobacterial repetitive intergenic consensus sequence PCR. J. Clin. Microbiol. 2004, 42, 220–228. [Google Scholar] [CrossRef] [PubMed]
  38. Heras, J.; Domínguez, C.; Mata, E.; Larrea, C.; Pascual, V.; Lozano, C.; Torres, C.; Zarazaga, M. GelJ—A tool for analyzing DNA fingerprint gel images. BMC Bioinform. 2015, 16, 1–8. [Google Scholar] [CrossRef] [PubMed]
  39. Matsuo, Y.; Komiya, S.; Yasumizu, Y.; Yasuoka, Y.; Mizushima, K.; Takagi, T.; Kryukov, K.; Fukuda, A.; Morimoto, Y.; Naito, Y.; et al. Full-length 16S rRNA gene amplicon analysis of human gut microbiota using MinIONTM nanopore sequencing confers species-level resolution. BMC Microbiol. 2021, 21, 35. [Google Scholar] [CrossRef]
  40. Andrews, S. FastQC: A Quality Control Tool for High Throughput Sequence Data. Available online: http://www.bioinformatics.babraham.ac.uk/projects/fastqc/ (accessed on 14 October 2024).
  41. Chen, S.; Zhou, Y.; Chen, Y.; Gu, J. Fastp: An ultra-fast all-in-one FASTQ preprocessor. Bioinformatics 2018, 34, i884–i890. [Google Scholar] [CrossRef]
  42. Wood, D.E.; Salzberg, S.L. Kraken: Ultrafast metagenomic sequence classification using exact alignments. Genome Biol. 2014, 15, R46. [Google Scholar] [CrossRef]
  43. R Core Development Team. A Language and Environment for Statistical Computing. R Foundation for Statistical Computing: Vienna, Austria. Available online: https://www.R-project.org/ (accessed on 14 October 2024).
  44. Wickham, H. Programming with ggplot2. In ggplot2; Springer: Cham, Switzerland, 2016; pp. 189–201. [Google Scholar] [CrossRef]
  45. Xie, J.; Chen, Y.; Cai, G.; Cai, R.; Huang, Z.; Wang, H. Tree Visualization by one table (tvBOT): A web application for visualizing, modifying and annotating phylogenetic trees. Nucleic Acids Res. Spec. Publ. 2023, 51, W587–W592. [Google Scholar] [CrossRef] [PubMed]
  46. Lê, S.; Josse, J.; Husson, F. FactoMineR: AnRPackage for multivariate analysis. J. Stat. Softw. 2008, 25, 1–18. [Google Scholar] [CrossRef]
  47. Oksanen, J.; Blanchet, F.G.; Friendly, M.; Kindt, R.; Legendre, P.; McGlinn, D.; Minchin, P.R.; O’Hara, R.B.; Simpson, G.L.; Solymos, P.; et al. Vegan: Community Ecology Package. Available online: https://github.com/vegandevs/vegan (accessed on 14 October 2024).
  48. Blancheton, J.P.; Attramadal, K.J.K.; Michaud, L.; d’Orbcastel, E.R.; Vadstein, O. Insight into bacterial population in aquaculture systems and its implication. Aquacult. Eng. 2013, 53, 30–39. [Google Scholar] [CrossRef]
  49. Martínez-Porchas, M.; Vargas-Albores, F. Microbial metagenomics in aquaculture: A potential tool for a deeper insight into the activity. Rev. Aquac. 2017, 9, 42–56. [Google Scholar] [CrossRef]
  50. Abd El-Hack, M.E.; El-Saadony, M.T.; Nader, M.M.; Salem, H.M.; El-Tahan, A.M.; Soliman, S.M.; Khafaga, A.F. Effect of environmental factors on growth performance of Nile tilapia (Oreochromis niloticus). Int. J. Biometeorol. 2022, 66, 2183–2194. [Google Scholar] [CrossRef]
  51. Khater, E.-S.; Bahnasawy, A.; El-Ghobashy, H.; Shaban, Y.; Elsheikh, F.; El-Reheem, S.A.; Aboegela, M. Mathematical model for predicting oxygen concentration in tilapia fish farms. Sci. Rep. 2021, 11, 24130. [Google Scholar] [CrossRef]
  52. Abdel-Tawwab, M.; Monier, M.N.; Hoseinifar, S.H.; Faggio, C. Fish response to hypoxia stress: Growth, physiological, and immunological biomarkers. Fish Physiol. Biochem. 2019, 45, 997–1013. [Google Scholar] [CrossRef] [PubMed]
  53. Schafer, N.; Matousek, J.; Rebl, A.; Stejskal, V.; Brunner, R.M.; Goldammer, T.; Verleih, M.; Korytar, T. Effects of chronic hypoxia on the immune status of pikeperch (Sander lucioperca Linnaeus, 1758). Biology 2021, 10, 649. [Google Scholar] [CrossRef] [PubMed]
  54. Xu, Z.; Cao, J.; Qin, X.; Qiu, W.; Mei, J.; Xie, J. Toxic effects on bioaccumulation, hematological parameters, oxidative stress, immune responses and tissue structure in fish exposed to ammonium nitrogen: A review. Animals 2021, 11, 3304. [Google Scholar] [CrossRef] [PubMed]
  55. Gyamfi, S.; Edziyie, R.E.; Obirikorang, K.A.; Adjei-Boateng, D.; Skov, P.V. Nile tilapia (Oreochromis niloticus) show high tolerance to acute ammonium exposure but lose metabolic scope during prolonged exposure at low concentration. Aquat. Toxicol. 2024, 271, 106932. [Google Scholar] [CrossRef]
  56. Gogoi, M.; Bhattacharya, P.; Kumar Sen, S.; Mukherjee, I.; Bhushan, S.; Chaudhuri, S.R. Aquaculture effluent treatment with ammonium remover Bacillus albus (ASSF01). J. Environ. Chem. Eng. 2021, 9, 105697. [Google Scholar] [CrossRef]
  57. Wiegand, S.; Jogler, M.; Jogler, C. On the maverick Planctomycetes. FEMS Microbiol. Rev. 2018, 42, 739–760. [Google Scholar] [CrossRef]
  58. Ruiz, P.; Vidal, J.M.; Sepúlveda, D.; Torres, C.; Villouta, G.; Carrasco, C.; Aguilera, F.; Ruiz-Tagle, N.; Urrutia, H. Overview and future perspectives of nitrifying bacteria on biofilters for recirculating aquaculture systems. Rev. Aquac. 2019, 12, 1478–1494. [Google Scholar] [CrossRef]
  59. Li, J.; Jin, Q.; Liang, Y.; Geng, J.; Xia, J.; Chen, H.; Yun, M. Highly efficient removal of nitrate and phosphate to control eutrophication by the dielectrophoresis-assisted adsorption method. Int. J. Environ. Res. Public Health 2022, 19, 1890. [Google Scholar] [CrossRef]
  60. Olmos, J.; Acosta, M.; Mendoza, G.; Pitones, V. Bacillus subtilis, an ideal probiotic bacterium to shrimp and fish aquaculture that increase feed digestibility, prevent microbial diseases, and avoid water pollution. Arch. Microbiol. 2019, 202, 427–435. [Google Scholar] [CrossRef]
  61. Duan, Y.; Xiong, D.; Li, Y.; Ding, X.; Dong, H.; Wang, W.; Zhang, J. Changes in the microbial communities of the rearing water, sediment and gastrointestinal tract of Lateolabrax maculatus at two growth stages. Aquac. Rep. 2021, 20, 100742. [Google Scholar] [CrossRef]
  62. Bartie, K.L.; Desbois, A.P. Aeromonas dhakensis: A zoonotic bacterium of increasing importance in aquaculture. Pathogens 2024, 13, 465. [Google Scholar] [CrossRef] [PubMed]
  63. Dai, L.; Liu, C.; Peng, L.; Song, C.; Li, X.; Tao, L.; Li, G. Different distribution patterns of microorganisms between aquaculture pond sediment and water. J. Microbiol. 2021, 59, 376–388. [Google Scholar] [CrossRef] [PubMed]
  64. Li, X.; Liu, L.; Zhu, Y.; Zhu, T.; Wu, X.; Yang, D. Microbial community structure and its driving environmental factors in black carp (Mylopharyngodon piceus) aquaculture pond. Water 2021, 13, 3089. [Google Scholar] [CrossRef]
  65. Cheok, Y.Y.; Puah, S.M.; Chua, K.H.; Tan, J.A.M.A. Isolation and molecular identification of Aeromonas species from the tank water of ornamental fishes. Acta Vet. Hung. 2020, 68, 130–139. [Google Scholar] [CrossRef]
  66. Bentzon-Tilia, M.; Sonnenschein, E.C.; Gram, L. Monitoring and managing microbes in aquaculture—Towards a sustainable industry. Microb. Biotechnol. 2016, 9, 576–584. [Google Scholar] [CrossRef]
  67. Wang, C.; Chuprom, J.; Wang, Y.; Fu, L. Beneficial bacteria for aquaculture: Nutrition, bacteriostasis and immunoregulation. J. Appl. Microbiol. 2019, 128, 28–40. [Google Scholar] [CrossRef]
Figure 1. Photographs showing various aquaculture systems for freshwater Nile tilapia sampled in this study. Earthen ponds (AC), canvas tanks (D), ex-mining ponds with floating cages (E), and concrete cement tanks (FH).
Fishes 10 00204 g001
Figure 2. Ordination of principal component analysis (PCA) showing the correlations between physicochemical environmental variables across different tilapia farming systems. (A) A biplot depicting the contribution of the variables to Dim1 and Dim2 as indicated by the length and color intensity of the arrows. The darker red and longer arrows denote a higher contribution, whereas the darker blue and shorter arrows denote the variables with lower contributions. (B) Individual sample plot showing the distribution of individual water samples grouped into three distinct clusters based on their physicochemical profiles.
Fishes 10 00204 g002
Figure 3. Dendrogram showing ERIC-PCR fingerprints of the 45 Aeromonas dhakensis strains. It was constructed using the Dice similarity coefficient and UPGMA cluster method, with a tolerance of 1% band matching. Pond system types are represented by the following prefixes: canvas tank (TX), cement tank (CT), earthen pond (EP), and floating cages (FC).
Fishes 10 00204 g003
Figure 4. Taxonomic distribution of bacterial communities at the phylum- (A) and class-level (B) abundances across different tilapia farming systems. Prefixes represent the pond system types: canvas tank (TX), cement tank (CT), earthen pond (EP), and floating cages (FC). “Other” includes minor compositions.
Fishes 10 00204 g004
Figure 5. Alpha diversity based on the Chao1 and Shannon diversity indices (A) and beta diversity inferred from the non-metric multidimensional scaling (nMDS) (B) of the bacterial communities across different tilapia farming systems in this study. Significant level: *, p < 0.05; ***, p < 0.001.
Fishes 10 00204 g005
Figure 6. Canonical correspondence analysis (CCA) and hierarchical clustering dendrogram. (A) Ordination of the CCA depicts the correlations between dominant bacterial classes and physicochemical variables, explaining the bacterial community structuring in different tilapia farming systems. (B) Hierarchical clustering dendrogram of dominant bacterial classes in different tilapia farming systems based on the Bray–Curtis dissimilarity constructed using a complete linkage algorithm. Pond system types are represented by the following prefixes: canvas tank (TX), cement tank (CT), earthen pond (EP), and floating cages (FC).
Fishes 10 00204 g006
Table 1. Range of physicochemical water quality parameters recorded across four different tilapia farming systems in Perak and Selangor, Malaysia.
Physiochemical ParametersPond System
Earthen PondFloating CageCanvas TankCement Tank
RangeMean ± Standard DeviationRangeMean ± Standard DeviationRangeMean ± Standard DeviationRangeMean ± Standard Deviation
Temperature (°C)28.70–38.0031.68 ± 3.6831.20–34.0032.17 ± 0.6329.20–30.0029.60 ± 0.5725.50–32.1029.01 ± 2.46
pH6.50–7.307.00 ± 0.446.10–6.706.45 ± 0.256.70–6.906.80 ± 0.146.00–7.106.68 ± 0.31
DO (mg L−1)0.21–6.223.10 ± 2.370.17–11.203.22 ± 3.625.32–9.347.33 ± 2.842.20–8.595.53 ± 2.05
Turbidity (mg L−1)65.67–1161.66328.00 ± 467.3522.00–897.67194.86 ± 228.93nana81.00–172.66126.83 ± 64.81
NO3 (mg L−1)0.60–1.000.76 ± 0.180.50–1.150.74 ± 0.1748.20-0.30–1.500.79 ± 0.36
NO2 (mg L−1)0.002–0.0100.005 ± 0.0030.002–0.0150.008 ± 0.0040.591-0.005–0.1020.017 ± 0.032
NH4 (mg L−1)0.00–0.440.26 ± 0.190.10–1.270.87 ± 0.320.13-0.02–1.180.33 ± 0.35
PO4 (mg L−1)0.07–0.340.19 ± 0.110.01–0.800.17 ± 0.215.46-0.10–0.960.36 ± 0.33
Table 2. Isolation of Aeromonas dhakensis from different ponds of the freshwater aquaculture farms in Perak and Selangor, Malaysia.
Pond SystemsSample IDPresumptive ColoniesNumber of Oxidase-
Positive Colonies
Number of Representative ERIC-PCR-Positive IsolatesStrain
Earthen pondEP-RI-S115141S28-AD1
EP-RI-S225250-
EP-AF-S125250-
EP-GH-S7-1031271174S12-AD1, S12-AD2, S12-AD4, S12-AD5
EP-GH-S7-7750192S6-AD1, NE-AD1
Floating cagesFC-TN-S1-103-129200-
FC-TN-S225250-
FC-TN-S325230-
FC-TN-S3-7714140-
FC-TN-S425232S37-AD5, S37-AD6
FC-TN-S4-10368631S17-AD1
FC-TN-S525250-
FC-TN-S5-103-160301S18-AD1
FC-TN-S5-77-125250-
FC-TN-S6-7735284S5-AD1, S5-AD2, S5-AD3, S5-AD4
FC-TN-S6-103-180771S19-AD1
FC-TN-S7-103-161544S20-AD1, S20-AD2, S20-AD3, S20-AD4
FC-TN-S8-103-177615S24-AD1, S24-AD2, S24-AD5, S24-AD6, S24-AD7
Canvas tankTX-S125251S47-AD2
TX-S214140-
Cement tankCT-AMK-S125256S39-AD1, S39-AD2, S39-AD3, S39-AD4, S39-AD6, S39-AD22
CT-AMK-S225230-
CT-AMK-S325190-
CT-DT-S125259S49-AD5, S49-AD6, S49-AD7, S49-AD8, S49-AD10, S49-AD17, S49-AD18, S49-AD19, S49-AD20
CT-DT-S225250-
CT-KK-S225193S53-AD1, S53-AD2, S53-AD3
CT-KK-P125210-
CT-KK-B225250-
CT-KK-A325251S56-AD6
CT-KK-B821210-
Total 107693545
Note: EP, earthen pond; FC, floating cages; TX, canvas tank; CT, cement tank.
Disclaimer/Publisher’s Note: The statements, opinions and data contained in all publications are solely those of the individual author(s) and contributor(s) and not of MDPI and/or the editor(s). MDPI and/or the editor(s) disclaim responsibility for any injury to people or property resulting from any ideas, methods, instructions or products referred to in the content.

