Article

Integrative Metabolomic and Transcriptomic Analyses Reveal the Impact of Methionine Supplementation to Gibel Carp (Carassius auratus gibelio)

College of Life Science, Huzhou University, 759 Erhuan Road (E), Huzhou 313000, China
*
Author to whom correspondence should be addressed.
Fishes 2025, 10(5), 203; https://doi.org/10.3390/fishes10050203
Submission received: 26 February 2025 / Revised: 14 April 2025 / Accepted: 15 April 2025 / Published: 1 May 2025
(This article belongs to the Section Nutrition and Feeding)

Abstract

The experiment was conducted to evaluate the molecular mechanism of methionine supplementation on the growth of gibel carp. In the study, the following five groups were included: the control group (FM) was fed with a high-plant protein diet as basal diet, and four treatment groups were supplemented with 0.25% crystalline methionine (CM50), 0.50% crystalline methionine (CM100), 0.25% coated methionine (HM50) or 0.50% coated methionine (HM100), respectively. Each group consisted of four replicates of 25 fish each. The weight gain rate and specific growth rate of gibel carp in the HM100 group were significantly higher than the FM group. The hepatopancreas transcriptomic (n = 4) and metabolomic (n = 6) analysis for the FM group and HM100 group showed that the significantly differential metabolites mainly related to amino acid metabolism, protein digestion and absorption, and aminoacyl-tRNA biosynthesis. Additionally, some genes that were significantly different in these two groups were involved in energy metabolism and transmembrane transporter activity. Therefore, the improvement of fish growth by 0.50% coated methionine supplementation might be achieved through altering amino acid and energy-related metabolism in hepatopancreas, which provides new insights for understanding the impact of methionine on the growth of fish.
Key Contribution: In this research, the molecular mechanism of methionine supplementation on the growth performance of gibel carp was evaluated. The results showed that the improvement of fish growth by 0.50% coated methionine supplementation might be achieved through altering amino acid and energy-related metabolism in the hepatopancreas, which provides new insights for understanding the impact of methionine on the growth of gibel carp.

1. Introduction

Historically, fishmeal is the preferred protein source for aquatic animals [1] due to its high levels of digestible crude protein and the balanced essential amino acids [2]. In recent years, the use of plant-based protein has increased dramatically due to the decline in fishmeal availability and increase in its price. Notably, plant-based products typically have a low content of certain essential amino acids [3]. More specifically, methionine is the first limiting amino acid in plant sources [4].
Methionine is an important precursor for many metabolites and methylation reactions [5], which are necessary for protein synthesis, immunity regulation, and energy metabolism [6]. As reported in previous studies, methionine deficiency has been found to reduce growth and protein accretion in juvenile Atlantic salmon (Salmo salar) [7], impact the mitochondrial integrity and oxidative status in the liver of rainbow trout (Oncorhynchus mykiss) [8], decrease digestive and absorptive function, and exert an antioxidant capacity in the hepatopancreas and intestine of sub-adult grass carp (Ctenopharyngodon idella) [9]. Thus, methionine supplemented in the diet has been the most popular approach to formulating a balanced feed for different fish species, such as Nile tilapia (Oreochromis niloticus) [10], gilthead seabream (Sparus aurata) [11], gibel carp (Carassius auratus gibelio) [12], rainbow trout [13], European seabass (Dicentrarchus labrax) [14], and largemouth bass (Micropterus salmoides) [15]. Based on previous studies, crystalline methionine has been commonly used as a feed additive to enhance the growth, feed utilization, and health of fishes [10,11,13,14,15]; however, some researchers suggested that the crystalline amino acids have not yet been used to synthesize protein and were excreted [12,16,17,18]. In comparison with the high leaching loss of crystalline amino acids, coated amino acids could gradually release them in the intestine and improve the absorption and utilization efficiency of amino acids in aquatic animals [12,16,17,18].
To the best of our knowledge, the exact regulatory mechanisms underlying the effect of coated methionine on the growth of fish are still unclear. The hepatopancreas serves an important role in the digestion, assimilation, and storage of nutrients for the growth and energy consumption of organisms [19], in which the metabolic activity is associated with the growth of fish, and alterations in the expression profiles of key genes can impact the growth performance of fish [20]. Hence, the current study leverages hepatopancreas transcriptomic and metabolomic analyses to evaluate the molecular mechanism of methionine supplementation on the growth of gibel carp.

2. Materials and Methods

2.1. Diets Formulation and Preparation

Fishmeal, soybean meal, and rapeseed meal were used as the main protein sources in the basal diets. The optimal methionine level was determined to be 0.71% of the diet, combined with the calculation of the methionine amount deriving from the basal diet, an extra 0.50% methionine supplementation was thought enough to support the optimal growth of gibel carp [12]. Here, five isonitrogenous and isolipidic high-plant protein diets were formulated (Table 1), including that for the control group (FM), and four experimental diets supplemented with methionine as follows: 0.25% crystalline methionine (CM50), 0.50% crystalline methionine (CM100), 0.25% coated methionine (HM50), and 0.50% coated methionine (HM100), respectively. The supplementation of 0.50% coated methionine in diet involved fully mixed raw materials that were grounded to pass through a 60-mesh sieve, followed by further mixing in a rotary drum mixer. All the ingredients were thoroughly mixed with fat-soluble feed materials such as fish oil, and water was added to produce the dough. The dough was extruded into strips and dried at 38 °C, followed by being crushed into granules and stored at −20 °C until use.

2.2. Rearing Conditions

The experiment was carried out in a recirculating aquaculture system. Five hundred gibel carps with an average weight of 9.21 ± 0.04 g were selected and randomly divided into 5 groups, with 4 replicates in each group and 25 fish in each replicate. The trial lasted for 56 days, with fish fed twice daily (08:30 and 18:30) at 2.5% of body weight and adjusted biweekly. During the experimental period, the water temperature ranged from 25 °C to 30 °C. Dissolved oxygen and pH were maintained at 6.0 ± 0.5 mg/L and 7.0 ± 0.1, respectively. The fish were reared under natural light.

2.3. Sample Collection

The gibel carp were weighed at the beginning (initial body weight) and end (final body weight) of the feeding trial. The survival rate (SR), weight gain (WG), specific growth rate (SGR), feed conversion ratio (FCR), and condition factor (CF) of each group were recorded and analyzed. These parameters were calculated as follows:
SR (%) = 100 × number of final fish/ number of initial fish;
WG (%) = 100 × (Wf − Wi)/Wi;
SGR (%/d) = 100 × (lnWf − lnWi)/days;
FCR = feed intake (g)/(Wf − Wi);
CF (g/cm3) = 100 × (Wf/Lf3).
where Wf and Wi are the initial and final body weights, and Lf is the final body length.
Moreover, 9 gibel carp per group were collected randomly and frozen (−20 °C) for whole-body composition analysis. Three gibel carp per tank, twelve fish in total per group were chosen and utilized for the intestinal digestive enzyme assay and hepatopancreas samples, stored at −80 °C for further hepatopancreas metabolomic and transcriptomic analysis.

2.4. Proximate Composition of Whole Fish and Diets

The diets and body composition determination followed the standard methods [21]. The crude protein was determined by the Kjeldahl method. The crude lipid was analyzed by the Soxhlet extraction method. To evaluate the moisture content, the samples were dried in an oven at 105 °C for 24 h. The ash content was determined by incinerating the samples in a muffle furnace at 550 °C for 4 h.

2.5. Biochemical Assays

Saline was mixed with intestinal tract in a 1:9 (w:v) ratio and homogenized. The homogeneity was then centrifuged at 4 °C at 4000 r/min for 10 min, and the supernatant was collected for the enzymatic activities of lipase, protease, and amylase, determined by assay kits that were sourced from Nanjing Jiancheng Bioengineering Institute (Nanjing, China).

2.6. Metabolomics and Transcriptomics in the Hepatopancreas

Based on the calculation of the growth data, the HM100 group showed the potential to improve the growth of gibel carp as compared with the FM group; therefore, 6 hepatopancreas samples from the FM group and HM100 group, respectively, were subjected to metabolomic analysis, which was followed by selecting 4 samples out of these 6 hepatopancreas samples per group for transcriptomic analysis.
Metabolites were extracted according to the protocol described by Zhongke New Life Biotechnology Co., Ltd. (Shanghai, China). Briefly, the samples were thawed at 4 °C and 100 μL of each sample was mixed with 400 μL of cold methanol/acetonitrile solution (1:1, v/v) containing isotope internal standards, adequately vortex, then ultrasounded for 5 min at low temperature, followed by incubation at −20 °C for 1 h. The mixture was centrifuged at 4 °C at 14000 rcf for 20 min. The supernatant was dried in a vaccum centrifuge, the samples were re-dissolved in 150 μL acetonitrile/water (1:1, v/v) and adequately vortexed, and then centrifuged at 4 °C at 14000 rcf for 15min. The supernatants were collected for LC/MS/MS analysis.
For transcriptome analysis, total RNA extraction was conducted on hepatopancreas samples using a Trizol reagent kit (Invitrogen, USA) according to the manufacturer’s protocol, followed by the assessment of RNA quality by a NanoDrop ND-2000 spectroscope (Thermo Fisher Scientific). Furthermore, a cDNA library was constructed prior to sequencing on an Illumina NovaSeq 6000 platform. All RNA-Seq data were submitted to the NCBI SRA database (BioProject number: PRJNA903220). The transcriptome data were analyzed, including the assembly and annotation. Functions were annotated with the assembled unigenes by comparing similarity levels using the BLAST algorithm against the following databases: COG/KOG, SwissProt, and Nr (e-value < 0.00001). The GO and KEGG enrichment analysis of differential genes could explain the functional enrichment of differential genes and clarify the differences between samples at the gene function level. We used cluster Profiler R software package (e.g. DEGeq2 R package, version 1.34.0; Blast2GO, version 2.5.0; Kobas, version 3.0.3) for GO function enrichment and KEGG pathway enrichment analysis. When a p value < 0.05, it was considered that the GO or KEGG function was significantly enriched.

2.7. Statistical Analysis

Experimental data were analyzed using one-way ANOVA with SPSS 25.0 software. Significant differences (p < 0.05) were further tested using Tukey’s post hoc test. Two-way ANOVA was employed to examine the effects of the form of methionine supplementation, methionine level, and their interactions. All results were expressed as the mean ± standard deviation. A p value < 0.05 was considered significantly different.

3. Results

3.1. Growth Performance

As shown in Table 2, methionine level and form were found to affect WG, SGR, and FCR (p < 0.10). Compared to the HM100 group, the FM, CM50, CM100, and HM50 groups showed a significant decrease in the WG and SGR of fish (p < 0.05), while the FM, CM50, CM100, and HM50 also showed a significant increase in FCR (p < 0.05). No statistical interactions between methionine form and level were recorded for these parameters (p > 0.05). In addition, no significant differences were observed for methionine level, form, and interactions on SR and CF (p > 0.05).

3.2. Whole Body Composition and Intestinal Digestive Enzyme Activities

The whole-body proximate composition for the fish fed crystalline and coated methionine was presented in Table 3. No significant differences were observed for moisture, crude protein, and ash content among these groups (p > 0.05). However, crude lipid content in the CM50 and HM100 groups was significantly lower as compared to the FM, CM100, and HM50 groups (p < 0.05).
As shown in Table 4, lipase and amylase activities were significantly higher in the HM100 group as compared to the HM50, CM50, CM100, and FM groups (p < 0.05), while no significant differences were observed among the HM50, CM50, and CM100 treatments and the FM group (p > 0.05). Furthermore, the results revealed the significant effects (p < 0.05) of methionine form, level, and form × level interaction for the measurements of lipase and amylase activities. In addition, protease activity was significantly increased in the CM100, HM50, and HM100 groups when compared to the FM group (p < 0.05). Although methionine form significantly (p < 0.05) affected and methionine level tended to (p = 0.094) affect the protease activity, there was no form × level interaction (p > 0.05) effect on protease activity.

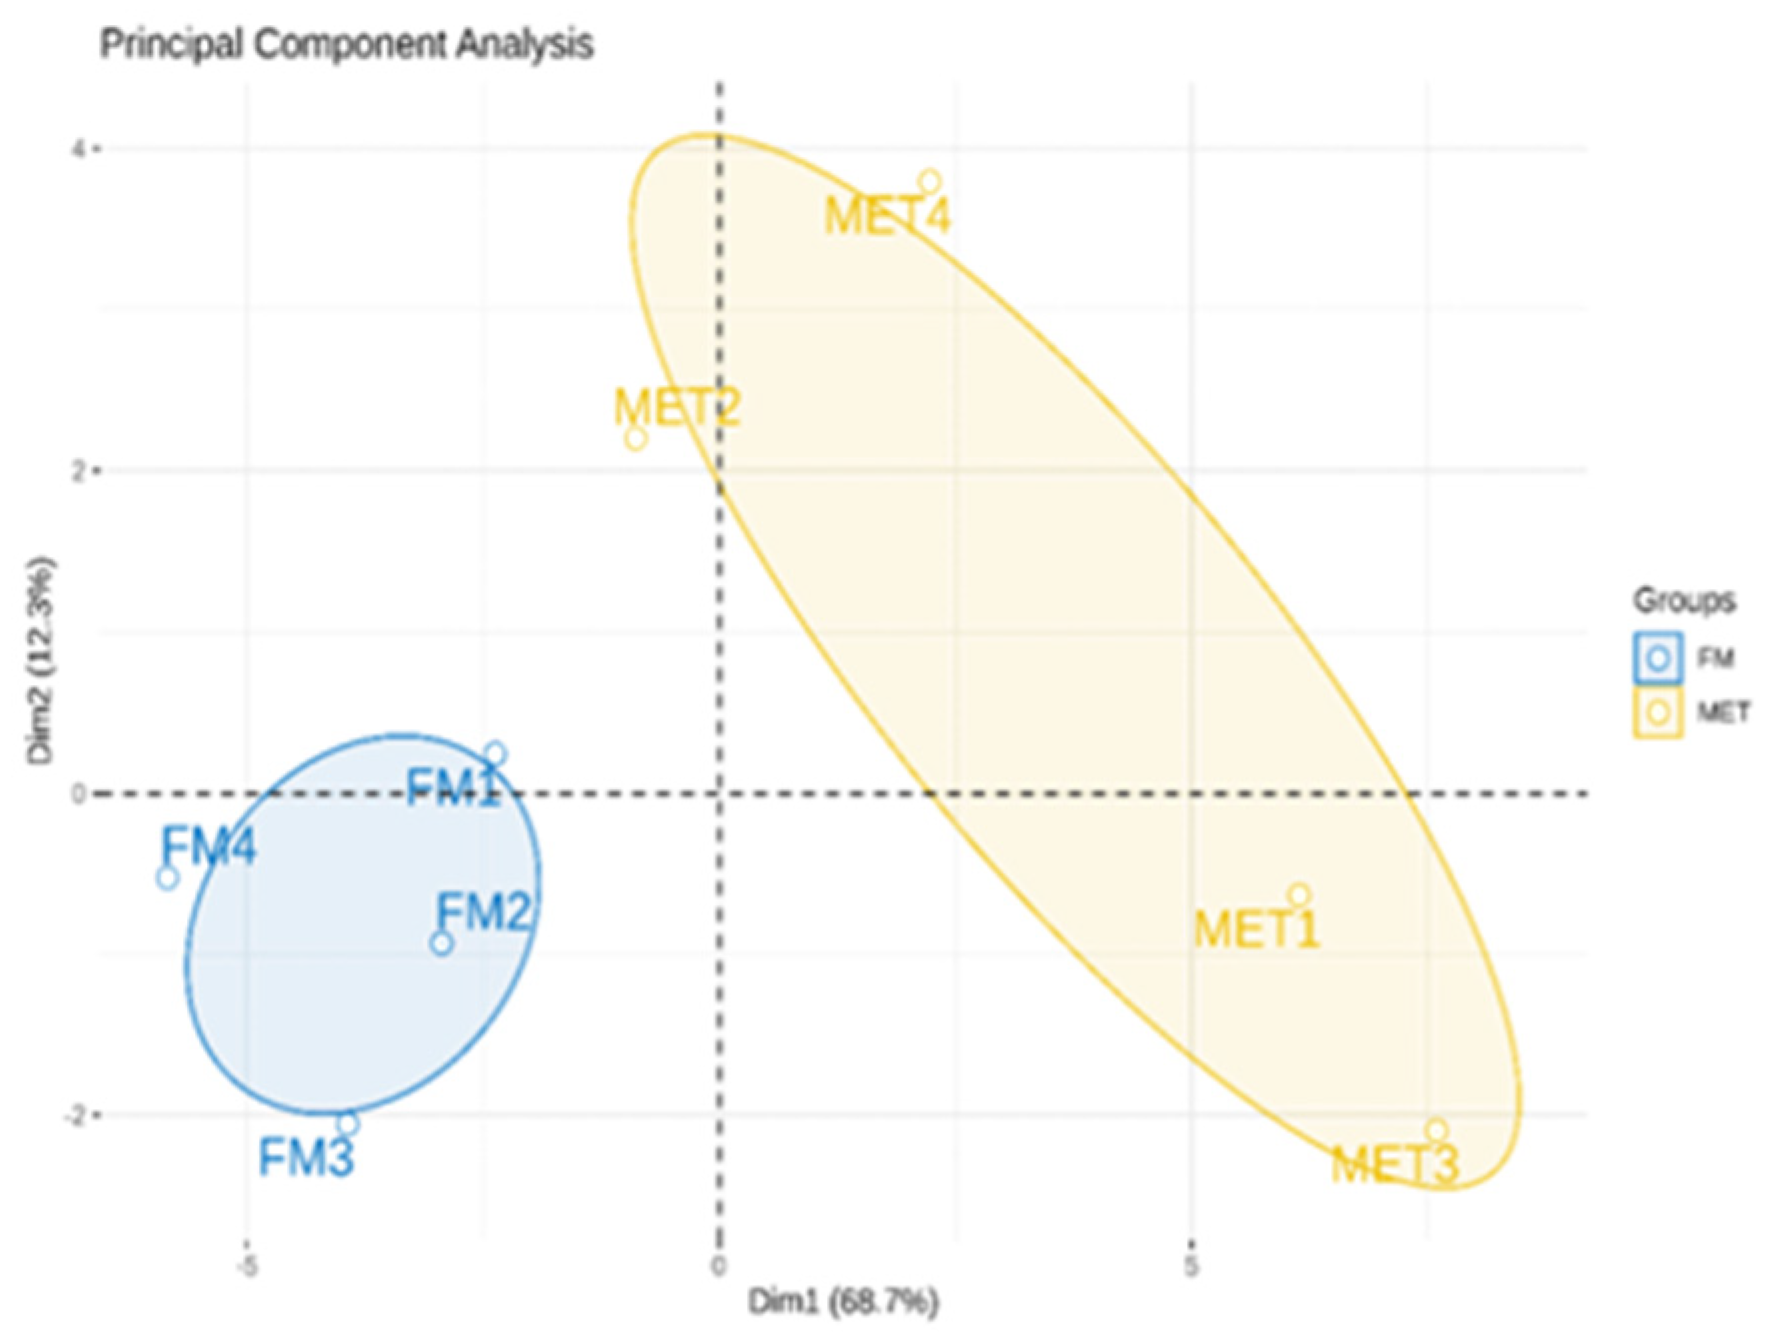
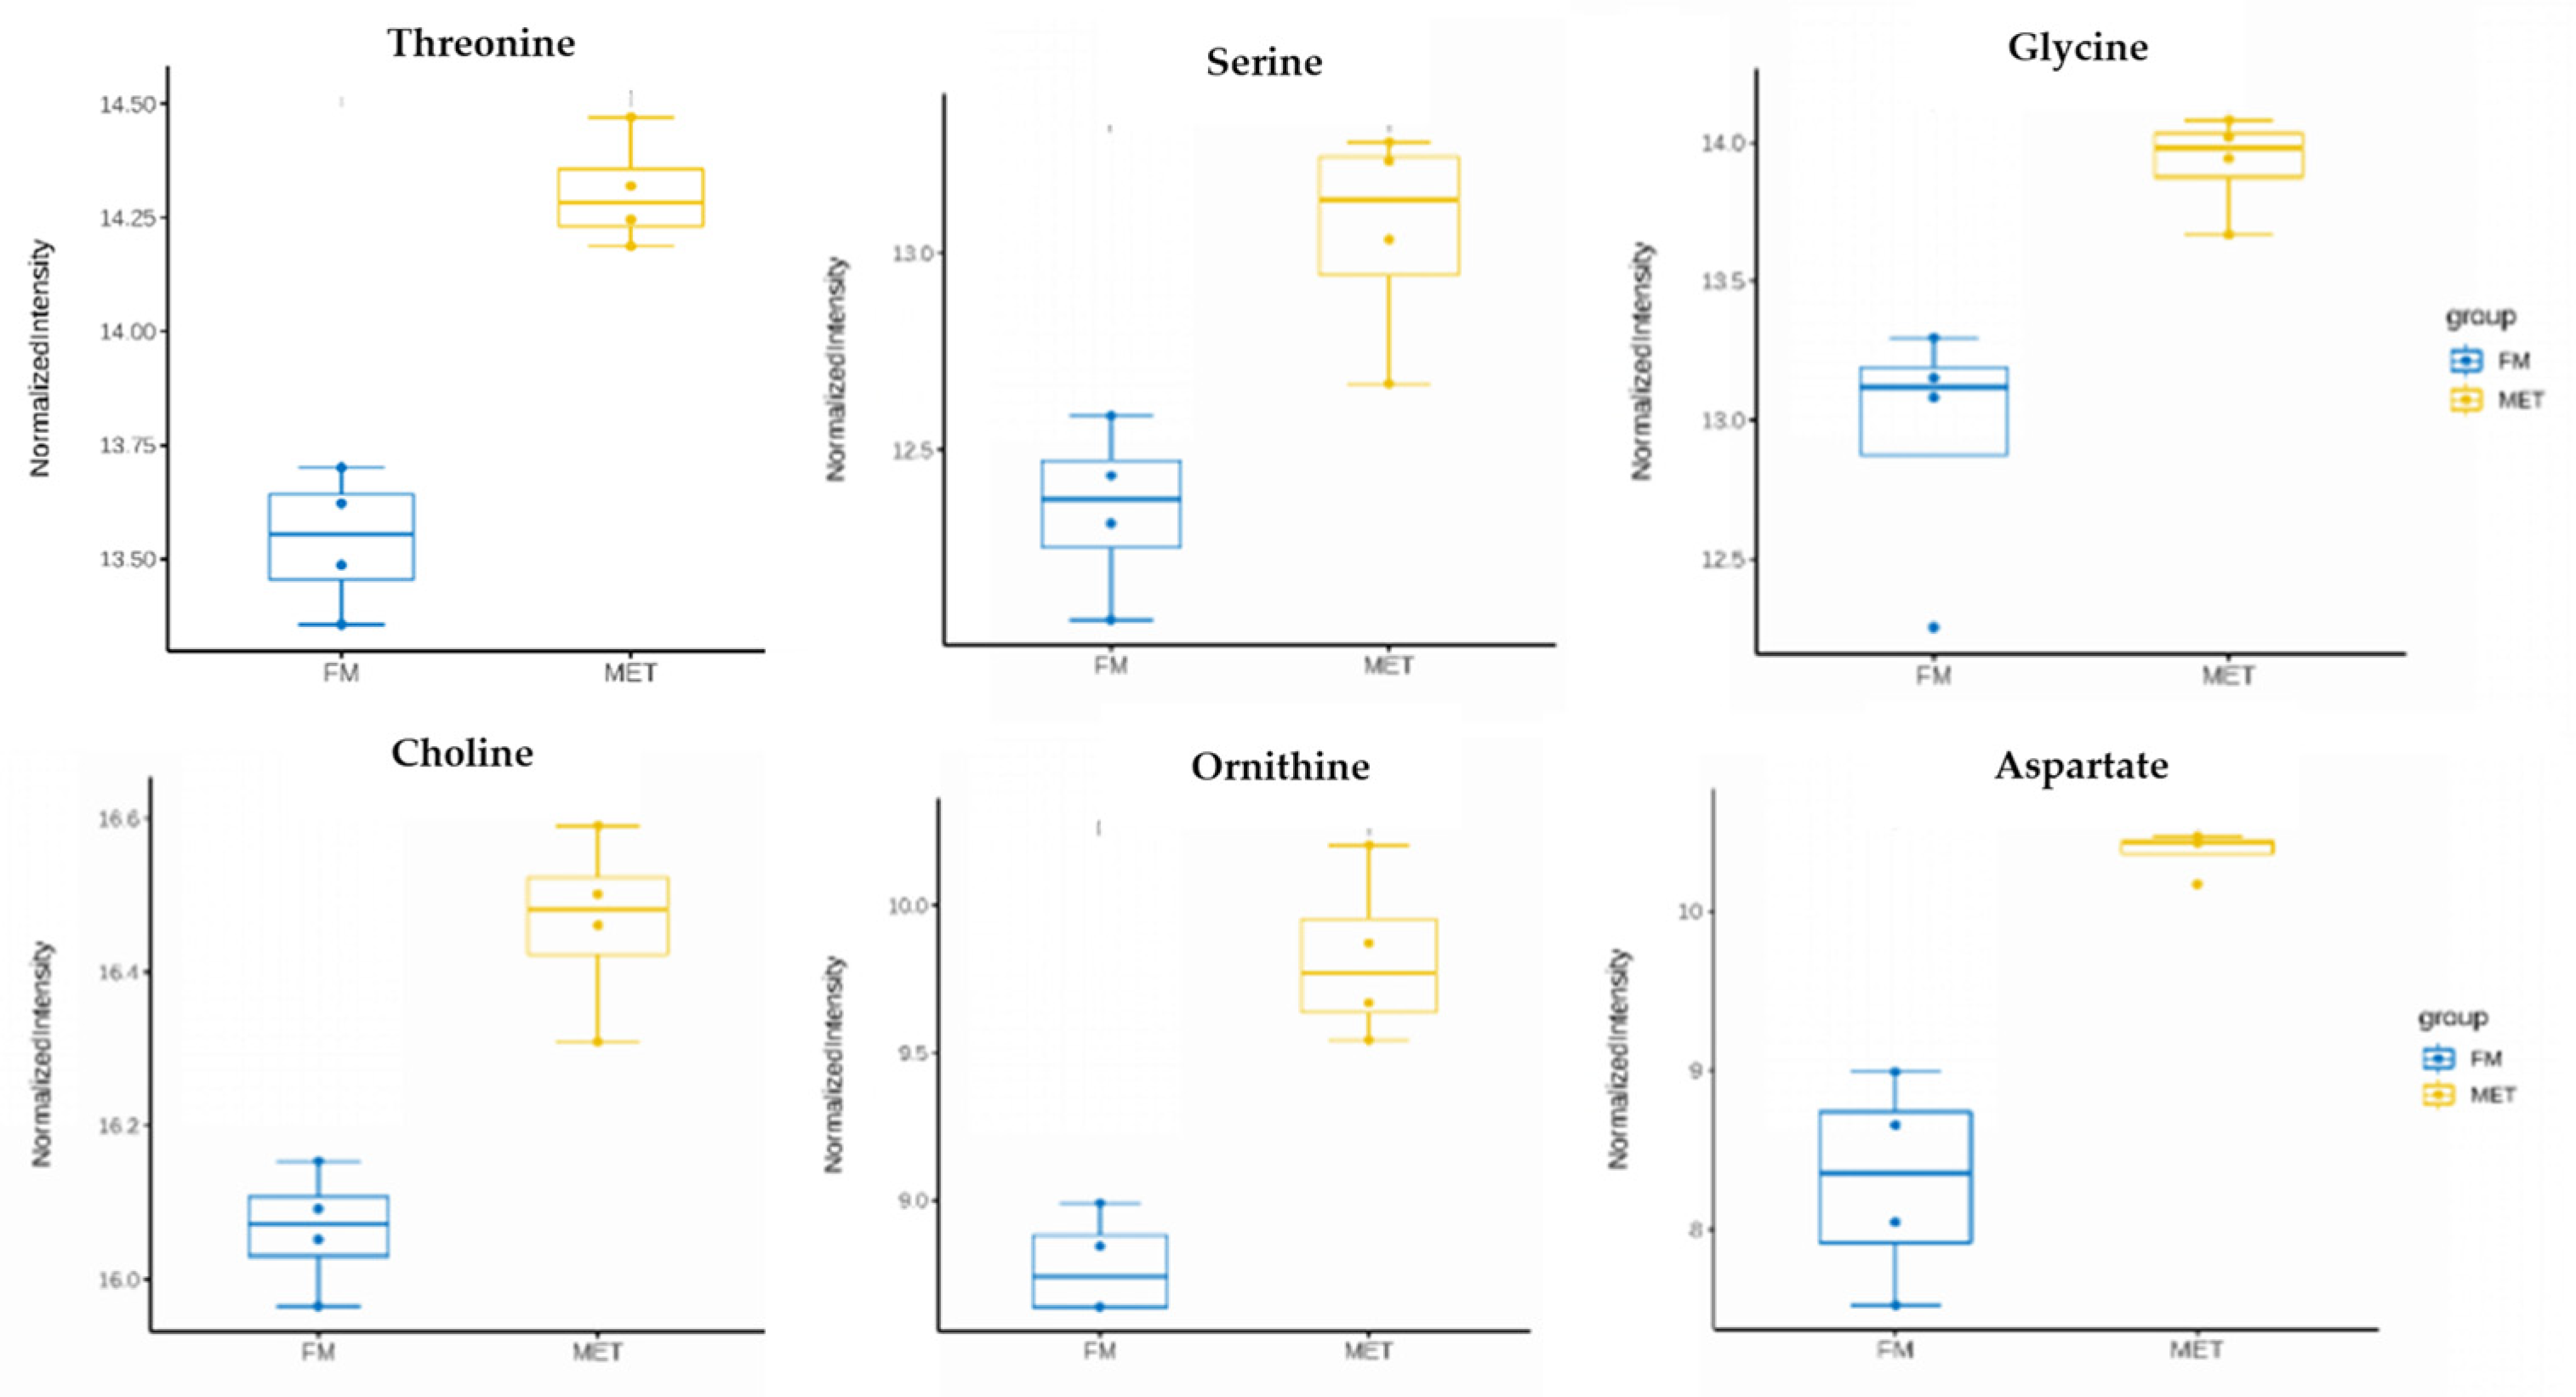
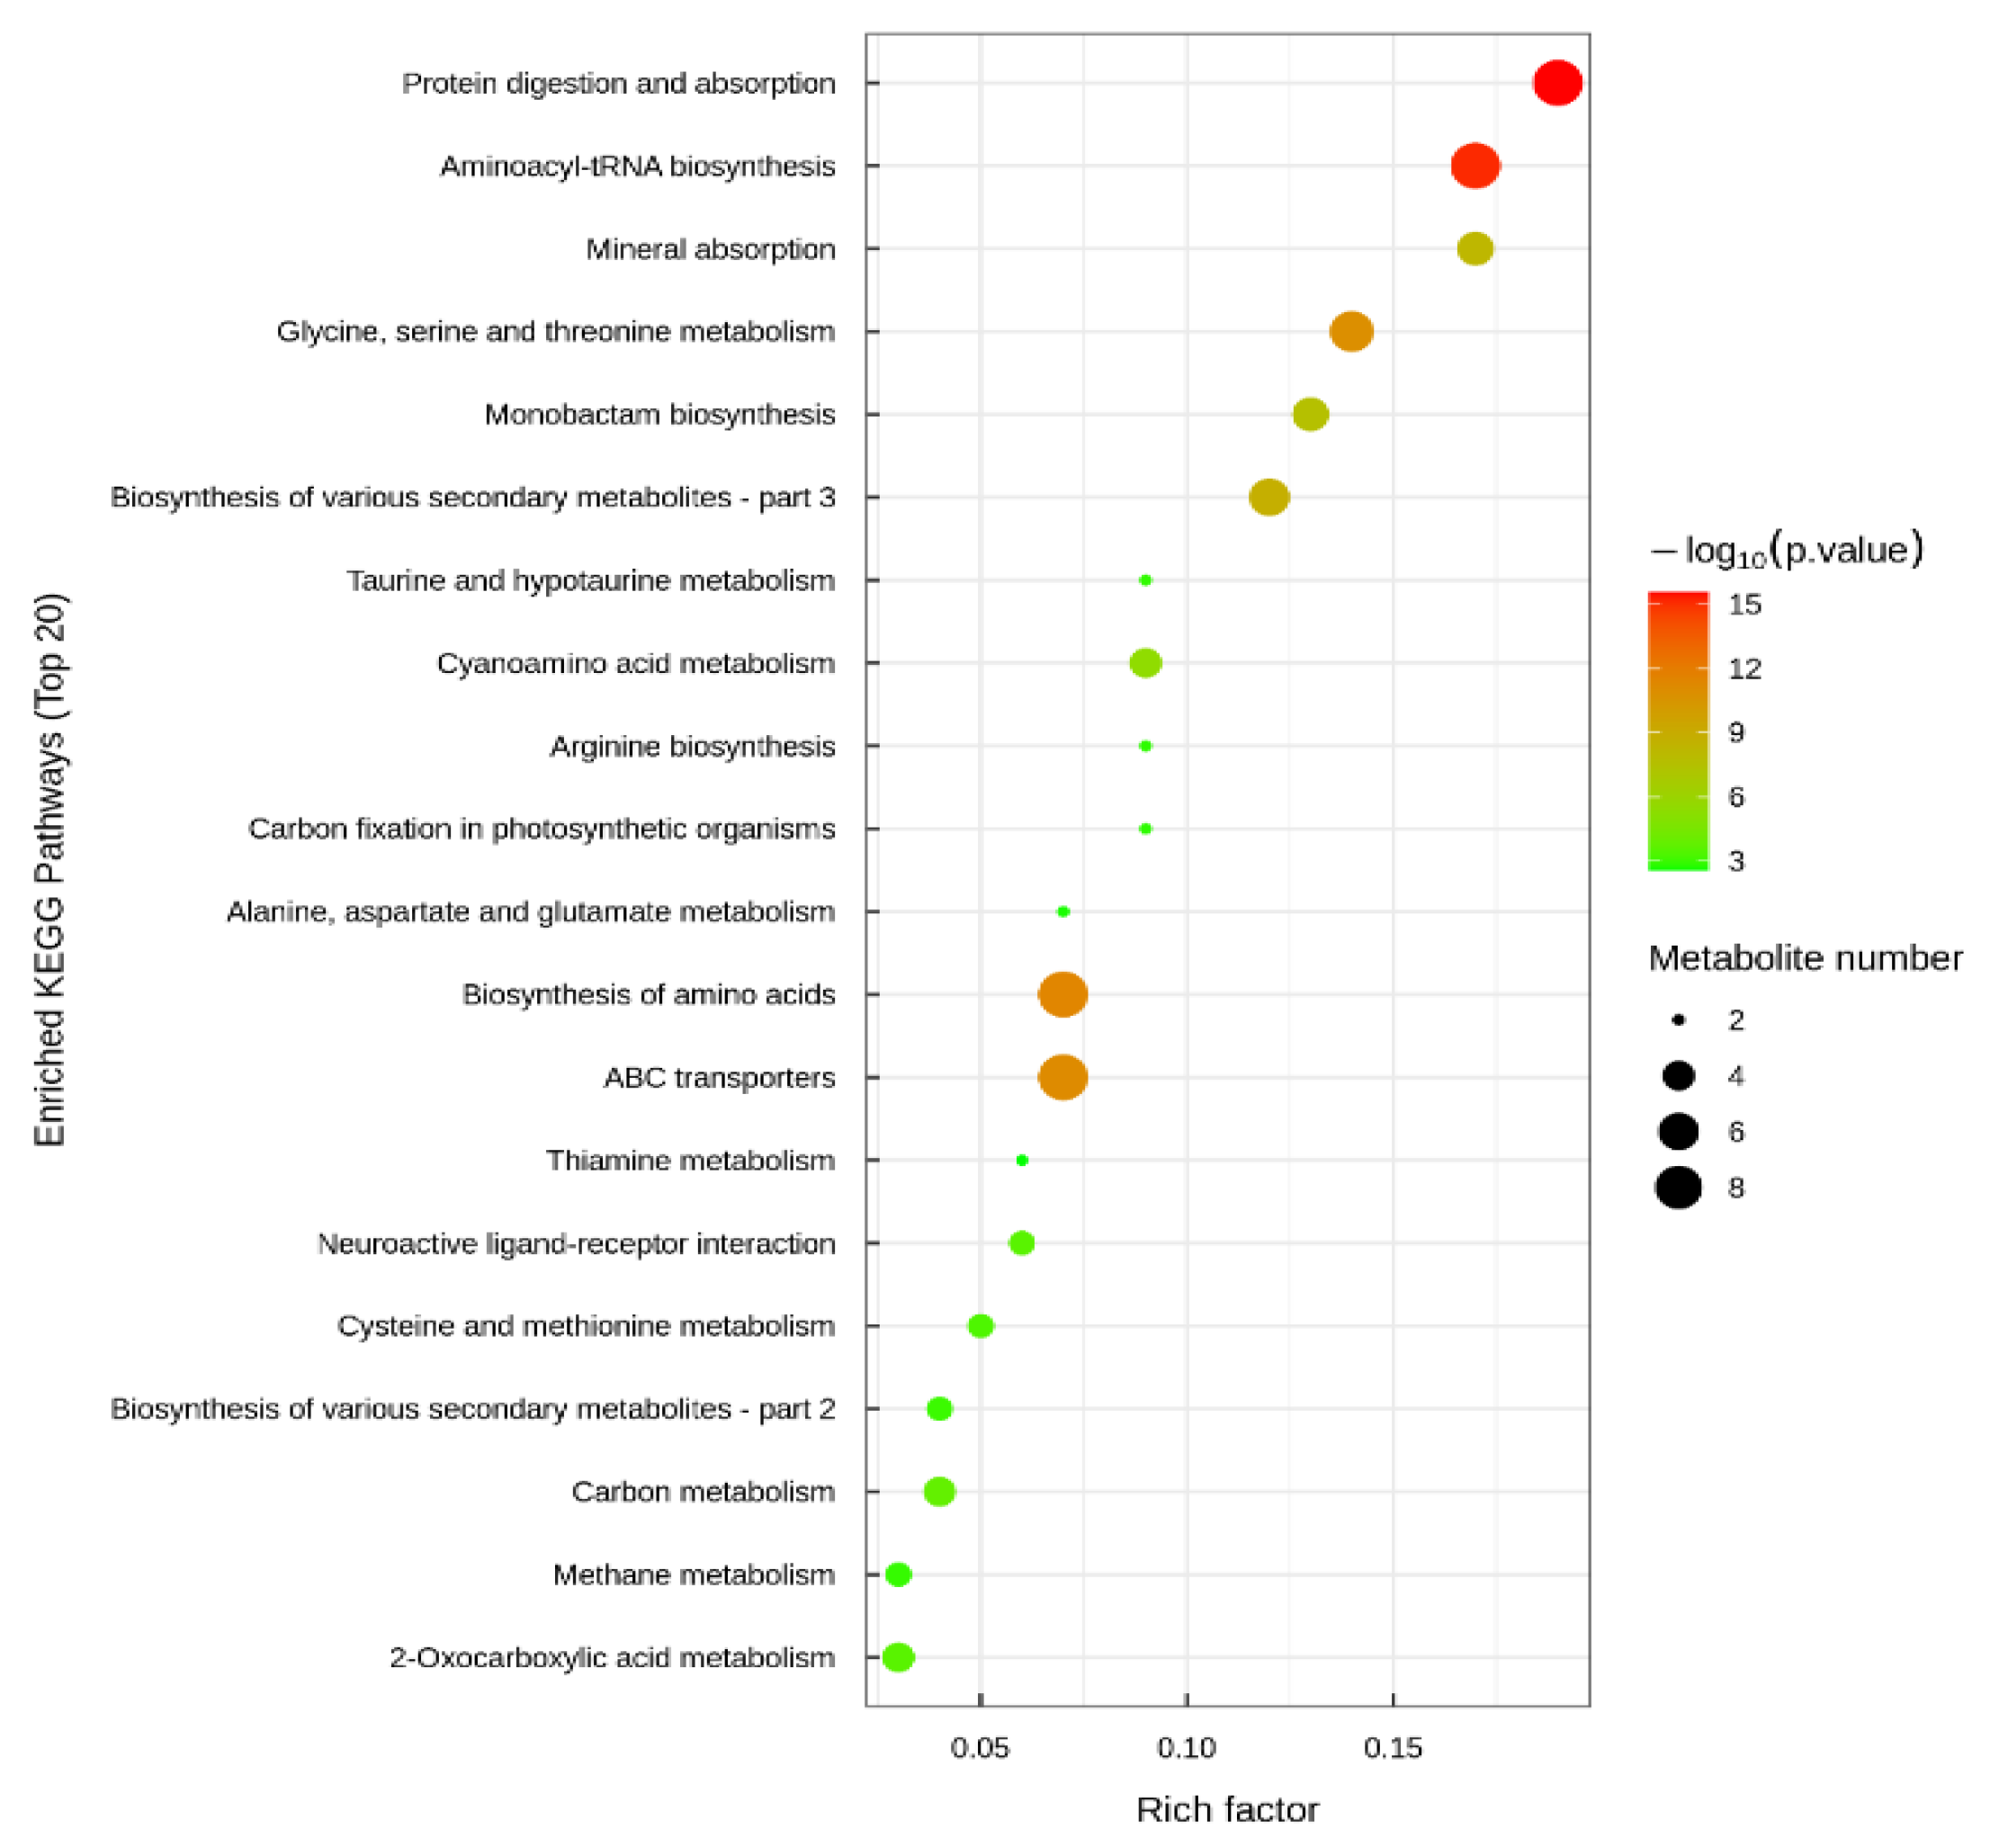
3.3. Metabolomics in the Hepatopancreas

As compared with the FM group, the HM100 group had a significantly higher WG and SGR and lower FCR (p < 0.05); however, other treatments showed no significant difference with the FM group (p > 0.05) in terms of these growth indexes. Hence, hepatopancreas samples from the HM100 group and FM group were subjected to metabolomic and transcriptomic analysis to explore the exact mechanism of dietary methionine. As shown in Figure 1, principal component analysis (PCA) revealed that apparent separation was observed for the HM100 group and FM group. The percentages of the explained value in the metabolomics analysis of PC1 and PC2 were 68.7% and 12.3%, respectively (Figure 1).
Further analysis revealed that the levels of threonine, choline, ornithine, serine, spermidine, tyrosine, aspartate, tryptophan, arginine, glycine, histidine, isoleucine, lysine, methionine, phenylalanine, taurine, and valine in the HM100 group were significantly higher than the FM group (p < 0.05) (Figure 2, Supplementary Figure S1).
Functional analysis was performed to explore the potential metabolic pathways affected by the different methionine forms and levels. As shown in Figure 3, the metabolites that were significantly different were mainly related to protein digestion and absorption; aminoacyl-tRNA biosynthesis; glycine, serine, and threonine metabolism; taurine and hypotaurine metabolism; the biosynthesis of amino acids; ABC transporters; and alanine, aspartate, and glutamate metabolism.

3.4. Transcriptomics in the Hepatopancreas

The results of hepatopancreatic transcriptomics indicated that the majority of samples in the FM group clustered together, showing a distinct transcriptome profile compared to the HM100 group (Figure 4). A total of 3151 genes exhibited different expression profiles between the FM group and HM100 group, where 1103 genes showed higher expressions, whereas 2048 genes showed lower expressions in the FM group, as compared with the HM100 group (Figure 5).
Upon GO functional enrichment, differentially expressed genes were assigned to three main categories, including the biological process (BP), molecular function (MF), and cellular component (CC), respectively (Figure 6). As illustrated by the top 30 GO enrichment pathways in Figure 6, 4 GO terms were enriched in the category of biological process, including the “dicarboxylic acid metabolic process”, “malate metabolic process”, “monocarboxylic acid metabolic process” and “pyruvate metabolic process”. In the category of molecular function, 16 GO terms, such as “malic enzyme activity” and “S-adenosyl-L-methionine transmembrane transporter activity”, were significantly enriched. In addition, 10 GO terms, like “mitochondrion”, “cytoplasm”, and “intracellular organelle” were enriched in the cellular component category.
KEGG pathway enrichment analysis was performed to identify the sets of differentially expressed genes involved in specific biological functions (as shown in Figure 7). As compared with the HM100 treatment, the significantly up-regulated pathways in the FM group included starch and sucrose metabolism, carbon fixation in photosynthetic organisms, amino sugar and nucleotide and sugar metabolism, steroid biosynthesis, histidine metabolism, and streptomycin biosynthesis (Figure 7). Meanwhile, the significantly down-regulated pathways included ferroptosis, homologous recombination, fanconi anemia, and mitophagy-yeast (Figure 7).

4. Discussion

The increasing global shortage and high price of fish meal have prompted the application of plant protein sources in the aquaculture industry, as mixed plant protein sources are often deficient in methionine, an essential sulfur amino acid [22]. In such cases, a nutritional strategy was to add methionine in high plant protein feedstuffs. Several previous studies have reported the effect of crystalline methionine supplementation on the growth of aquatic animals, for example, the addition of 0.50% methionine on largemouth bass [15], 0.30% methionine on juvenile Chinese sucker (Myxocyprinus asiaticus) [23], 0.12–0.60% methionine on hybrid tilapia (Oreochromis mossambicus × Oreochromis niloticus) [24], 0.08–0.60% methionine on juvenile golden pompano (Trachinotus ovatus) [25], 0.30% methionine on Japanese seabass (Lateolabrax japonicus) [26], and the addition of 0.58–0.82% methionine on juvenile Litopenaeus vannamei [27] have shown improved growth performance. Accordingly, the recommended dietary methionine levels ranged depending on species, dietary protein level, and growth stage.
In the present study, no interactions were observed between methionine form and level with respect to the WG and SGR parameters, and different methionine levels should be considered as an independent factor influencing the growth performance of fish. More specifically, the supplementation of 0.50% coated methionine was found to increase the WG and SGR of gibel carp, while the supplementation of 0.25% coated methionine failed to significantly increase the WG and SGR of fish, as compared to the FM group, suggesting that the optimal dietary methionine was required to promote the growth of fish. Similarly to our findings, the study by Guo et al. [16] indicated the shrimp fed with 0.15% or 0.20% coated methionine significantly increased WG, while the 0.10% coated methionine group had a similar WG with the control group. Likewise, Ren et al. [28] reported that 0.64–0.70% DL-methionine supplementation in low fish meal diets was observed for higher SGR and FCR in juvenile gibel carp as compared to 0.54–0.62% DL-methionine supplementation. Moreover, Du et al. [12] pointed out that with the increase in coated methionine level, the WG and SGR of gibel carp initially increased and was then suppressed, peaking at the 0.76% methionine level. Thus, the optimal level of methionine supplementation should be recommended to maximize the growth potential of fish, and the present study has demonstrated that 0.50% coated methionine supplementation in a high plant protein diet was more effective in improving the growth of gibel carp compared to 0.25% coated methionine.
A total of 0.50% crystalline methionine was also supplied along with the high plant protein diet; however, this did not have a significantly positive effect on the growth of gibel carp, indicating that crystalline methionine was less efficient in supporting the growth of fish when compared with same level of coated methionine, which was consistent with some previous studies on pacific white shrimp [16,29], gibel carp [12], and Chinese sucker [18]. As dietary purified amino acids are absorbed and catabolized before protein-bound amino acids are released by digestion, this leads to a high leaching loss in water [18], which might explain the low efficiency of crystalline methionine in our study. Intestinal enzymes, including amylases, lipases, and protease, could improve digestion and promote the absorption process [30], which was very important for the growth of fish; therefore, the increased digestive enzyme activities in the 0.50% coated methionine group might explain the high growth rate of fish. In addition, interactions between methionine level and form were observed for the activities of amylases and lipases, reflecting the great differences between 0.50% and 0.25% coated methionine group when compared to the crystalline methionine group. By contrast, no interaction effect was observed for the activity of protease; the methionine form had an independent effect on the activity of protease, irrespective of methionine level, implying that the digestive protease was insensitive to the small differences in methionine level.
Nearly half of the methionine metabolism and up to 85% of all methylation reactions took place in the liver [31]; therefore, the supplementation of dietary methionine was associated with increased levels of methionine in the hepatopancreas. In addition, the supplementation of dietary methionine significantly elevated several amino acids (threonine, ornithine, arginine, glycine, histidine, isoleucine, lysine, etc.) in the hepatopancreas, which was similar with the study of Zhou et al. [32]. The authors found that dietary crystalline methionine could increase the concentrations of histidine, arginine, isoleucine, lysine, phenylalanine, taurine, and valine in the serum of common carp [32]. Likewise, the study by Gao et al. [33] reported that different levels of methionine could alter the amino acid profile in the plasma of trout. Therefore, changes in the dietary supplementation of a single essential amino acids may have an effect on the entire amino acid profile in the blood and other organs. Considering that amino acids are important molecules in fish nutrition with critical roles in supporting growth and health, the changed amino acid profile in the hepatopancreas with the supplementation of methionine possibly led to the improved growth performance demonstrated in this study. However, it was beyond the scope of our metabolomic analysis to explain the mechanism of selectively altering specific amino acids in the hepatopancreas.
Subsequently, several pathways related to amino acid metabolism were enriched in the hepatopancreas of gibel carp, such as glycine, serine, and threonine metabolism; taurine and hypotaurine metabolism; and alanine, aspartate, and glutamate metabolism. It was observed that protein digestion and absorption ranked first in the KEGG analysis, which was in accordance with the enriched metabolism of amino acids. Protein is the material basis of life, and enhanced protein digestion and absorption in the 0.50% coated methionine supplementation group implies more nutrients were available for the growth of fish. In addition, aminoacyl-tRNA synthases ranked second in the KEGG enriched pathways. These were a family of enzymes that catalyze the covalent binding of amino acids to homologous tRNA during translation [34], and their enrichment also reflected the accelerated amino acid metabolism in the hepatopancreas of gibel carp after supplementation with methionine.
Furthermore, supplementation with 0.50% coated methionine could influence the expressions of 3151 genes in the hepatopancreas of gibel carp. Some differentially expressed genes were enriched in S-adenosyl-L-methionine transmembrane transporter activity, transmembrane transport protein activity, and primary active transmembrane transporter activity, implying that methionine might play a vital role in regulating the passage of substrates across cell membranes. These findings aligned with the enrichment of ABC transporter pathways in our metabolomics analysis. ABC transporters, as a large family of membrane proteins, facilitate the transport of diverse molecules, including amino acids and peptides, which are essential for protein synthesis [35]. Additionally, some significantly differential genes were related to pyruvate metabolism, malate metabolism, the dicarboxylic acid metabolic process, and monocarboxylic acid metabolic process. These pathways were associated with the energy metabolism, the enrichment of these pathways in the control group suggested the energy-related metabolism was important to support the growth performance when methionine was deficient. To confirm the results obtained from the transcriptomic analysis, some candidate genes (fold differences exceeding 1.0 in gene expression and adjusted p value not exceeding 0.05) were chosen for quantitative real-time PCR validation. A future study could measure the gene expression of glucose-6-phosphate isomerase, malic enzyme, methylsterol monooxygenase 1, and urine nucleoside phosphorylase in the hepatopancreas of fish to validate the mechanism of methionine supplementation.

5. Conclusions

In summary, the present study showed that supplementation with 0.50% coated methionine markedly improved the growth performance of gibel carp, which might be achieved through altering amino acid and energy-related metabolism.

Supplementary Materials

The following supporting information can be downloaded at: https://www.mdpi.com/article/10.3390/fishes10050203/s1, Figure S1: The significantly differential amino acids and their derivatives in hepatopancreas samples between control group and HM100 group. FM, control group; MET, HM100 group.

Author Contributions

All authors contributed to the study. Y.L.: Writing—original draft, Visualization, and Formal analysis. R.Q.: Formal analysis, Investigation, Data curation, and Writing—review. Q.X.: Writing—review and editing, Funding acquisition, Supervision, and Conceptualization. J.Z.: Writing—review and editing, Supervision, and Conceptualization. All authors have read and agreed to the published version of the manuscript.

Funding

This research was funded by the “Pioneer” and “Leading Goose” Research and Development Program of Zhejiang (2023C02024).

Institutional Review Board Statement

This animal study was approved by The Animal Experimental Ethics Committee of Huzhou University (20180306). The study was conducted in accordance with the local legislation and institutional requirements.

Informed Consent Statement

Not applicable.

Data Availability Statement

Data are contained within the article and Supplementary Materials.

Acknowledgments

The authors would like to extend their gratitude to all the students and teachers who helped with this experiment.

Conflicts of Interest

The authors declare no conflicts of interest.

References

  1. Rolland, M.; Skov, P.V.; Larsen, B.K.; Holm, J.; Gómez-Requeni, P.; Dalsgaard, J. Increasing Levels of Dietary Crystalline Methionine Affect Plasma Methionine Profiles, Ammonia Excretion, and the Expression of Genes Related to the Hepatic Intermediary Metabolism in Rainbow Trout (Oncorhynchus mykiss). Comp. Biochem. Physiol. Part B Biochem. Mol. Biol. 2016, 198, 91–99. [Google Scholar] [CrossRef] [PubMed]
  2. Nunes, A.J.P.; Sá, M.V.C.; Browdy, C.L.; Vazquez-Anon, M. Practical Supplementation of Shrimp and Fish Feeds with Crystalline Amino Acids. Aquaculture 2014, 431, 20–27. [Google Scholar] [CrossRef]
  3. Rolland, M.; Feekings, J.P.; Dalsgaard, J.; Skov, P.V. Modelling the Effects of Dietary Methionine Level and Form on Postprandial Plasma Essential Amino Acid Profiles in Rainbow Trout (Oncorhynchus mykiss). Aquac. Nutr. 2016, 22, 1185–1201. [Google Scholar] [CrossRef]
  4. Agboola, J.O.; Overland, M.; Skrede, A.; Hansen, J.O. Yeast as major protein-rich ingredient in aquafeeds: A review of the implications for aquaculture production. Rev. Aquac. 2020, 13, 949–970. [Google Scholar] [CrossRef]
  5. Espe, M.; Adam, A.C.; Saito, T.; Skjærven, K.H. Methionine: An Indispensable Amino Acid in Cellular Metabolism and Health of Atlantic Salmon. Aquac. Nutr. 2023, 2023, 5706177. [Google Scholar] [CrossRef]
  6. Wang, L.; Gao, C.; Wang, B.; Wang, C.; Sagada, G.; Yan, Y. Methionine in Fish Health and Nutrition: Potential Mechanisms, Affecting Factors, and Future Perspectives. Aquaculture 2023, 568, 739310. [Google Scholar] [CrossRef]
  7. Espe, M.; Andersen, S.M.; Holen, E.; Rønnestad, I.; Veiseth-Kent, E.; Zerrahn, J.E.; Aksnes, A. Methionine Deficiency Does Not Increase Polyamine Turnover through Depletion of Hepatic S-Adenosylmethionine in Juvenile Atlantic Salmon. Br. J. Nutr. 2014, 112, 1274–1285. [Google Scholar] [CrossRef]
  8. Séité, S.; Mourier, A.; Camougrand, N.; Salin, B.; Figueiredo-Silva, A.C.; Fontagné-Dicharry, S.; Panserat, S.; Seiliez, I. Dietary Methionine Deficiency Affects Oxidative Status, Mitochondrial Integrity and Mitophagy in the Liver of Rainbow Trout (Oncorhynchus mykiss). Sci. Rep. 2018, 8, 10151. [Google Scholar] [CrossRef]
  9. Wu, P.; Tang, L.; Jiang, W.D.; Hu, K.; Liu, Y.; Jiang, J.; Kuang, S.Y.; Tang, L.; Tang, W.N.; Zhang, Y.A.; et al. The Relationship between Dietary Methionine and Growth, Digestion, Absorption, and Antioxidant Status in Intestinal and Hepatopancreatic Tissues of Sub-Adult Grass Carp (Ctenopharyngodon idella). J. Anim. Sci. Biotechnol. 2017, 8, 63. [Google Scholar] [CrossRef]
  10. Teodósio, R.; Engrola, S.; Cabano, M.; Colen, R.; Masagounder, K.; Aragão, C. Metabolic and Nutritional Responses of Nile Tilapia Juveniles to Dietary Methionine Sources. Br. J. Nutr. 2022, 127, 202–213. [Google Scholar] [CrossRef]
  11. Vieira, L.; Magalhaes, R.; Martins, N.; Fontinha, F.; Castro, C.; Peres, H.; Mercier, Y.; Mahmood, T.; Nuez-Ortín, W.G.; Oliva-Teles, A. Evaluation of Dietary Methionine Sources on Growth Performance and Antioxidant Potential of Gilthead Seabream Juveniles Reared at High Water Temperature. J. World Aquac. Soc. 2024, 55, 26–39. [Google Scholar] [CrossRef]
  12. Du, Y.Y.; Lin, X.W.; Shao, X.P.; Zhao, J.H.; Xu, H.; de Cruz, C.R.; Xu, Q.Y. Effects of Supplementing Coated Methionine in a High Plant-Protein Diet on Growth, Antioxidant Capacity, Digestive Enzymes Activity and Expression of TOR Signaling Pathway Associated Genes in Gibel Carp, Carassius auratus gibelio. Front. Immunol. 2024, 15, 1319698. [Google Scholar] [CrossRef] [PubMed]
  13. Machado, M.; Moura, J.; Peixoto, D.; Castro-Cunha, M.; Conceição, L.E.C.; Dias, J.; Costas, B. Dietary Methionine as a Strategy to Improve Innate Immunity in Rainbow Trout (Oncorhynchus mykiss) Juveniles. General. Comp. Endocrinol. 2021, 302, 113690. [Google Scholar] [CrossRef] [PubMed]
  14. Machado, M.; Engrola, S.; Colen, R.; Conceição, L.E.C.; Dias, J.; Costas, B. Dietary Methionine Supplementation Improves the European Seabass (Dicentrarchus labrax) Immune Status Following Long-Term Feeding on Fishmeal-Free Diets. Br. J. Nutr. 2020, 124, 890–902. [Google Scholar] [CrossRef] [PubMed]
  15. Li, X.; Zheng, S.; Cheng, K.; Ma, X.; Wu, G. Use of Alternative Protein Sources for Fishmeal Replacement in the Diet of Largemouth Bass (Micropterus salmoides). Part II: Effects of Supplementation with Methionine or Taurine on Growth, Feed Utilization, and Health. Amino Acids 2021, 53, 49–62. [Google Scholar] [CrossRef]
  16. Guo, J.P.; Zhou, W.Y.; Liu, S.S.; Zhang, W.B.; Mai, K.S. Efficacy of Crystalline Methionine and Microencapsulation Methionine in Diets for Pacific White Shrimp Litopenaeus vannamei. Aquac. Res. 2020, 51, 4206–4214. [Google Scholar] [CrossRef]
  17. Chi, S.Y.; Tan, B.P.; Dong, X.H.; Yang, Q.H.; Liu, H.Y. Effects of Supplemental Coated or Crystalline Methionine in Low-Fishmeal Diet on the Growth Performance and Body Composition of Juvenile Cobia Rachycentron Canadum (Linnaeus). Chin. J. Oceanol. Limnol. 2014, 32, 1297–1306. [Google Scholar] [CrossRef]
  18. Yuan, Y.; Gong, S.; Yang, H.; Lin, Y.; Yu, D.; Luo, Z. Effects of Supplementation of Crystalline or Coated Lysine and/or Methionine on Growth Performance and Feed Utilization of the Chinese Sucker, Myxocyprinus asiaticus. Aquaculture 2011, 316, 31–36. [Google Scholar] [CrossRef]
  19. Zhou, Q.C.; Shi, B.; Jiao, L.F.; Jin, M.; Sun, P.; Ding, L.Y.; Yuan, Y. Hepatopancreas and Ovarian Transcriptome Response to Different Dietary Soybean Lecithin Levels in Portunus trituberculatus. Comp. Biochem. Physiol. Part D Genom. Proteom. 2019, 31, 100600. [Google Scholar] [CrossRef]
  20. Liu, Q.; Zou, X.; Zhao, M.; Guan, Q.Q.; Xuan, Z.Y.; Liu, L.S.; Gao, Z.X. Integrated transcriptome and metabolome analysis of liver reveals unsynchronized growth mechanisms in blunt-snout bream (Megalobrama amblycephala). BMC Genom. 2025, 26, 30. [Google Scholar] [CrossRef]
  21. AOAC. The Official Methods of Analysis, 18th ed.; AOAC International: Maryland, MD, USA, 2010. [Google Scholar]
  22. Alami-Durante, H.; Bazin, D.; Cluzeaud, M.; Fontagné-Dicharry, S.; Kaushik, S.; Geurden, I. Effect of Dietary Methionine Level on Muscle Growth Mechanisms in Juvenile Rainbow Trout (Oncorhynchus mykiss). Aquaculture 2018, 483, 273–285. [Google Scholar] [CrossRef]
  23. Chu, Z.J.; Yu, D.H.; Dong, G.F.; Gong, S.Y. Partial Replacement of Fish Meal by Soybean Meal with or without Methionine and Phytase Supplement in Diets for Juvenile Chinese Sucker, Myxocyprinus asiaticus. Aquac. Nutr. 2015, 22, 12318. [Google Scholar] [CrossRef]
  24. Figueiredo-Silva, C.; Lemme, A.; Sangsue, D.; Kiriratnikom, S. Effect of DL-Methionine Supplementation on the Success of Almost Total Replacement of Fish Meal with Soybean Meal in Diets for Hybrid Tilapia (Reochromis niloticus × Reochromis mossambicus). Aquac. Nutr. 2015, 21, 234–241. [Google Scholar] [CrossRef]
  25. Niu, J.; Figueiredo-Silva, C.; Dong, Y.; Yue, Y.R.; Lin, H.Z.; Wang, J.; Wang, Y.; Huang, Z.; Xia, D.M.; Lu, X. Effect of Replacing Fish Meal with Soybean Meal and of DL-methionine or Lysine Supplementation in Pelleted Diets on Growth and Nutrient Utilization of Juvenile Golden Pompano (Trachinotus ovatus). Aquac. Nutr. 2015, 22, 12284. [Google Scholar] [CrossRef]
  26. Zhang, Y.Q.; Ji, W.X.; Wu, Y.B.; Han, H.; Qin, J.G.; Wang, Y. Replacement of Dietary Fish Meal by Soybean Meal Supplemented with Crystalline Methionine for Japanese Seabass (Lateolabrax japonicus). Aquac. Res. 2014, 47, 243–252. [Google Scholar] [CrossRef]
  27. Nunes, A.J.P.; Masagounder, K. Optimal Levels of Fish Meal and Methionine in Diets for Juvenile Litopenaeus vannamei to Support Maximum Growth Performance with Economic Efficiency. Animals 2022, 13, 20. [Google Scholar] [CrossRef]
  28. Ren, M.; Liang, H.; He, J.; Masagounder, K.; Yue, Y.; Yang, H.; Ge, X.; Xie, J.; Xi, B. Effects of DL-Methionine Supplementation on the Success of Fish Meal Replacement by Plant Proteins in Practical Diets for Juvenile Gibel Carp (Carassius auratus Gibelio). Aquac. Nutr. 2017, 23, 934–941. [Google Scholar] [CrossRef]
  29. Chi, S.Y.; Tan, B.P.; Lin, H.Z.; Mai, K.S.; Ai, Q.H.; Wang, X.J.; Zhang, W.B.; Xu, W.; LiuFu, Z.G. Effects of Supplementation of Crystalline or Coated Methionine on Growth Performance and Feed Utilization of the Pacific White Shrimp, Litopenaeus vannamei. Aquac. Nutr. 2011, 17, e1–e9. [Google Scholar] [CrossRef]
  30. Noor, Z.; Noor, M.; Khan, S.A.; Younas, W.; Ualiyeva, D.; Hassan, Z.; Yousafzai, A.M. Dietary Supplementations of Methionine Improve Growth Performances, Innate Immunity, Digestive Enzymes, and Antioxidant Activities of Rohu (Labeo rohita). Fish Physiol. Biochem. 2021, 47, 451–464. [Google Scholar] [CrossRef]
  31. Ceccotti, C.; Biasato, I.; Gasco, L.; Caimi, C.; Oddon, S.B.; Rimoldi, S.; Brambilla, F.; Terova, G. How Different Dietary Methionine Sources Could Modulate the Hepatic Metabolism in Rainbow Trout? Curr. Issues Mol. Biol. 2022, 44, 3238–3252. [Google Scholar] [CrossRef]
  32. Zhou, Y.Y.; He, J.Y.; Su, N.N.; Masagounder, K.; Xu, M.L.; Chen, L.L.; Liu, Q.Y.; Ye, H.Q.; Sun, Z.Z.; Ye, C.X. Effects of DL-Methionine and a Methionine Hydroxy Analogue (MHA-Ca) on Growth, Amino Acid Profiles and the Expression of Genes Related to Taurine and Protein Synthesis in Common Carp (Cyprinus carpio). Aquaculture 2021, 532, 735962. [Google Scholar] [CrossRef]
  33. Gao, Z.; Wang, X.; Tan, C.; Zhou, H.; Mai, K.; He, G. Effect of Dietary Methionine Levels on Growth Performance, Amino Acid Metabolism and Intestinal Homeostasis in Turbot (Scophthalmus maximus L.). Aquaculture 2019, 498, 335–342. [Google Scholar] [CrossRef]
  34. Sun, Z.; Lin, P.; Mai, H.; Chen, L.; Wei, Z.; Tan, B.; Ye, C. Metabolomics Profiles Revealed Potential Biomarkers of Pacific White Shrimp (Litopenaeus vannamei) under Cold and Low Salinity Stress. Aquac. Rep. 2025, 40, 102633. [Google Scholar] [CrossRef]
  35. Morita, M.; Imanaka, T. Peroxisomal ABC Transporters: Structure, Function and Role in Disease. Biochim. Biophys. Acta (BBA)—Mol. Basis Dis. 2012, 1822, 1387–1396. [Google Scholar] [CrossRef]
Figure 1. Principal component analysis based on the metabolomic data of the hepatopancreas samples from the control group and HM100 group. FM, control group; MET, HM100 group.
Fishes 10 00203 g001
Figure 2. The 6 representative significantly differential metabolites in hepatopancreas samples between the control group and HM100 group. FM, control group; MET, HM100 group.
Fishes 10 00203 g002
Figure 3. KEGG enrichment pathway for differential metabolites in hepatopancreas samples between the control group and HM100 group.
Fishes 10 00203 g003
Figure 4. Principal component analysis based on the transcriptome data of hepatopancreas samples from the control group and HM100 group. FM, control group; MET, HM100 group.
Fishes 10 00203 g004
Figure 5. Differential genes based on the transcriptome data of hepatopancreas samples from the control group and HM100 group.
Fishes 10 00203 g005
Figure 6. Enriched GO terms of differentially expressed genes between the control and HM100 groups.
Fishes 10 00203 g006
Figure 7. Enriched KEGG pathway of differentially expressed genes between the control group and HM100 group, the displayed KEGG pathways were referred to the top 20 enriched pathways. (A) Enriched KEGG pathways of up-regulated genes; (B) enriched KEGG pathways of down-regulated genes.
Fishes 10 00203 g007
Table 1. Formulation and proximate composition of the experimental diets (%, dry matter).
IngredientsFMCM50CM100HM50HM100
Fishmeal5.05.05.05.05.0
Soybean meal26.826.826.826.826.8
Wheat middling31.631.631.631.631.6
Rapeseed meal12.012.012.012.012.0
Cottonseed protein10.010.010.010.010.0
Soybean lecithin oil1.51.51.51.51.5
Soybean oil1.01.01.01.01.0
Fish oil1.01.01.01.01.0
DL-methionine0.00.250.50.00.0
Coated methionine (10%)0.00.00.02.55.0
Vitamin mixture a0.50.50.50.50.5
Mineral mixture b0.20.20.20.20.2
Sodium carboxymethyl cellulose2.02.02.02.02.0
Choline chloride0.20.20.20.20.2
Ca(H2PO4)22.02.02.02.02.0
Magnesium sulfate0.20.20.20.20.2
Coating materials6.05.755.53.51.0
Total100100100100100
Nutrient level (%)
Dry matter92.4692.4092.5692.0391.52
Crude protein32.1633.8634.6534.0734.58
Crude lipid5.535.505.515.525.50
Ash6.546.716.656.646.61
a The vitamin premix provided the following per kg of diets: VA 8000 IU, VC phosphate 175 mg, VD3 1000 IU, Vitamin E 100 mg, VK3 4.8 mg, VB1 14.7 mg, VB2 28 mg, VB6 19.6 mg, VB12 0.07 mg, calcium pantothenate 22.5 mg; nicotinamide 78.4 mg; folic acid 1.65 mg; biotin 0.5 mg; and inositol 122.5 mg. b The mineral premix provided the following per kg of diets: FeSO4·H2O 960 mg; CuSO4·5H2O 12 mg; MnSO4 H2O 33 mg; ZnSO4 H2O 70 mg; Na2SeO3 1.2 mg; Ca(IO3)2 1.4 mg; CoCl2·6H2O 2.4 mg; and zeolite 920 mg.
Table 2. Effects of methionine levels (0.25% vs. 0.50%, dry matter) and forms (DL-methionine vs. coated methionine) on the growth performance of gibel carp.
GroupsBWiBWfWGSGRFCRSRCF
FM9.22 ± 0.0420.47 ± 0.42 ab119.97 ± 4.79 a1.14 ± 0.04 a1.98 ± 0.08 b96.00 ± 3.272.79 ± 0.20
CM509.25 ± 0.0119.88 ± 0.28 a113.95 ± 4.53 a1.09 ± 0.02 a2.10 ± 0.06 b99.00 ± 2.002.85 ± 0.21
CM1009.22 ± 0.0320.27 ± 0.75 ab117.86 ± 7.81 a1.13 ± 0.06 a2.03 ± 0.14 b96.00 ± 0.002.85 ± 0.14
HM509.19 ± 0.0520.07 ± 0.20 a116.04 ± 1.04 a1.12 ± 0.01 a2.04 ± 0.03 b95.00 ± 2.002.75 ± 0.22
HM100 9.18 ± 0.0321.46 ± 0.81 b130.77 ± 11.27 b1.21 ± 0.06 b1.83 ± 0.12 a96.00 ± 5.662.83 ± 0.14
Two-way ANOVA (p value)
Form/0.3300.0560.0220.0230.2300.321
Level/0.0090.0200.0090.0120.5390.502
Interactions/0.1100.1620.1460.1730.2300.500
Note: Within a column, values (mean ± SD) with different superscripts are significantly different (p < 0.05). BWi: initial body weight; BWf: final body weight; Lf: the final body length; WG: weight gain; SGR: specific growth rate; FCR: feed conversion ratio; SR: survival rate; and CF: condition factor.
Table 3. Effects of methionine levels (0.25% vs. 0.50%, dry matter) and forms (DL-methionine vs. coated methionine) on the whole-body composition of gibel carp.
GroupsMoisture (%)Crude Protein (%)Crude Lipid (%)Ash (%)
FM72.95 ± 0.3715.99 ± 0.124.67 ± 0.12 b4.27 ± 0.07
CM5073.79 ± 0.5516.07 ± 0.104.30 ± 0.12 a4.25 ± 0.04
CM10074.23 ± 1.2515.95 ± 0.064.77 ± 0.23 b4.25 ± 0.06
HM5073.76 ± 0.9716.15 ± 0.174.73 ± 0.08 b4.35 ± 0.06
HM10073.24 ± 0.3216.14 ± 0.154.20 ± 0.26 a4.26 ± 0.05
Two-way ANOVA (p value)
Form0.2540.1000.2100.123
Level0.9170.3990.2190.178
Interactions0.2870.4680.1470.164
Note: Within a column, values (mean ± SD) with different superscripts are significantly different (p < 0.05).
Table 4. Effects of methionine levels (0.25% vs. 0.50%, dry matter) and forms (DL-methionine vs. coated methionine) on the intestinal digestive enzyme activities of gibel carp.
GroupsLipase (U/mgprot)Protease (U/mgprot)Amylase (U/mgprot)
FM11.12 ± 0.25 a18.60 ± 4.10 a61.26 ± 1.89 a
CM5011.05 ± 0.32 a21.96 ± 2.48 ab61.07 ± 1.43 a
CM10011.23 ± 0.44 a24.66 ± 0.65 b61.16 ± 1.97 a
HM5011.31 ± 0.50 a25.36 ± 1.32 b62.09 ± 1.26 a
HM10014.81 ± 0.26 b25.67 ± 1.97 b65.03 ± 0.76 b
Two-way ANOVA (p value)
Form<0.0010.0200.001
Level<0.0010.0940.022
Interactions<0.0010.1750.030
Note: Within a column, values (mean ± SD) with different superscripts are significantly different (p < 0.05).
Disclaimer/Publisher’s Note: The statements, opinions and data contained in all publications are solely those of the individual author(s) and contributor(s) and not of MDPI and/or the editor(s). MDPI and/or the editor(s) disclaim responsibility for any injury to people or property resulting from any ideas, methods, instructions or products referred to in the content.

