Article

Increased CO2 Concentration Mitigates the Impact of Nitrite on Zebrafish (Danio rerio) Liver and Gills

1
College of Fisheries, Engineering Research Center of Green Development for Conventional Aquatic Biological Industry in the Yangtze River Economic Belt, Ministry of Education, Hubei Provincial Engineering Laboratory for Pond Aquaculture, Huazhong Agricultural University, Wuhan 430070, China
2
Central-Southern Safety & Environment Technology Institute Co., Ltd., Wuhan 430061, China
*
Author to whom correspondence should be addressed.
Fishes 2025, 10(5), 205; https://doi.org/10.3390/fishes10050205
Submission received: 29 December 2024 / Revised: 14 April 2025 / Accepted: 25 April 2025 / Published: 1 May 2025
(This article belongs to the Section Physiology and Biochemistry)

Abstract

Nitrite and carbon dioxide (CO2) are common environmental substances in intensive aquaculture ponds. However, the effects and mechanisms of their combined exposure on aquatic animals remain unclear. In this study, we investigated the toxic effects of 2.5, 5, and 10 mg/L CO2 in the presence of 2 mg/L nitrite on hematological, blood gas parameters, and liver physiological and pathological changes in zebrafish (Danio rerio) over 14 days and 28 days. Our results demonstrated a reduced nitrite uptake and accumulation in the gills and liver of zebrafish exposed to nitrite and varying levels of CO2. Increased CO2 levels also led to a decrease in the expression of gill ae1, whereas the transcriptional levels of nhe1 and nhe3b, nkcc and nbc1 were notably upregulated. Moreover, there was a decrease in Cl and Na+ concentrations, along with an increase in K+ concentrations. These changes suggested that zebrafish responded to increased CO2 stress by reducing their absorption of chloride-dependent nitrite, excreting H+ and maintaining their internal pH. Exposure to higher CO2 levels in the presence of nitrite resulted in lower blood MetHb levels and liver oxidative stress compared to the nitrite single-exposure treatment. Furthermore, co-treatment with CO2 and nitrite attenuated the nitrite-induced damage to genes related to mitochondrial respiratory chain function (ndufs1, mtnd5, mtycb, atp5f1b, mtatp8), leading to elevated ATP levels. Exposure to nitrite alone increased the expression of lipolytic genes (hsla, cpt1aa, atgl) and decreased the expression of lipid synthesis genes (fasn, acaca), resulting in a decrease in TG and TC content in zebrafish liver. However, co-treatment with CO2 and nitrite prevented the nitrite-induced disruption of lipid metabolism, as evidenced by the improvement in TG and TC levels, as well as transcriptional levels of lipid metabolism-related genes. In conclusion, our study suggests that in the presence of 2 mg/L nitrite, increased CO2 (2.5–10 mg/L) may modulate ion transporter genes to reduce the chloride-dependent nitrite uptake and maintain pH homeostasis, concurrently alleviating oxidative stress, restoring mitochondrial respiratory function, and improving lipid metabolism in a dose-dependent manner. These changes may be related to the increase in the concentration of bicarbonate ions in the water as the CO2 level rises. These findings shed light on the potential protective effects of CO2 in mitigating the harmful effects of nitrite exposure in aquatic animals.
Key Contribution: Our findings are particularly novel in that increased CO2 (2.5–10 mg/L) may, in the presence of 2 mg/L nitrite, modulate ion transporter genes to reduce the chloride-dependent nitrite uptake and maintain pH homeostasis. Concurrently, it alleviates oxidative stress, restores mitochondrial respiratory function, and ameliorates lipid metabolic disorders in a dose-dependent manner, all of which collectively attenuate nitrite-induced toxicity in zebrafish liver and gills. These findings shed light on the potential protective effects of CO2 in mitigating the harmful effects of nitrite exposure in aquatic animals.

Graphical Abstract

1. Introduction

Fish, as a source of high-quality protein, are in increasing demand for production annually, leading to a continuously growing farming density [1]. High-density aquaculture practices can cause an increase in feed consumption, resulting in the accumulation of residual feed and feces, which can generate toxic and harmful substances like nitrite and ammonia [2]. Nitrite, a prevalent contaminant, is often produced in excess due to disruptions in the activity of nitrifying bacteria and imbalances in nitrogen removal processes [3]. In teleost fishes, nitrite uptake is mainly via chloride cells on the gills that compete with Cl for Cl/HCO3 ion channels for entry [4] and can accumulate in various organs such as the gills, liver, and muscle [4,5]. Previous studies have demonstrated that elevated ambient nitrite levels have a significant impact on fishes’ metabolism and physiological responses, including the induction of methemoglobinemia [6], the disturbance of gill ionic homeostasis [7,8], glucose and lipid metabolism disorder [9], and the induction of oxidative stress [10,11], all of which can seriously affect aquaculture performance. The fishery water quality standard in China [12] recommends that nitrite levels in aquaculture water should not exceed 0.2 mg/L. However, in intensive fish aquaculture systems, nitrite levels range from 0.5 to 15 mg/L, reaching as high as 49 mg/L [11,13,14,15], posing a significant threat to the health and welfare of aquatic animals.
Due to the high rates of oxygen consumption and CO2 production in aquatic animals grown at high stocking densities, as well as the higher solubility of CO2 in water and slower restoration of atmospheric levels, elevated dissolved CO2 is an unavoidable consequence of intensive aquaculture [2]. It is reported that CO2 concentrations can reach 8 mg/L in shrimp aquaculture ponds [16], range from 10 to 30 mg/L in salmon recirculating culture systems [17], and accumulate up to 20 to 50 mg/L in tilapia aquaculture ponds [18]. In general, approximately 30% of the excess of atmospheric CO2 will be absorbed by surface water, leading to increased water CO2 and partial pressure (pCO2) and a lowered pH [19]. There is evidence suggesting that elevated water pCO2 can affect individual behaviors [20,21], cause tissue damage to major organs [22], and reduce growth and survival rates [23]. Since elevated concentrations of nitrite and CO2 often coexist in water for extended periods in intensive aquaculture systems, it is imperative to investigate their combined toxic effects and potential mechanisms on aquatic animals in relation to real aquaculture environments.
Environmental stressors can impact organisms through interactive mechanisms such as synergistic and antagonistic effects. Research has demonstrated that marine fish have developed strategies to cope with an acute elevation in CO2, known as hypercapnia [24]. During hypercapnia, fish maintain their pH balance and internal homeostasis by conserving HCO3 through the excretion of H+ via Cl/HCO3 ion exchange channels [25,26]. Nitrite is primarily absorbed by fish through Cl/HCO3 ion exchange channels. Hence, we hypothesized that increased water CO2 levels leading to HCO3 retention may reduce the Cl uptake, subsequently decreasing nitrite absorption and mitigating nitrite toxicity in freshwater fish.
Zebrafish, a commonly used model freshwater fish, is sensitive to changes in water quality and possesses established regulatory mechanisms of gill ion channels, making it suitable for assessing the toxic effects of environmental factors [27]. Based on this, we chose zebrafish to investigate the toxic effects of elevated CO2 concentrations in the presence of nitrite, focusing on hematological and blood gas parameters, as well as physiological and pathological changes in the gills and liver, including ion transport homeostasis, oxidative–antioxidant defense, mitochondrial respiratory chain function, and lipid metabolism.

2. Materials and Methods

2.1. Chemicals

Sodium nitrite (NaNO2) was obtained from Sinopharm chemical reagent Co., Ltd. (Shanghai, China) and dissolved in distilled water to prepare a stock solution of nitrite (20 g/L). Tricaine methane sulfonate (MS-222), used in the experiments, was purchased from Sigma-Aldrich (St. Louis, MO, USA). All other reagents used in this study were of analytical grade.

2.2. Zebrafish Rearing and Exposure Experiments

Zebrafish (line AB, three-month-old, mean weight 0.52 ± 0.05 g) were obtained from the Institute of Aquatic Biology, Chinese Academy of Sciences. Prior to the formal experiment starting, they were maintained in a recirculating water system with a sump bucket volume of 120 L, each aquaculture bucket holding 8 L, and with a recirculating water flow rate of 18 L/h (Figure 1). Initially, tap water was passed through degassing and chloride removal processes before being stored in the sump bucket. Afterwards, CO2 gas was injected into the sump bucket and then was transferred into three different tanks via pipes. The photoperiod was set to a 14:10 h (light/dark) cycle, and the temperature was maintained at 26 ± 0.4 °C. During the acclimation period, the zebrafish were fed Artemia nauplii twice daily. Other water quality parameters included a pH of 7.8 ± 0.3 and dissolved oxygen levels of 7.4 ± 0.6 mg/L. Prior to the formal study, we conducted a preliminary experiment to monitor the water quality parameters, including bicarbonate, at 12 h and 24 h intervals. The relevant data are summarized in Table A2.
The acute toxicity of CO2 to the zebrafish was firstly evaluated prior to the formal experiment [28], and the 96 h LC50 was determined to be 143.6 mg/L. In consideration of environmental relevance, the exposure concentrations for CO2 in our study were set as the control (0~1 mg/L), 2.5 mg/L, 5 mg/L and 10 mg/L. On the other hand, the nitrite exposure concentration was selected based on the 96 h LC50 value for zebrafish (220.5 mg/L) and our previous research findings [6,9]. The zebrafishes’ health was also systematically evaluated by assessing physical and behavioral parameters, including active swimming patterns, normal respiration rates, intact integument with vibrant pigmentation, and the absence of lesions or deformities. Only individuals demonstrating these criteria were included in the formal experiment. After the acclimation period, 450 fish were randomly divided into five treatment groups: control (0–0.01 mg/L nitrite and 0–1 mg/L CO2), Nitrite (2 mg/L nitrite and 0–1 mg/L CO2), Nitrite-2.5 CO2 (2 mg/L nitrite and 2.5 mg/L CO2), Nitrite-5 CO2 (2 mg/L nitrite and 5 mg/L CO2), and Nitrite-10 CO2 (2 mg/L nitrite and 10 mg/L CO2). Each treatment consisted of 90 fish, which was randomly divided into three replicate buckets. To maintain the relative stability of nitrite and carbon dioxide concentrations, one-third of the exposure medium was replaced with fresh water containing the relevant concentration of sodium nitrite every 24 h, and CO2 gas was added into in the medium every 12 h. Nitrite levels in the experimental buckets were monitored daily using the N–(1-Naphthyl) ethylenediamine spectrophotometric method [29], and CO2 levels were measured using a Smart Carbon Dioxide Analyzer (BSA/SZ-ZN-CO2-10000, Shenzhen, China). Carbon dioxide and nitrite concentrations during the formal experiment are shown in Appendix B. Temperature, dissolved oxygen, and pH are described in Table 1. At the end of the 14-day and 28-day exposure periods, the zebrafish were anesthetized with 0.02% MS-222. Blood samples were collected through the tail artery for subsequent biochemical analysis. Liver and gill tissues were promptly dissected and frozen in liquid nitrogen, then transferred to a −80 °C freezer for storage until further analysis. The study protocol was approved by the Institutional Animal Care and Use Committee (IACUC) at Huazhong Agricultural University, Wuhan, China.

2.3. Blood Gas and Hb/MetHb Quantification

Blood samples for blood gas analysis were collected in 3 replicates per treatment, each consisting of a pooled sample from 7 individual fish. Blood volumes ranging from 80 to 100 μL were temporarily stored in centrifuge tubes containing lithium heparin and then measured within 4 h using the commercial CG8+ kit (Item NO. 03P88-25) on an i-STAT Portable Clinical Analyzer (300-G, Abbott, Chicago, IL, USA).
For hemoglobin (Hb) and methemoglobin (MetHb) measurements, whole blood samples were collected in 3 replicates, each pooling 8 individual fish, and stored at −20 °C. Subsequent analyses were conducted using commercial kits (Item No. A102-1-1, colorimetric) supplied by the Nanjing Jiancheng Bioengineering Institute (Nanjing, China). The hemoglobin measurement involved oxidizing hemoglobin to methemoglobin, which was then allowed to react with cyanide ions to form cyanmethemoglobin that has a maximum absorption peak at a wavelength of 540 nm. The detection of MetHb levels adopts the modified Evelyn–Malloy method, which calculates the concentration of MetHb by combining the absorbance difference between 630 nm and 602 nm with the standard curve.

2.4. Histopathological Analysis

According to our previous study [30], tissue samples (gills and liver) from 3 individual zebrafish per treatment group were fixed with 4% neutral formaldehyde for 24 h, followed by dehydration through a graded ethanol series up to 100%. The samples were then cleared in xylene, embedded in paraffin, sectioned, and stained with hematoxylin and eosin (H&E). Histopathological examinations were conducted using a optical microscope (Nikon H600L, Nikon Corporation, Tokyo, Japan). For further quantitative analysis, three random images per tissue section were captured and analyzed using ImageJ v1.54p (NIH, Bethesda, MD, USA).

2.5. Biochemical Indicator Assay

Zebrafish gills (3 replicates, each consisting of a pool of 3 fish) were homogenized in ice-cold 0.9% NaCl solution (1:10 w/v) and then centrifuged at 1100× g for 10 min at 4 °C. The resulting homogenates were utilized to determine the concentrations of nitrite (Item No. A038-1-1), as well as the activities of Na+-K+-ATPase (Item No. A070-2-2) and ATPase (Item No. A095-1-1), using commercial kits supplied by the Nanjing Jiancheng Bioengineering Institute (Nanjing, China). Additionally, the activities of carbonic anhydrase (CA, Item No. DB159X-QT) in gill homogenates were determined using commercial kits supplied by Shanghai Huding Biotechnology Co., Ltd. (Shanghai, China). For the ion analysis, gills (3 replicates, each comprising a pool of 3 fish) were homogenized in ice-cold deionized water (1:10 w/v) and then centrifuged at 1100 g for 10 min at 4 °C. The supernatants were then used to quantify the concentrations of Na+ (Item No. C002-1-1), K+ (Item No. C001-2-1), and Cl (Item No. C003-2-1) ions using commercial kits supplied by the Nanjing Jiancheng Bioengineering Institute (Nanjing, China). For the biochemical analysis of liver parameters, the zebrafish livers were homogenized in ice-cold 0.9% NaCl solution (1:10 w/v) and centrifuged at 700× g for 10 min at 4 °C. The supernatants were subsequently separated and used for the quantification of nitrite (Item No. A038-1-1), triglyceride (TG, Item No. A110-1-1), total cholesterol (TC, Item No. A111-1-1), malondialdehyde (MDA, Item No. A003-1-1), and reduced glutathione (GSH, Item No. A006-1-1), as well as the activities of superoxide dismutase (SOD, Item No. A001-1-1) and catalase (CAT, Item No. A007-1-1). These measurements were conducted using commercial kits from the Nanjing Jiancheng Bioengineering Institute (Nanjing, China). Detailed methods are described in Appendix A.1.

2.6. RNA Extraction and qPCR

The methods of total RNA extraction, cDNA synthesis, and qRT-PCR for the zebrafish liver are described in Appendix A.2. The primers were designed by Primer 3 Plus (Premier Biosoft International, Andreas, Helen, GA, USA) and are listed in Table A1. Relative mRNA levels of target genes were determined using the 2−ΔΔCt method, with glyceraldehyde-3-phosphate dehydrogenase (gadph) serving as the reference gene.

2.7. Statistical Analyses

Statistical analysis was performed with SPSS 26.0 software (IBM, Armonk, NY, USA). The experimental data are expressed as mean ± SEM (standard error). At each exposure duration, significant differences between the exposure groups were evaluated by one-way ANOVA followed by Duncan’s multiple range test at a 95% confidence level. Differences between 14 d exposure and 28 d exposure were compared using Student’s t-test. All graphics were drawn using GraphPad Prism 8.0 (GraphpPad Software Inc., La Jolla, CA, USA).

3. Results

3.1. Nitrite Accumulation in Liver and Gills

On both day 14 and day 28, there was a significant increase in the accumulation of nitrite in the gills and liver of zebrafish exposed to 2 mg/L nitrite compared to the control group (Figure 2). In contrast, in the groups co-exposed to nitrite and varying levels of CO2, nitrite levels decreased significantly as the CO2 concentration increased, in comparison to the nitrite single-exposure group, on both day 14 and day 28. However, nitrite content in the gills and liver was higher on day 28 than on day 14.

3.2. Hematological and Blood Gas Parameters

3.2.1. Hb and MetHb Levels in Blood

As depicted in Figure 3, exposure to nitrite alone led to a significant reduction in Hb levels and an increase in MetHb levels compared to the control on day 14 (Figure 3). In contrast, when carbon dioxide concentrations were elevated in conjunction with nitrite exposure, there was a marked increase in blood Hb content and a corresponding decrease in MetHb levels compared to the nitrite single-exposure group.

3.2.2. Blood Gas Analysis

Compared to the control group, exposure to nitrite alone significantly increased blood HCO3, TCO2, and Glu levels but decreased sO2 content at both day 14 and day 28 (Table 2). In contrast, exposure to nitrite combined with varying levels of CO2 significantly elevated blood pCO2, pO2, HCO3, TCO2, and sO2 at both day 14 and day 28, while also reducing blood Glu levels compared to the nitrite single-exposure group. Compared to exposure to nitrite alone, co-treatment with nitrite and CO2 essentially maintained a stable plasma pH on day 28. Specifically, in the group exposed to nitrite and 10 mg/L CO2, these blood gas indices rose to their maximum values on day 28, except for Glu.

3.3. Effects of Nitrite Co-Treatment with Carbon Dioxide on Gills

3.3.1. Morphological Changes in Gill Tissues

As shown in Figure 4, the gills of the control group displayed a normal structure, with no significant changes in surface morphology at both day 14 and day 28 (Figure 4). After 14 days of exposure to nitrite alone, histopathological analysis revealed the vacuolization and shortening of the gill filaments. By day 28, more pronounced pathological alterations were observed in the nitrite single-exposure group, including epithelium rupture of the gill lamellae and dilatation of capillaries (Figure 4). By contrast, gills exposed to nitrite combined with varying levels of CO2 showed reduced pathological changes compared to those exposed to nitrite alone, with the severity of pathological damage decreasing as the CO2 concentration increased. Specifically, the gill structure in the group co-exposed to nitrite and 10 mg/L CO2 remained intact and closely resembled that of the control group.

3.3.2. Ion Transport Changes in Gills

Compared to the control group, nitrite exposure induced a significant decrease in Cl and Na+ concentrations in the gills of zebrafish at both day 14 and day 28, with no significant changes observed in K+ concentration. Additionally, the decrease in Cl concentration was more pronounced at day 28 compared to day 14 (Figure 5A–C). Exposure to nitrite combined with varying levels of CO2 significantly decreased Cl and Na+ concentrations and increased K+ concentrations compared to the nitrite single-exposure group. Compared to the control group, nitrite exposure also significantly reduced CA activity and ATP content at both day 14 and day 28, while remarkably elevating ATPase activity at day 28. The declines in CA activity and ATP content were less severe on day 28 compared to day 14. Conversely, at day 14 and day 28, co-treatment with nitrite and CO2 (5 mg/L and 10 mg/L) markedly elevated CA and Na+-K+-ATPase activities, as well as ATP content, compared to the nitrite single-exposure group (Figure 5D–G). Notably, combined exposure to nitrite and 2.5 m/L CO2 resulted in a significant increase in ATP content on day 28 compared to day 14. Consistent with these findings, compared to the control group, co-treatment with nitrite and CO2 induced significant alterations in genes related to iron transport, including the upregulation of nhe1, nbc1, nhe3b, nka, and nkcc, as well as the downregulation of ae1, at day 14 and day 28 (Figure 5H,I). However, there were no significant differences in the mRNA express levels of genes ae1, nhe1, nbc1, and nkcc between the control and nitrite exposure groups.

3.3.3. Changes in rMO2

During the experiment, we monitored the routine metabolic rate of oxygen consumption (rMO2) of the zebrafish (as shown in Figure A2). After 28 days of nitrite exposure, the rMO2 of the zebrafish increased significantly compared with the control group, and the rMO2 on the 28th day was higher than that on the 14th day. When the zebrafish were co-exposed to nitrite and either 5 mg/L or 10 mg/L of CO2, their rMO2 exhibited a significant increase compared to nitrite exposure alone.

3.4. Effects of Nitrite Co-Treatment with Carbon Dioxide on Liver

3.4.1. Morphological Changes in Liver Tissue

The liver sections of the control group showed a normal appearance (Figure 6). After a 14-day exposure to 2 mg/L nitrite alone, the fish livers exhibited vacuolization, nuclear pyknosis, and degeneration. By 28 days of nitrite exposure, similar lesions become more prevalent. Exposure to nitrite combined with varying levels of CO2 on day 14 and day 28 resulted in similar pathological damage, which decreased as the concentrations of CO2 increased.

3.4.2. Oxidative-Antioxidant Parameter Analysis

Compared to the control group, the hepatic MDA content at both day 14 and day 28 was significantly elevated in the group exposed to nitrite alone (Figure 7A). Meanwhile, nitrite stress led to significant reductions in antioxidant parameters, including SOD, CAT, and GSH (Figure 7B–D). Additionally, there was a significant increase in SOD and CAT activities at 28 days of nitrite exposure compared to 14 days. Conversely, co-treatment with nitrite and varying levels of CO2 resulted in a significant decrease in MDA content and an increase in the activities of SOD and CAT, as well as GSH content. These effects became more pronounced with increasing CO2 concentrations.

3.4.3. Profiles of Genes Related to Mitochondrial Respiratory Chain

Compared to the control, exposure to nitrite alone resulted in a significant downregulation of genes associated with the mitochondrial respiratory chain (ndufs1, mtnd5, mtycb, uqcrq, atp5f1b, and mtatp8) at both day 14 and day 28 (Figure 8). In contrast, co-treatment with nitrite and varying levels of CO2 at day 14 and day 28 significantly increased transcriptional levels of mitochondrial respiratory chain-related genes compared to the nitrite single-exposure group. Furthermore, the degree of upregulation of these genes increased with rising CO2 concentrations.

3.4.4. Lipid Metabolism Analysis in the Liver

As shown in Figure 9, exposure to nitrite alone significantly reduced the content of TG and TC in the liver of the zebrafish at both day 14 and day 28. And the content of TC was markedly higher at day 28 compared to day 14 following nitrite exposure alone. When the fish were subjected to a combination of nitrite and varying levels of CO2, there was a significant increase in the content of hepatic TG and TC relative to the nitrite single-exposure group (Figure 9A,B). Concurrently, nitrite stress alone for 14 days and 28 days led to a significant downregulation in the transcriptional levels of genes associated with lipid synthesis (fasn and acaca), while upregulating the expression of genes involved in lipid catabolism, including atgl, cpt1aa, and hsla. These transcriptional modifications were reversed upon co-treatment with nitrite and varying levels of CO2, as compared to the nitrite single-exposure group (Figure 9C,D).

4. Discussion

4.1. Increased CO2 Concentration Mitigates Toxic Effects of Nitrite on Gills

Gills serve as the primary respiratory organ in fish, supplying sufficient oxygen for metabolic processes and playing a critical role in waste excretion, osmoregulation, and maintaining the acid-base balance [31]. Nitrite can enter a fish’s body through chloride cells in the gills and accumulate in the gills, plasma, liver, and kidneys via the bloodstream [32,33]. A previous study found that nitrite concentrations in the plasma of Atlantic sturgeon (Mitchill) can exceed environmental nitrite levels by over 40 times after 96 h of exposure to 1 mg/L nitrite [34]. In our study, following exposure to nitrite alone for 14 and 28 days, there was a significant increase in nitrite levels in zebrafish gills, with this increase becoming more pronounced with prolonged exposure. Interestingly, we observed reduced nitrite accumulations in the gills of zebrafish exposed to elevated water CO2 levels in the presence of nitrite. These findings are consistent with those reported in crayfish (Procambarus clarkii) [35] and clown knifefish (Chitala ornata) [32]. In line with these observations, our study demonstrated that increased CO2 alleviated nitrite-induced damage in the gills, including epithelial vacuolation, deformation, and shrinkage of the gill lamellae, indicating a restoration in the respiratory function of the gills to a certain extent.
The assessment of gill respiration function frequently involves blood gas analysis [36]. Our results showed that exposure to varying CO2 levels in the presence of nitrite induced hypercapnia, characterized by a stable blood pH and increased pCO2, HCO3, and TCO2 content at day 14 and day 28. Previous studies have reported decreased nitrite absorption in striped catfish (Pangasanodon hypothalamus) after short-term exposure (6 h) to nitrite and CO2 [37]. Gam et al. has documented that clown knifefish respond to aquatic hypercapnia (21 mmHg CO2) by reducing the turnover of Cl and HCO3 in the gills [32]. Nitrite enters gill epithelial cells primarily by competing with Cl for transport through anion exchangers like AE1 (Cl/HCO3 exchanger isoform 1) [8,11,33], resulting in reduced gill Cl levels. Elevated CO2 can be converted into H+ and HCO3 by carbonic anhydrase (CA), decreasing the internal pH. Previous studies have shown that marine fish can directly expel H+ via NHE1 (Na+/H+ exchanger isoform 1), while retaining HCO3 through AE1 to maintain internal pH stability [27].
Our results found that co-exposure to nitrite and varying levels of CO2 on day 14 and day 28 induced a significant upregulation of CA activity and nhe1/nhe3 gene expression in zebrafish gills, which coincided with reduced Cl and Na+ concentrations, while plasma pH remained unaltered. Hypothetically, a downregulated ae1 expression may disrupt chloride transport, thereby limiting nitrite uptake via chloride channels. The reduced nitrite accumulation in our study may be ascribed to enhanced CA activity, which inhibited Cl uptake. Similarly, exposure to 1 mM nitrite and 21 mmHg CO2 for 96 h significantly reduced plasma Cl and Na+ levels in clown knifefish, compared to exposure to 1 mM nitrite alone [37]. Thus, our results suggested that zebrafish responded to increased CO2 stress by reducing their absorption of chloride-dependent nitrite and by excreting H+ and retaining HCO3. It is important to note that throughout the experiment, the pH remained remarkably stable, exhibiting only minor fluctuations within the range of 6.89 to 7.10, even at the highest CO2 concentration (10 mg/L). Given the pKa of HNO2 (3.3), nitrite existed predominantly as NO2 (>99.8%) under the experiment’s conditions, as confirmed by previous studies [3]. This indicated that CO2-induced pH changes did not alter nitrite speciation significantly, supporting the conclusion that ion transport modulation by CO2 directly influenced NO2 uptake. Changes in Na+ and K+ are influenced by the activity of ion transport enzymes, such as Na+-K+-ATPase in the gills [27]. In our study, we also observed a significant increase in Na+-K+-ATPase and ATPase activity in the combined groups compared to the nitrite single-exposure group. NhE1 and NhE3b cooperatively regulate the acid-base balance in the gills, with NHE1 primarily mediating the transmembrane Na+/H+ exchange between gill epithelial cells and the external environment, while NHE3b is responsible for Na+/H+ transport across the gill epithelium–blood interface. The above findings suggested that elevated CO2 levels increased the expelling of H+ from the body of the zebrafish via upregulated NHE1, and the Na+ that enters the fish body via the NHE3b ion channel in exchange for H+ is expelled by the NKA ion channel under the action of Na+-K+-ATPase to maintain the blood ion balance.

4.2. The Toxic Effect of Nitrite on the Liver Was Mitigated by the Increase in CO2 Concentration
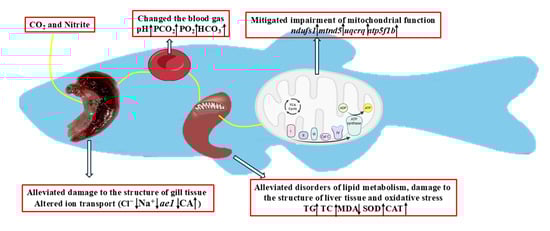
Nitrite enters erythrocytes from the plasma, where it oxidized ferrous iron in hemoglobin to ferric iron, producing methemoglobin (MetHb), which cannot bind oxygen [33]. In our study, exposure to nitrite alone for 14 days increased blood MetHb levels by 40% and decreased the blood oxygen saturation (sO2) by 20%, indicating a reduction in blood oxygen-carrying capacity and hypoxia. However, combined exposure to nitrite and varying levels of CO2 led to decreased MetHb levels and increased sO2 compared to the nitrite single-exposure group. The results of rMO2 were also consistent with this trend. During nitrite and CO2 co-exposure, MetHb and Hb concentrations in clown knifefish blood were also lower than in the nitrite single-exposure group [32]. Thus, our results suggested that increased CO2 in the presence of nitrite alleviated nitrite-induced hypoxia. This finding was supported by the decreased nitrite accumulation and pathological recovery in the liver of the zebrafish co-treated with CO2 and nitrite. Nitrite reacts to produce nitric oxide (NO), which can lead to the production of excessive ROS (reactive oxygen species), causing oxidative stress in organisms [38]. The antioxidant system in organisms counters oxidative stress by increasing antioxidants such as SOD, CAT, and GSH [11,39,40]. In the present study, exposure to nitrite alone inhibited antioxidant parameter levels (SOD, CAT, and GSH) in the liver, preventing the timely clearance of excess free radicals and resulting in elevated MDA. In contrast, combined exposure to nitrite and varying levels of CO2 significantly increased SOD, CAT, and GSH levels in the liver while reducing MDA levels, which indicated that the oxidative stress induced by combined exposure was lower than that caused by nitrite-only exposure.
The toxic effects of nitrite on the mitochondrial respiratory chain primarily involve its binding to copper ions in cytochrome oxidase, which blocks electron transfer and hinders the flow of electrons to oxygen, ultimately leading to a decrease in ATP synthesis [41]. Nitrite also induces electron leakage from the electron transport chain, resulting in a reduction in mitochondrial membrane potential and a subsequent impairment of mitochondrial function [42]. Our findings revealed that nitrite alone significantly decreased the expression levels of genes associated with the mitochondrial respiratory chain, including those involved in complex I (ndufs1, mtnd5), complex III and IV (mtycb), and complex V (atp5f1b, mtatp8), indicating the disruption of mitochondrial oxidative phosphorylation. Thus, the downregulation of genes related to the mitochondrial respiratory chain in the combined exposure groups suggested a mitigation of the damage to the respiratory chain caused by nitrite. The observation that ATP content increased gradually with rising CO2 concentrations in the co-exposure group of nitrite and CO2 further supports this conclusion. Nitrite availability under hypoxic conditions leads to nitric oxide production, improved mitochondrial integrity, improved energy in the inner mitochondrial membrane, increased ATP synthesis, reduced reactive oxygen species production, and reduced lipid peroxidation; it also leads to higher levels and activity of complex I and supercomplex I + III2 [43].
Due to the detrimental impact of nitrite on the mitochondrial respiratory chain and endoplasmic reticulum, previous studies have suggested that nitrite can disrupt glucose metabolism and lipid metabolism [9]. Our results also demonstrated that plasma Glu concentrations significantly increased following exposure to nitrite alone, indicating an upregulation of carbohydrate metabolism in fish to meet energy requirements during stress. In contrast, co-exposure to nitrite and CO2 led to decreased blood Glu levels in relation to nitrite exposure alone, potentially due to reduced nitrite stress and energy demands. In fish, lipids serve as an important energy source [44]. In response to nitrite stress, juvenile turbot utilized lipid reserves to meet increased energy demands [45]. In our study, TG and TC levels, along with the expression of lipid synthesis-related genes (acaca, fasn) in the liver, were significantly reduced under nitrite exposure, while the expression of lipolysis-related genes (atgl, hsla, cpt1aa) increased. This suggested that nitrite decreased lipid synthesis and increased lipolytic activity in zebrafish liver. Interestingly, increased CO2 levels in the presence of nitrite alleviated the disruption of lipid metabolism caused by nitrite. In summary, in the face of nitrite stress, increased water CO2 levels can decrease ROS production, enhance hepatic recovery from pathological damage, restore mitochondrial respiratory chain function, increase ATP synthesis, and ameliorate glucose and lipid metabolic disturbances, which ultimately mitigates the toxic effects of nitrite on the liver. It should be noted that the presence of CO2 does not completely eliminate the toxicity of nitrite to zebrafish.

5. Conclusions

Using day 14 as an illustration, we provide a graphical hypothetical summary demonstrating that an increased CO2 concentration mitigates the impact of nitrite on the zebrafish liver and gills (Figure 10). In brief, the zebrafish responds to increased CO2 stress (2.5–10 mg/L) by altering the gene expression related to ion transporters such as ae1, nbc1, nhe1, nhe3b, and nkcc, which may be associated with reduced chloride-dependent nitrite absorbance, and subsequent pH regulation. Furthermore, in the presence of 2 mg/L nitrite, increased CO2 decreases ROS production, restores mitochondrial respiratory chain function, increases ATP synthesis, and ameliorates lipid metabolic disturbances. These findings shed light on the potential protective effects of CO2 in mitigating the harmful effects of nitrite exposure in aquatic animals. In practical aquaculture systems, strategically adjusting stocking density to elevate dissolved CO2 levels within physiological thresholds, while avoiding inducing stress responses in fish, represents a viable approach to harness CO2 as a valuable carbon source, rather than merely mitigating its accumulation as a detrimental by-product.

Author Contributions

All authors contributed to the study conception and design. X.W.: Conceptualization, Investigation, Data curation, Validation, Formal analysis, Writing—original draft, Writing—review and editing. Y.T.: Conceptualization, Data curation, Visualization, Software. H.Y.: Conceptualization, Data curation, Formal analysis, Investigation, Visualization, Software. Y.H.: Investigation. K.O.-Y.: Data curation. L.W.: Investigation. Q.Z.: Investigation. D.L.: Resources, Supervision. L.L.: Funding acquisition, Project administration, Supervision, Methodology, Writing—review and editing. All authors have read and agreed to the published version of the manuscript.

Funding

This work was jointly supported by the National Key R&D Program of China (2023YFD2400505, 2024YFE0112200), and the China Agriculture Research System of MOF and MARA (CARS-45-23).

Institutional Review Board Statement

All experiments were conducted according to the institutional ethical guidelines of Huazhong Agricultural University (HZAU) on the care and use of experimental animals. Animal research in this study gained approval from the Ethical Committee of Huazhong Agriculture University (approval number: HZAUFI-2023-0087).

Informed Consent Statement

Not applicable.

Data Availability Statement

The original contributions presented in this study are included in this article. Further inquiries can be directed to the corresponding author.

Acknowledgments

The authors expression their appreciation to the Laboratory of Fish Environmental Physiology and Healthy Aquaculture, College of Fisheries, Huazhong Agricultural University, China.

Conflicts of Interest

The authors declare no conflicts of interest. Author Yao Tang was employed by the company Central-Southern Safety&Environment Technology Institute Co., Ltd. The remaining authors declare that the research was conducted in the absence of any commercial or financial relationships that could be construed as a potential conflict of interest.

Appendix A

Appendix A.1

In gills, the K+ concentration was determined spectrophotometrically by NA-TPB as in the described methods [46]. The concentration of gill Cl was detected based on it reacting with mercury thiocyanate to form a colored complex, which was then measured spectrophotometrically at 505 nm [47]. The gill Na+ level was determined according to the chromogenic ionophore method [48]. The level of Na+-K+-ATPase was measured according to the method described by Nørby [49]. The content of ATP was detected by the phosphomolybdic acid colorimetric method [50]. The activity of ATPase was determined by the colorimetric method [51]. The reaction of nitrite and p-nitroaniline formed a light red azo compound, which was then measured by absorbance at 540 nm to calculate nitrite concentrations [52]. The carbonic anhydrase (CA) level in zebrafish gills was determined by the double-antibody sandwich method [53].
Levels of triglyceride (TG), total cholesterol (TC), malondialdehyde (MDA), superoxide dismutase (SOD), catalase (CAT), reduced glutathione (GSH), Na+-K+-ATPase, ATP, lactate, and nitrite in liver tissues were detected using commercial kits from the Nanjing Jiancheng Bioengineering Institute (Nanjing, China). The levels of TG and TC were detected using glycerol-3-phosphate oxidase/cholesterol oxidase coupled to the phenol and 4-aminophenazone method [54]. MDA was used as an index of LPO and was determined following the method described by Janero [55]. The activity of SOD was determined following the method of WST-1 [2-(4-Iodophenyl)-3-(4-nitrophenyl)-5-(2,4-disulfophenyl) 2H-tetrazolium, monosodium salt] [56]. The activity of CAT activity was assayed according to the ammonium molybdate method [57]. The GSH content was determined by the interaction of GSH and 5,5′-dithiobis (2-nitrobenzoic acid) (DNTB), which produced a yellow 5-thio-2-nitrobenzoic acid anion [58]. The level of Na+-K+-ATPase was measured according to the method described by Nørby [53]. The content of ATP was detected by the phosphomolybdic acid colorimetric method [54]. Lactic acid levels were measured by its dehydrogenation through LDH to produce pyruvate, resulting in the conversion of NAD+ to NADH, and the NADH produced was then measured spectrophotometrically at 530 nm. Protein content was determined using the Coomassie blue method with bovine serum albumin (BSA) as a standard [59].

Appendix A.2

The total RNA from zebrafish liver and gills were extracted using RNAiso plus reagent (TaKaRa, Dalian, China). The purity and quantity of total RNA were measured with a NanoDrop ND-2000 spectrophotometer (Themo Scientific, Wilmington, DE, USA) by evaluating the ratio of 260/280. Reverse transcription was conducted with 1 μg total RNA from each sample with a Hifair III 1st Strand cDNA Synthesis Kit (Yeasen, Shanghai, China). qPCR was executed with Hifair qPCR SYBR Green Master Mix (Low Rox Plus) (Yeasen, Shanghai, China) on the Quant Studio 6 Flex Real-Time PCR Detection System (Bio-Rad Laboratories, Hercules, CA, USA). The target genes were amplified in a 20 μL volume composed of 10 μL SYBR Green Ι, 0.8 μL of each primer, 2 μL cDNA, and 6.4 μL nuclease-free water. The primers were designed by Primer 3 Plus (Premier Biosoft International, Andreas, Helen, GA, USA). The amplification protocol was as follows: 95 °C for 10 min, 40 cycles at 95 °C for 10 s, 60 °C for 20 s, and 72 °C for 20 s.

Appendix A.3

Routine respiratory oxygen consumption (rMO2) was measured in a closed-system respirometer. Briefly, the respirometer consisted of a thermostatic Plexiglas chamber with a volume of 125 mL. An oxygen microelectrode (HQ1130) was inserted through the chamber lid to continuously monitor the dissolved oxygen concentration (DO) in the water. For the measurements, five zebrafish were randomly selected from each experimental group and transferred from their respective culture systems into individual Plexiglas chambers. After acclimatization, the chambers were sealed, and the rate of DO decline was recorded. This rate of DO decline was subsequently converted into an oxygen consumption rate, expressed in mg O2/h, by taking into account both the volume of the chamber and the duration of the measurement. The DO level was not allowed to fall more than 15% in the Plexiglas chambers during the experimental period.
Table A1. Primer sequences used in qPCR assay.
Target GeneAccession No.Primer Sequences (from 5′ to 3′)Amplification Efficiency (%)
ae1NM_198338F: GGAGGACTTCTTGCGGATAAG108.4
R: CCTATGACGAGAACTGGTTGAG
nbc1XM_009295136F: AGGAAACAGCCAGATGGATAAA109.9
R: GAAGAGCGAGTGCAGAGAAA
nhe1NM_001113480F: GGTCCTGTATCACCTGTTTGAG109.4
R: CCACAGACACCACGAAGAAA
nkaNM_131686F: TGTGCTTTCTGCTGTCGTGA102.9
R: ATAACCAAGGCTTGCTGGGG
nhe3bNM_001113479.1F: TCACTGTCATTCTGCAGGGTA97.9
R: GGGTCAGATCGGACTGCG
nkccXM_021467734F: CTGCGAGAGGGACTTGATATTT92.6
R: CTCCATCCGAGTCTTTGCTTAT
ndufs1NM_001007765.1F: GAAGATGTCCTTACGCGTGT101.8
R: TTCAGCAGGTCCTTCAGAGC
mtnd5NP_059341F: TTCAGCAGGTCCTTCAGAGC110
R: AGATGGGAGGTGGTTATTGC
mtcybNP_059343F: TAGACAATGCAACCCTTACA101.4
R: CGGTTTCATGGAGAAATAGC
uqcrqNM_001002495.3F: ATTTGTGGATTCGATTTAGG104.4
R: ATGATTGCCCCATGTGTAGG
atp5f1bNM_001024429.2F: CTCAATGCCCTGGAAGTAGC108.3
R: GAACCTTCTGACCACGAACC
mtatp8NP_059335F: ATGCCTCAGCTTAATCCAAAA109.9
R: ATCAACTTGAGTTGGGTCATTAG
gapdhNM_001115114F:CTGGTGACCCGTGCTGCTT98.1
R: TTTGCCGCCTTCTGCCTTA
fasnXM_009306806F: GAGAAAGCTTGCCAAACAGG90.7
R: GAGGGTCTTGCAGGAGACAG
acacaNM_001271308F: GGACGGACCCTTGCACAATA108.4
R: CCTCTGCAGGTCGATACGTC
atglXM_005174256F: ACACACTTACACCGCGTGAT108.8
R: AGCACGTTTTCTCCATCCGT
hslaNM_001316725F: AGGTAAGCAAAGGTTGTCCGA102.9
R: TTCATGACCCCCAACAGACG
cpt1aaNM_001044854F: TCTACCTGAGAGGTCGTGGG89.9
R: TGACGTTTCCTGCTCTTGCT
Table A2. The water quality parameters in the preliminary experiment within 24 h.
GroupTimepHDissolved Oxygen
(mg/L)
Temperature
(°C)
Nitrite
(mg/L)
CO2
(mg/L)
HCO3 Content
(mg/L)
Control12 h7.85 ± 0.086.61 ± 0.4825.5 ± 0.170.01 ± 01.02 ± 0.06166.79 ± 0.94
Nitrite12 h7.78 ± 0.066.89 ± 0.0225.57 ± 0.251.88 ± 0.031.02 ± 0.03166.38 ± 2.54
Nitrite-2.5 CO212 h7.59 ± 0.046.91 ± 0.0625.60 ± 0.101.88 ± 0.012.18 ± 0.07170.86 ± 1.22
Nitrite-5 CO212 h7.43 ± 0.046.66 ± 0.1325.37 ± 0.061.9 ± 0.014.47 ± 0.11183.47 ± 1.27
Nitrite-10 CO212 h7.10 ± 0.056.53 ± 0.1125.50 ± 0.261.91 ± 0.038.54 ± 0.07201.16 ± 5.12
Control24 h7.79 ± 0.055.84 ± 0.0625.58 ± 0.070.01 ± 01.07 ± 0.01167.4 ± 0.94
Nitrite24 h7.80 ± 0.055.79 ± 0.1225.33 ± 0.061.78 ± 0.031.00 ± 0.03166.58 ± 1.06
Nitrite-2.5 CO224 h7.62 ± 0.085.94 ± 0.1225.53 ± 0.121.81 ± 0.021.77 ± 0.10173.5 ± 3.13
Nitrite-5 CO224 h7.39 ± 0.035.88 ± 0.1425.40 ± 0.101.83 ± 0.013.30 ± 0.10183.67 ± 2.20
Nitrite-10 CO224 h7.01 ± 0.055.69 ± 0.1825.37 ± 0.061.85 ± 0.036.06 ± 0.15202.18 ± 3.07

Appendix B

Figure A1. Carbon dioxide and nitrite concentrations for 28 days of the experiment.
Fishes 10 00205 g0a1
Figure A2. Effects of nitrite co-treatment with varying levels of CO2 on rMO2 at 14 days (A) and 28 days (B) of exposure. For all bar plots shown, data are expressed as mean ± SEM of triplicates. Among treatments, significant differences at p < 0.05 are indicated by different letters above bars.
Fishes 10 00205 g0a2

References

  1. FAO. The State of World Fisheries and Aquaculture 2018-Meeting the Sustainable Development Goals; Food and Agriculture Organization of the United Nations: Rome, Italy, 2018. [Google Scholar]
  2. Manan, H.; Zhong, J.M.H.; Kasan, N.A.; Suratman, S.; Ikhwanuddin, M. Carbon dioxide flux from intensive aquaculture shrimp farming applying biofloc system of Setiu Terengganu, Malaysia. Aquaculture 2019, 509, 52–58. [Google Scholar] [CrossRef]
  3. Grosell, M.; Jensen, F.B. Uptake and effects of nitrite in the marine teleost fish Platichthys flesus. Aquat. Toxicol. 2000, 50, 97–107. [Google Scholar] [CrossRef]
  4. Jensen, F.B. Nitrite disrupts multiple physiological functions in aquatic animals. Comp. Biochem. Physiol. Part A Mol. Integr. Physiol. 2003, 135, 9–24. [Google Scholar] [CrossRef] [PubMed]
  5. Ha, N.T.K.; Huong, D.T.T.; Phuong, N.T.; Bayley, M.; Jensen, F.B. Impact and tissue metabolism of nitrite at two acclimation temperatures in striped catfish (Pangasianodon hypophthalmus). Aquat. Toxicol. 2019, 212, 154–161. [Google Scholar] [CrossRef]
  6. Yang, L.P.; Guo, H.H.; Kuang, Y.; Yang, H.; Zhang, X.; Tang, R.; Li, D.P.; Li, L. Neurotoxicity induced by combined exposure of microcystin-LR and nitrite in male zebrafish (Danio rerio): Effects of oxidant-antioxidant system and neurotransmitter system. Comp. Biochem. Physiol. C Toxicol. Pharmacol. 2021, 253, 109248. [Google Scholar] [CrossRef]
  7. Huong, D.T.T.; Gam, L.T.H.; Lek, S.; Ut, V.N.; Phuong, N.T. Effects of nitrite at different temperatures on physiological parameters and growth in clown knifefish (Chitala ornata, Gray 1831). Aquaculture 2020, 521, 735060. [Google Scholar] [CrossRef]
  8. Zhang, M.Z.; Yin, X.L.; Li, M.; Wang, R.X.; Qian, Y.X.; Hong, M.L. Effect of nitrite exposure on haematological status, oxidative stress, immune response and apoptosis in yellow catfish (Pelteobagrus fulvidraco). Comp. Biochem. Physiol. C Toxicol. Pharmacol. 2020, 238, 108867. [Google Scholar] [CrossRef]
  9. Yang, H.; Ou-Yang, K.; He, Y.; Wang, X.Y.; Wang, L.M.; Yang, Q.; Li, D.P.; Li, L. Nitrite induces hepatic glucose and lipid metabolism disorders in zebrafish through mitochondrial dysfunction and ERs response. Aquat. Toxicol. 2024, 273, 107015. [Google Scholar] [CrossRef] [PubMed]
  10. Cheng, C.H.; Su, Y.L.; Ma, H.L.; Deng, Y.Q.; Feng, J.; Chen, X.L.; Jie, Y.K.; Guo, Z.X. Effect of nitrite exposure on oxidative stress, DNA damage and apoptosis in mud crab (Scylla paramamosain). Chemosphere 2019, 239, 124668. [Google Scholar] [CrossRef]
  11. Gao, X.Q.; Fei, F.; Huo, H.H.; Huang, B.; Meng, X.S.; Zhang, T.; Liu, B.L. Effect of acute exposure to nitrite on physiological parameters, oxidative stress, and apoptosis in Takifugu rubripes. Ecotoxicol. Environ. Saf. 2019, 188, 109878. [Google Scholar] [CrossRef]
  12. Ministry of Agriculture and Rural Affairs of the People’s Republic of China. Water Quality Standard for Fisheries (GB 11607-89). National Environmental Protection Agency, Beijing. 1989. Available online: https://www.mee.gov.cn/ywgz/fgbz/bz/bzwb/shjbh/shjzlbz/199003/t19900301_66502.shtml (accessed on 14 April 2025).
  13. Buřič, M.; Blahovec, J.; Kouřil, J. Feasibility of open recirculating system in temperate climate—A case study. Aquac. Res. 2016, 47, 1156–1167. [Google Scholar] [CrossRef]
  14. Kamstra, A.; Span, J.; Weerd, J.V. The acute toxicity and sublethal effects of nitrite on growth and feed utilization of European eel, Anguilla (L.). Aquac. Res. 1996, 27, 903–911. [Google Scholar] [CrossRef]
  15. Tacon, A.; Cody, J.; Conquest, L.; Divakaran, S.; Forster, I.; Decamp, O. Effect of culture system on the nutrition and growth performance of Pacific white shrimp Litopenaeus vannamei (Boone) fed different diets. Aquac. Nutr. 2002, 8, 121–137. [Google Scholar] [CrossRef]
  16. Yang, P.; Lai, D.F.; Yang, H.; Tong, C. Carbon dioxide dynamics from sediment, sediment-water interface and overlying water in the aquaculture shrimp ponds in subtropical estuaries, southeast China. J. Environ. Manag. 2019, 236, 224–235. [Google Scholar] [CrossRef] [PubMed]
  17. Gorle, J.M.R.; Terjesen, B.F.; Mota, V.C.; Summerfelt, S. Water velocity in commercial RAS culture tanks for Atlantic salmon smolt production. Aquac. Eng. 2018, 81, 89–100. [Google Scholar] [CrossRef]
  18. Summerfelt, S.; Bebak-Williams, J.; Tsukuda, S. Controlled systems: Water reuse and recirculation. Fish Hatch. Manag. 2001, 40, 285–395. [Google Scholar]
  19. Foucreau, N.; Cottin, D.; Piscart, C.; Hervant, F. Physiological and metabolic responses to rising temperature in Gammarus pulex (Crustacea) populations living under continental or Mediterranean climates. Comp. Biochem. Physiol. Part A Mol. Integr. Physiol. 2014, 168, 69–75. [Google Scholar] [CrossRef]
  20. Sundin, J.; Jutfelt, F. Effects of elevated carbon dioxide on male and female behavioral lateralization in a temperate goby. Roy. Soc. Open. Sci. 2018, 5, 171550. [Google Scholar] [CrossRef]
  21. Nasuchon, N.; Yagi, M.; Kawabata, Y.; Gao, K.; Ishimatsu, A. Escape responses of the Japanese anchovy Engraulis japonicus under elevated temperature and CO2 conditions. Fish Sci. 2016, 82, 435–444. [Google Scholar] [CrossRef]
  22. Guo, T.; Wang, Y.F.; Li, J.Y.; Guo, X.Y.; Xu, S.H.; Han, H.W.; Yu, J.C.; Li, J.; Liu, Q. Accumulated CO2 affects growth, acid-base regulation and ion balance of turbot (Scophthalmus maximus) in a recirculating aquaculture system. Aquaculture 2023, 578, 740070. [Google Scholar] [CrossRef]
  23. Mota, V.C.; Nilsen, T.O.; Gerwins, J.; Gallo, M.; Ytteborg, E.; Baeverfjord, G.; Kolarevic, J.; Summerfelt, S.T.; Terjesen, B.F. The effects of carbon dioxide on growth performance, welfare, and health of Atlantic salmon post-smolt (Salmo salar) in recirculating aquaculture systems. Aquaculture 2019, 498, 578–586. [Google Scholar] [CrossRef]
  24. Sadoul, B.; Friggens, N.; Valotaire, C.; Labbé, L.; Colson, V.; Prunet, P.; Leguen, I. Physiological and behavioral flexibility to an acute CO2 challenge, within and between genotypes in rainbow trout. Comp. Biochem. Physiol. Part A Mol. Integr. Physiol. 2017, 209, 25–33. [Google Scholar] [CrossRef] [PubMed]
  25. Evans, D.H.; Piermarini, P.M.; Choe, K.P. The multifunctional fish gill: Dominant site of gas exchange, osmoregulation, acid-base regulation, and excretion of nitrogenous waste. Physiol. Rev. 2005, 85, 97–177. [Google Scholar] [CrossRef]
  26. Perry, S.; Gilmour, K. Acid–base balance and CO2 excretion in fish: Unanswered questions and emerging models. Respir. Physiol. Neurobiol. 2006, 154, 199–215. [Google Scholar] [CrossRef] [PubMed]
  27. Hwang, P.P. Ion uptake and acid secretion in zebrafish (Danio rerio). J. Exp. Biol. 2009, 212, 1745–1752. [Google Scholar] [CrossRef]
  28. Sundin, J.; Morgan, R.; Finnøen, M.H.; Dey, A.; Sarkar, K.; Jutfelt, F. On the observation of wild zebrafish (Danio rerio) in India. Zebrafish 2019, 16, 546–553. [Google Scholar] [CrossRef]
  29. Tarafder, P.K.; Rathore, D. Spectrophotometric determination of nitrite in water. Analyst 1988, 113, 1073–1076. [Google Scholar] [CrossRef]
  30. Guo, H.H.; Lin, W.; Wu, X.Y.; Wang, L.K.; Zhang, D.D.; Li, L.; Li, D.P.; Tang, R.; Yang, L.P.; Qiu, Y.M. Survival strategies of Wuchang bream (Megalobrama amblycephala) juveniles for chronic ammonia exposure: Antioxidant defense and the synthesis of urea and glutamine. Comp. Biochem. Physiol. C Toxicol. Pharmacol. 2020, 230, 108707. [Google Scholar] [CrossRef]
  31. Ni, H.; Peng, L.; Gao, X.; Ji, H.; Ma, J.Y.; Li, Y.; Jiang, S. Effects of medermycin on adult zebrafish (Danio rerio): Acute toxicity, tissue damage and oxidative stress. Ecotoxicol. Environ. Saf. 2019, 168, 249–259. [Google Scholar] [CrossRef]
  32. Gam, L.T.H.; Jensen, F.B.; Huong, D.T.T.; Phuong, N.T.; Bayley, M. The effects of elevated environmental CO2 on nitrite uptake in the air-breathing clown knifefish, Chitala ornata. Aquatic. Toxicol. 2018, 196, 124–131. [Google Scholar] [CrossRef]
  33. Kocour Kroupová, H.; Valentová, O.; Svobodová, Z.; Šauer, P.; Máchová, J. Toxic effects of nitrite on freshwater organisms: A review. Rev. Aquac. 2016, 10, 525–542. [Google Scholar] [CrossRef]
  34. Matsche, M.A.; Markin, E.L.; Donaldson, E.M.; Hengst, A.M.; Lazur, A. Effect of chloride on nitrite-induced methemoglobinemia in Atlantic sturgeon, Acipenser oxyrinchus (Mitchill). J. Fish Dis. 2012, 35, 873–885. [Google Scholar] [CrossRef]
  35. Jensen, F.B.; Koldkjær, P.; Bach, A. Anion uptake and acid-base and ionic effects during isolated and combined exposure to hypercapnia and nitrite in the freshwater crayfish, Astacus. J. Comp. Physiol. B 2000, 170, 489–495. [Google Scholar] [CrossRef]
  36. Gattinoni, L.; Pesenti, A.; Matthay, M.A. Understanding blood gas analysis. Intensive Care Med. 2017, 44, 91–93. [Google Scholar] [CrossRef] [PubMed]
  37. Hvas, M.; Damsgaard, C.D.; Gam, L.T.H.; Huong, D.T.T.; Jensen, F.B.; Bayley, M. The effect of environmental hypercapnia and size on nitrite toxicity in the striped catfish (Pangasianodon hypophthalmus). Aquat. Toxicol. 2016, 176, 151–160. [Google Scholar] [CrossRef] [PubMed]
  38. Cheng, S.Y.; Shieh, L.W.; Chen, J.C. Changes in hemolymph oxyhemocyanin, acid-base balance, and electrolytes in Marsupenaeus japonicus under combined ammonia and nitrite stress. Aquat. Toxicol. 2013, 130, 132–138. [Google Scholar] [CrossRef]
  39. Lin, Y.; Miao, L.H.; Pan, W.J.; Huang, X.; Dengu, J.M.; Zhang, W.X.; Ge, X.P.; Liu, B.; Ren, M.C.; Zhou, Q.L.; et al. Effect of nitrite exposure on the antioxidant enzymes and glutathione system in the liver of bighead carp, Aristichthys nobilis. Fish Shellfish Immunol. 2018, 76, 126–132. [Google Scholar] [CrossRef]
  40. Shen, C.; Cao, S.; Mohsen, M.; Li, X.S.; Wang, L.; Lu, K.L.; Zhang, C.X.; Song, K. Effects of chronic nitrite exposure on hematological parameters, oxidative stress and apoptosis in spotted seabass (Lateolabrax maculatus) reared at high temperature. Aquac. Rep. 2024, 35, 102022. [Google Scholar] [CrossRef]
  41. Guimaraes, D.A.; Portella, R.d.L.; Kamga, P.C.; Tanus-Santos, J.E.; Shiva, S.S. Nitrite Modulates Mitochondrial Function Through PKA Activation and AKAP121 Expression Under Normoxia. Free Radic. Biol. Med. 2015, 87, S77–S78. [Google Scholar] [CrossRef]
  42. Schopfer, F.J.; Riobo, N.A.; Carreras, M.C.; Alvarez, B.; Radi, R.; Boveris, A.; Cadenas, E.; Poderoso, J.J. Oxidation of ubiquinol by peroxynitrite: Implications for protection of mitochondria against nitrosative damage. Biochem. J. 2000, 349, 35–42. [Google Scholar] [CrossRef]
  43. Gupta, K.J.; Lee, C.P.; Lee, C.P.; Ratcliffe, R.G. Nitrite protects mitochondrial structure and function under hypoxia. Plant Cell Physiol. 2016, 58, 175–183. [Google Scholar] [CrossRef] [PubMed]
  44. Zhang, M.Z.; Li, M.; Wang, R.X.; Qian, Y.X. Effects of acute ammonia toxicity on oxidative stress, immune response and apoptosis of juvenile yellow catfish Pelteobagrus fulvidraco and the mitigation of exogenous taurine. Fish Shellfish Immunol. 2018, 79, 313–320. [Google Scholar] [CrossRef] [PubMed]
  45. Jia, R.; Han, C.; Lei, J.L.; Liu, B.L.; Huang, B.; Huo, H.H.; Yin, S.T. Effects of nitrite exposure on haematological parameters, oxidative stress and apoptosis in juvenile turbot (Scophthalmus maximus). Aquatic. Toxicol. 2015, 169, 1–9. [Google Scholar] [CrossRef]
  46. Pflaum, R.; Howick, L.C. Spectrophotometric Determination of Potassium with Sodium Tetraphenylborate. Anal. Chem. 1956, 28, 1542–1544. [Google Scholar] [CrossRef]
  47. Johnson, T.B.; Douglass, I.B. The action of chlorine on thiocyanates. J. Am. Chem. Soc. 1939, 61, 2548–2550. [Google Scholar] [CrossRef]
  48. Kumar, A.; Chapoteau, E.; Czech, B.; Gebauer, C.; Chimenti, M.; Raimondo, O. Chromogenic ionophore-based methods for spectrophotometric assay of sodium and potassium in serum and plasma. Clin. Chem. 1988, 34, 1709–1712. [Google Scholar] [CrossRef]
  49. Nägele, U.; Hägele, E.; Sauer, G.; Wiedemann, E.; Lehmann, P.; Wahlefeld, A.; Gruber, W. Reagent for the enzymatic determination of serum total triglycerides with improved lipolytic efficiency. Clin. Chem. Lab. Med. 1984, 22, 165–174. [Google Scholar] [CrossRef]
  50. Janero, D.R. Malondialdehyde and thiobarbituric acid-reactivity as diagnostic indices of lipid peroxidation and peroxidative tissue injury. Free Radic. Biol. Med. 1990, 9, 515–540. [Google Scholar] [CrossRef]
  51. Peskin, A.V.; Winterbourn, C.C. A microtiter plate assay for superoxide dismutase using a water-soluble tetrazolium salt (WST-1). Clin. Chim. Acta 2000, 293, 157–166. [Google Scholar] [CrossRef]
  52. Aebi, H. [13] Catalase in vitro. Meth. Enzymol. 1984, 105, 121–126. [Google Scholar] [CrossRef]
  53. Nørby, J.G. [11] Coupled assay of Na+-K+-ATPase activity. Meth. Enzymol. 1988, 156, 116–119. [Google Scholar] [CrossRef]
  54. Chen, Z.; Sun, C. Contect of ATP in RBC detect by CPK. J. Pract. Med. Tech. 2002, 12, 908–909. Available online: https://kns.cnki.net/kcms2/article/abstract?v=EKYfHJ8l29jp96NxBk2yeai3-uQbS3ebhgfLeaD1yxXHUmGV7ZA3xQeOyJ90sXLP5goepa4Bkvm27jRBw_zAA6a_yTiuXxFgf68c0sTnz-64aZ6DEZk1sFQrfwF1FUwd9hobG3LSCqvi5oCxXmOFsSDSbTGS_eZjotWuPb39I4Yt0qpgSnXTzJApY7aMXGB1&uniplatform=NZKPT&language=CHS (accessed on 14 April 2025).
  55. Chan, K.M.; Delfert, D.; Junger, K. A direct colorimetric assay for Ca2+-stimulated ATPase activity. Anal. Biochem. 1986, 157, 375–380. [Google Scholar] [CrossRef]
  56. Narayana, B.; Sunil, K. A spectrophotometric method for the determination of nitrite and nitrate. Eur. J. Ageing Cancer 2009, 4, 204–214. [Google Scholar]
  57. Wind, T.C.; Messenger, M.P.; Thompson, D.; Selby, P.J.; Banks, R.E. Measuring carbonic anhydrase IX as a hypoxia biomarker: Differences in concentrations in serum and plasma using a commercial enzyme-linked immunosorbent assay due to influences of metal ions. Ann. Clin. Biochem. 2011, 48, 112–120. [Google Scholar] [CrossRef]
  58. Rahman, I.; Kode, A.; Biswas, S.K. Assay for quantitative determination of glutathione and glutathione disulfide levels using enzymatic recycling method. Nat. Protoc. 2006, 1, 3159–3165. [Google Scholar] [CrossRef]
  59. Bradford, M.M. A rapid and sensitive method for the quantitation of microgram quantities of protein utilizing the principle of protein-dye binding. Anal. Biochem. 1976, 72, 248–254. [Google Scholar] [CrossRef]
Figure 1. Schematic diagram of the experimental recirculating aquaculture system.
Fishes 10 00205 g001
Figure 2. Nitrite accumulation in gills (A) and liver tissues (B) of zebrafish after exposure to nitrite and carbon dioxide. For all the bar plots shown, the data are expressed as the mean ± SEM of triplicates. Among the treatments, significant differences at p < 0.05 are indicated by different letters above the bars at the same exposure duration. Between the 14-day exposure and 28-day exposure periods, asterisks indicate significant differences at p < 0.05 (*).
Fishes 10 00205 g002
Figure 3. The effects of nitrite co-treatment with varying CO2 concentrations on hemoglobin (A) and methemoglobin (B) in zebrafish blood. For all the bar plots shown, the data are expressed as the mean ± SEM of triplicates. Significant differences at p < 0.05 are indicated by different letters above the bars among treatments.
Fishes 10 00205 g003
Figure 4. The effects of nitrite co-treatment with varying CO2 concentrations on gill structure in zebrafish. Black arrows, vacuolization; red arrows, epithelial rupture; green arrows, capillary dilation; purple arrows, atrophy of gill lamellae.
Fishes 10 00205 g004
Figure 5. The effects of nitrite co-treatment with varying CO2 concentrations on ion transport in zebrafish gills. (AC) Levels of [Cl], [Na+], and [K+], respectively. (DG) Key enzyme activities related with ion transport, including CA, Na+-K+-ATPase, and ATPase, as well as ATP content. (H,I) Expression of ion transport-related genes at 14 d and 28 d. For all bar plots shown, data are expressed as mean ± SEM of triplicates. Among treatments, significant differences at p < 0.05 are indicated by different letters above bars at same exposure duration. Between 14-day and 28-day exposure periods, asterisks indicate significant differences at p < 0.05 (*) or p < 0.01 (**).
Fishes 10 00205 g005
Figure 6. H&E staining of zebrafish liver tissues following exposure to nitrite and varying CO2 concentrations. Black arrows indicate vacuolization, red arrows indicate pyknotic nuclei, and green arrows indicate nuclear degeneration.
Fishes 10 00205 g006
Figure 7. Effects of nitrite co-treatment with varying levels of CO2 on oxidative-antioxidant parameters MDA (A), SOD (B), CAT (C), and GSH (D) in zebrafish liver. For all bar plots shown, data are expressed as mean ± SEM of triplicates. Among treatments, significant differences at p < 0.05 are indicated by different letters above bars at same exposure duration. Between 14-day and 28-day exposure periods, asterisks indicate significant differences at p < 0.05 (*), p < 0.01 (**), or p < 0.001 (***).
Fishes 10 00205 g007
Figure 8. The effects of nitrite co-treatment with varying levels of CO2 on the expression of genes related to the mitochondrial respiratory chain in zebrafish liver at 14 days (A) and 28 d (B) post-exposure. For all the bar plots shown, data are expressed as the mean ± SEM of triplicates. Significant differences at p < 0.05 are indicated by different letters above bars among treatments.
Fishes 10 00205 g008
Figure 9. The effects of nitrite co-treatment with varying levels of CO2 on TG (A), TC (B), and the expression of lipid metabolism-related genes in zebrafish liver at 14 days (C) and 28 days (D) of exposure. For all the bar plots shown, data are expressed as the mean ± SEM of triplicates. Among treatments, significant differences at p < 0.05 are indicated by different letters above bars. Between the 14-day and 28-day exposure periods, asterisks indicate significant differences at p < 0.01 (**).
Fishes 10 00205 g009
Figure 10. A graphical hypothetical summary illustrating how an increased CO2 concentration mitigates the impact of nitrite on zebrafish. Abbreviation: TG, triglyceride; TC, total cholesterol; FFA, free fatty acid; Acetyl CoA, Acetyl Coenzyme A; Malonyl CoA, Malonyl Coenzyme A.
Fishes 10 00205 g010
Table 1. pH, temperature, and dissolved oxygen during the experiment.
GroupTimepHDissolved Oxygen (mg/L)Temperature (°C)
Control1–14th day7.85 ± 0.037.93 ± 0.1125.55 ± 0.19
Nitrite1–14th day7.79 ± 0.047.93 ± 0.0625.58 ± 0.19
Nitrite-2.5 CO21–14th day7.62 ± 0.037.79 ± 0.1025.50 ± 0.12
Nitrite-5 CO21–14th day7.43 ± 0.057.68 ± 0.1225.50 ± 0.18
Nitrite-10 CO21–14th day7.02 ± 0.047.60 ± 0.1825.40 ± 0.08
Control15–28th day7.82 ± 0.028.06 ± 0.0525.51 ± 0.19
Nitrite15–28th day7.78 ± 0.028.02 ± 0.0325.35 ± 0.13
Nitrite-2.5 CO215–28th day7.61 ± 0.047.94 ± 0.0625.40 ± 0.14
Nitrite-5 CO215–28th day7.44 ± 0.047.83 ± 0.0725.43 ± 0.10
Nitrite-10 CO215–28th day6.99 ± 0.097.69 ± 0.0725.50 ± 0.12
Table 2. Changes in blood gas indexes of zebrafish exposed to varying CO2 concentrations in the presence of nitrite.
GroupTimepHP CO2
mmHg
P O2
mmHg
c(HCO3)
(mmol/L)
TCO2 (mmol/L)sO2 (%)Glu (mg/dL)
Control (0–0.1 mg/L Nitrite, 0–1 mg/L CO2)14th day6.84 ± 0.14 a11.67 ± 0.90 a28.33 ± 2.52 a1.87 ± 0.12 a7.13 ± 0.35 a47.67 ± 6.66 d22.00 ± 1.00 a
Nitrite (2 mg/L Nitrite, 0–1 mg/L CO2) 6.96 ± 0.07 ab12.67 ± 0.21 ab29.67 ± 2.52 ab2.8 ± 0.17 b8.27 ± 0.15 b27.33 ± 2.08 a45.33 ± 2.08 d
Nitrite (2 mg/L)-CO2 (2.5 mg/L) 7.01 ± 0.01 b13.87 ± 0.64 bc32.67 ± 2.52 bc3.77 ± 0.40 c9.23 ± 0.31 c33.33 ± 2.08 ab35.00 ± 2.65 c
Nitrite (2 mg/L)-CO2 (5 mg/L) 7.07 ± 0.02 bc14.57 ± 0.78 cd35.00 ± 1.00 cd4.83 ± 0.25 d9.90 ± 0.36 c37.33 ± 1.53 bc34.33 ± 1.53 c
Nitrite (2 mg/L)-CO2 (10 mg/L) 7.17 ± 0.04 c15.67 ± 0.64 d37.33 ± 1.53 d5.90 ± 0.36 e12.2 ± 0.60 d43.00 ± 3.61 cd26.67 ± 2.08 b
Control (0–0.1 mg/L Nitrite, 0–1 mg/L CO2)28th day6.83 ± 0.06 a12.27 ± 1.77 a28.33 ± 6.51 a1.93 ± 0.15 a8.27 ± 0.40 a49.00 ± 4.00 c26.33 ± 4.16 a
Nitrite (2 mg/L Nitrite, 0–1 mg/L CO2) 6.95 ± 0.05 b13.2 ± 1.56 ab30.33 ± 4.16 ab2.73 ± 0.32 a9.63 ± 0.15 b32.67 ± 3.06 a48.67 ± 2.52 c
Nitrite (2 mg/L)-CO2 (2.5 mg/L) 6.97 ± 0.08 b15.27 ± 0.32 bc35.67 ± 1.15 bc4.30 ± 0.85 b9.87 ± 0.55 b40.67 ± 5.03 b33.33 ± 3.79 b
Nitrite (2 mg/L)-CO2 (5 mg/L) 7.11 ± 0.01 b16.07 ± 0.96 c38.00 ± 0 c5.67 ± 0.23 c12.27 ± 0.59 c45.33 ± 1.15 bc34.67 ± 1.53 b
Nitrite (2 mg/L)-CO2 (10 mg/L) 7.16 ± 0.03 b17.33 ± 0.87 c40.33 ± 2.31 c6.10 ± 0.70 c13.5 ± 0.26 d45.00 ± 2.65 bc31.00 ± 2.65 a
For all the tables shown, the data are expressed as the mean ± SEM of triplicates. Significant differences at p < 0.05 are indicated by different letters among treatments at the same exposure duration.
Disclaimer/Publisher’s Note: The statements, opinions and data contained in all publications are solely those of the individual author(s) and contributor(s) and not of MDPI and/or the editor(s). MDPI and/or the editor(s) disclaim responsibility for any injury to people or property resulting from any ideas, methods, instructions or products referred to in the content.

