Article

Comparing Ecosystem Structure and Function of the Geheyan Reservoir Based on the Ecopath Model After a Fishing Ban

1
Yangtze River Fisheries Research Institute, Chinese Academy of Fishery Sciences, Wuhan 430223, China
2
College of Life Science, Huzhou University, Huzhou 313000, China
*
Author to whom correspondence should be addressed.
These authors contributed equally to this work.
Fishes 2025, 10(4), 168; https://doi.org/10.3390/fishes10040168
Submission received: 31 December 2024 / Revised: 2 April 2025 / Accepted: 7 April 2025 / Published: 9 April 2025
(This article belongs to the Special Issue Adaptation and Response of Fish to Environmental Changes)

Abstract

:
The Geheyan Reservoir, located on the Qingjiang River, a tributary of the Yangtze River, is important for regional water supplies and ecological conservation. Understanding changes in ecosystem structure and function has become critical for assessing efficacy after the implementation of a fishing ban. This study employs the Ecopath model to examine the ecosystem characteristics of the Geheyan Reservoir before (2017) and after (2022) the fishing ban. The results show significant differences in trophic levels, energy transfer efficiency, and ecosystem maturity between the two periods. The trophic levels increased from 3.36 pre-fishing ban to 3.89 post-ban, indicating an enhanced complexity in the food web structure. The highest eco-trophic efficiency for major commercial fish species increased after the ban, indicating improved energy utilization efficiency. However, energy transfer bottlenecks were still observed between trophic levels II and IV, suggesting ongoing challenges in nutrient cycling. The total primary production-to-total respiration ratio (6.93) and the connectivity index (0.25) indicate that the ecosystem’s maturity and stability have improved after the fishing ban. These findings underscore the ban’s effectiveness and provide a scientific foundation for sustainable management of Geheyan Reservoir and similar ecosystems in the Yangtze River Basin.
Key Contribution: Using the Ecopath model, we comprehensively analyzed the Geheyan Reservoir ecosystem, elucidating trophic levels of functional groups, ecological nutrient efficiency, and identifying two primary food chains. The study revealed energy transfer impediments, suboptimal nutrient utilization, and limited ecosystem maturity, providing a critical foundation for future ecological management.

1. Introduction

Reservoir ecosystems constitute a critical component of global freshwater resources, serving multifaceted roles in water supply, agricultural irrigation, hydropower generation, and biodiversity conservation [1,2]. The ecological integrity of these systems hinges on the quality, quantity, and diversity of services they provide, necessitating robust assessment frameworks to address escalating anthropogenic pressures such as overfishing, species introductions, and habitat degradation [3,4].
The Ecopath model, rooted in trophic dynamic theory, has emerged as a cornerstone tool for ecosystem analysis. Originally proposed by Polovina (1984) [5] and later advanced into the Ecopath with Ecosim (EwE) software (version 6.6.8) [6], this mass balance approach quantifies energy transfer and material cycling across trophic levels. By evaluating the impacts of human activities (e.g., fisheries exploitation, nutrient enrichment) and calculating key metrics including trophic level indices, energy conversion efficiency, and energy partitioning between primary producers and detritus [7,8], the model provides a holistic perspective on ecosystem structure and function. Its versatility is evidenced by widespread applications in marine, lacustrine, and reservoir ecosystems, making it indispensable for assessing ecosystem stability and informing management strategies [9,10].
The Geheyan Reservoir, a critical freshwater system on the Qingjiang River, plays a pivotal role in regional hydropower generation, flood control, and ecological balance [11]. In response to escalating biodiversity threats, a comprehensive fishing ban was implemented in August 2017, making Geheyan Reservoir a pioneer in the Yangtze River Basin’s conservation efforts. This initiative preceded broader policy measures: China’s aquatic germplasm conservation zones enacted full fishing closures in 2018, foreshadowing the Ministry of Agriculture’s 10-year fishing moratorium across the Yangtze Basin (effective January 2021) [12]. As an early adopter, Geheyan’s proactive ban (2017–present) offers a unique natural experiment to investigate ecosystem responses to reduced anthropogenic stressors [13]. Ecological modeling can effectively compare ecosystem changes before and after the fishing ban [14,15]. This study uses the Ecopath model to contrast dynamics pre-and post-ban, aiming to reveal recovery trajectories and provide insights for sustainable reservoir management.

2. Materials and Methods

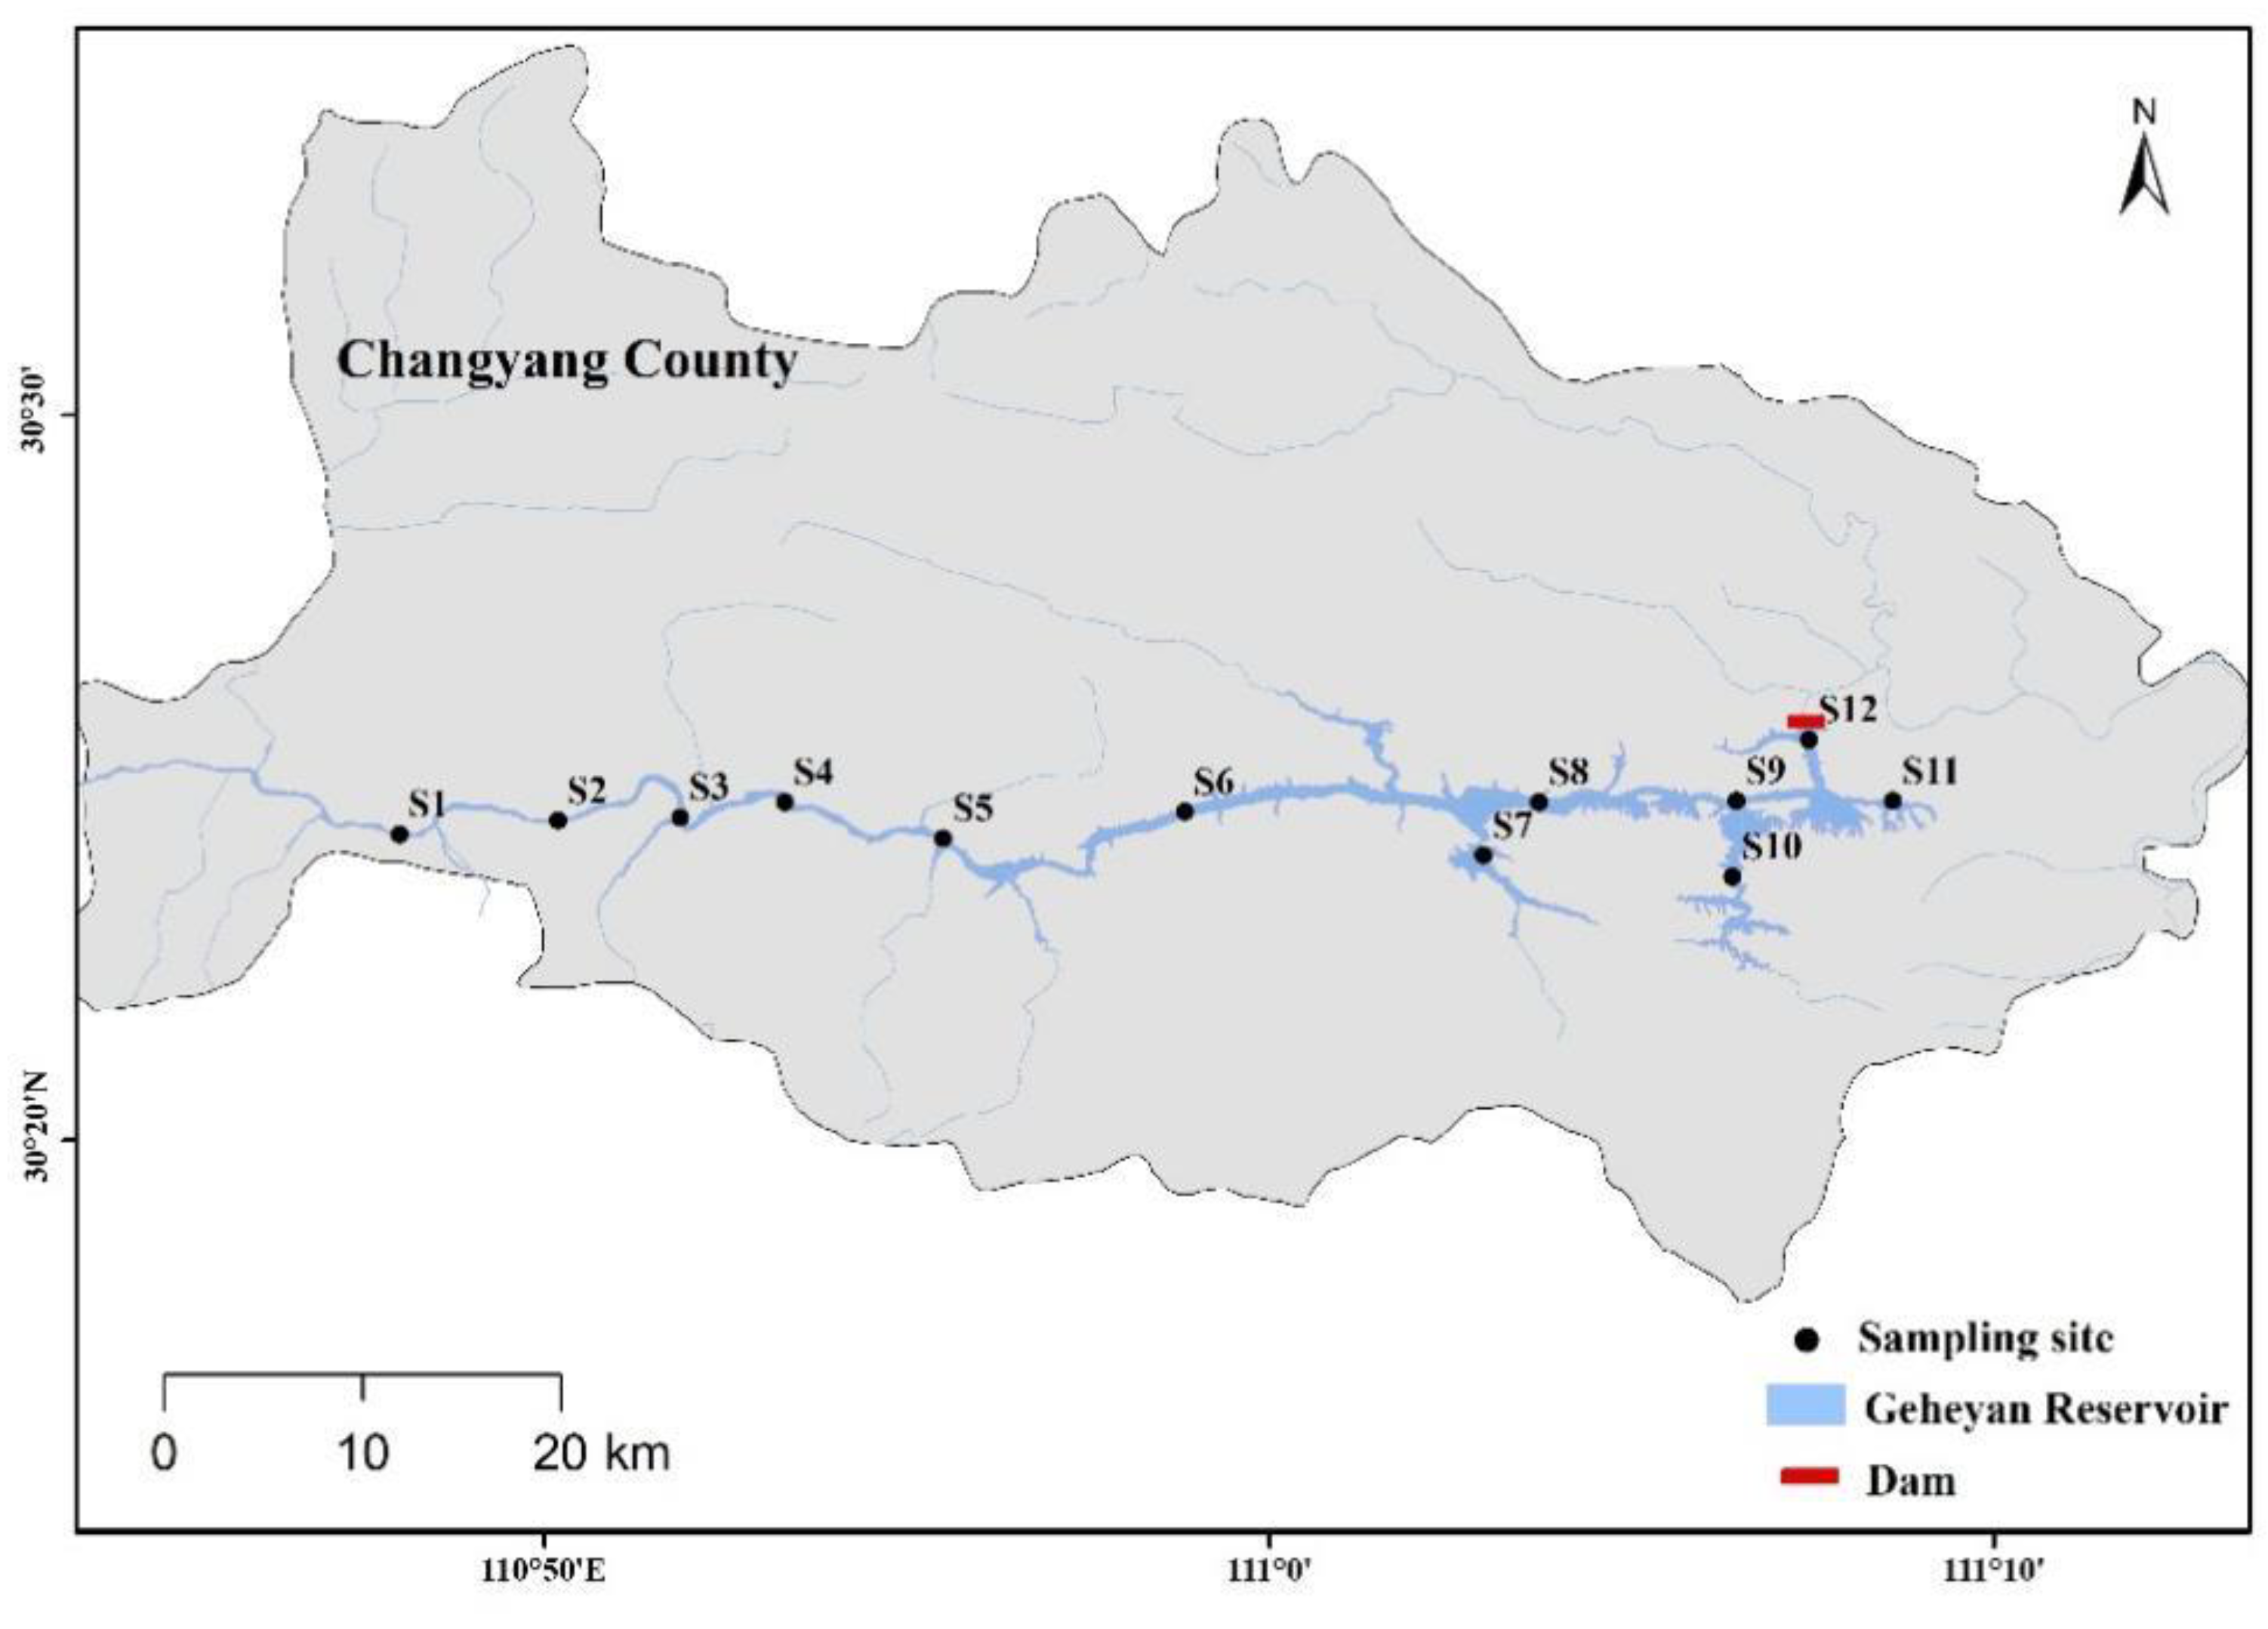
2.1. Study Area and Sampling Procedure

The Geheyan Reservoir is located on the Qingjiang River, which is a major tributary of the Yangtze River, with a water depth of 52.1 m, and a surface area around 72.12 km2 [11].
In the autumn of 2022, we conducted sampling at 12 stations distributed throughout the Geheyan Reservoir (Figure 1). At each site, fish, phytoplankton, zooplankton, zoobenthos, and water quality were quantitatively sampled. Among them, the fish were collected using three-layer composite gillnets. Each gillnet measured 30 m in total length and 5 m in total height, which consisted of 12 panels (2.5 m each) with different mesh sizes (10, 16, 20, 25, 31, 39, 48, 58, 70, 86, 110, and 125 mm, stretched), and all specimens were measured for body length (0.1 mm) and weighed for body weight (0.01 g). The phytoplankton and zooplankton were collected using the 25th (mesh 0.064 mm) and 13th (mesh 0.112 mm) plankton nets (a total length of 50 cm and an aperture diameter of 20 cm), respectively, and their biomass (mg/L) was calculated using conventional methods. The zoobenthos were collected using a 1/16 m2 Peterson sampler, weighed after classification and identification, and biomass was calculated. In the fish survey, each sampling site was surveyed over a two-day period to ensure comprehensive data collection, while other aquatic organisms were sampled only once per site. At the end of each site sampling, a hydroacoustic survey was used to assess fish resources in the whole reservoir.

2.2. Modeling Principles

The Ecopath model defines an ecosystem as a set of ecologically linked functional groups, including detritus, plankton and a group of fish species with the same ecological characteristics, all of which essentially cover the whole process of energy flow in the ecosystem, and the linkages between the functional groups adequately reflect the energy cycling process of the whole system. Based on thermodynamic principles, the Ecopath model defines that the energy output and input of each functional group i in the system are in equilibrium: production is equal to the sum of predation mortality, other natural mortality and output; the model defines an ecosystem with a set of linked linear equations, where each linear equation represents a functional group in the system [6]:
B i ( P B ) i E E i j = 1 i B j ( Q B ) j D C j i E X i = 0
In the following text, the variables are defined as follows: B i is the biomass of functional group i, ( P B ) i is the production-to-biomass ratio of functional group i, ( Q B ) j is the consumption-to-biomass ratio, D C j i is the proportion of prey i in the food composition of predator j, and E X i is the output of group i (including catch and migration). The fundamental parameters required for the construction of the Ecopath model are therefore as follows: B i , ( P B ) i , ( Q B ) j , ecological nutrient conversion efficiency E E i , D C j i and E X i . To construct the Ecopath model, at least three out of the four basic parameters B i , ( P B ) i , ( Q B ) j , and E E i need to be manually input into the model. The remaining parameter will be calculated by the model using the other input parameters. In contrast, D C j i and E X i necessitate mandatory input. In order to ensure the effective functioning of the entire system, the value of E E i is typically set to be less than 1.

2.3. Functional Grouping

The concept of a functional group is predicated on the aggregation of species that exhibit ecological or taxonomic similarity. In this study, the principal method of functional grouping was based on the feeding habits, individual size, and growth characteristics of different biological species. Species with significant economic value or ecological functions are designated as a distinct functional group to facilitate analysis and study of the relationships with other functional groups. The inclusion of one or several detritus groups is obligatory in the composition of the functional groups. Detritus is defined as the sum of all inanimate organic matter in an ecosystem, including the carcasses of dead plants and animals, animal feces, and organic matter carried into the water bodies. Detritus exists in the form of dissolved state or solid particles. This ecosystem was divided into 20 functional groups based on the aforementioned principles, covering the entire process of ecosystem structure and energy flow (Table 1).

2.4. Data Sources and Parameter Estimation

2.4.1. Biomass (B)

Biomass (current stock) refers to the total quantity of a species per unit area/volume at a given time, expressed as wet weight (t/km2) in the model. The biomass data for all biotic groups (except shrimp, which referenced prior studies [16]) and detritus inputs were obtained through field surveys (See Supplementary Materials, Table S1).

2.4.2. Production (P) and the P/B Coefficient

Production is the growth of organisms per unit area or volume and is expressed in modeling terms as a measure of t/ (km2·year). The P/B coefficient, often referred to as the biomass turnover rate, expresses the proportionality between annual production and average annual biomass. It is expressed in inverse years (1/year). It is derived using the formulae built into the Ecopath model. The formula is calculated as follows [6]:
B = Y/F
F = Z − M
Z   =   P / B   =   K ×   ( L     L ¯ ) / ( L ¯     L )
where B is biomass, F is fishing mortality, Y is catch, Z is total mortality, M is natural mortality, P is production, K is a parameter of Von Bertalanffy’s growth equation, L is asymptotic body length (cm), derived from the records in FishBase, L ¯ is average body length (cm), and L is open catch body length (cm). Fish natural mortality rates were determined by empirical equations [17]:
log M = 0.0066 0.279 × log L + 0.6543 × log K + 0.4634 × log T
The mean water temperature (T) during the study period was 27.36 °C.
The P/B coefficient of shrimp was estimated according to the Ecopath model, which was 3.092 [10]. The P/B of zoobenthos was calculated with EE set at 0.9 [18]. According to the international common method, the zooplankton functional group gross production efficiency (P/Q) was all 0.05, and the zooplankton production (P) was converted according to the empirical formula of the regression relationship between the production and the biomass (B), P = 9.097B1.237 [19], which led to the estimation of the P/B coefficient. In the Ecopath model analysis for the Geheyan Reservoir, we utilized daily production-to-biomass (P/B ) ratios to estimate the annual P/B values. Specifically, drawing from the typical range of daily P/B ratios for phytoplankton in lakes and reservoirs across China, which fall between 0.3 and 0.8, we selected a higher daily P/B value based on the trophic characteristics of the Geheyan Reservoir. By multiplying this daily ratio by the number of days in a year (365), we derived the annual P/B coefficient for phytoplankton, resulting in a value of 250. It is important to clarify that the P/B coefficient for aquatic macrophytes, estimated at 1.25, was derived from field surveys and is distinct from that of phytoplankton. This coefficient reflects the biomass turnover rate specific to macrophytes rather than phytoplankton [20].

2.4.3. Q/B Coefficient

Fish Q/B coefficients were calculated using the empirical formula [8]:
log ( Q / B ) = 7.964 0.204 × log W 1.965 × T + 0.083 × A + 0.532 × h + 0.398 × d
where is W the asymptotic body weight (g); T is the water temperature (T = 1000⁄K (K = Water temperature in °C + 273.15 °C)); A is the fish aspect ratio (the faster the movement, the larger the value of A. Generally, 1.32 is used for fish); h is a dummy value describing the dietary nature (1 for herbivory, and 0 for detritus and carnivory), and d is also a dummy value representing the dietary nature (1 for detritus, and 0 for herbivory and carnivory).
The Q/B coefficient of shrimp was estimated according to the model, which was 41.2667 [6]. Based on the empirical value, the P/Q of benthos was about 0.05, and from the formula Q/B = (P/B)/(P/Q), the Q/B of benthos was estimated to be 10. According to the international common method, the zooplankton functional group P/Q was all 0.05, and the zooplankton production (P) was converted according to the empirical formula of the regression relationship between the production and the biomass, which led to the estimation of the Q/B [19].

2.4.4. EE (Ecological Efficiency)

EE is the conversion efficiency of the amount of production within a functional group [18]. In this study, it is considered as an unknown parameter and is derived from other parameters by debugging the model. EE values for rotifers (microzooplankton), branchiopods, and copepods were set at 0.95, 0.95, and 0.95, respectively [21,22].

2.4.5. Detritus

Detritus consists of, among other things, organic matter in the dissolved and particulate states. The carbon biomass of dissolved and particulate organic matter is calculated by empirical equations [23]:
logD = 0.954 × logPP + 0.863 × logE − 2.41
where D is the total carbon biomass of dissolved and particulate organic matter (g C/m2), PP is the primary productivity (gC/(m2·year)), and E is the depth of the true photic layer (m), which is given by E = 2.5 × SD, and SD is the transparency of the water body, and the average transparency of the Geheyan Reservoir is 2.0742 m.
In addition, the unassimilated consumption will go into the detritus fraction in each component. The values of each component were obtained from the literature, generally 0.2 for carnivorous fish, 0.41 for herbivorous fish, 0.94 for aquatic insects, 0.65 for zooplankton, 0.4 for molluscs, and 0.7 for shrimps.

2.4.6. Diet Composition Matrix

The feeding habits of fish, shrimp, and crab, and benthic and zooplankton groups were derived from studies of other similar water bodies such as Hongze Lake [24] and Jingshahe Reservoir [25]. Based on the weight ratios reported in the above studies, the diet matrix for this research was constructed by integrating the fish community structure observed in the current survey (Table A1).

2.5. Debugging and Optimisation of the Model

The Ecopath constructs a steady-state system model, so the energy flow balance of each functional group must be kept in equilibrium [7]; at the same time, the equilibrium process should also consider whether the estimated parameters are in accordance with the objective law or empirical knowledge: (1) Since the ecological trophic efficiency EE = (predation + catch)/production, the sum of the amount of a functional group that has been preyed upon and fished should be greater than 0 and less than its production, so it is necessary to ensure that 0 < EE < 1 first. Functional groups in the system that are subject to high predation and fishing pressure, such as various economic fishes, can have EE values close to 1, while certain underutilized functional groups, such as detritus, macrophytes, and small fishes, usually have low EE values. (2) The P/Q coefficient of a functional group, which indicates the ratio of production to consumption, is generally distributed between 0.1 and 0.3 ecologically, but for some phytophagous functional groups, the value may be less than 0.1. (3) The respiration of each functional group must be greater than 0, and the ratio of respiration to biomass (R/B coefficient) of fishes should be between 1 and 10 [6].
When running the model, if the above conditions are not met, the model fails to reach equilibrium or lacks the necessary biological significance, it is necessary to repeatedly adjust the settings of other input parameters, such as B, P/B, or Q/B, as well as diet composition, within appropriate ranges [9,10].

2.6. Comparing Ecosystem Characteristics Pre-And Post-Ban

For the acquisition of pre-ban fishing data, we referred to the Ecopath model outputs constructed from pre-ban survey data by Huang et al. [20] and compared these with the parameters established from our current survey to explore the potential impacts of the fishing ban on the ecosystem. Additionally, we compared our model parameters with those of other reservoirs to assess the differences in ecosystem metrics between the Geheyan Reservoir and other water bodies.

3. Results

3.1. Model Parameter Output

The Ecopath model’s basic parameters for the Geheyan Reservoir are summarized in Table 2. These parameters include trophic level, biomass, P/B ratio, Q/B ratio, ecological efficiency (EE), and P/Q coefficient.

3.2. Food Web Structure and Trophic Level Analysis

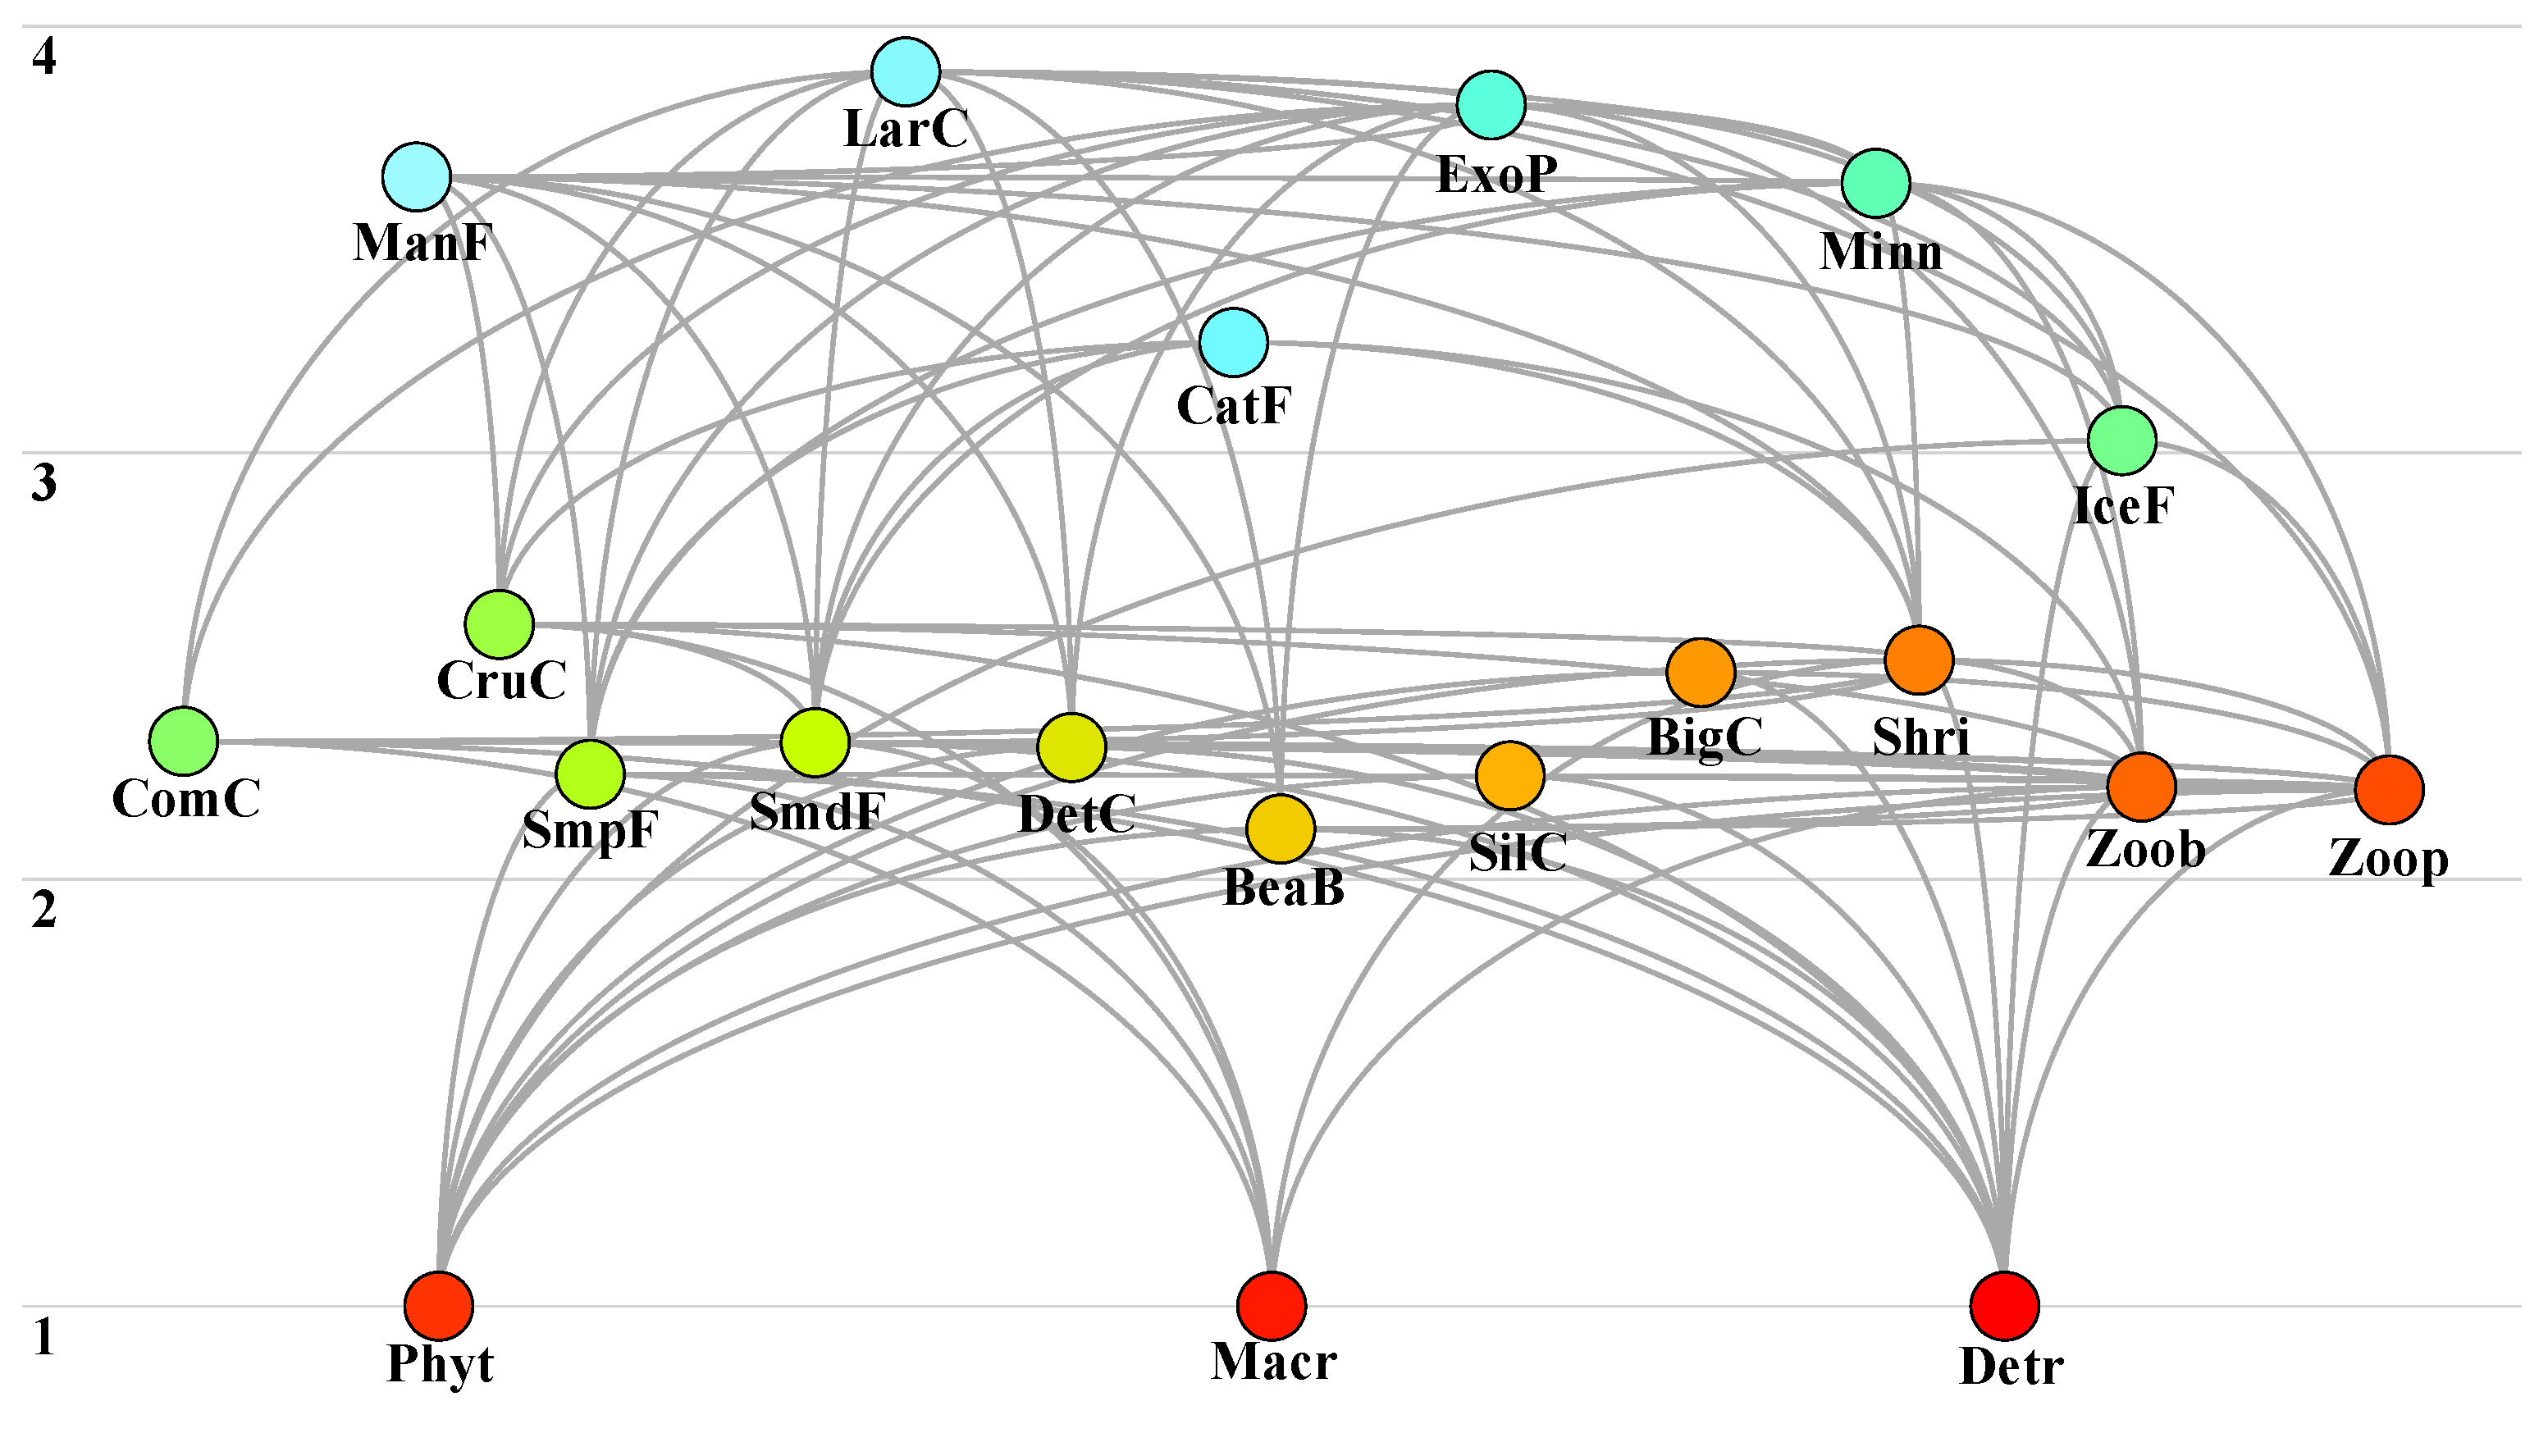
3.2.1. Food Web Structure

Trophic levels in the Geheyan Reservoir ranged from 1.00 to 3.89. Primary producers (phytoplankton and aquatic plants) occupied the lowest trophic levels, while carnivorous fish functional groups exhibited the highest values. The Large Culter functional group had the maximum trophic level (3.89), followed by the Exotic perch (3.82) and the Mandarin fish (3.65). The simplified food web structure and energy flow between functional groups are illustrated in Figure 2.

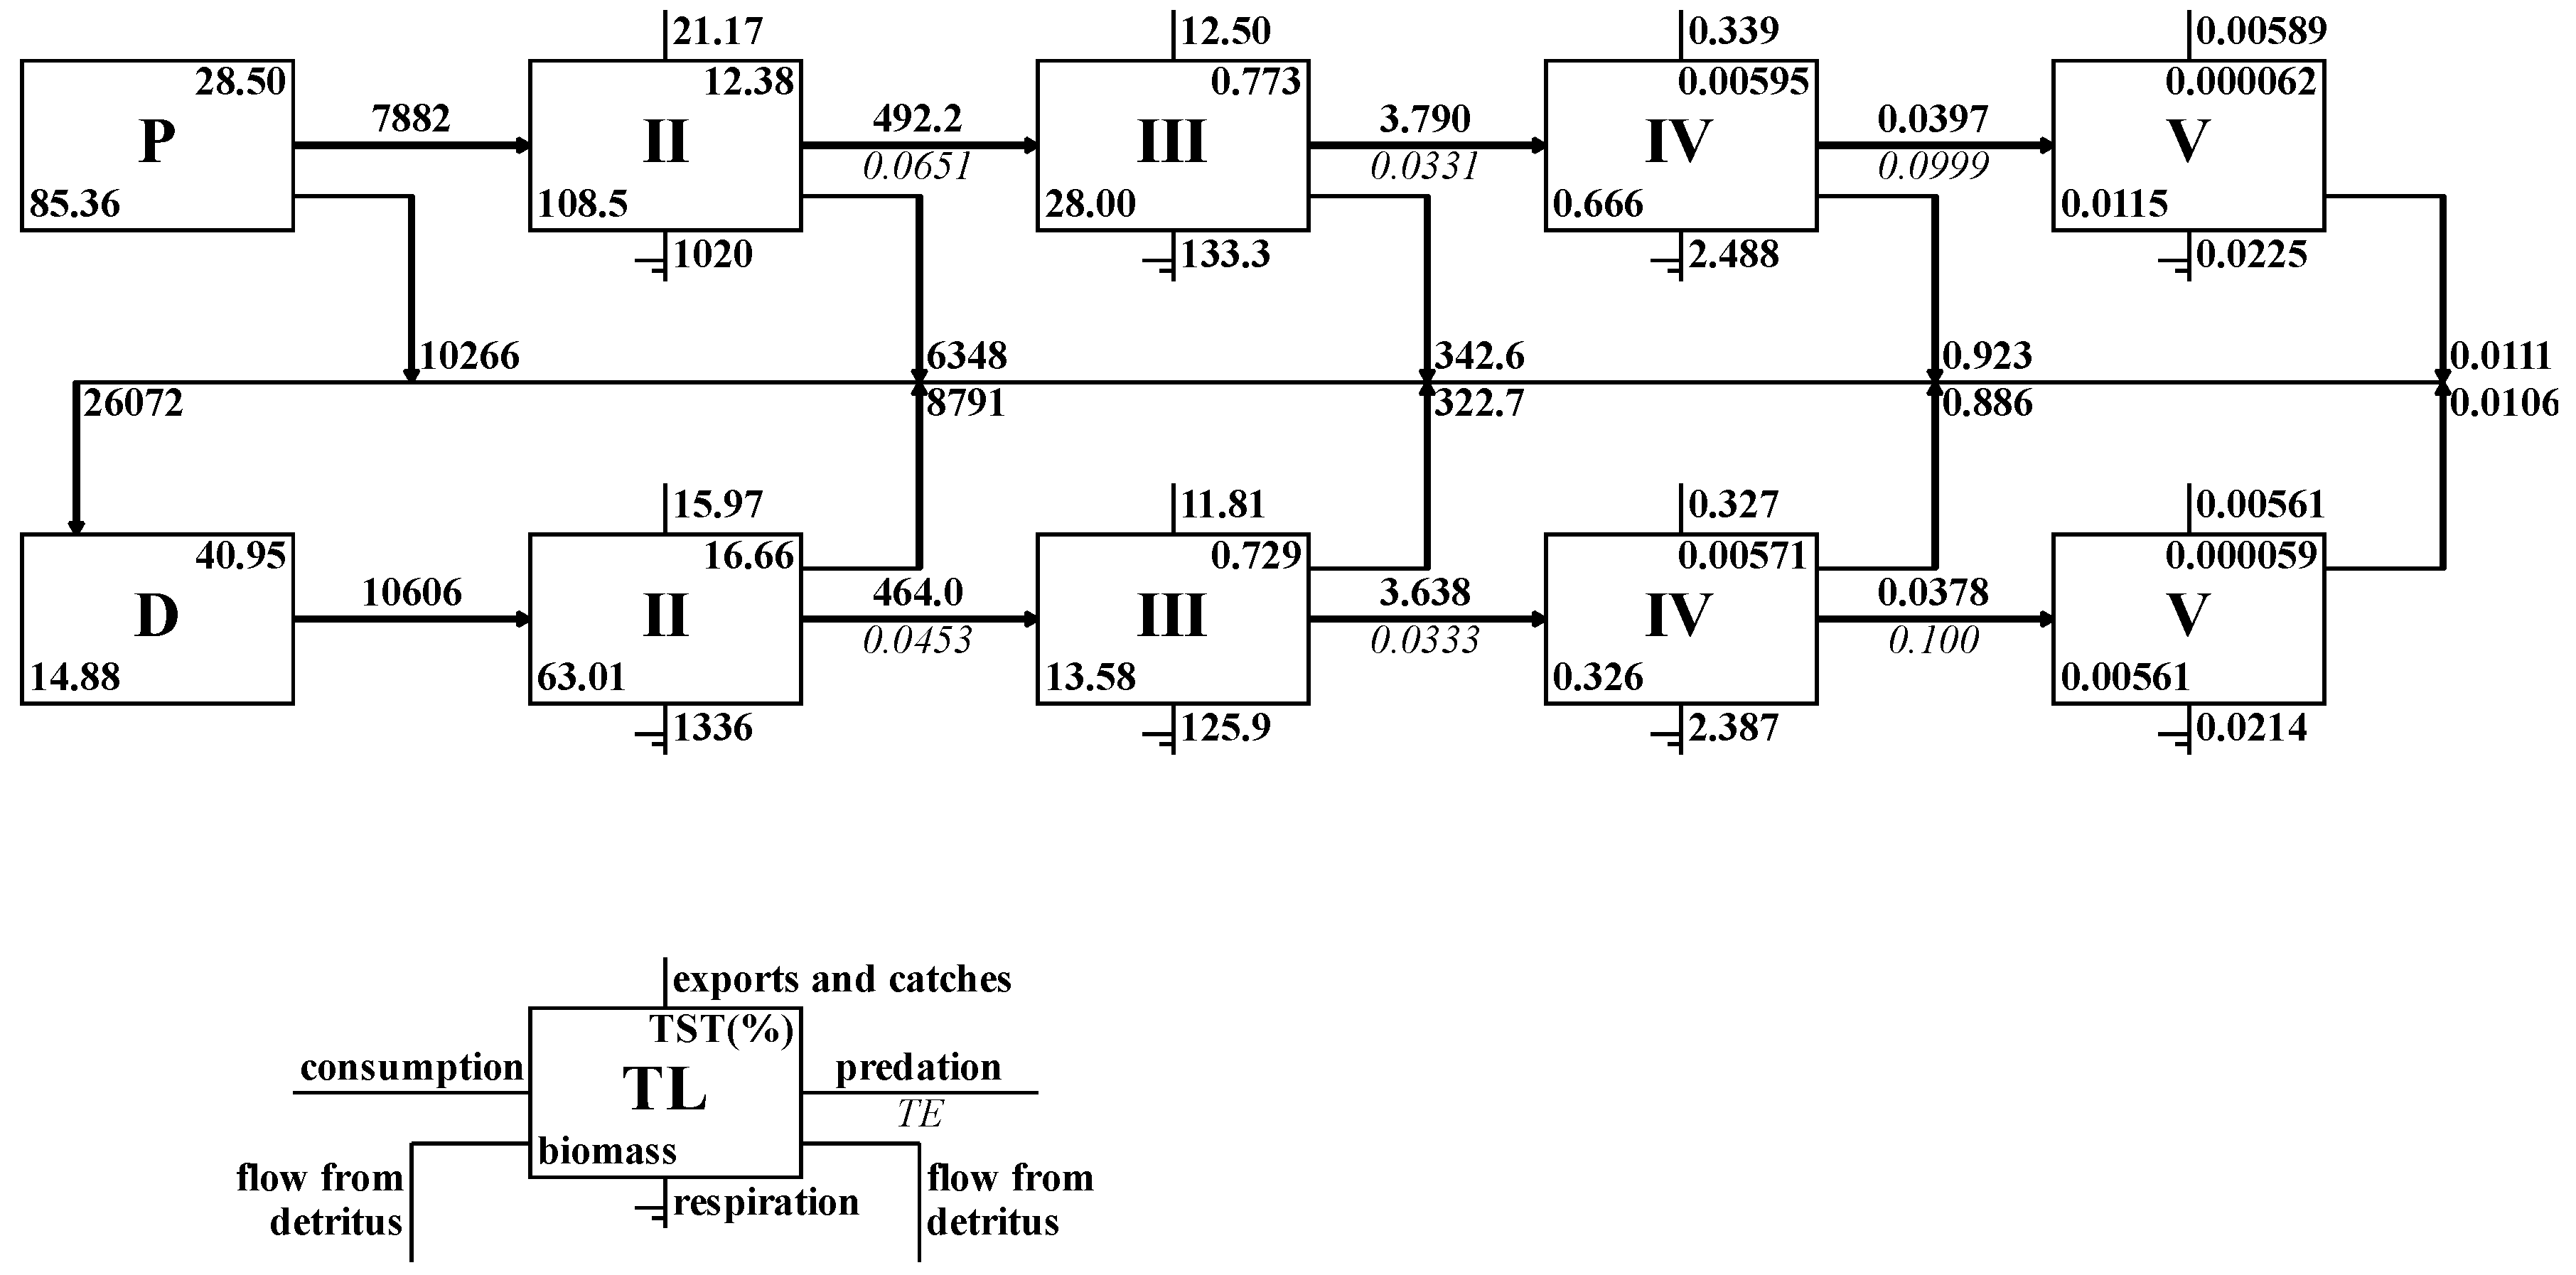
3.2.2. Transfer Efficiency

Functional groups were aggregated into seven trophic levels, with analysis focused on the first five due to minimal energy transfer in levels VI and VII (Figure 3). Two distinct food chains emerged: a grazing chain and a detrital chain. In the pastoral chain, energy transfer from trophic level I to II reached 7882 t/(km2·year), with subsequent transfer efficiencies from level II to V being 6.51% (II to III), 3.31% (III to IV), and 9.99% (IV to V), averaging 6.60%. For the detrital chain, transfer efficiencies from level II to V were 4.53% (II to III), 3.33% (III to IV), and 10.0% (IV to V), with an average efficiency of 5.95%.

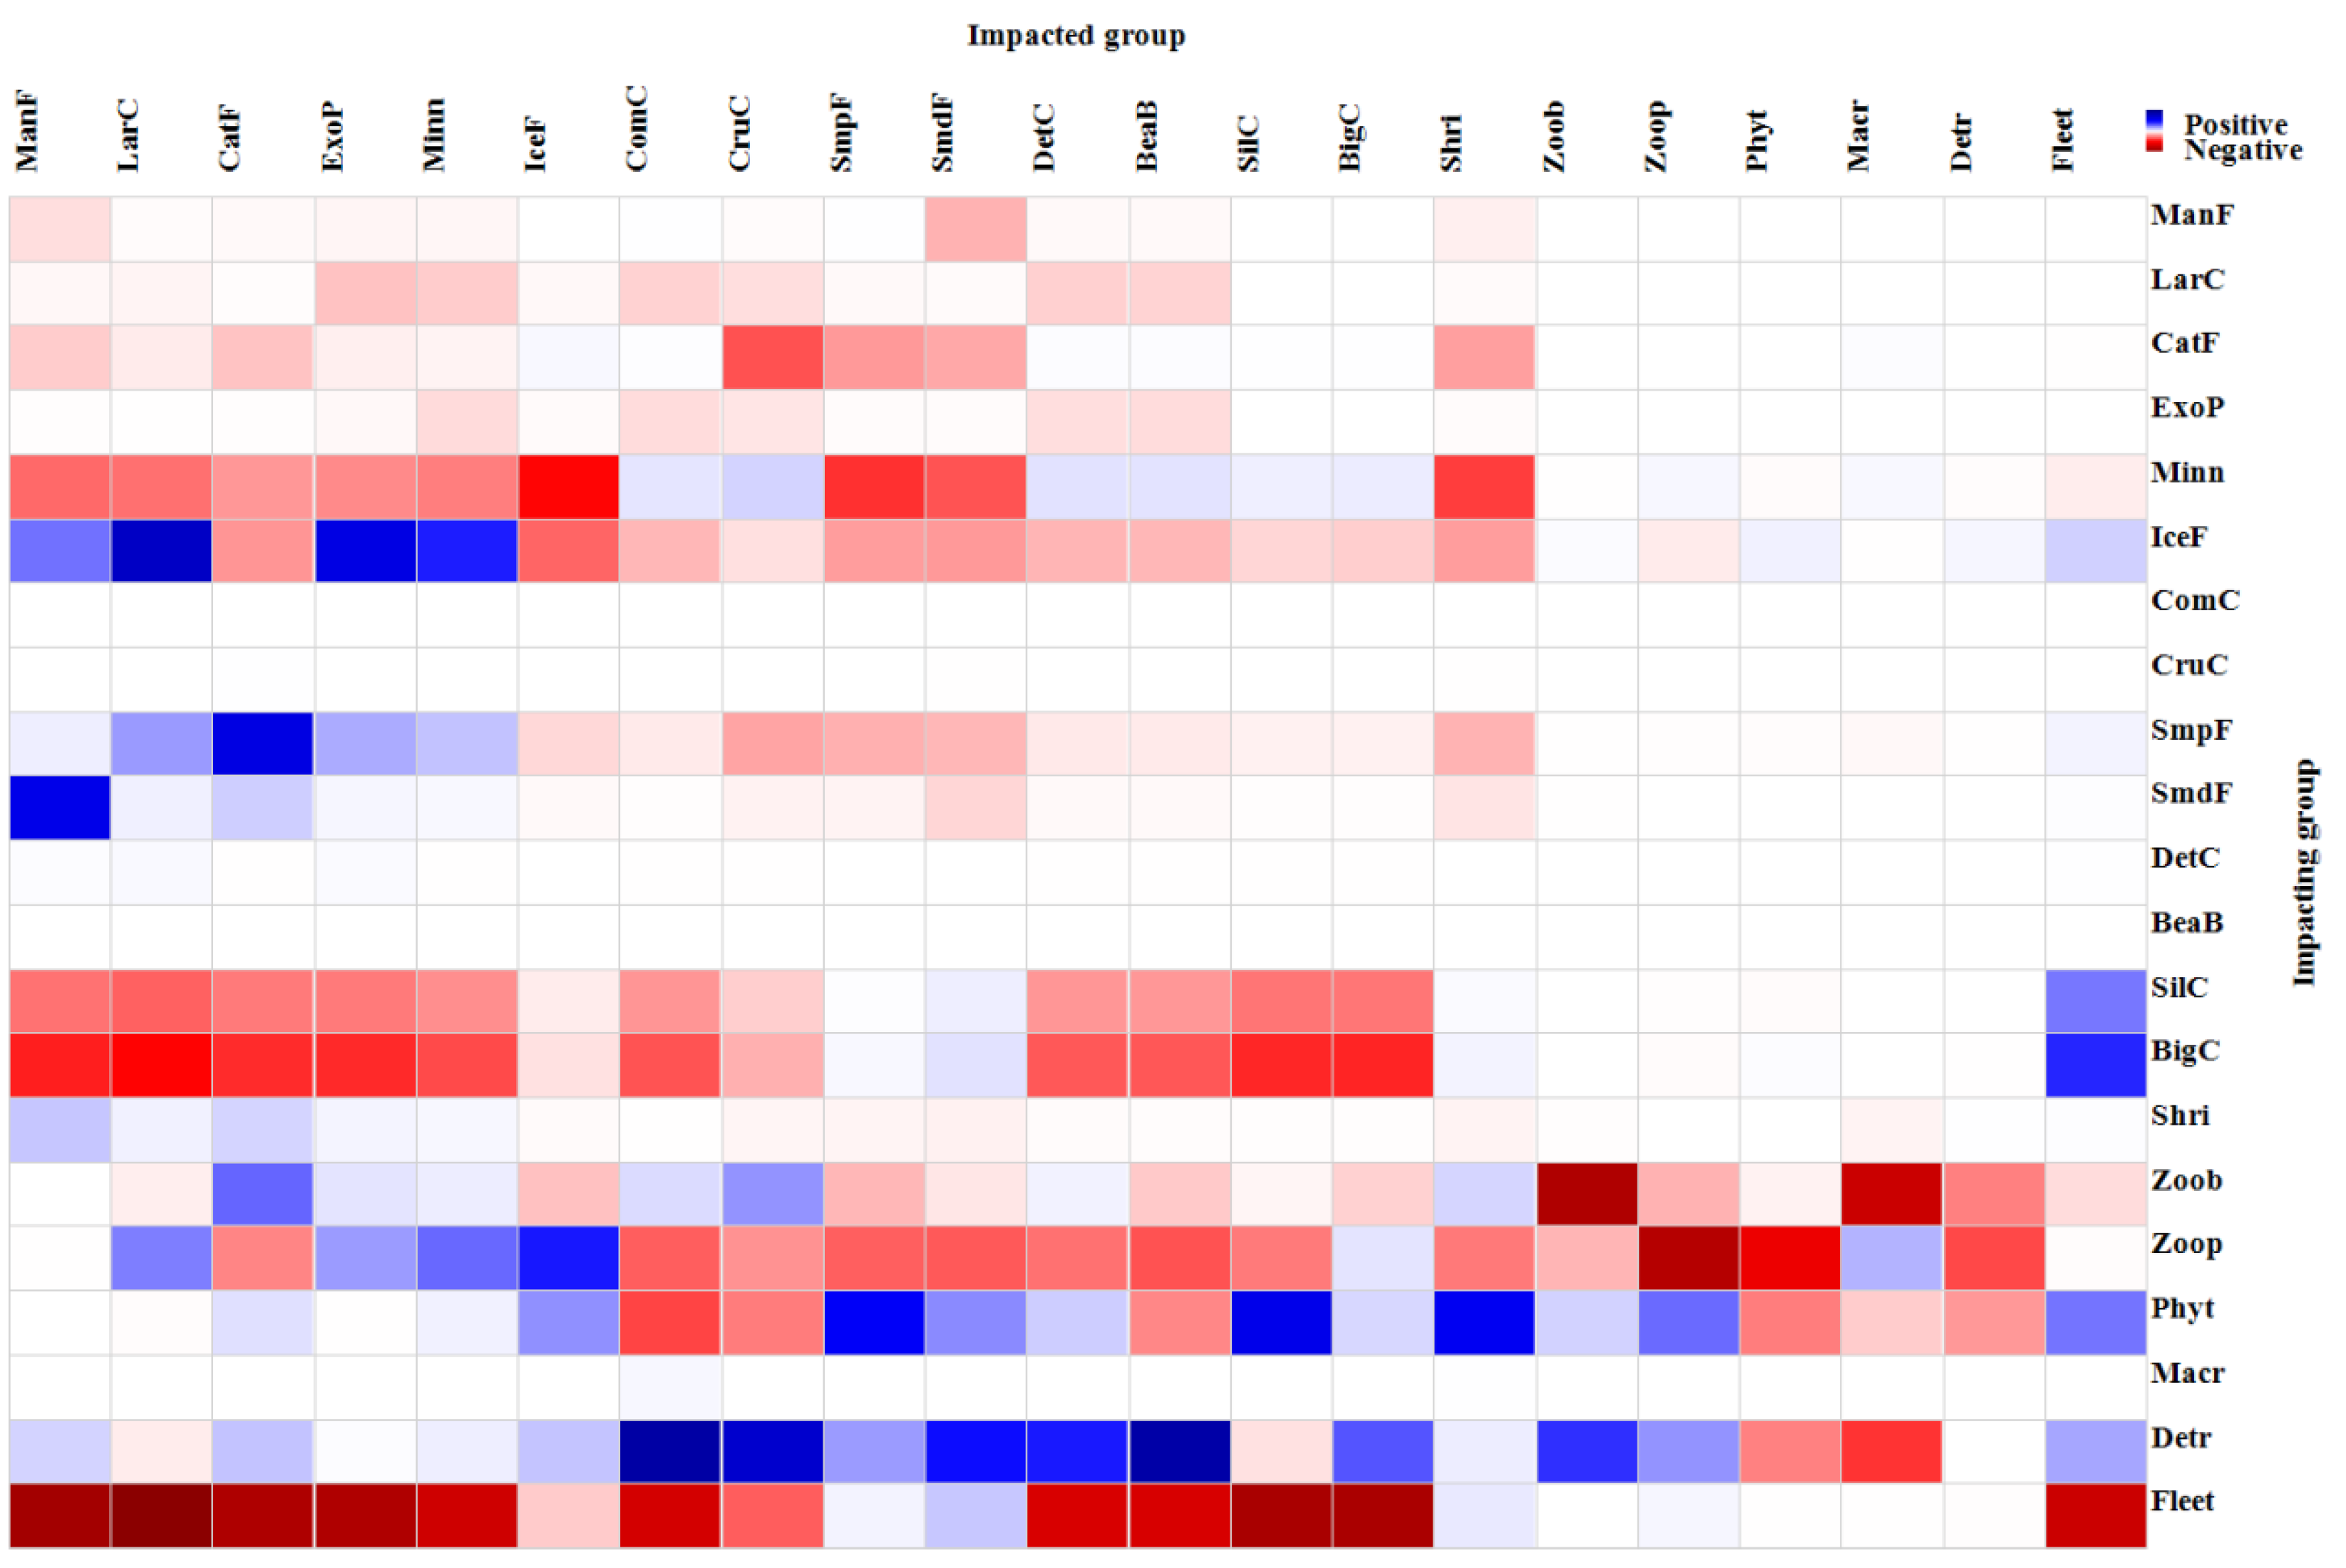
3.2.3. Mixed Trophic Effect

Figure 4 shows a heatmap analysis of the Geheyan Reservoir’s food web dynamics. Blue indicates positive impacts, while red indicates negative impacts. The fishing fleet’s impact is mostly negative, particularly on apex predators like mandarin fish and exotic perch, which in turn pressure smaller fish species. Filter feeders such as Silver carp and Bighead carp compete negatively but positively control phytoplankton, benefiting zooplankton. Primary producers and detritus generally support consumers, except for shrimp and benthos, which face resource competition. Exotic perch negatively affects native species like minnow and icefish, while detritivorous carp positively benefits benthos through nutrient cycling. This highlights the fishing ban’s role in modulating these interactions [26,27].

3.3. Ecosystem Parameters

The ecosystem parameters for this study are shown in Table 3. Key metrics include a total consumption of 22,698.69 t/(km2·year), total production of 22,753.85 t/(km2·year), and a mean trophic level of the catch at 2.50 [28]. The connectivity index stands at 0.25, the system omnivory index at 0.23, and Finn’s cycling index at 24.61%. These parameters collectively characterize the structure and function of the Geheyan Reservoir’s ecosystem post-fishing ban.

4. Discussion

4.1. Ecopath Model Accuracy Assessment

The pedigree index (P-index) of 0.47 in our study, within the range of 0.16–0.68, indicates high data credibility and model quality [29]. However, the Ecopath model provides a static view of the ecosystem at the time of sampling and may not fully capture dynamic changes over time, including long-term effects like those of the fishing ban. Additionally, the model does not directly account for the absence of certain functional groups, such as macrophytes, which could influence system throughput comparisons and lead to the underestimation of energy flow and nutrient cycling. Future research could address these limitations by adjusting the model or conducting field surveys to assess the impact of absent groups on ecosystem dynamics.

4.2. Food Web Dynamics and Trophic Interactions

The Ecopath model analysis shows that the 2017 fishing ban led to distinct changes in the Geheyan Reservoir’s ecosystem. The food web now spans trophic levels from 1.00 (primary producers) to 3.89 (top carnivores), with introduced species like exotic perch (TL = 3.82) as apex predators. This complexity highlights cascading trophic interactions, where exotic predators suppress intermediate consumers and indirectly regulate primary producers [29,30]. The ban also facilitated the recovery of native predators like mandarin fish (TL = 3.65), enhancing biodiversity [31]. Phytoplankton and aquatic plants, as foundational producers, are critical for sustaining energy flows with reduced human disturbance [32]. The no-take policy has mitigated anthropogenic impacts and promoted ecosystem resilience [33].
Comparative analysis of ecological trophic efficiency (EE) between pre-ban (2017) [20] and post-ban (2022) periods revealed significant improvements. Key economic species including silver carp (EE: 0.71 to 0.76), common carp (0.67 to 0.70), and shrimp (0.71 to 0.74) showed enhanced energy utilization efficiency, indicating reduced anthropogenic pressure and stabilized energy flows [34]. These shifts align with global observations where fishing restrictions promote resource recovery and trophic stability [35,36]. The detrital pathway exhibited moderate EE values (0.69), suggesting persistent challenges in organic matter cycling [33,37]. Prior to the ban, overexploitation diverted energy from fish populations to human use [38,39].
Energy transfer between trophic levels II–IV shows critical bottlenecks, with average efficiencies dropping from 7.75% in 2017 to 6.60% in 2022 in grazing chains. Despite improved ecological efficiency (EE) values, reduced transfer efficiency reflects ecosystem reorganization post-ban due to predator recovery [20,40]. The detrital pathway also saw declines in efficiency (from 7.36% to 5.95%), indicating system-wide adjustments in material cycling. However, the elevated pedigree index (0.47) and Finn’s cycling index (24.61%) confirm model reliability and progressing ecosystem maturity [41].
The implementation of the no-take policy in the Geheyan Reservoir has driven measurable shifts in ecosystem indicators. Post-ban (2022), the total catch decreased significantly to 62.13 t/(km2·year), reflecting reduced direct fishing pressure, while the mean trophic level of catches (MTLC = 2.50) indicated persistent targeting of mid-trophic species [42]. Concurrently, the Finn cycling index (FCI = 24.61%) and average path length (FML = 3.69) revealed enhanced energy recycling efficiency and food web complexity, suggesting progressive ecosystem maturation under reduced anthropogenic disturbance [26]. These changes align with elevated total primary production/respiration (TPP/TR) and production/biomass (TPP/TB = 81.54) ratios, which signify improved energy utilization and system maturity [43,44].

4.3. Comparative Analysis with Similar Water Bodies

Comparison with other reservoirs shows the Geheyan Reservoir’s unique characteristics. Its total consumption (TC) is higher than Qiandao Lake and Manwan Reservoir but lower than Fanshuijiang Reservoir, indicating intermediate energy turnover rates due to trophic bottlenecks [44]. The Geheyan Reservoir has the highest detritus flow (TD = 26,071.92 t/(km2·year)) and total system flow (TST = 66,918.24 t/(km2·year)), highlighting its reliance on organic matter cycling and high internal energy flux [42]. However, its total respiration (TR = 2619.88 t/(km2·year)) and total export (TE = 15,527.75 t/(km2·year)) are significantly higher than those of Manwan Reservoir, reflecting active metabolic processes and residual human-mediated energy extraction [42,43]. The connectivity index (CI = 0.25) and omnivory index (SOI = 0.23) confirm its resilient food web structure, though challenges remain in balancing fisheries pressure and detritus management (Table 4) [45,46].
Overall, the Geheyan Reservoir is a transitional ecosystem with high productivity (TP = 22,753.85 t/(km2·year)) and maturing stability, yet it faces pressures from historical fishing impacts and organic matter accumulation. Continuous monitoring is essential to sustain its recovery under the no-take policy [42,46].

4.4. Management Recommendations

The study suggests prioritizing continuous monitoring and evaluation of the ecosystem, focusing on tracking energy transfer efficiency and EE values, to assess the long-term impacts of the no-take policy [35,37,47]. It also recommends enhancing ecological restoration and controlling exotic fish species to improve ecosystem health [33,48], as well as strengthening fishery resource management by protecting breeding populations and juveniles and imposing fishing restrictions to ensure sustainable resource use [49,50,51].
To further enhance the ecosystem, it is recommended to prioritize stocking key species with high ecological trophic efficiency (EE > 0.6), such as Siniperca chuatsi, exotic perch, silver carps, and bighead carps, in the shallow waters of reservoir tributaries (sampling sites S1–S4) at 5–10 fish/mu each spring and autumn. This will help boost top predator populations and alleviate trophic level II-IV energy transfer bottlenecks. The effectiveness of this release strategy should be assessed using acoustic monitoring to ensure alignment with ecological restoration goals. Additionally, improving ecosystem connectivity and stability through adjustments in reservoir operations and enhanced linkages between ecosystems is crucial. Interdisciplinary collaboration among relevant departments should be promoted to implement integrated management plans. Adaptive strategies should also be employed to adjust measures based on ecosystem dynamics and changes, with the ultimate goal of protecting the Geheyan Reservoir ecosystem and ensuring sustainable water resource use and regional ecological balance.

5. Conclusions

The Ecopath model reveals that the Geheyan Reservoir ecosystem has a moderate level of complexity, with trophic levels ranging from 1.00 to 3.89. Compared with the pre-ban period, the current ecosystem has undergone significant changes: the trophic levels have increased from 3.36 to 3.89, indicating an enhanced complexity of the food web structure; the ecological efficiency (EE) of major economic fish species has improved, leading to better energy utilization efficiency. However, energy transfer bottlenecks still exist between trophic levels II and IV, limiting overall cycling efficiency. These findings provide important references for the management of similar ecosystems in the future, demonstrating the significant effectiveness of the fishing ban policy in promoting ecosystem recovery and enhancing stability, while also highlighting the importance of continuous monitoring and targeted intervention measures to further optimize ecosystem structure and function and to promote sustainable water resource management.

Supplementary Materials

The following supporting information can be downloaded at https://www.mdpi.com/article/10.3390/fishes10040168/s1: Table S1: Required parameters for Ecopath model of Geheyan Resevoir.

Author Contributions

M.X.: conceptualization, methodology, software, writing—original draft preparation, writing—review and editing; H.L.: conceptualization, data curation, formal analysis, writing—original draft preparation, writing—review and editing; N.W.: investigation, validation, methodology; Z.M.: conceptualization, validation, methodology; F.H.: conceptualization, validation, methodology; X.L.: funding acquisition, project administration, supervision, validation, writing—review and editing. All authors have read and agreed to the published version of the manuscript.

Funding

This research was funded by the National Key Research and Development Program of China (No. 2023YFD2400900), China Agriculture Research System of MOF and MARA (CARS-46), Central Public-interest Scientific Institution Basal Research Fund, CAFS (No. 2023TD61), and Central Public-interest Scientific Institution Basal Research Fund (No. YFI202415, No. YFI202418).

Institutional Review Board Statement

This study was approved by Institutional Animal Care and Use Committee of the Yangtze River Fisheries Research Institute, Chinese Academy of Fishery Sciences YFI2022XM01 2022-09-01.

Informed Consent Statement

Not applicable.

Data Availability Statement

Data will be made available on request.

Acknowledgments

We thank Zhibin Guo, Qiuyan Wang, and Zhouhang Wu for assistance in the field.

Conflicts of Interest

The authors declare no conflicts of interest.

Appendix A

Table A1. Diet composition of the functional groups in Geheyan Reservoir.
No.Functional Groups1234567891011121314151617
1ManF
2LarC
3CatF
4ExoP0.00440.0081
5Minn0.04310.079 0.0712
6IceF0.35920.6576 0.59360.4973
7ComC 0.0007 0.0007
8CruC0.00040.00070.0020.0007
9SmpF0.10210.18690.46470.16870.1413
10SmdF0.40190.03040.07550.02740.0230 0.00240.0043
11DetC0.00490.009 0.0080
12BeaB0.00040.0007 0.0007
13SilC
14BigC
15Shri0.08360.02590.06440.02340.0196 0.0020.0037 0.001
16Zoob 0.39340.10560.1118 0.2610.482 0.14260.13830.0529 0.22950.0969
17Zoop 0.001 0.20700.85 0.20400.12060.11690.04480.2010.4010.19410.08190.1737
18Phyt 0.50090.2960.28710.10980.6250.2290.47540.20110.4263
19Macr 0.100.01 0.00010.0001 0.0010.0001
20Detr 0.050.72460.510.2950.43970.45770.79250.1740.370.100.620.40

References

  1. Zhang, W.W.; Gao, S.S.; Li, M.L.; Chen, Y.; Fohrer, N.; Costanza, R.; Li, Y.Y.; Chen, Z.J. Vertical Distribution Characteristics and Driving Factors of Bacterioplankton and Nitrogen Phosphorus Cycle Genes in Danjiangkou Reservoir. Huanjing Kexue 2024, 45, 3995–4005. [Google Scholar] [PubMed]
  2. Kennedy, R.H.; Thornton, K.W.; Ford, D.E. Characterization of the reservoir ecosystem. In Microbial Processes in Reservoirs; Springer: Dordrecht, The Netherlands, 1985; pp. 29–38. [Google Scholar]
  3. Tundisi, J.G. Reservoirs: New challenges for ecosystem studies and environmental management. Water Secur. 2018, 4, 1–7. [Google Scholar]
  4. Guo, Z.F.; Boeing, W.J.; Borgomeo, E.; Xu, Y.Y.; Weng, Y. Linking reservoir ecosystems research to the sustainable development goals. Sci. Total Environ. 2021, 781, 146769. [Google Scholar] [CrossRef]
  5. Polovina, J.J. Model of a coral reef ecosystem: I. The ECOPATH model and its application to French Frigate Shoals. Coral Reefs 1984, 3, 1–11. [Google Scholar] [CrossRef]
  6. Christensen, V.; Walters, C.J.; Pauly, D. Ecopath with Ecosim: A user’s guide. Fish. Cent. Univ. Br. Columbia Vanc. 2005, 154, 31. [Google Scholar]
  7. Pauly, D.; Christensen, V.; Walters, C. Ecopath, Ecosim, and Ecospace as tools for evaluating ecosystem impact of fisheries. ICES J. Mar. Sci. 2000, 57, 697–706. [Google Scholar] [CrossRef]
  8. Palomares, M.L.D.; Pauly, D. Predicting food consumption of fish populations as functions of mortality, food type, morphometrics, temperature and salinity. Mar. Freshw. Res. 1998, 49, 447–453. [Google Scholar] [CrossRef]
  9. Sinnickson, D.; Chagaris, D.; Allen, M. Exploring impacts of river discharge on forage fish and predators using ecopath with ecosim. Front. Mar. Sci. 2021, 8, 689950. [Google Scholar] [CrossRef]
  10. Christensen, V.; Walters, C.J. Ecopath with Ecosim: Methods, capabilities and limitations. Ecol. Modell. 2004, 172, 109–139. [Google Scholar] [CrossRef]
  11. Qi, S.W.; Yan, F.Z.; Wang, S.J.; Xu, R.C. Characteristics, mechanism and development tendency of deformation of Maoping landslide after commission of Geheyan reservoir on the Qingjiang River, Hubei Province, China. Eng. Geol. 2006, 86, 37–51. [Google Scholar] [CrossRef]
  12. He, Y.; Chen, T. Does the 10-year fishing ban compensation policy in the Yangtze River basin improve the livelihoods of fishing households? Evidence from Ma’anshan City, China. Agriculture 2022, 12, 2088. [Google Scholar] [CrossRef]
  13. Feng, J.; Wen, Y.L.; Zhang, H.Y.; Hou, Y.L.; Zhang, Z. Trap or Opportunity: Impact of the Fishing Ban Compensation Policy on the Income of Returning Fishermen in China. Sustainability 2024, 16, 4401. [Google Scholar] [CrossRef]
  14. Zeller, D.; Reinert, J. Modelling spatial closures and fishing effort restrictions in the Faroe Islands marine ecosystem. Ecol. Modell. 2004, 172, 403–420. [Google Scholar] [CrossRef]
  15. Gribble, N.A. GBR-prawn: Modelling ecosystem impacts of changes in fisheries management of the commercial prawn (shrimp) trawl fishery in the far northern Great Barrier Reef. Fish. Res. 2003, 65, 493–506. [Google Scholar] [CrossRef]
  16. Xie, B.; Zhou, X.; Huang, L.; Zheng, X.; Du, J.; Yu, W.; Chen, G.; Hu, W.; Gao, S. The ecological functions and risks of expansive bivalve-macroalgae polyculture: A case study in Sansha Bay, China. Aquaculture 2022, 560, 738549. [Google Scholar] [CrossRef]
  17. Pauly, D. On the interrelationships between natural mortality, growth parameters, and mean environmental temperature in 175 fish stocks. ICES J. Mar. Sci. 1980, 39, 175–192. [Google Scholar] [CrossRef]
  18. Yan, Y.; Liang, Y. Energy flow of macrozoobenthic community in a macrophytic lake, Biandantang Lake. Acta Ecol. Sin. 2023, 23, 527–538. [Google Scholar]
  19. He, Z.H. Freshwater Ecology; China Agriculture Press: Beijing, China, 2000. [Google Scholar]
  20. Huang, G.; Wang, Q.D.; Du, X.; Feng, K.; Ye, S.W.; Yuan, J.; Liu, J.S.; Li, Z.J.; De Silva, S.S. Modeling trophic interaction and impacts of introduced icefish (Neosalanx taihuenis Chen) in three large reservoirs in the Yangtze River basin, China. Hydrobiologia 2020, 847, 3637–3657. [Google Scholar] [CrossRef]
  21. Park, R.A. A generalized model for simulating lake ecosystems. Simulation 1974, 23, 33–50. [Google Scholar] [CrossRef]
  22. Scavia, D.; Bloomfield, J.A.; Fisher, J.S.; Nagy, J.; Park, R.A. Documentation of CLEANX: A generalized model for simulating the open-water ecosystems of lakes. Simulation 1974, 23, 51–56. [Google Scholar] [CrossRef]
  23. Heymans, J.J.; Shannon, L.J.; Jarre, A. Changes in the northern Benguela ecosystem over three decades: 1970s, 1980s, and 1990s. Ecol. Model. 2004, 172, 175–195. [Google Scholar] [CrossRef]
  24. Guo, C.B.; Chen, Y.S.; Li, W.; Xie, S.G.; Lek, S.; Li, Z.J. Food web structure and ecosystem properties of the largest impounded lake along the eastern route of China′s South-to-North Water Diversion Project. Ecol. Inform. 2018, 43, 174–184. [Google Scholar] [CrossRef]
  25. Zhang, Y. The Study of Fishery Resource and Ecopath Model in Jinshahe Reservoir Ecosystem, Hubei Province. Master’s Dissertation, Huazhong Agricultural University, Wuhan, China, 2015. [Google Scholar]
  26. Mitra, A.; Flynn, K.J.; Tillmann, U.; Raven, J.A.; Caron, D.; Stoecker, D.K.; Not, F.; Hansen, P.J.; Hallegraeff, G.; Sanders, R.; et al. Defining planktonic protist functional groups on mechanisms for energy and nutrient acquisition: Incorporation of diverse mixotrophic strategies. Protist 2016, 167, 106–120. [Google Scholar]
  27. Worden, A.Z.; Follows, M.J.; Giovannoni, S.J.; Wilken, S.; Zimmerman, A.E.; Keeling, P.J. Rethinking the marine carbon cycle: Factoring in the multifarious lifestyles of microbes. Science 2015, 347, 1257594. [Google Scholar] [CrossRef]
  28. Zhang, Y.; Gu, K.; Wang, X.; Zhang, J.A.; Duan, J.; Hu, Z.; Liu, Q. Food Web Structure and Ecosystem Functions of the Water Source in the Middle Route of China’s South-to-North Water Diversion Project. Fishes 2024, 9, 202. [Google Scholar] [CrossRef]
  29. Fortuna, C.M.; Fortibuoni, T.; Bueno-Pardo, J.; Coll, M.; Franco, A.; Giménez, J.; Stranga, Y.; Peck, M.A.; Claver, C.; Brasseur, S.; et al. Top predator status and trends: Ecological implications, monitoring and mitigation strategies to promote ecosystem-based management. Front. Mar. Sci. 2024, 11, 1282091. [Google Scholar] [CrossRef]
  30. Barnes, A.D.; Jochum, M.; Lefcheck, J.S.; Eisenhauer, N.; Scherber, C.; O’Connor, M.I.; de Ruiter, P.; Brose, U. Energy flux: The link between multitrophic biodiversity and ecosystem functioning. Trends Ecol. Evol. 2018, 33, 186–197. [Google Scholar] [CrossRef]
  31. Östman, Ö.; Eklöf, J.; Eriksson, B.K.; Olsson, J.; Moksnes, P.O.; Bergström, U. Top-down control as important as nutrient enrichment for eutrophication effects in North Atlantic coastal ecosystems. J. Appl. Ecol. 2016, 53, 1138–1147. [Google Scholar] [CrossRef]
  32. Pringle, R.M.; Hutchinson, M.C. Resolving food-web structure. Annu. Rev. Ecol. Evol. Syst. 2020, 51, 55–80. [Google Scholar] [CrossRef]
  33. Thompson, R.M.; Brose, U.; Dunne, J.A.; Hall, R.O., Jr.; Hladyz, S.; Kitching, R.L.; Martinez, Z.D.; Rantala, H.; Romanuk, T.N.; Stouffer, D.B.; et al. Food webs: Reconciling the structure and function of biodiversity. Trends Ecol. Evol. 2012, 27, 689–697. [Google Scholar] [CrossRef]
  34. Qiu, L.H.; Qiu, Y.H.; Peng, L.G.; Shen, J.Z.; Li, G.Y.; Li, J.G. Enhancing Fishery Management in Tanghe Reservoir, China: Insights from Food Web Structure and Ecosystem Analysis. Water 2024, 16, 200. [Google Scholar] [CrossRef]
  35. Brownscombe, J.W.; Lawrence, M.J.; Deslauriers, D.; Filgueira, R.; Boyd, R.J.; Cooke, S.J. Applied fish bioenergetics. Fish Physiol. 2022, 39, 141–188. [Google Scholar]
  36. Xie, C.; Dai, B.G.; Wu, J.J.; Liu, Y.Z.; Jiang, Z.G. Initial recovery of fish faunas following the implementation of pen-culture and fishing bans in floodplain lakes along the Yangtze River. JEM 2022, 319, 115743. [Google Scholar] [CrossRef] [PubMed]
  37. Sun, Y.; Sun, Z.R.; Zhang, Y.M.; Qiao, Q. How can governments and fishermen collaborate to participate in a fishing ban for ecological restoration? JEM 2024, 360, 120958. [Google Scholar] [CrossRef] [PubMed]
  38. Ngupula, G.W.; Kayanda, R. Benthic macrofauna community composition, abundance and distribution in the Tanzanian and Ugandan inshore and offshore waters of Lake Victoria. Afr. J. Aquat. Sci. 2010, 35, 185–192. [Google Scholar] [CrossRef]
  39. Aura, C.M.; Musa, S.; Yongo, E.; Okechi, J.K.; Njiru, J.M.; Ogari, Z.; Wanyama, R.; Charo-Karisa, H.; Mbugua, H.; Kidera, S.; et al. Integration of mapping and socio-economic status of cage culture: Towards balancing lake-use and culture fisheries in Lake Victoria, Kenya. Aquac. Res. 2017, 49, 532–545. [Google Scholar]
  40. Xia, Z.J.; Wang, Q.; Brosse, S.; Heino, J.; Wang, Z.X.; Liao, Z.H.; Li, X.H.; He, Y.F.; Liu, F.; Wang, J.W. Trait-based analyses reveal the recovery of riverine fish communities after a fishing ban. Rev. Fish Biol. Fish. 2024, 35, 431–445. [Google Scholar]
  41. Zhou, L.B.; Luo, M.Y.; Hong, P.B.; Leroux, S.; Chen, F.Z.; Wang, S.P. Energy transfer efficiency rather than productivity determines the strength of aquatic trophic cascades. Ecology 2025, 106, e4482. [Google Scholar]
  42. Cebrian, J. Energy flows in ecosystems. Science 2015, 349, 1053–1054. [Google Scholar] [CrossRef]
  43. Li, H.X.; Jin, L.; Si, Y.J.; Mu, J.D.; Liu, Z.N.; Liu, C.Q.; Zhang, Y.J. Lake Restoration Improved Ecosystem Maturity Through Regime Shifts—A Case Study of Lake Baiyangdian, China. Sustainability 2024, 16, 9372. [Google Scholar] [CrossRef]
  44. MacArthur, R. Fluctuations of animal populations and a measure of community stability. Ecology 1955, 36, 533–536. [Google Scholar] [CrossRef]
  45. Loreau, M.; Naeem, S.; Inchausti, P.; Bengtsson, J.; Grime, J.P.; Hector, A.; Hooper, D.U.; Huston, M.A.; Raffaelli, D.; Schmid, B.; et al. Biodiversity and ecosystem functioning: Current knowledge and future challenges. Science 2001, 294, 804–808. [Google Scholar] [CrossRef]
  46. Rooney, N.; McCann, K.S. Integrating food web diversity, structure and stability. Trends Ecol. Evol. 2012, 27, 40–46. [Google Scholar] [CrossRef] [PubMed]
  47. McGarvey, R.; Dowling, N.; Cohen, J.E. Longer food chains in pelagic ecosystems: Trophic energetics of animal body size and metabolic efficiency. Am. Nat. 2016, 188, 76–86. [Google Scholar] [CrossRef]
  48. Gido, K.B.; Brown, J.H. Invasion of north American drainages by alien fish species. Freshw. Biol. 2010, 42, 387–399. [Google Scholar] [CrossRef]
  49. Arechavala-Lopez, P.; Valero-Rodriguez, J.M.; Peñalver-García, J.; Izquierdo-Gomez, D.; Sanchez-Jerez, P. Linking coastal aquaculture of meagre Argyrosomus regius and Western Mediterranean coastal fisheries through escapes incidents. Fish. Manag. Ecol. 2015, 22, 317–325. [Google Scholar] [CrossRef]
  50. Allan, J.D.; Abell, R.; Hogan, Z.E.B.; Revenga, C.; Taylor, B.W.; Welcomme, R.L.; Winemiller, K. Overfishing of inland waters. BioScience 2005, 55, 1041–1051. [Google Scholar] [CrossRef]
  51. Gao, X.; Liang, J.; Zhu, Z.; Li, W.; Lu, L.; Qiu, X.; Li, S.; Tang, N.; Li, X. Unraveling the impact of drought on waterbird community assembly and conservation strategies. J. Environ. Manag. 2025, 373, 123685. [Google Scholar] [CrossRef]
Figure 1. Geheyan Reservoir and the distribution of 12 sampling sites.
Fishes 10 00168 g001
Figure 2. Food web structure in the ecosystem of the Geheyan Reservoir. Note: the grey lines denote the trophic levels 1, 2, 3, and 4, and the colors represent different groups.
Fishes 10 00168 g002
Figure 3. Schematic diagram of Lindeman spine in the ecosystem of the Geheyan Reservoir.
Fishes 10 00168 g003
Figure 4. Mixed trophic effects in the Geheyan Reservoir ecosystem.
Fishes 10 00168 g004
Table 1. Main species composition of each functional group for the Geheyan Reservoir.
NoCodeFunctional GroupComposition
1ManFMandarin fishSiniperca chuatsi (Basilewsky, 1855), Siniperca knerii Garman, 1912
2LarCLarge culterCulter alburnus Basilewsky, 1855
3CatFCatfishPseudobagrus vachelli (Richardson, 1846), Pelteobagrus fulvidraco (Richardson, 1846), Silurus meridionalis Chen, 1977
4ExoPExotic perchSander lucioperca (Linnaeus, 1758)
5MinnMinnowOpsariichthys bidens Günther, 1873
6IceFIcefishNeosalanx taihuensis Chen, 1956
7ComCCommon carpCyprinus carpio Linnaeus, 1758
8CruCCrucian carpCarassius auratus (Linnaeus, 1758)
9SmpFSmall pelagic fishHemiculter leucisculus (Basilewsky, 1855), Rhodeus ocellatus (Kner, 1866), Rhodeus sinensis Günther, 1868
10SmdFSmall demersal fishRhinogobius giurinus (Rutter, 1897), Saurogobio dabryi Bleeker, 1871
11BeaBBeardless sucking bardGarra imberaba Garman, 1912
12SilCSilver carpHypophthalmichthys molitrix (Valenciennes, 1844)
13BigCBighead carpHypophthalmichthys nobilis (Richardson, 1845)
14DetCDetritivorous carpDistoechodon tumirostris Peters, 1881, Hemibarbus maculatus Bleeker, 1871
15ShriShrimpMacrobrachium nipponense (De Haan, 1849), Palaemon modestus (Heller, 1862)
16ZoobZoobenthosBranchiura sowerbyi Beddard, 1892, Limnodrilus hoffmeisteri Claparède, 1862, Bellamya sp., Corbicula fluminea (Müller, 1774), Chironomus sp., Polypedilum sp.
17ZoopZooplanktonRotifer, Nauplius, Strobilidium sp., Difflugia globulosa Dujardin, 1837, Tintinnopsis entzii Daday, 1892
18PhytPhytoplanktonCyanophyta, Chlorophyta, Bacillariophyta, Cryptophyta
19MacrMacrophytePotamogeton crispus L.
20DetrDetritusBacteria, Organic debris
Table 2. Basic input and estimated input (in bold) for the 20 functional groups of the Geheyan Reservoir ecosystem.
CodeTrophic LevelBiomass
(t/km2)
P/B
(Year−1)
Q/B
(Year−1)
EEP/Q
ManF3.650.041.165.990.860.19
LarC3.890.131.566.320.640.25
CatF3.260.201.707.510.590.23
ExoP3.820.101.796.400.600.28
Minn3.630.951.2712.680.890.10
IceF3.037.927.8031.930.240.24
ComC2.320.011.595.260.700.30
CruC2.600.012.2313.120.660.17
SmpF2.252.252.3143.480.950.05
SmdF2.320.372.5020.930.970.12
DetC2.310.111.378.280.820.17
BeaB2.120.011.9626.400.570.07
SilC2.2419.131.316.000.760.22
BigC2.4930.611.515.100.660.30
Shri2.510.313.0941.230.740.07
Zoob2.2240.6720.21186.160.900.11
Zoop2.2134.39105.91420.780.950.25
Phyt1.0084.40215.00 0.43
Macr1.000.961.25 0.65
Detr1.0014.88 0.69
Note: P/B, Q/B, EE, P/Q stand for production-to-biomass ratio, consumption-to-biomass ratio, ecotrophic efficiency, production-to-consumption ratio, respectively.
Table 3. Ecosystem attributes of ecosystems of the Geheyan Reservoir.
ParametersValueUnit
Ecosystem properties
Sum of all consumption22,698.69t/(km2·year)
Sum of all exports15,527.75t/(km2·year)
Sum of all respiratory flows2619.88t/(km2·year)
Sum of all flows into detritus26,071.92t/(km2·year)
Total system throughput66,918.24t/(km2·year)
Sum of all production22,753.85t/(km2·year)
Mean trophic level of the catch2.50-
Gross efficiency0.003-
Calculated total net primary production18,147.63t/(km2·year)
Total biomass (excluding detritus)222.55t/km2
Total catch62.13t/(km2·year)
Net system production15,527.75t/(km2·year)
Ecosystem maturity
Total primary production/total respiration6.93
Total primary production/total biomass81.54
Total biomass/total throughput0.003/year
Food web structure
Connectivity index0.25
System omnivory index0.23
Finn’s cycling index24.61%
Finn’s mean path length3.69
Model reliability
Pedigree index0.47
Measure of fit2.20
Table 4. Comparison of ecosystem modeling characteristics with typical reservoirs.
ParametersQiandao LakeFanshuijiang ReservoirManwan ReservoirStudy Area
Sum of all consumption (t/(km2·year))5337.524,1021563.322,698.69
Sum of all exports (t/(km2·year))3083.123,809.51274.315,527.75
Sum of all respiratory flows (t/(km2·year))1131.55671.0868.12619.88
Sum of all flows into detritus (t/(km2·year))5990.32357.01844.026,071.92
Total system throughput (t/(km2·year))15,543.078,938.05550.066,918.24
Sum of all production (t/(km2·year))4436.029,240.92524.822,753.85
Mean trophic level of the catch2.652.752.472.50
Total catch (t/km2)10.187114.06-62.13
Total primary production/total respiration1.9444.8202.4706.93
Total primary production/total biomass73.96161.3018.9081.54
Connectivity index0.2200.2060.340.25
System omnivory index0.0870.0620.1300.23
Disclaimer/Publisher’s Note: The statements, opinions and data contained in all publications are solely those of the individual author(s) and contributor(s) and not of MDPI and/or the editor(s). MDPI and/or the editor(s) disclaim responsibility for any injury to people or property resulting from any ideas, methods, instructions or products referred to in the content.

