Article

Environmental DNA Was Utilized to Assess Fish Diversity and Community Structure in the Qingshui River

1
Fisheries Research Institute, Academy of Agricultural Sciences of Guizhou, Guiyang 550025, China
2
Guizhou Special Aquatic Products Engineering Technology Center, Guiyang 550025, China
3
School of Animal Science, Guizhou University, Guiyang 550025, China
*
Author to whom correspondence should be addressed.
These authors contributed equally to this work.
Fishes 2025, 10(4), 165; https://doi.org/10.3390/fishes10040165
Submission received: 21 January 2025 / Revised: 13 March 2025 / Accepted: 21 March 2025 / Published: 8 April 2025

Abstract

:
An accurate assessment of fish stocks is crucial for maintaining the health and stability of aquatic ecosystems. To understand the characteristics of fish diversity in the Qingshui River, this study utilized high-throughput sequencing data obtained through environmental DNA macrobarcoding technology (eDNA). The research explored differences in fish diversity and community characteristics in the Qingshui River by analyzing fish community structure, α diversity, β diversity, and the redundancy of environmental factors. This analysis aims to provide data support for water ecological monitoring and management. The results were as follows: (1) A total of 91 species of fishes from 18 families and seven orders were detected in the eDNA survey, and the dominant species was Cypriniformes, accounting for 72.5%. (2) There were significant differences in α diversity analysis in the Qingshui River (p < 0.05). (3) The fish community structure was similar in β diversity analysis. (4) In the redundancy analysis of environmental factors, pH, DO, TN, TP, N O 2 and M n O 4 have the greatest impact on the Qingshui River Basin. eDNA technology has the advantages of high efficiency and low harm and can be used for water ecological monitoring and management. It provides a scientific basis for fish protection and a valuable reference for fish monitoring in the future.
Key Contribution: The changes in fish diversity were investigated using eDNA technology, and the future development of fish monitoring technology was explored.

1. Introduction

Species diversity is the most intuitive and evident manifestation of biodiversity, reflecting the complexity and stability of ecosystems and community structures [1]. Fish diversity plays a crucial role in maintaining the stability of aquatic ecosystems, and the composition and diversity of fish serve as important indicators of resource diversity [2]. Fish are a crucial component of lake ecosystems, influencing the structure and function of river ecosystems through both bottom-up and top-down effects [3].
Fish play a crucial role in maintaining the health of river ecosystems. Different functional feeding groups of fish have varying impacts on these ecosystems. For instance, the overstocking of herbivorous fish can lead to the decline or even extinction of aquatic grasses, resulting in a dominance of planktonic algae among primary producers [4]. Zooplankton-feeding fish, by consuming zooplankton, reduce the grazing pressure that zooplankton exerts on phytoplankton, leading to an increase in phytoplankton biomass [5]. Carnivorous fish can regulate the biomass of other carnivorous fish. When the biomass of carnivorous fish is elevated, the control of phytoplankton by zooplankton can be significantly enhanced through a downward effect, leading to a reduction in phytoplankton biomass [6]. Therefore, regulating fish community structure is a crucial method for effectively reducing the risk of algal blooms and improving river water quality. Additionally, it serves as a key indicator for assessing biological integrity and reflecting the extent of water disturbance [7].
The Qingshui River is situated in the sloped region transitioning from the Yunnan–Guizhou Plateau to the Xiang-Gui Hills, in the northern part of the eastern section of the Miaoling Mountain Range. It originates from the southern foothills of Doupeng Mountain in Guiding County, Qiannan Prefecture, Guizhou Province. The river serves as the upper reaches of the Yuanjiang River, which is part of the Dongting Lake system within the Yangtze River basin. Notably, it is the second-longest river in Guizhou Province [8]. The basin is 369 km long and covers an area of 14,883 km2. The annual average precipitation is 1265 mm, with surface water resources amounting to 9.625 billion m3 and groundwater resources totaling 2.47 billion m3 [9]. The Qingshui River basin is characterized by a subtropical monsoon humid climate. This region experiences warm and humid conditions, with an annual average temperature ranging from 14 to 18 °C and annual average rainfall between 1050 and 1500 mm [10]. In the Qingshui River Basin, the development of cascade power plants, along with the proliferation and release of new varieties in artificial culture, has led to a decline in fish species richness and has adversely affected the genetic diversity of germplasm resources to some extent [11].
In aquatic biological monitoring, eDNA technology collects DNA from fish skin cells, mucus, feces, and water samples from various sources to identify and quantify fish populations [12]. It offers the advantages of being non-invasive, having a rapid speed, and providing extensive coverage, which allows for an effective assessment of fish diversity [13]. However, this method also has certain limitations, including sample and DNA contamination, as well as inaccurate species information in reference databases. These issues may lead to false positive results and hinder the accurate identification of local biodiversity [14]. Starting in September 2023, this study systematically monitored fish composition in the Qingshui River using eDNA technology. The aim was to understand and protect the variations in fish community structure in this region, provide foundational data for examining the differences in fish diversity within the dam construction basin, and offer targeted recommendations.

2. Materials and Methods
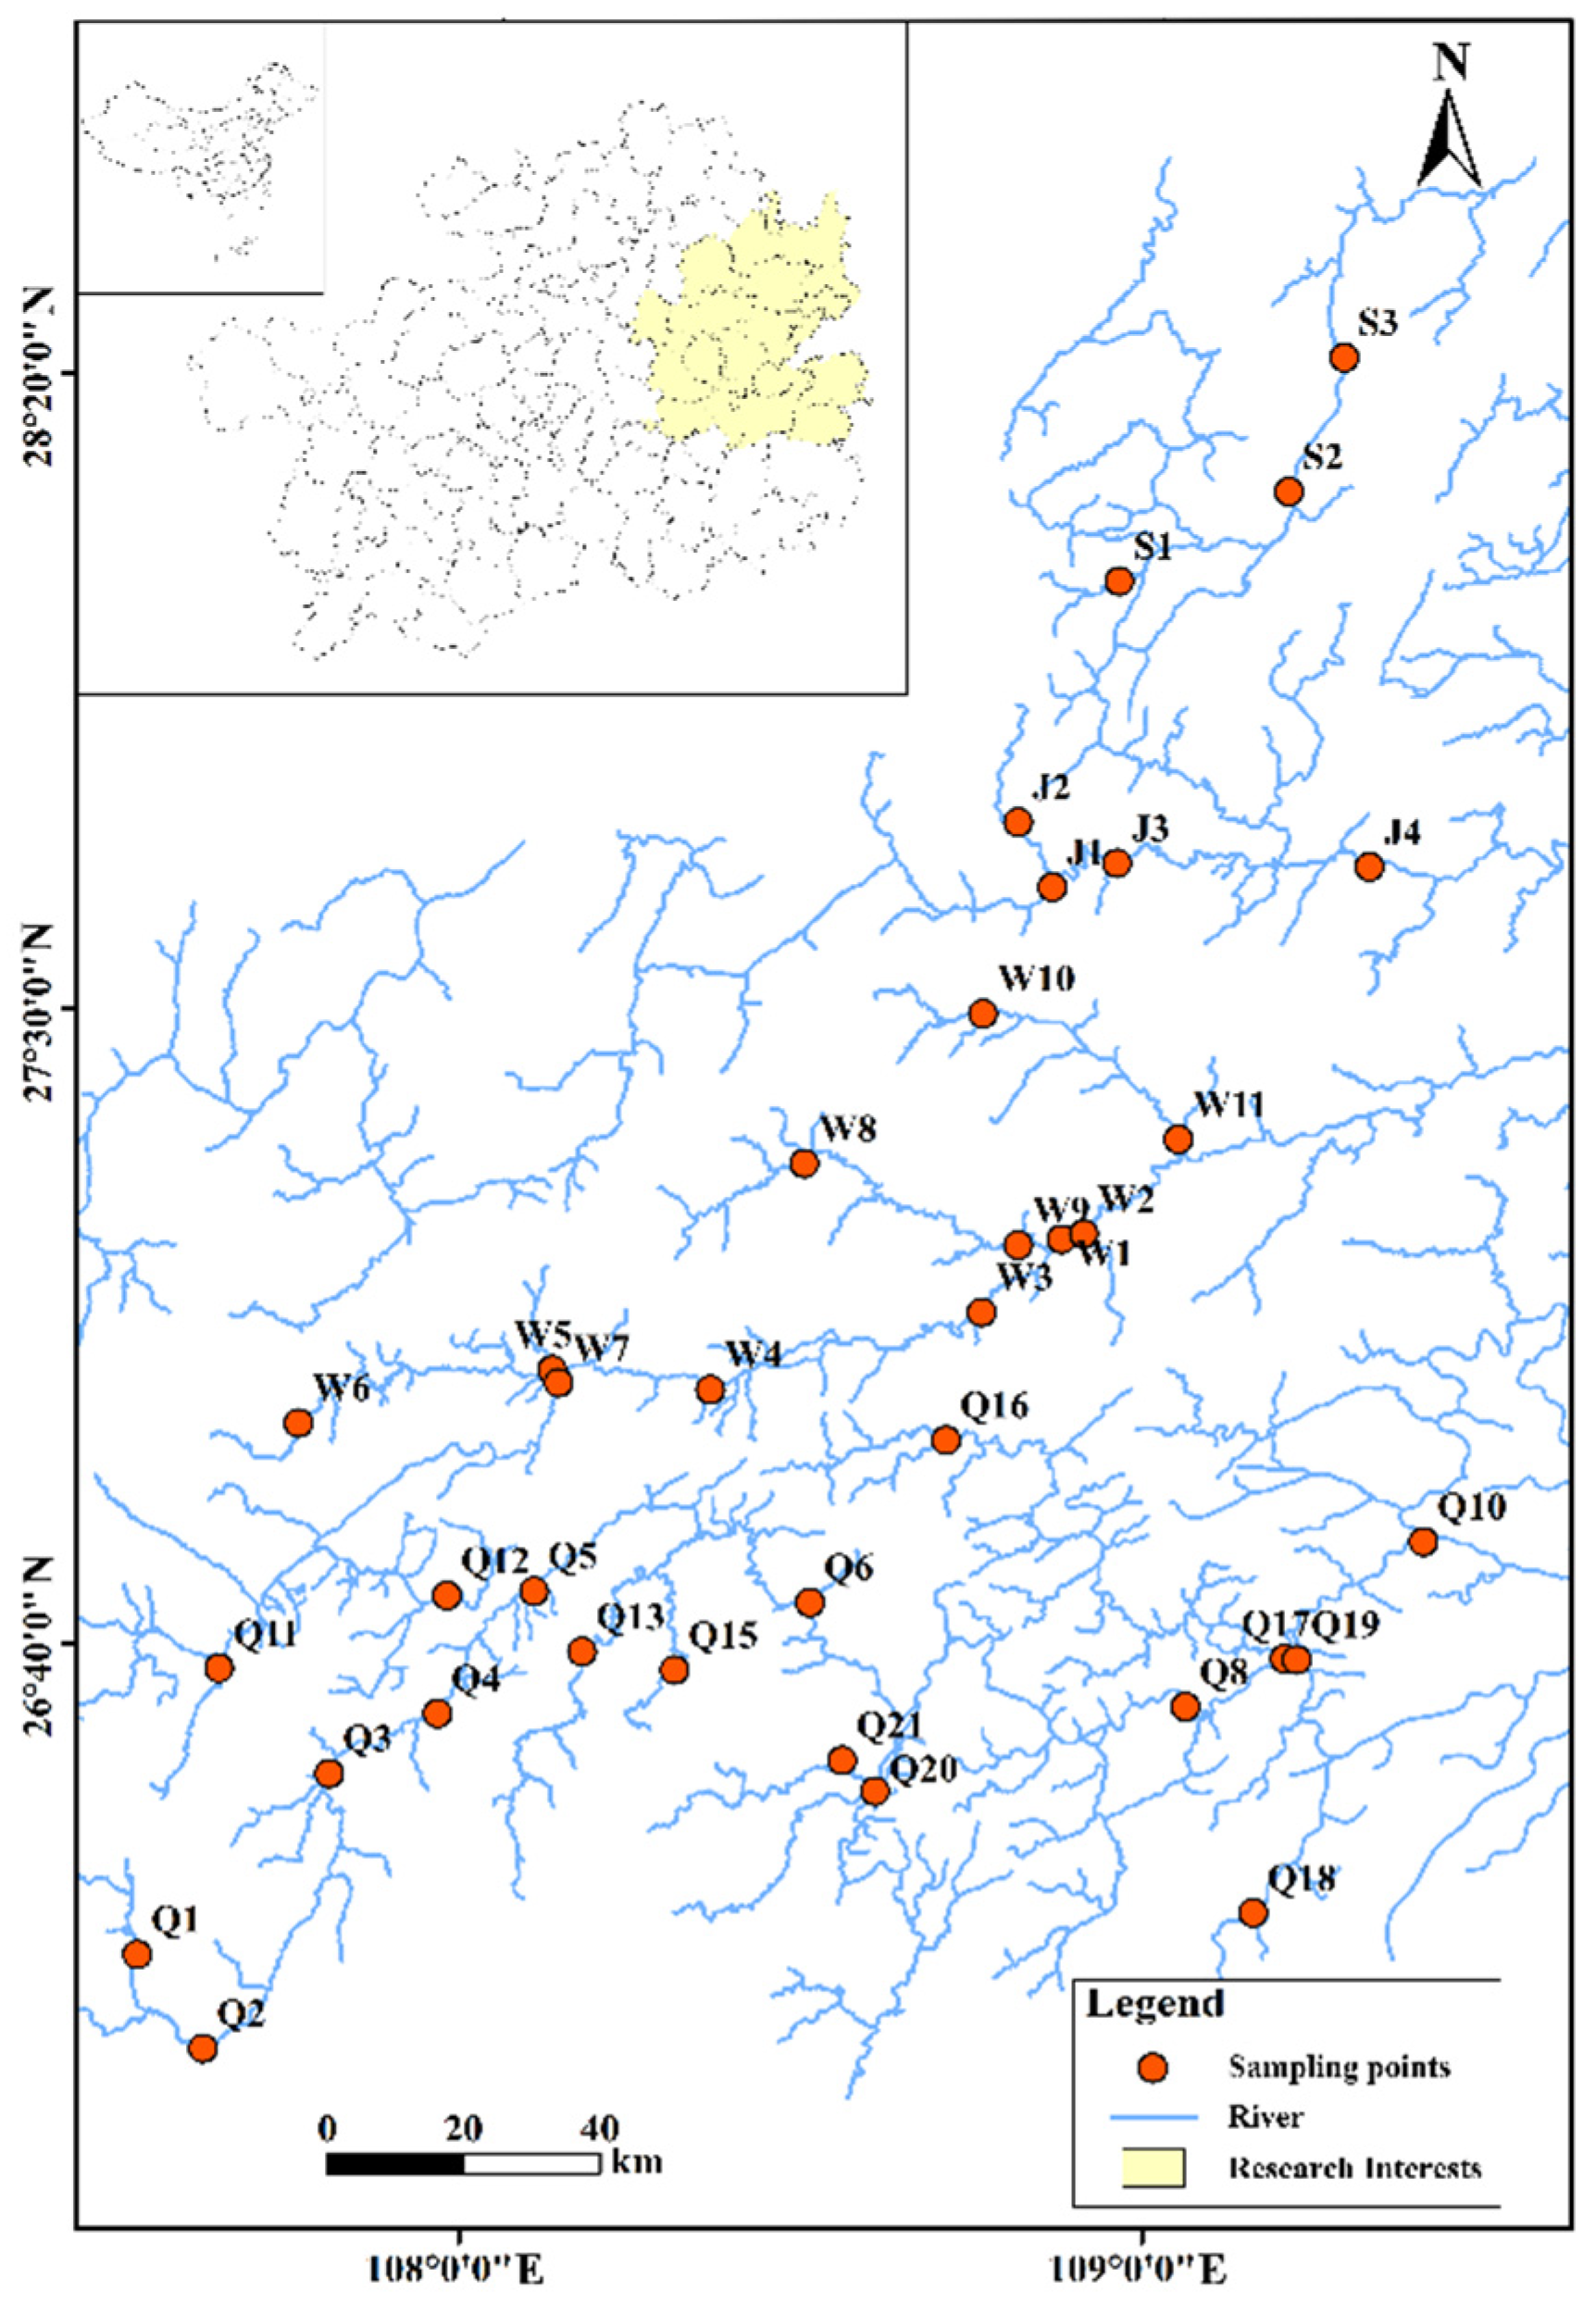
2.1. Sampling Site

The Qingshui River, which is the upper reaches of the Yuanjiang River, is part of the Yangtze River system and is located approximately between 107°17′–109°35′ E and 26°14′–27°4′ N. The fish specimens collected for this study were gathered along the river in Guizhou Province. The focus of the catch collection included the morning markets in the counties and townships along the river as well as fishing boats operating in the area. Notably, sampling points in Bajie Township yielded a higher number of catches. A total of 36 sampling points were established in this section of the river (Figure 1 and Table S1), most of which were situated at the confluence of dry river channels and tributaries, both upstream and downstream of reservoirs and dams, as well as near coastal counties.

Sampling Method

All sampling equipment was disinfected with a 10% bleach solution prior to sampling at various sites [15]. A total of 15 L of water samples were collected from each sampling point and combined, resulting in a final concentrated volume of 1 L. The samples were categorized into three layers: the surface layer (0 m), the middle layer (2.5 m), and the bottom layer (5 m). The collected water samples were refrigerated within 24 h and sent to the laboratory, where they were filtered using a vacuum pump and concentrated on a 0.45 μm mixed cellulose filter membrane. All equipment is disinfected and rinsed with distilled water before use to prevent cross-contamination. Finally, the membrane is stored at −80 °C in preparation for the subsequent DNA extraction. After each sample is extracted and filtered, the nozzle filter, tweezers, and water bottle must be soaked in sterile water for 5 min prior to use [16].

2.2. Data Analysis

2.2.1. DNA Analysis and Species Identification

A window of 10 base pairs (bp) is established. If the average mass value within this window is lower than 20, the back-end bases are removed, and sequences shorter than 50 bp after quality control (using Trimmomatic v0.39) are filtered out. Based on the overlap from paired-end sequencing, the paired sequences are merged into a single sequence. The minimum overlap length is set at 10 bp, and the maximum allowed mismatch ratio in the overlap region is 0.2. Non-conforming sequences are eliminated using FLASH v1.2.7, and the sequence orientation is adjusted according to the labels and primer sequences to obtain high-quality sequences for each sample. OUT clustering is performed on high-quality sequences at a 98% similarity threshold [17]. Chimeric sequences are removed during the clustering process, and OTU tables are generated using Perl v5.18.2, Usearch v10, and QIIME v1.9.1. The generated OTUs will be annotated in a self-built freshwater fish database based on the NCBI nt database (to be established in October 2021) to obtain information on fish species, with classification based on the Fishbase database.

2.2.2. Statistical Analysis

After removing the highly identical sequence data for non-fish organisms (such as bacteria, birds, amphibians, mammals, etc.), the remaining filtered data were compared with the fish sequences, showing a ≥ 97%, an E-value ≤10, and the OTUs corresponding to the same species were combined. Data were compared with the fish sequences, showing a ≥ 97%, an E-value ≤ 10, and the OTUs corresponding to the same species were combined. Excel was used to calculate the proportion of sequence numbers for each species in each sample. Fish classification information was improved by referring to the fish-based database “https://www.fishbase.in/home.htm” (accessed on 1 September 2024). Finally, we used R software (version 3.1.3 to plot histograms of fish composition at each sample point; packages: gg plot 2, pile, scatter plot 3d, ellipse, map tool, vegetarian and ape. map tool, vegetarian and ape) [18].

2.3. Alpha Diversity Analysis

For this study, the Chao1 index, Observed_species index, Shannon index, Simpson index, and Pielou_J index were selected to reflect community richness, species diversity, and species evenness [19].
Chao1:
Chao 1 = Sobs + n 1 ( n 1 1 ) 2 ( n 2 + 1 )
(Chao1: the estimated number of OTUs; Sobs: the observed number of OTUs; n1: the number of OTUs with only one sequence; n2: the number of OTUs with only two sequences.)
Observed_species:
S = n
(S: the species richness index; n: the total number of species types with an individual number (abundance) greater than 0.)
Shannon:
H = i = 1 S o b s n i N   ln n i N
(H: the Shannon index; Sobs: the total number of species; ni: the number of individuals of the i-th species; N: the total number of individuals of all species.)
Simpson Index:
D = i = 1 S o b s n i ( n i 1 ) N ( N 1 )
(D: the Simpson index; Sobs: the total number of species; ni: the number of individuals of the i-th species; N: the total number of individuals of all species.)
Pielou_J:
J = H l n S
(J: the Pielou_J index; H: the Shannon diversity index; S: the number of species.)
All statistical analyses and graphical visualizations were implemented in the open-source R statistical environment (version 4.3.1), utilizing the ggplot2 package for graphical representations and the vegan package for multivariate analyses.

2.4. Beta Diversity Analysis

In this study, dimensionality reduction techniques were employed to identify potential principal components that influence variations in community composition across the samples. The Principal Coordinates Analysis (PCoA) of community composition at different sampling points utilized the Bray–Curtis distance algorithm to examine differences and similarities in community composition among various groups. The PCoA was conducted using the R “ape” package in conjunction with the “ggplot2” package [20].

2.5. Redundancy Analysis of Environmental Factors

In this study, redundancy analysis (RDA) was employed to examine the relationship between fish populations and environmental factors. The variables analyzed included WT, pH, DO, M n O 4 , N H 3 N, N O 2 , TP and TN. This analysis aimed to investigate the effects of these environmental factors on fish species diversity across various habitat conditions in the Qingshui River. The RDA data were standardized using Hellinger transformation in R software, calculated with the vegan package, and subsequently visualized using the ggplot2 package [21].

3. Results

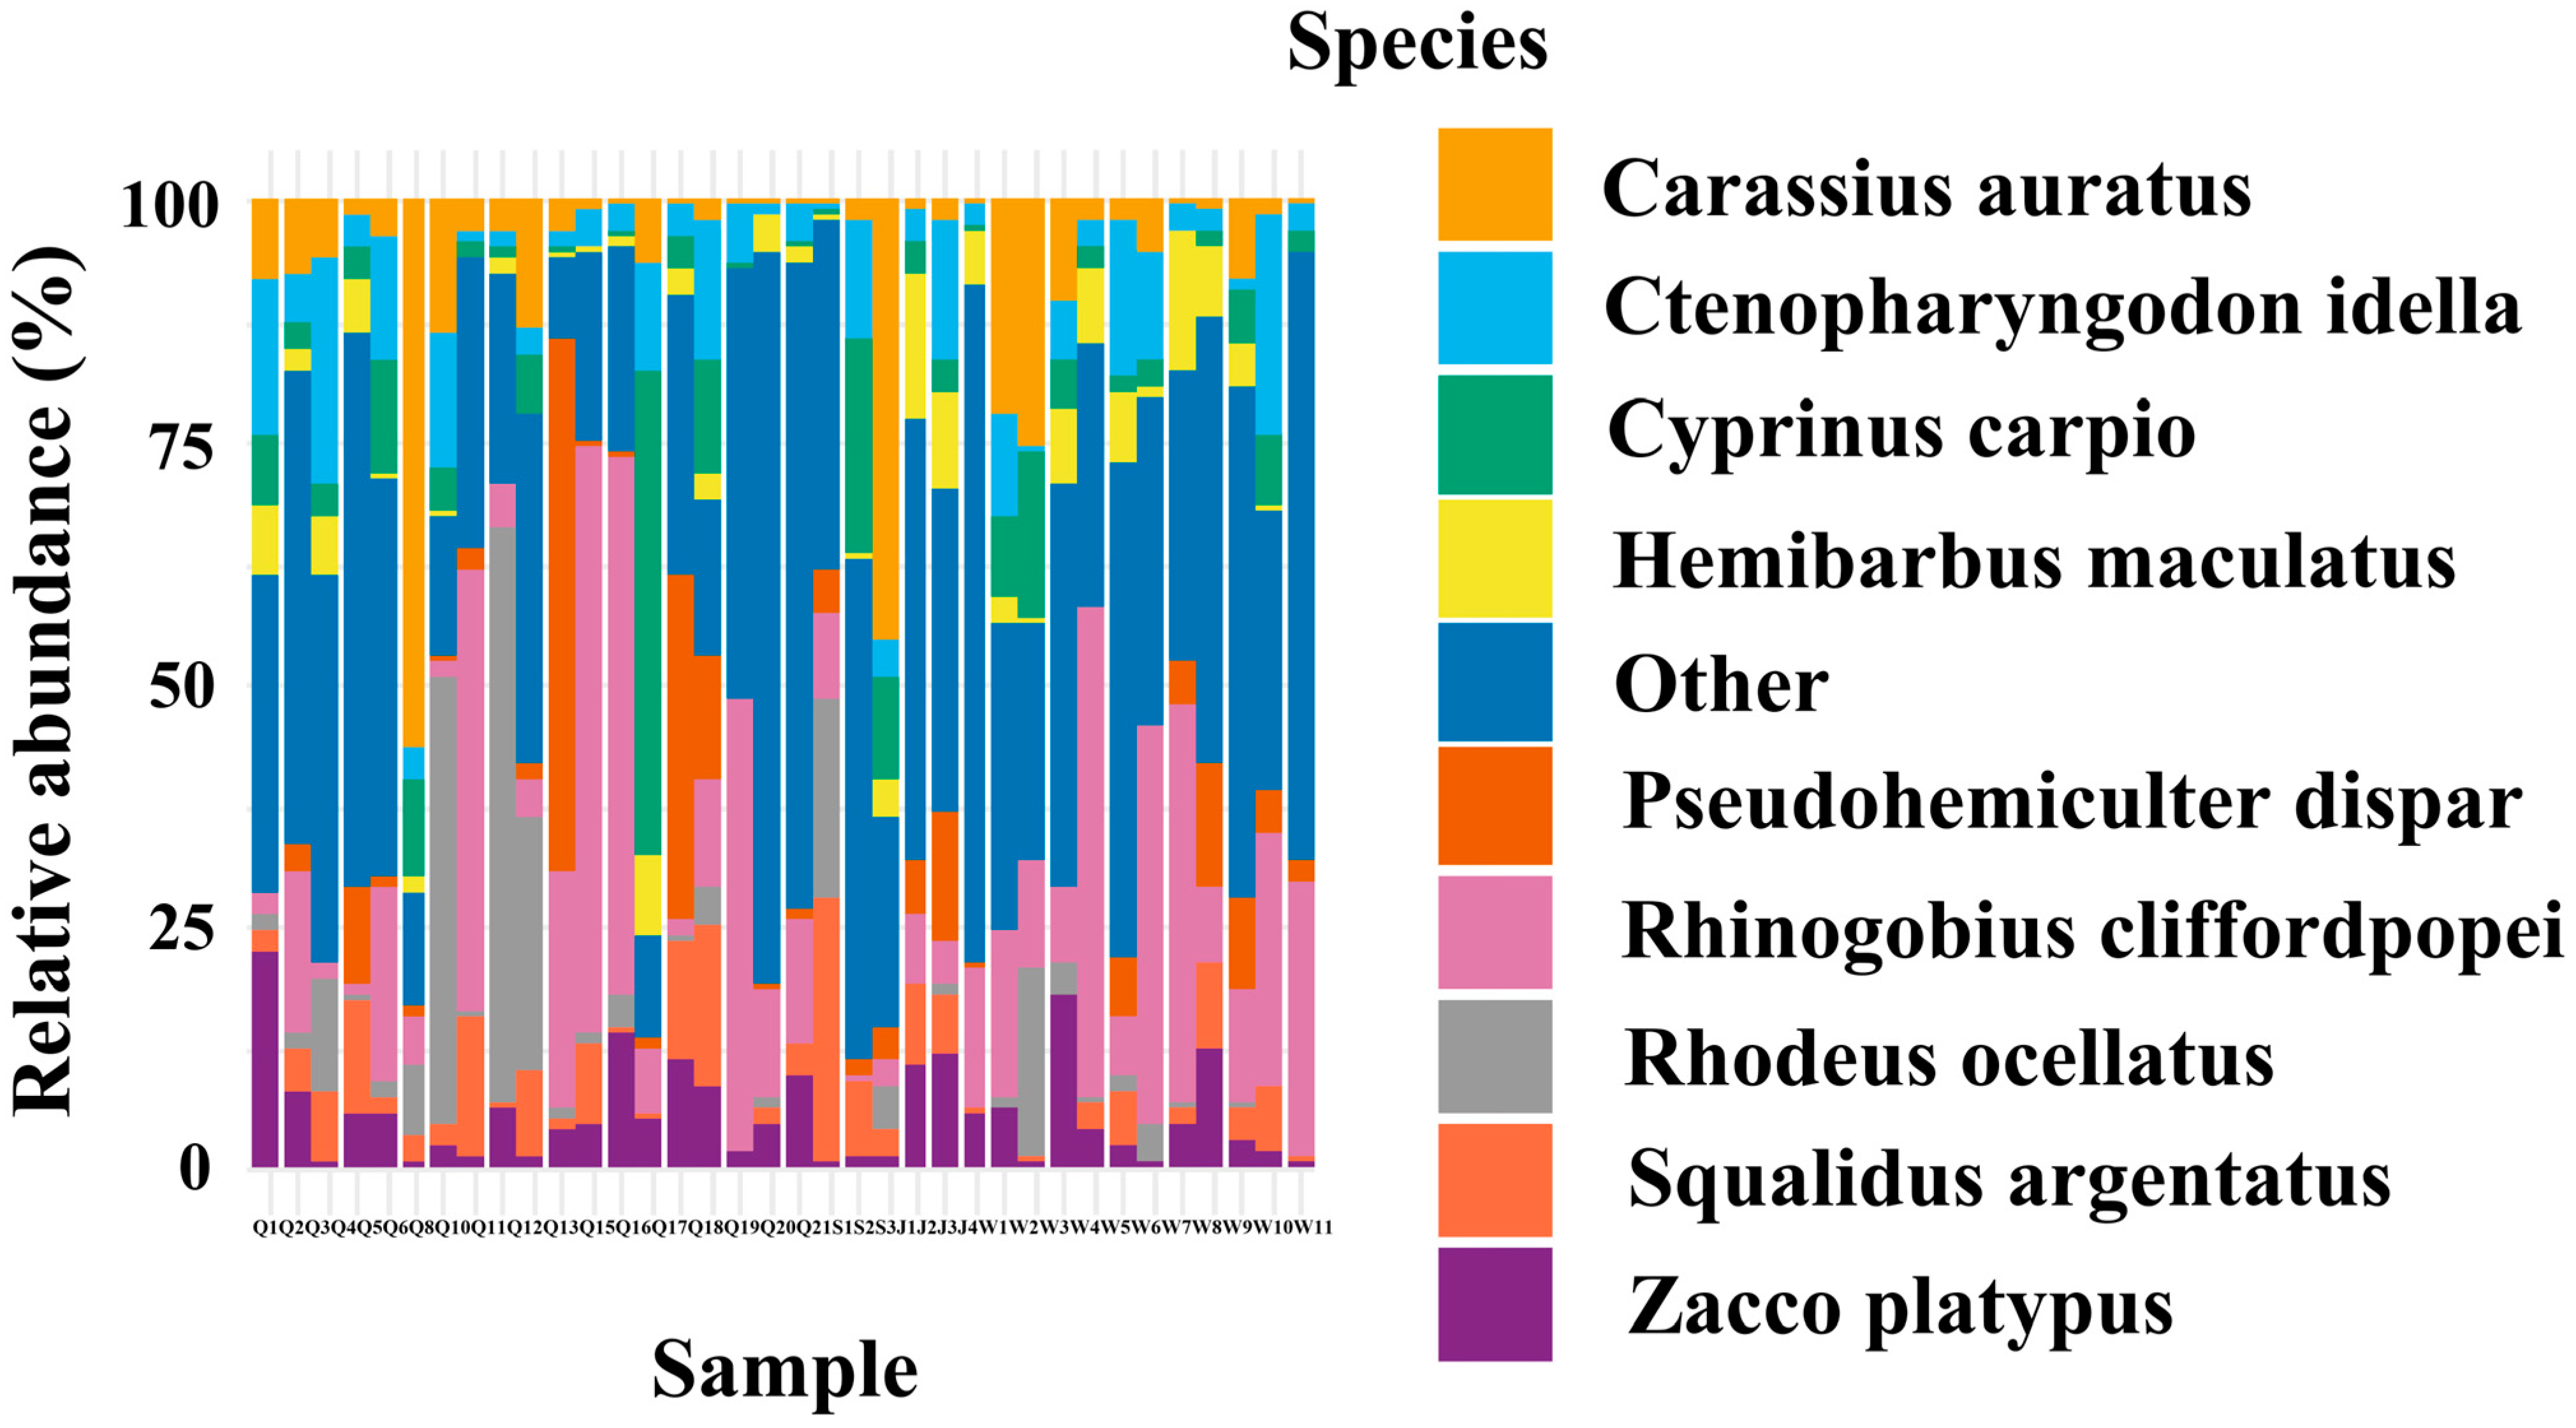
3.1. Composition of Fish Community

Three replicates were established at 36 sampling points in the Qingshui River, and all samples were successfully amplified, followed by high-throughput sequencing after quality inspection. A total of 259,728 OTUs were obtained, and 91 fish species from 18 families and seven orders were identified through BLAST (2.2.24+) analysis and manual correction (Table 1). Specifically, there were 66 species in the order Cypriniformes, two species in the order Synbranchiformes, one species in the order Beloniformes, one species in the order Cyprinodontiformes, 15 species in the order Siluriformes, and one species in the order Anabantiformes, along with five species in the order Centrarchiformes. Cypriniformes dominated the findings, accounting for 72.5% of the total species identified. The species abundance diagram for each sampling point is presented in Figure 2.

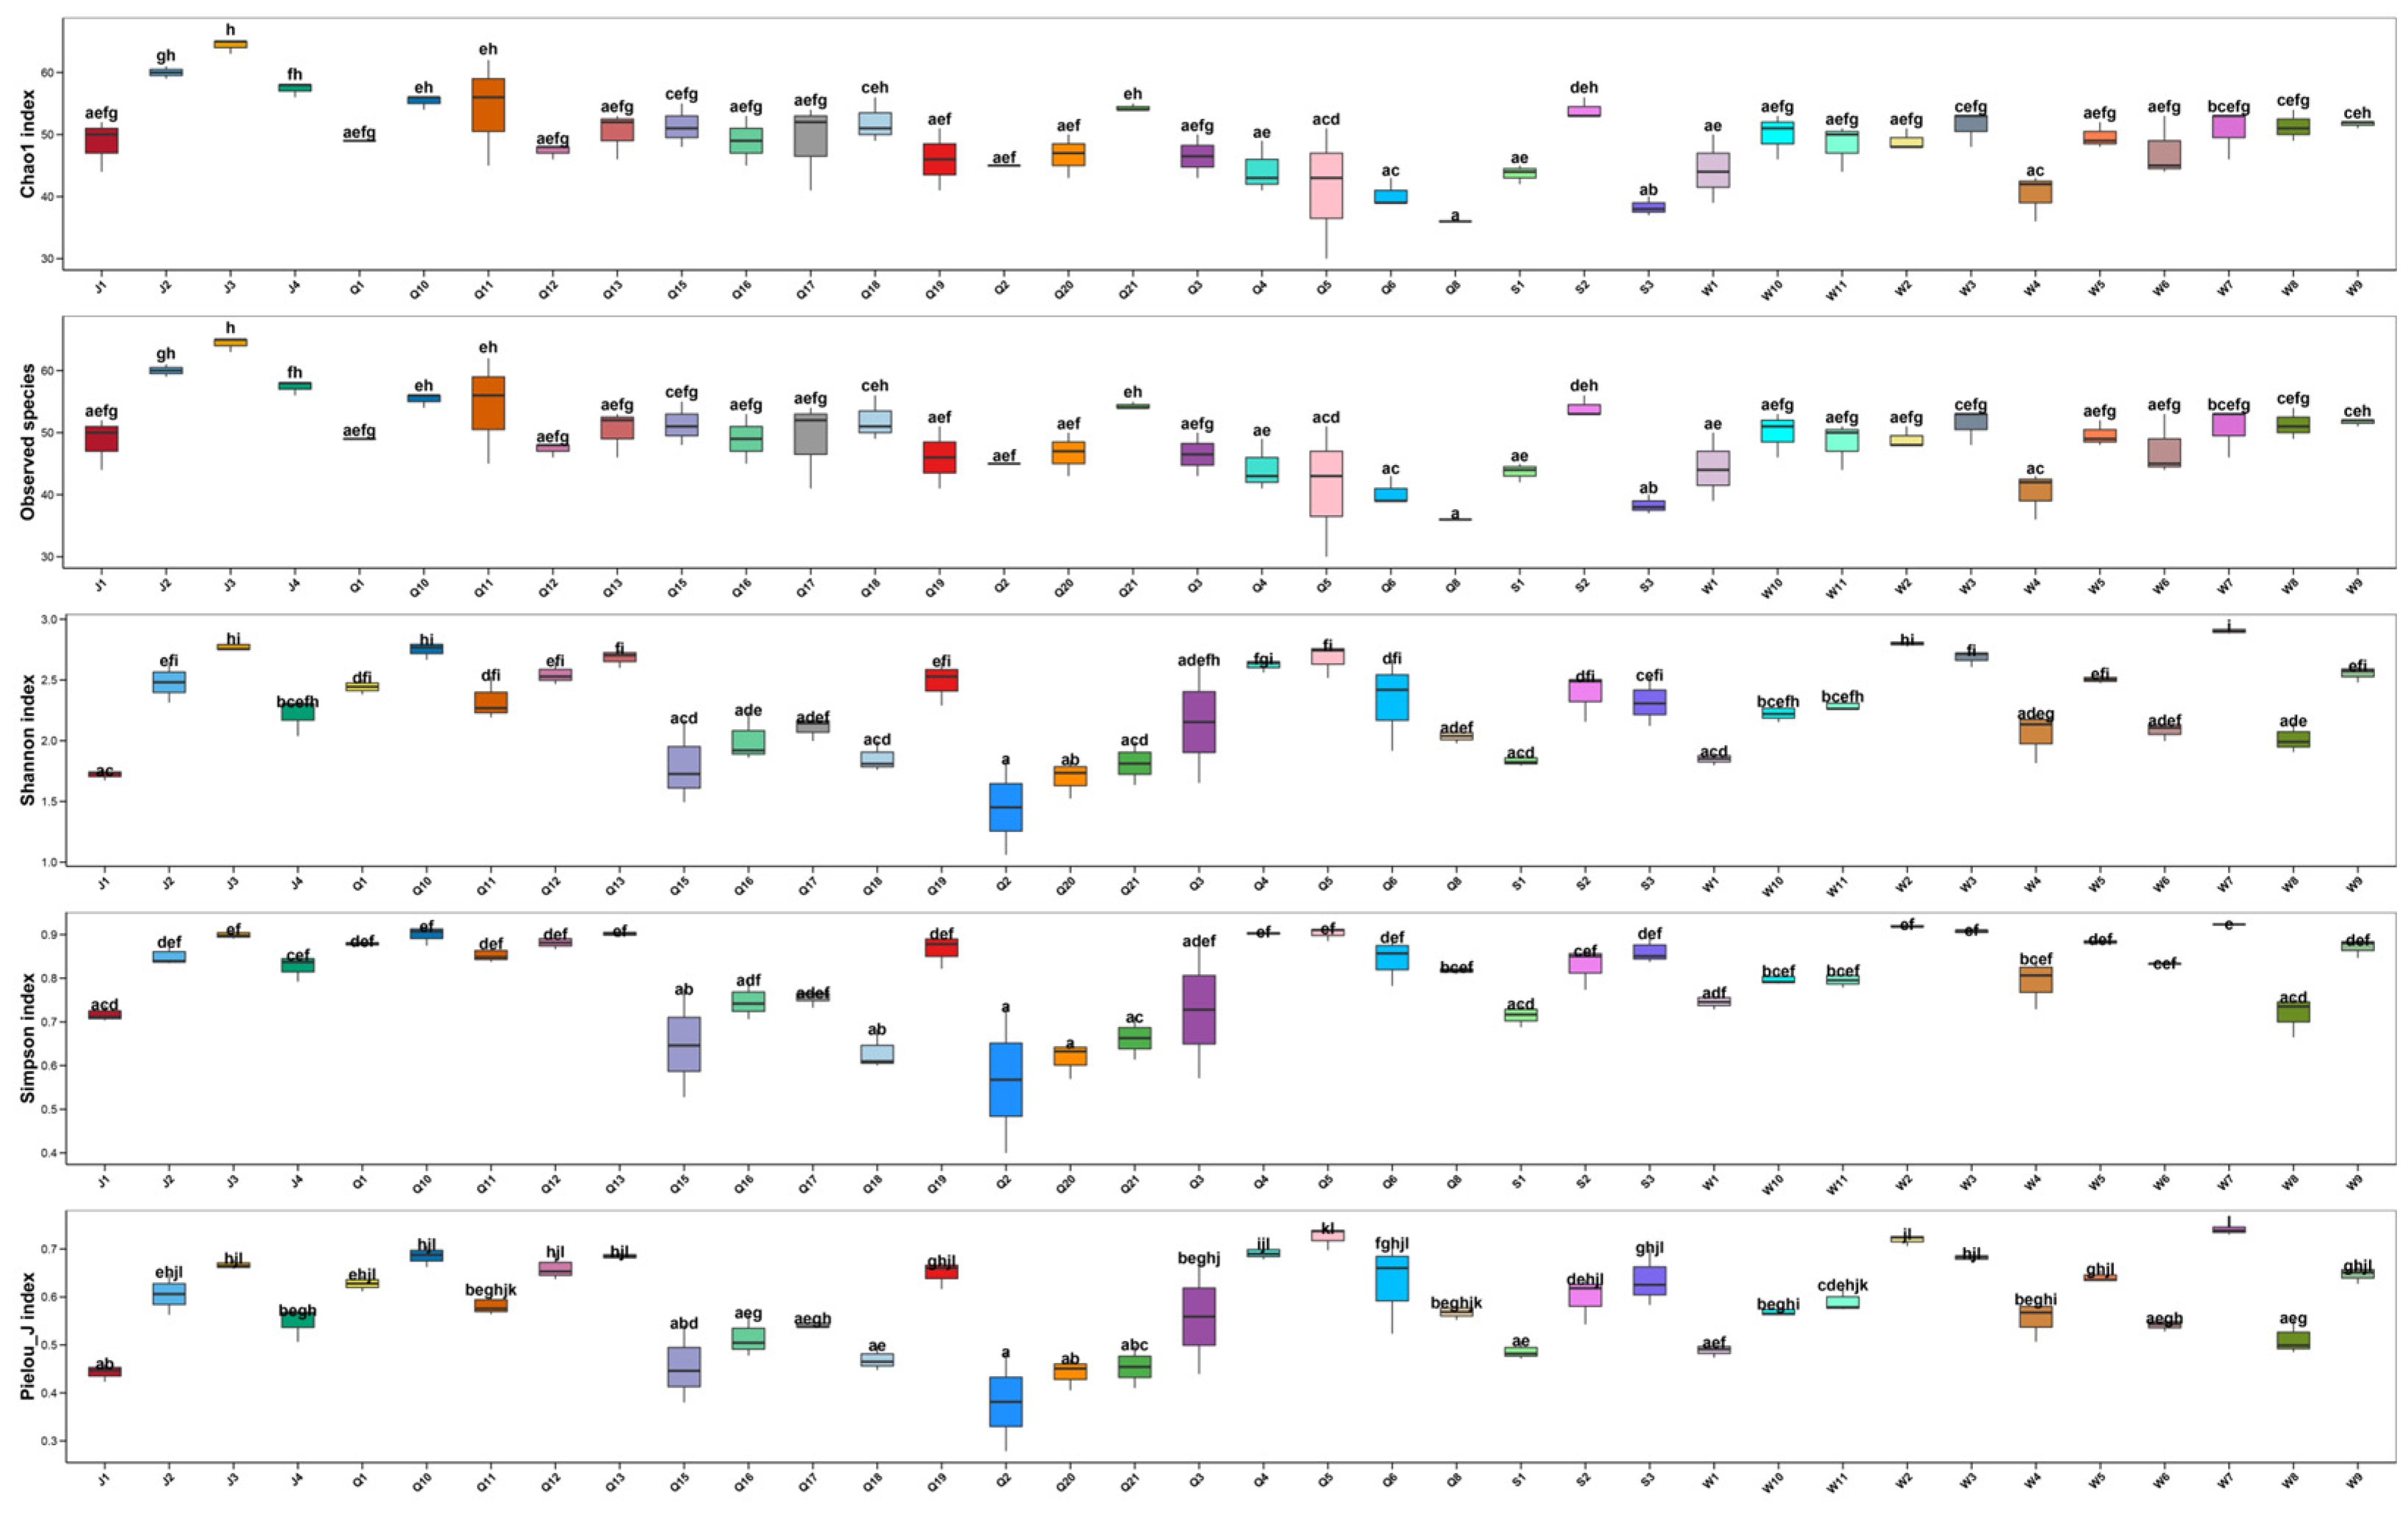
3.2. Alpha Diversity
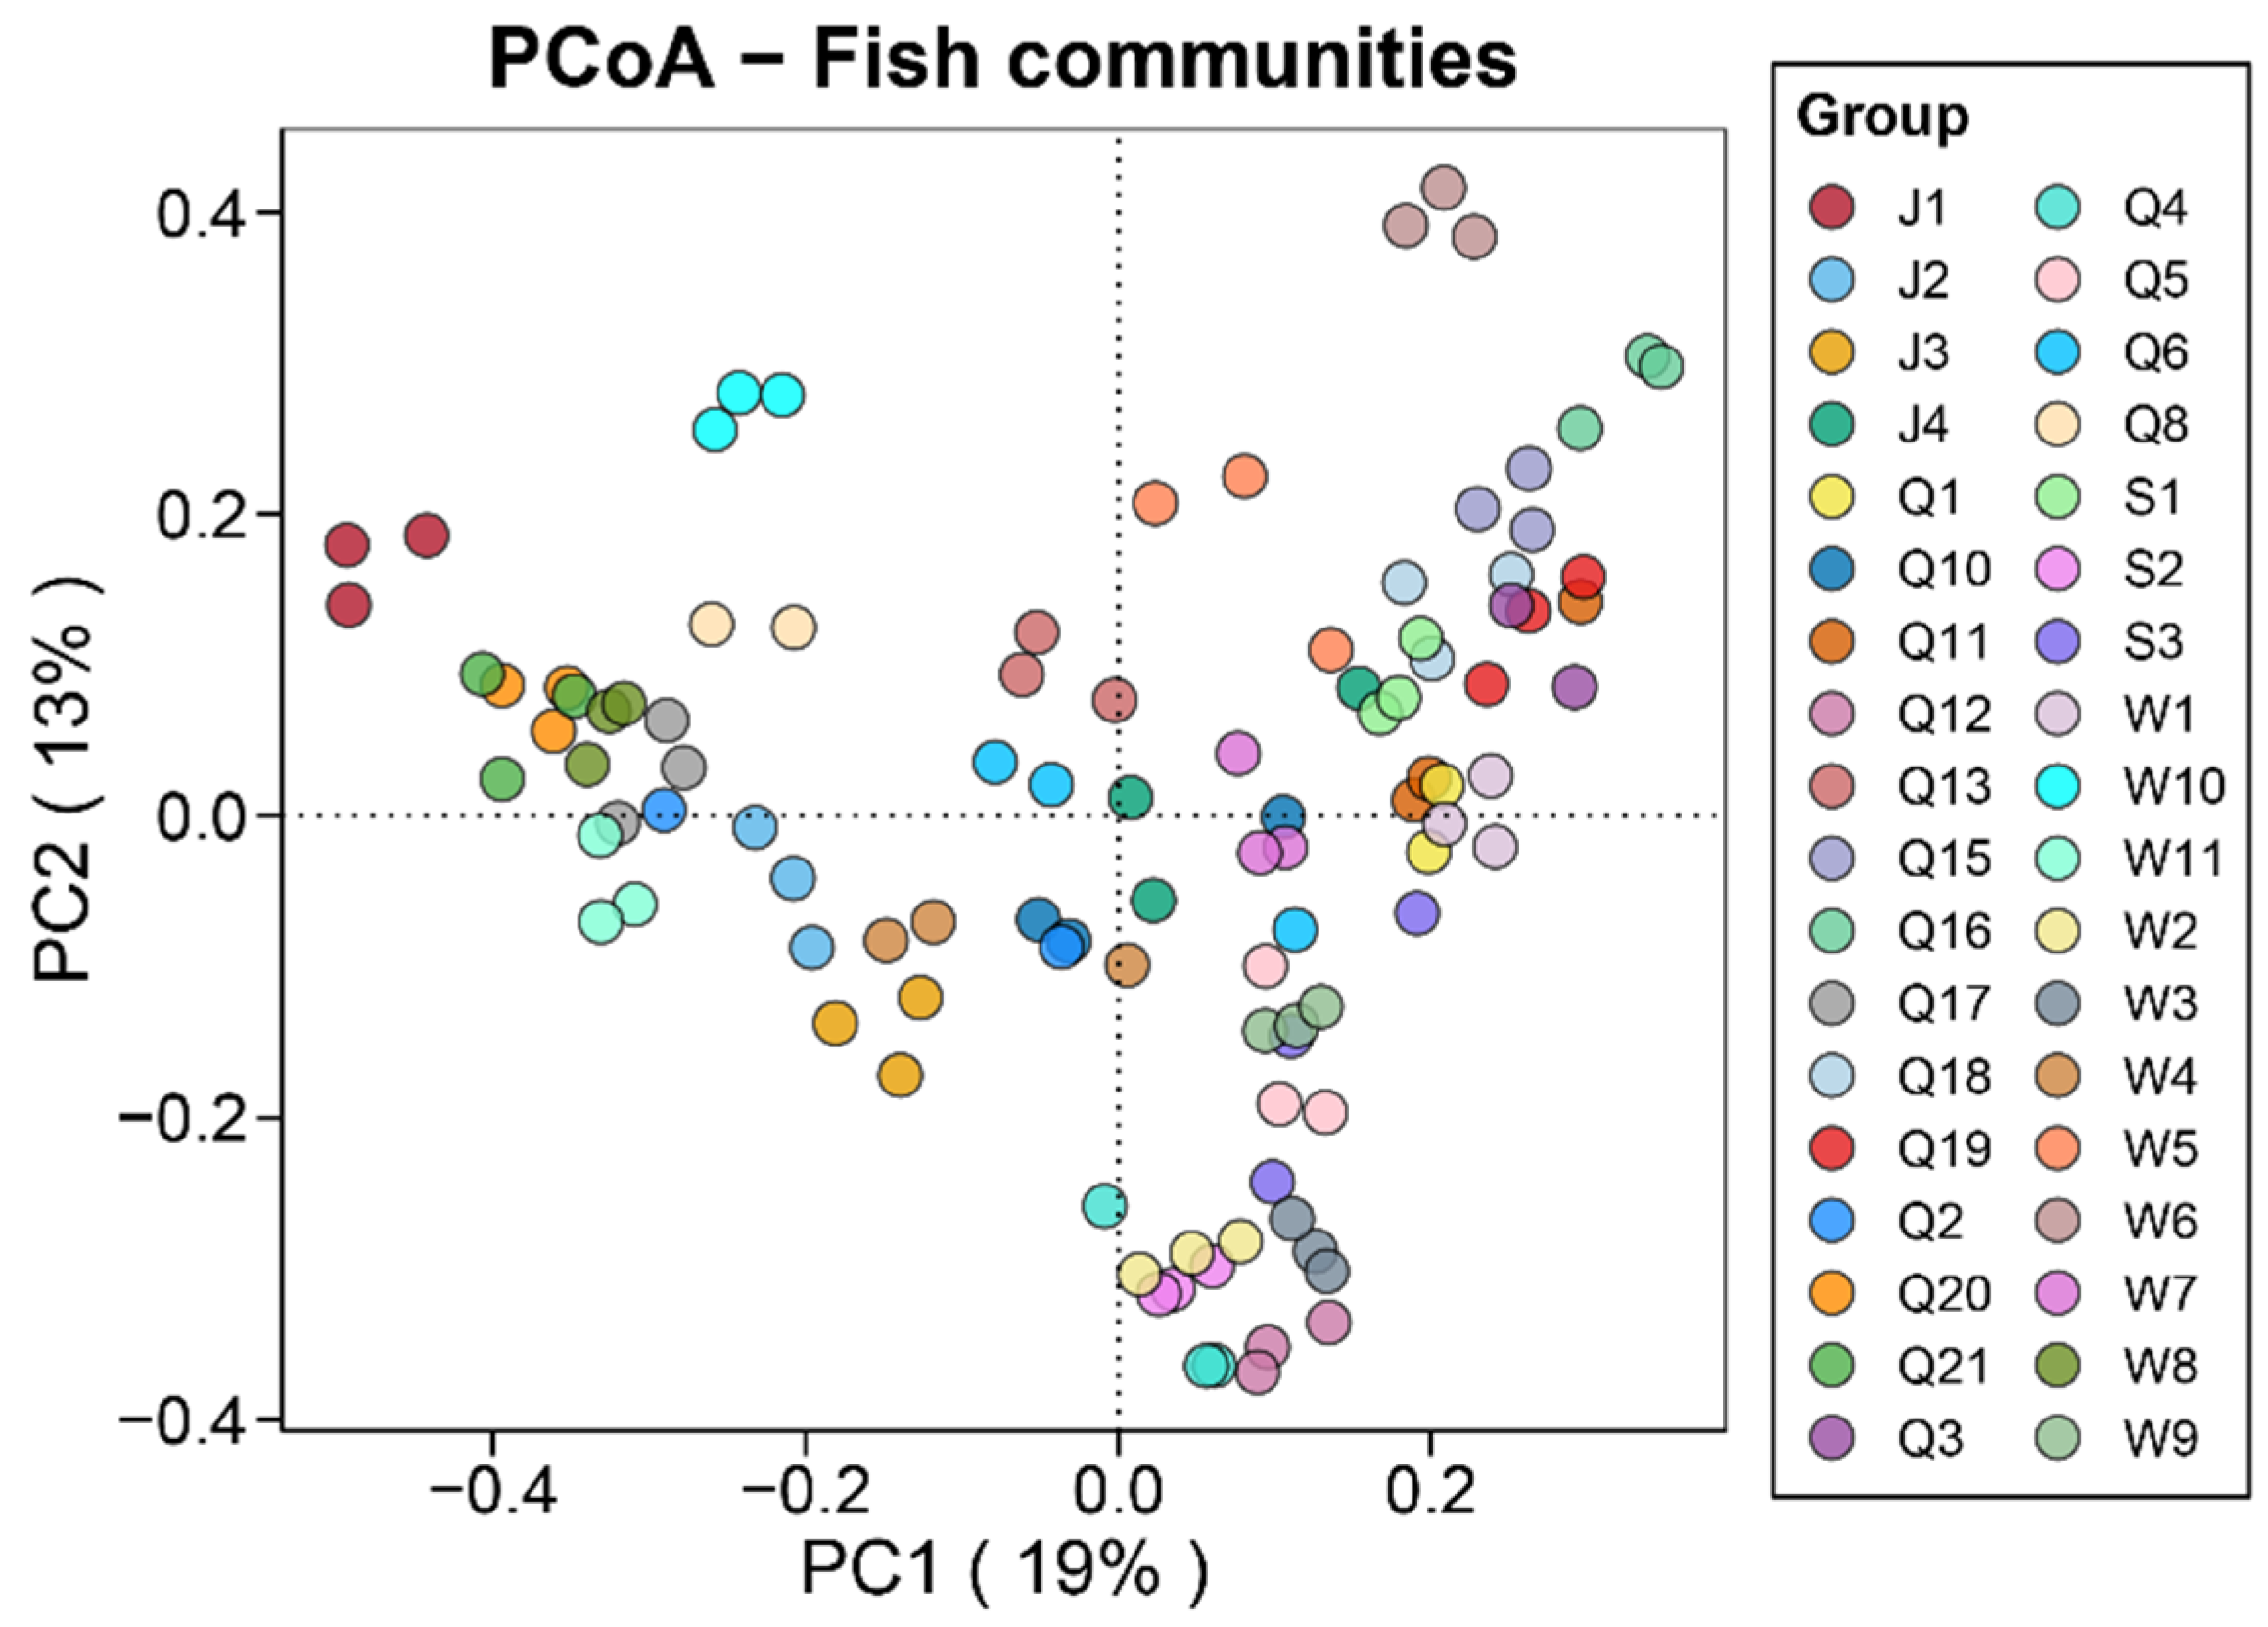
There are significant differences in the Chao1 index, Observed_species index, Shannon index, Simpson index, and Pielou_J index at each sampling point in the Qingshui River (p < 0.05) (Figure 3). Among the Chao1 index and Observed_species index, the maximum value is observed at J3, which is 64, while the minimum value occurs at Q8, which is 36. The maximum and minimum values for the Shannon index, Simpson index and Pielou_J index both appear in W7 and Q2, respectively. The maximum value of the Shannon index is 2.91, and the minimum value is 1.45. The maximum value of the Simpson index is 0.92, while the minimum value is 0.57. Additionally, the maximum value of Pielou_J index is 0.74, and the minimum value is 0.38.

3.3. Beta Diversity

Spatial differences in fish community structure were assessed using PCoA, and the data were transformed using Hellinger transformation prior to mapping. Each point represents a sample, and three parallel sets are included in each group, as illustrated in Figure 4.

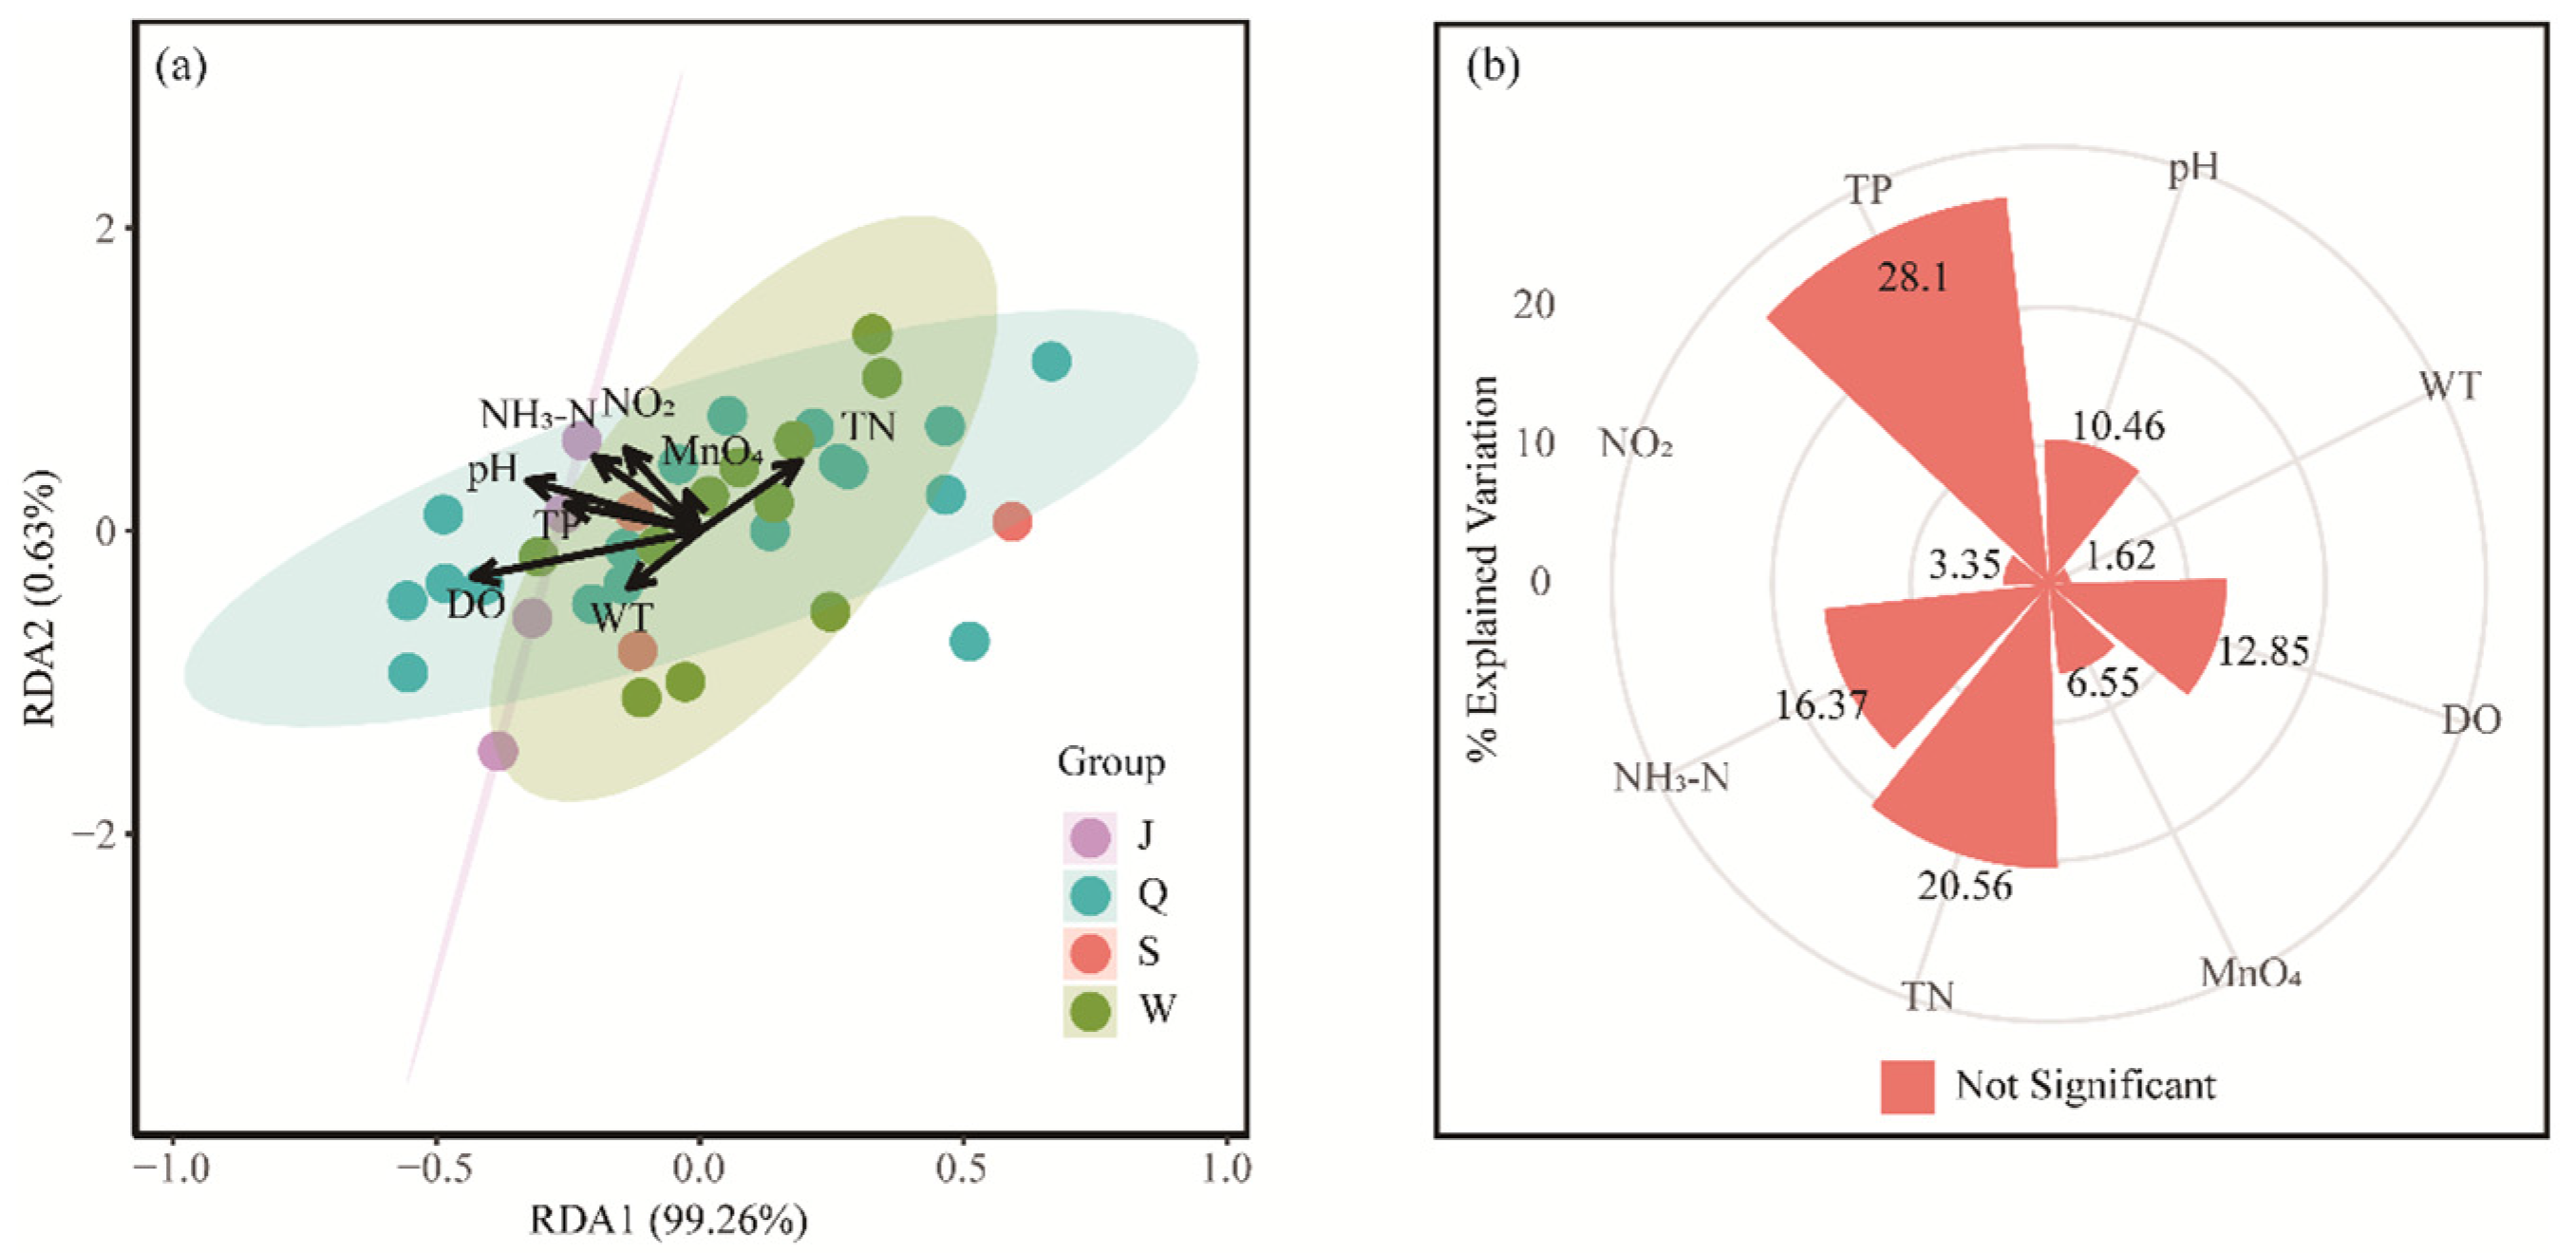
3.4. Redundancy Analysis

The water temperature is approximately 25.45 °C (with a standard deviation of 2.4 °C), and the pH level is around 7.67, (with a standard deviation of 0.38), indicating weak alkalinity. RDA was conducted on various parameters of the Qingshui River, including WT, pH, DO, M n O 4 , N H 3 N, N O 2 , TP and TN, as illustrated in Figure 5. In Figure 5a, RDA1 accounted for 99.26% of the variation in fish community structure, while RDA2 contributed only 0.63%. This suggests that RDA1 represents the primary environmental gradient influencing fish community dynamics. The longer vectors for TP, TN and the MnO- 4 indicate their significant roles in community variation. Furthermore, the community structure exhibited clear differentiation among the various sampling points (J, Q, S, W), suggesting that fish communities in different water bodies are influenced by water quality conditions, which may also reflect some degree of spatial heterogeneity. Figure 5b further quantifies the contribution of environmental variables to the variation in fish communities. The results indicate that TP accounted for 28.1% of the community variation, highlighting the significant impact of primary productivity on fish community structure. In contrast, WT explained the least amount of community variation at 1.62%, suggesting that WT has a weak direct regulatory effect on fish community structure. It is important to note that the explanatory rates of all environmental factors did not reach statistically significant levels. This finding implies that while water quality factors influence community structure to some extent, individual environmental factors may not independently determine community variation. Instead, the ecological patterns of fish communities are likely regulated by more complex ecological processes.

4. Discussion

4.1. eDNA Technology Enriches Historical Monitoring Data

eDNA technology is potentially effective for large-scale monitoring and can more accurately reflect the composition of fish species at sampling sites [22]. In this study, eDNA technology was employed to monitor fish composition in the Qingshui River, resulting in the detection of a total of 91 fish species. This represents an increase of 20 species compared to historical detection records [23]. In addition, to enhance the effectiveness of the study, we conducted a traditional investigation of the Qingshui River, employing gillnet fishing techniques to collect a total of 68 fish species (Table S2). Compared to traditional methods, environmental DNA (eDNA) technology detects a greater number of species and offers several advantages, including the ability to identify elusive species and address the limitations of conventional techniques [24].
There are 66 species of Cypriniformes, which account for 72.5% of the total fish species in Qingshui. Following this, there are 15 species of Siluriformes, five species of Centrarchiformes, and two species of Synbranchiformes, representing 16.5%, 5.5%, and 2.2%, respectively. Beloniformes, Cyprinodontiformes, and Anabantiformes have the fewest species, collectively accounting for 1.1% of the total. Several factors contribute to the changes in fish populations, including dam construction, overfishing, the introduction of non-native species, and alterations in the aquatic environment. Among these, overfishing and the introduction of exotic species are the primary causes [25]. In addition, a study of the Sanbanxi Reservoir in the Qingshui River Basin found that the hydrological characteristics had changed. Compared to historical data, the population of fish that prefer flowing water environments and typically inhabit the riverbed has decreased [26].

4.2. Analysis of Differences in Fish Community Structure in the Qingshui River

In the fish monitoring of the Qingshui River, 91 species of fish from 18 families and seven orders were identified. Among these, a significant number of cypriniformes were observed, including Acrossocheilus jishouensis, Acrossocheilus monticola, Bangana rendahli, Spinibarbus sinensis, Hemiculterella sauvagei, Microphysogobio tungtingensis, Rhinogobio cylindricus, Saurogobio punctatus, Squalidus wolterstorffi, Homatula potanini, Cobitis macrostigma, Leptobotia elongata, Sinogastromyzon hsiashiensis [27]. In addition, the survey detected several endangered fish species, including Onychostoma lini, Leptobotia elongata, Siniperca roulei and Siniperca undulata [28]. The fish fauna of the Qingshui River is notable for its richness in endemic and endangered species, highlighting its significant conservation value.
The study’s results indicated that two invasive species, Sinibrama macrops and Gambusia affinis, comprised only 2.2% of the fish fauna in Qingshuijiang. Consequently, the fish fauna in the Qingshui River was predominantly composed of indigenous species, aligning with the findings of Dai Yinggui’s survey [29]. In addition, Siniperca scherzeri, one of the three largest cultured species of Siniperca siniperca in China, was also detected. This species is commonly referred to as the “freshwater grouper” [30]. Siniperca siniperca is a fish endemic to East Asia and is widely distributed across various river systems in China. In Guizhou Province, the most concentrated populations of Siniperca siniperca are found in the Qingshui River and the Dulu River [10].

4.3. Effects of Spatial Variations in Environmental Factors on Fish Communities

Fish diversity is typically influenced by a range of environmental factors, including temperature, DO, pH, etc. [31]. In this study, in addition to pH and DO, TN, TP, N O 2 and M n O 4 had the most significant impact on environmental conditions. Overall, the water quality of the Qingshui River is classified as weakly alkaline, in accordance with the “Surface Water Environmental Quality Standard” (GB 3838-2002) [32]. This study included 36 sampling sites, with significant variation in altitude. Different altitudes can lead to changes in water temperature, dissolved oxygen levels, and other environmental factors, which may indirectly influence fish diversity [33]. Temperature differences directly impact fish spawning. In regions with varying elevations, there is often a time lag in reaching optimal water temperatures for spawning. Achieving suitable spawning temperatures quickly is more conducive to fish reproduction [34].
TP is the overall concentration of phosphorus in water and serves as an indicator for assessing the organic matter content in aquatic environments [35]. TN is a crucial metric for evaluating eutrophication in rivers, lakes, and reservoirs. It encompasses various forms of nitrogen in water, including nitrates, nitrate nitrogen, inorganic ammonia salts, nitrite nitrogen, dissolved ammonia, and organic nitrogen compounds [36]. Variations in TP and TN levels directly influence the structure and abundance of algal communities. Excessive algal growth can obstruct sunlight from penetrating the water column and deplete dissolved DO levels, significantly degrading water quality [37]. N O 2 is a major environmental pollutant in the freshwater aquaculture environment, which has a negative impact on the growth of aquatic species [38]. The high reproductive density of aquatic organisms, the large amount of food residue and feces, and the poor exchange of bottom water contribute to the accumulation of organic matter in the water, leading to hypoxia at the bottom. This process hinders nitrogen conversion and adversely affects the health of the aquatic environment [39]. MnO4 kills or inhibits certain microorganisms [40]. In addition, MnO4 chemically reacts in various water conditions, removes contaminants from water and improves water quality [41].
Changes in environmental factors significantly affect aquatic biodiversity [42]. Since 2000, mining enterprises in the “Manganese Triangle” region have been directly discharging untreated industrial wastewater and mineral waste into the Qingshui River. This practice has led to severe pollution of the river’s water quality, degradation of the surrounding soil, and contamination of crops, thereby posing a serious threat to the safety and health of drinking water for both people and livestock in the area [43]. The industrial wastewater entering the Qingshui River alters the environmental factor indices of the water body, significantly impacting the health of the aquatic environment and the diversity of fish species in the river [9].

5. Conclusions

This paper focuses on the study of fish in the Qingshui River. Utilizing environmental DNA (eDNA) technology, we detected 91 species of fish, which is 20 more than the historical record, with Cpriniformes being the most prevalent group. Additionally, we analyzed multiple factors influencing changes in fish populations. In terms of fish community structure, we identified a variety of cyprinoid fish and endangered species, with native species predominating and invasive species comprising a minimal proportion. Environmental factors exert complex effects on fish communities, influencing fish diversity by impacting algal growth and water quality. Overall, eDNA technology is efficient and minimally invasive, providing a scientific foundation for fish conservation and future monitoring efforts.

Supplementary Materials

The following supporting information can be downloaded at: https://www.mdpi.com/article/10.3390/fishes10040165/s1, Table S1: Latitude and longitude table of sampling points; Table S2: Table of Fish Species in the Qingshui River Captured Using Traditional Gillnet Methods.

Author Contributions

S.Z. conceived and designed the research; F.H., Z.L., Y.X., W.M., X.W., W.L., W.W. and S.Z. are sampled together; R.Z. designed and carried out the data analysis; F.H. wrote the paper; F.H. and R.Z. prepared figures; S.Z., Z.L., Y.X., W.M., X.W., W.L. and W.W. supervised the experiment and did review-editing; All authors reviewed the manuscript. Corresponding authors. Correspondence to S.Z. All authors have read and agreed to the published version of the manuscript.

Funding

This study was supported by Guizhou Provincial Science and Technology Projects (2023-ordinary107), Investigation of fishery resources and environment in key waters of southwest China (CJW2023049),Youth Foundation from Guizhou Academy of Agricultural Sciences [2023-28], Youth Foundation from Guizhou Academy of Agricultural Sciences [2021-14], and Project of Financial Funds of Ministry of Agriculture and Rural Affairs: Investigation of Fishery Resources and Habitat in the Pearl River Basin.

Institutional Review Board Statement

This study utilizes eDNA metabarcoding to monitor fish communities. All 301 experimental samples were collected from water samples, and the research did not involve direct 302 experimentation, handling, or manipulation of live animals.

Informed Consent Statement

Not applicable.

Data Availability Statement

All data generated or analyzed during this study are included in this published article [and its Supplementary Information files]. The raw sequence data reported in this paper were submitted to the NCBI Sequence Read Archive (SRA) database.

Acknowledgments

We thank Biozeron Co., Ltd. (Shanghai, China) for assisting bioinformatics analysis.

Conflicts of Interest

The authors declare no competing interests.

References

  1. Zhou, Z.N.; Tong, A.N.; Wu, Y.N.; Shui, B.N.; Hu, C.Y.; Wang, J. The impact of rare species loss on species diversity and functional diversity offish communities. Acta Ecol. Sin. 2025, 45, 252–264. [Google Scholar]
  2. Yu, Y.; Lu, J.; Xie, B.; Xie, B.; Deng, Y.Q.; Chen, S.Z.; Liu, Y.D.; Qu, X.D. Fish Community Structure and Species Biodiversity in 13 Lakes of Nanchang City. J. Hydroecol. 2021, 42, 110–118. [Google Scholar]
  3. Chen, H.D.; Zhang, H.; Fu, S.; Lin, Z.M.; Liu, C.; Chen, K.N.; Zhang, Y.G.; Mao, Z.G.; Mei, X.Y.; Liu, Z.W.; et al. Spatiotemporal patterns of fish communities and diversity in Lake Hengshui and their relationships with water environmental factors. J. Lake Sci. 2024, 36, 1447–1458. [Google Scholar]
  4. Lin, T.; Cui, F.Y.; Liu, D.M.; Ma, F.; Zhang, L.Q. Effect of food habits of some fishes on the biomanipulation in drinking water source management. J. Harbin Inst. Technol. 2006, 38, 35–37+148. [Google Scholar]
  5. Chen, B.H.; Liu, Z.W. Effect of filter-feeding omnivorous fish on zooplankton community. Ecol. Sci. 2012, 31, 161–166. [Google Scholar]
  6. Yu, J.; Liu, Z.; Li, K.; Chen, F.; Guan, B.; Hu, Y.; Zhong, P.; Tang, Y.; Zhao, X.; He, H.; et al. Restoration of shallow lakes in subtropical and tropical China:Response of nutrients and water clarity to biomanipulation by fish removal and submerged plant transplantation. Water 2016, 8, 438. [Google Scholar] [CrossRef]
  7. Joy, M.K.; Death, R.G. Predictive modelling of freshwater fish as a biomonitoring tool in New Zealand. Freshw. Biol. 2002, 47, 2261–2275. [Google Scholar] [CrossRef]
  8. Zhou, B.Z.; Wang, H.X.; Shen, P. Ecological Environmental Vicissitudes of Qingshui River Basins and Sustainable Development. Chongqing Environ. Sci. 2000, 14–16. [Google Scholar]
  9. Hu, S.R.; Mo, R.B.; Ye, G.K.; Zhou, C.H.; Yang, Z.H. Thoughts on the Sustainable Development of Ecological Fisheries in Qingshuijiang of Qiandongnan. Guizhou J. Anim. Husb. Vet. Med. 2019, 43, 23–27. [Google Scholar]
  10. Li, S. Genetic Structure and Genetic Diversity of Sinipercascherzeri Population in Qingshuijiang River. Master’s Thesis, Guizhou University, Guiyang, China, 2018. [Google Scholar]
  11. Zeng, S.; Liu, W.; Du, Q.; Wang, Y.Y.; Zhou, Z.; Hu, S.R. Early Development of Gonad and Preliminary Analysis of Foxl2 Gene Function in Qingshuijiang Cyprinus carpio. Guizhou Agric. Sci. 2020, 48, 82–86+173. [Google Scholar]
  12. Harrison, J.B.; Sunday, J.M.; Rogers, S.M. Predicting the fate of eDNA in the environment and implications for studying biodiversity. Proc. R. Soc. B 2019, 286, 20191409. [Google Scholar] [CrossRef] [PubMed]
  13. Veilleux, H.D.; Misutka, M.D.; Glover, C.N. Environmental DNA and environmental RNA: Current and prospective applications for biological monitoring. Sci. Total Environ. 2021, 782, 146891. [Google Scholar] [PubMed]
  14. Yao, M.; Zhang, S.; Lu, Q.; Chen, X.; Zhang, S.Y.; Kong, Y.; Zhao, J. Fishing for fish environmental DNA: Ecological applications, methodological considerations, surveying designs, and ways forward. Mol. Ecol. 2022, 31, 5132–5164. [Google Scholar] [PubMed]
  15. Pilliod, D.S.; Goldberg, C.S.; Arkle, R.S.; Waits, L.P. Estimating Occupancy and Abundance of Stream Amphibians Using Environmental DNA from Filtered Water Samples. Can. J. Fish. Aquat. Sci. 2013, 70, 1123–1130. [Google Scholar]
  16. Hou, T.; Lu, S.; Shao, J.; Dong, X.; Yang, Z.; Yang, Y.; Yao, D.; Lin, Y. Assessment of planktonic community diversity and stability in lakes and reservoirs based on eDNA metabarcoding—A case study of Minghu National Wetland Park, China. Environ. Res. 2025, 271, 121025. [Google Scholar]
  17. Zhang, S.; Lu, Q.; Wang, Y.; Wang, X.; Zhao, J.; Yao, M. Assessment of fish communities using environmental DNA: Effect of spatial sampling design in lentic systems of different sizes. Mol. Ecol. Resour. 2020, 20, 242–255. [Google Scholar] [CrossRef]
  18. Chen, W.; Cheng, Y.; Zhang, S.; Pan, Q. Heuristic Clustering Method Based on Neighbor-Seeds for 454 Sequencing Data. J. Softw. 2014, 25, 929–938. [Google Scholar]
  19. Li, B.; Zhang, X.; Guo, F.; Wu, W.; Zhang, T. Characterization of tetracycline resistant bacterial community in saline activated sludge using batch stress incubation with high-throughput sequencing analysis. Water Res. 2013, 47, 4207–4216. [Google Scholar]
  20. Qu, J.Q.; Hao, T.F.; Li, Y.G.; Liu, L.M.; Hao, D.S.; Jia, C.X.; Zhang, Q.J. Analysis of fish community structure and ecological niche changes in Miyun Reservoir based on environmental DNA technology. J. Dalian Ocean Univ. 2024, 39, 298–307. [Google Scholar]
  21. Liu, W.Y.; Huang, J.Q.; Dai, G.X.; Liu, G.Q.; Lei, X.T.; Zhou, Y.D.; Ye, Y.C. RDA analysis between fish community structure and environmental factors in the Lingdingyang Estuary. Fish. Inf. Strategy 2023, 38, 32–41. [Google Scholar]
  22. Nakagawa, H.; Yamamoto, S.; Sato, Y.; Sado, T.; Minamoto, T.; Miya, M. Comparing local- and regional-scale estimations of the diversity of stream fish using eDNA metabarcoding and conventional observation methods. Freshw. Biol. 2018, 6, 505–612. [Google Scholar] [CrossRef]
  23. Dai, Y.G.; Chen, Y.F. Status of fish resources in Qingshuijiang River and protection measures. J. Hydroecol. 2007, 75–78. [Google Scholar]
  24. Wang, M.; Jin, X.W.; Lin, X.L.; Du, L.N.; Cui, Y.D.; Wu, X.P.; Sun, H.Y.; Xie, Z.C.; Wang, X.H.; Wang, B.X. Advances in the macrozoobenthos biodiversity monitoring and ecosystem assessment using environmental DNA metabarcoding. Acta Ecol. Sin. 2021, 41, 7440–7453. [Google Scholar]
  25. Norshida, I.; Mohd Nasir, M.S.A.; Khaleel, A.G.; Sallehuddin, A.S.; Syed Idrus, S.N.; Istiqomah, I.; Venmathi, M.B.; Ahmad, S. First wild record of Australian redclaw crayfish Cherax quadricarinatus (von Martens, 1868) in the East Coast of Peninsular Malaysia. BioInvasions Rec. 2021, 10, 360–368. [Google Scholar]
  26. Ma, X.; Yang, H.; Zhong, X.; Zeng, P.; Zhou, X.; Zeng, S.; Dong, X.; Min, W.; Huang, F. eDNA metabarcoding analysis of the composition and spatial patterns of fish communities in the Sanbanxi Reservoir, China. Sustainability 2022, 14, 12966. [Google Scholar] [CrossRef]
  27. Yu, X.D.; Luo, T.H.; Zhou, H.Z. Large-scale patterns in species diversity of fishes in the Yangtze River Basin. Biodivers. Sci. 2005, 13, 473. [Google Scholar] [CrossRef]
  28. Wang, S.; Xie, Y. China Species Red List: Vol. 1, Red List; Higher Education Press: Beijing, China, 2004. [Google Scholar]
  29. Dai, Y.G.; Chen, Y.F. Fish fauna and its ecological types of Qingshui River in Guizhou Province, Southwest China. Chin. J. Ecol. 2007, 26, 682–687. [Google Scholar]
  30. Sankian, Z.; Khosravi, S.; Kim, Y.; Lee, S. Dietary protein requirement for juvenile mandarin fish, Siniperca scherzeri. J. World Aquac. 2019, 50, 34–41. [Google Scholar] [CrossRef]
  31. Wolter, C. Temperature influence on the fish assemblage structure in a large lowland river, the lower Oder River, Germany. Ecol. Freshw. Fish 2007, 16, 493–503. [Google Scholar] [CrossRef]
  32. G8 3838-2002; Environmental Quality Standard for Surface Water. China Environmental Science Press: Beijing, China, 2002.
  33. Zhu, S.; Chen, W.; Li, X.; Li, J.; Li, Y. Pattern of fish assemblage structure and diversity in Liujiang River. Acta Hydrobiol. Sin. 2022, 46, 375–384. [Google Scholar]
  34. Li, J.; Qin, H.; Pei, S.; Yao, L.; Wen, W.; Yi, L.; Zhou, J.; Tang, L. Analysis of an Ecological Flow Regime during the Ctenopharyngodon Idella Spawning Period Based on Reservoir Operations. Water 2019, 11, 2034. [Google Scholar] [CrossRef]
  35. Zhao, X.; Cui, Z.G.; Hu, H.Y.; Jing, Y.; Cui, H.W.; Ding, D.S.; Gao, Y. Variation of nitrogen, phosphorus and COD during the cultivation of Ruditapes philippinarum. J. Agro-Environ. Sci. 2025, 1–12. Available online: http://kns.cnki.net/kcms/detail/12.1347.S.20240716.1757.006.html (accessed on 20 March 2025).
  36. Sun, C.C. Diatoms Biological Diversity and Relationship Among Diatoms with Heavy Metals and TN &TP in Wuyang River. Master’s Thesis, Guizhou University, Guiyang, China, 2015. [Google Scholar]
  37. Du, H.; Chen, Z.; Mao, G.; Chen, L.; Crittenden, J.; Li, R.Y.M.; Chai, L. Evaluation of eutrophication in freshwater lakes: A new non-equilibrium statistical approach. Ecol. Indic. 2019, 102, 686–692. [Google Scholar]
  38. Li, Q.; Liu, Y.; Li, S.; Guo, X.; Fu, Y.; He, N.; Ruan, G.; Wang, Q.; Gao, W.; Fang, L. Impact of nitrite exposure on oxidative stress and antioxidative-related genes responses in the gills of Procambarus clarkii. Fish Shellfish Immunol. 2022, 131, 624–630. [Google Scholar] [CrossRef]
  39. Ciji, A.; Akhtar, M.S. Nitrite implications and its management strategies in aquaculture: A review. Rev. Aquac. 2020, 12, 878–908. [Google Scholar]
  40. Sercu, B.; Jones, A.D.G.; Wu, C.H.; Escobar, M.H.; Serlin, C.L.; Knapp, T.A.; Andersen, G.L.; Holden, P.A. The Influence of In Situ Chemical Oxidation on Microbial Community Composition in Groundwater Contaminated with Chlorinated Solvents. Microb. Ecol. 2013, 65, 39–49. [Google Scholar] [CrossRef]
  41. Song, Y.Q. Insight into the Kinetics and Mechanism of Refractory Organic Pollutants Degradation in the Electro-Permanganate-Ozone Process. Master’s Thesis, Chongqing University, Chongqing, China, 2021. [Google Scholar]
  42. Liu, S.; Cao, X.X.; Wu, P.; Yang, S.D.; Zhang, T.; Liao, L. Relationship between bacterial diversity and environmental factors in reservoirs and their inflow basins under the influence of acid mine drainage. Environ. Chem. 2022, 41, 2121–2132. [Google Scholar]
  43. Cao, X.J.; Long, X.M. From Local Division to Co-Governance: Experiences and Reflections on Watershed Governance—Taking the Water Pollution Control of Qingshui River in the Border Area of Hunan, Chongqing and Guizhou as an Example. Soc. Sci. Guangxi 2019, 294, 54–58. [Google Scholar]
Figure 1. Distribution map of sampling points in the Qingshui River.
Fishes 10 00165 g001
Figure 2. Species abundance map at each sampling point in Qingshuijiang River.
Fishes 10 00165 g002
Figure 3. Plot of between-group differences in the alpha diversity index.
Fishes 10 00165 g003
Figure 4. Fish species detection PCoA differences between groups.
Fishes 10 00165 g004
Figure 5. The correlation between environmental factors and fish communities. (a) RDA ordination diagram of fish community structure and environmental factors in the Qingshui River; (b) Relative contributions of environmental factors to fish community variation.
Fishes 10 00165 g005
Table 1. Statistical table of fish species in the Qingshui river.
SpeciesDocumentedEndemic Fishes of
Yangtze River
Exotic Species
Cypriniformes
  Cyprinidae
Acrossocheilus jishouensis++
Acrossocheilus monticola++
Acrossocheilus parallens+
Acrossocheilus yunnanensis+
Bangana rendahli++
Carassius auratus+
Cyprinus carpio+
Discogobio yunnanensis+
Folifer brevifilis+
Onychostoma barbatum+
Onychostoma lini+
Onychostoma rara+
Onychostoma simum+
Pseudogyrinocheilus prochilus+
Spinibarbus hollandi+
Spinibarbus sinensis++
Xenocyprididae
Aphyocypris chinensis+
Aphyocypris normalis+
Chanodichthys ilishaeformis+
Ctenopharyngodon idella+
Culter alburnus+
Elopichthys bambusa+
Hemiculter bleekeri+
Hemiculter leucisculus+
Hemiculterella sauvagei++
Hypophthalmichthys molitrix+
Hypophthalmichthys nobilis+
Mylopharyngodon piceus+
Opsariichthys bidens+
Parabramis pekinensis+
Pseudohemiculter dispar+
Pseudolaubuca sinensis+
Sinibrama macrops+ +
Squaliobarbus curriculus+
Xenocypris davidi+
Zacco platypus+
Gobionidae
Abbottina binhi+
Abbottina rivularis+
Gnathopogon tsinanensis+
Hemibarbus labeo+
Hemibarbus maculatus+
Microphysogobio fukiensis+
Microphysogobio tungtingensis++
Platysmacheilus exiguus+
Pseudorasbora parva+
Rhinogobio cylindricus++
Sarcocheilichthys nigripinnis+
Sarcocheilichthys sinensis+
Saurogobio dabryi+
Saurogobio punctatus++
Squalidus argentatus+
Squalidus wolterstorffi++
Nemacheilidae
Homatula potanini++
Schistura fasciolata+
Cobitidae
Cobitis macrostigma++
Leptobotia elongata++
Leptobotia guilinensis+
Leptobotia pellegrini+
Misgurnus anguillicaudatus+
Parabotia banarescui+
Parabotia kiangsiensis+
Parabotia lijiangensis+
Balitoridae
Sinogastromyzon hsiashiensis++
Acheilognathidae
Acheilognathus macropterus+
Acheilognathus rhombeus+
Rhodeus ocellatus+
Synbranchiformes
Mastacembelidae
Macrognathus aculeatus+
Synbranchidae
Monopterus albus+
Beloniformes
Adrianichthyidae
Oryzias sinensis+
Cyprinodontiformes
Poeciliidae
Gambusia affinis+ +
Siluriformes
Bagridae
Hemibagrus macropterus+
Pseudobagrus brachyrhabdion+
Pseudobagrus truncatus+
Tachysurus eupogon+
Tachysurus fulvidraco+
Tachysurus intermedius+
Tachysurus nitidus+
Tachysurus vachellii+
Siluridae
Silurus asotus+
Silurus meridionalis+
Sisoridae
Glyptothorax sinensis+
Odontobutidae
Micropercops swinhonis+
Odontobutis sinensis+
Gobiidae
Rhinogobius cliffordpopei+
Rhinogobius giurinus+
Anabantiformes
Channidae
Channa asiatica+
Centrarchiformes
Sinipercidae
Siniperca knerii+
Siniperca loona+
Siniperca roulei+
Siniperca scherzeri+
Siniperca undulata+
Disclaimer/Publisher’s Note: The statements, opinions and data contained in all publications are solely those of the individual author(s) and contributor(s) and not of MDPI and/or the editor(s). MDPI and/or the editor(s) disclaim responsibility for any injury to people or property resulting from any ideas, methods, instructions or products referred to in the content.

