Article

Ichthyofaunal Metabarcoding in the Southern Appalachians: Use of eDNA Metabarcoding in Fish Surveys in Lotic Systems of the Great Smoky Mountains National Park with Comparisons to Historic Electrofishing Data

1
Department of Science and Health, Asbury University, Wilmore, KY 40390, USA
2
Great Smoky Mountains National Park, 107 Park Headquarters Road, Gatlinburg, TN 37738, USA
3
Department of Mathematics and Computer Science, Asbury University, Wilmore, KY 40390, USA
*
Author to whom correspondence should be addressed.
Fishes 2025, 10(4), 145; https://doi.org/10.3390/fishes10040145
Submission received: 5 February 2025 / Revised: 10 March 2025 / Accepted: 19 March 2025 / Published: 22 March 2025

Abstract

eDNA appears well positioned to play a significant role in the future of biomonitoring, and the need to assess the efficacy of eDNA-based surveys in a variety of habitats is increasing. We conducted an eDNA metabarcoding-based survey of fish communities in the Great Smoky Mountains National Park (GSMNP), located in eastern Tennessee and western North Carolina. The GSMNP, widely recognized as a biodiversity hotspot, encompasses 211,419 hectares of the Southern Appalachian Mountains with elevations up to 2205 meters and is home to approximately 73 species of fish, including 12 families and three species classified as endangered or threatened. We collected 50 water samples in first to sixth order streams at elevations of 336 to 1462 meters, including all major watersheds found in the park. eDNA was amplified utilizing two primer sets which each target differing regions of the 12S mitochondrial gene and generate amplicons of varying size (97 and 225 bp, respectively), and sequencing was conducted to an expected read depth of 400,000 reads per sample per marker. We detected a total of 40 fish species; of these, 36 were detected with the primer set which produces a 97 bp amplicon, and 12 of these 36 were detected only by this primer set. Species assemblages varied between stream orders, and species richness decreased with increasing elevation and increased with increasing stream order. Significant correlations were observed between biomass data from electrofishing monitoring (1984–2023) and eDNA metabarcoding read counts in five of seven species examined, including all salmonids. eDNA metabarcoding was demonstrated to be effective in assessing fish communities in high-elevation lotic systems in the Southern Appalachians, and our results suggest that primers targeting shorter amplicons may exhibit greater efficacy in these ecosystems.
Key Contribution: Distinct differences in the efficacy of metabarcoding primer sets targeting different regions of the same gene were observed. A primer set creating a 97 bp amplicon detected 90% of species observed via eDNA metabarcoding while another primer set targeting a longer DNA segment (225 bp) detected only 70% of the 40 total species detected in this study. Additionally, significant correlations were observed between fish biomass determined by conventional methods and eDNA metabarcoding read abundance in these lotic systems, particularly in salmonid species. Finally, a relatively high degree of congruence in species detection was observed between an extensive body of historic electrofishing data and eDNA metabarcoding species detections, although eDNA detected a greater number of species at 29 of the 30 sites evaluated.

1. Introduction

The need for biodiversity monitoring has become increasingly evident as the reach of anthropogenic impacts has expanded into natural areas around the globe; efficient and effective quantification of biodiversity remains a foremost objective of these monitoring efforts, informing conservation priorities and management efforts. Since its first implementation in macro-organism studies in 2008 [1], it has become increasingly evident that environmental DNA (eDNA) will play some role in future biodiversity monitoring efforts. The total number of published eDNA studies increased exponentially from three in 2011 [2] to 420 in 2023 [3], and numerous efforts are underway to standardize protocols and enable the inclusion of eDNA in regulatory frameworks [4,5,6,7]. While initial eDNA studies focused entirely on single-species detection, the more recent coupling of next-generation sequencing with eDNA facilitates taxonomic composition analysis of entire communities through the identification of up to millions of DNA fragments per sample, providing a powerful survey approach that is rapidly emerging as a cost-effective method and is currently transforming biodiversity studies globally [8,9,10,11,12]. eDNA appears to be well positioned to play a significant role in the future of ecological studies [13,14,15], particularly biomonitoring efforts [16,17,18].
The Great Smoky Mountains National Park (GSMNP), located in eastern Tennessee and western North Carolina, encompasses 211,419 hectares and some of the higher elevations of the Southern Appalachian Mountains, with peaks reaching 2205 m. The park is internationally renowned as a center of biodiversity in North America, leading to its designation as an International Biosphere Reserve in 1976 and a World Heritage Site in 1983 [19]. Approximately 4667 km of streams drain the rugged landscape of the park, 800 km of which are known to contain fish [20,21,22]. These lotic systems are primarily high gradient (mean gradients of 1–5%), and cool temperature (<20 °C year-round), with boulder and cobble substrates and frequent waterfalls which often serve as barriers to fish migration [21]. Approximately 73 species of fish [20], including 12 families and three species classified as endangered or threatened, are found in these lotic systems within the park [21]. Although park streams are protected, threats facing park fish communities include introduced species [21,23] and acidic deposition [24,25,26], particularly in higher elevation areas within the park [24]. Park fish communities have been well-studied for decades [23,27,28] and are currently monitored via annual National Park Service electrofishing surveys throughout the park to monitor changes in fish communities.
The relationship between conventional biodiversity surveys and eDNA data remain of primary interest to scientists and resource managers [29,30,31]. Incorporation of eDNA into monitoring efforts offers potential benefits including rapid, cost-effective species detections which can facilitate greater habitat coverage, the capacity to survey previously inaccessible environments, and early detection of invasive species [32]. Growing evidence supports congruence between traditional biodiversity surveys and eDNA data [33], particularly in surveys targeting fish. A 2020 review of 37 studies found that in freshwater systems with less than 100 fish species, eDNA generally resulted in higher numbers of species detections relative to conventional methods [30]. However, habitat characteristics greatly influence eDNA efficacy [34], and each habitat type presents its own unique challenges for eDNA monitoring [35]. A collection of studies have effectively utilized eDNA single-species assays to detect fish in relatively small, high-gradient streams [36,37,38], including those in the GSMNP [39]. Additionally, several eDNA metabarcoding studies have been conducted in similar environments. Liu et al. 2024 reported congruence between electrofishing surveys and eDNA metabarcoding in the detection of fish species in high-elevation streams in the upper reaches of the Qingyi River basin, Anhui Province, China [40]. Lee et al. 2024 [41] reported higher numbers of fish species detected via eDNA metabarcoding relative to electrofishing surveys in six drainages of the Ozark Highlands, Missouri, U.S.A.
We sought to examine the efficacy of eDNA metabarcoding in assessing fish communities in small, high-gradient, lotic systems in the GSMNP, a portion of the Southern Appalachian Mountain range. Our objectives were to (A) assess the diversity of fish assemblages throughout the park and (B) compare these results to recent historical electrofishing data from these same habitats, thereby providing insight into the efficacy of eDNA metabarcoding in high-elevation systems in the southern Appalachian Mountains.

2. Materials and Methods

2.1. eDNA Field Sampling

Water samples were collected from 50 sites, one per sampling site, throughout the GSMNP between 14 and 21 July 2023 (Figure 1). Sites were selected in a manner designed to both distribute sample locations throughout the park and to collect from all habitat types; however, selections were limited in some cases by lack of accessibility. Samples were collected in 30 (Table 1) of the 46 United States Geological Survey (USGS) hierarchal hydrologic unit code (HUC) 12-digit sub-watersheds found within the GSMNP [22]; elevations varied between 336 and 1462 m. Streams sampled varied between first and sixth order, according to the Strahler method of stream classification [42] (Figure 2, Table 2).
One-liter water samples were filtered in the field using a hand pump and 250 mL, 47 mm Nalgene™ Single Use Analytical Filter Funnels with 0.45 µm cellulose nitrate membranes. Stream water was transferred from stream to filter funnel using a new, disposable polyethylene cup, which was opened from its packaging on site and thrice rinsed with site stream water before water transfer. Forceps and scissors used to manipulate filters were dipped in ethanol and thrice flamed before contact with new samples. Filters were transferred to sterile 1.5 mL Eppendorf microcentrifuge tubes containing 1 mL ATL extraction buffer (Qiagen, Hilden, Germany), a recommended method of storage [43], and each was held on ice until arrival in the lab (1–7 days). Filters stored in ATL were held in the lab at 4 °C for 7–21 days until extraction.
A field blank was conducted every 10 samples. Field blanks consisted of bottled distilled water filtered in the location where the last sample in the set of 10 was collected, excluding one weather-related event that forced the completion of filtering in a nearby location. Field blanks were collected and processed in a manner identical to field-collected samples.

2.2. DNA Extraction

DNA was extracted from each field-collected sample using a DNeasy Blood and Tissue Kit (Qiagen), which have been demonstrated to provide superior yields relative to other extraction methods [44], and a modified version of a published protocol [45,46]. Field blanks were processed in parallel. Briefly, filters were cut in half, and half of each filter was stored in ethanol for potential future use. The other filter halves were each cut into 15–20 pieces and incubated at 56 °C overnight in a 360 μL of ATL buffer and 40 μL of Proteinase K (double the volumes recommended for tissue). The final elution was performed twice (first with 200 μL and then with 100 μL of AE buffer). All other extraction steps were conducted according to the DNeasy kit protocol. We stored extracted eDNA at 4 °C until analysis.
All extractions were carried out in a laminar flow cabinet that had been sterilized with bleach, located in a room physically separated from where PCR products are handled [47]. All equipment used (forceps, scissors) had been previously washed with a 50% bleach solution [48], ethanol-flamed, and subsequently rinsed with deionized water. Laboratory surfaces on which PCR reactions were performed were regularly cleaned with a 50% bleach solution, and all equipment used in the PCR laboratory did not leave the clean laboratory [48].

2.3. Inhibition Testing

Inhibition testing was completed for each field-extracted sample using TaqMan™ Exogenous Internal Positive Control Reagents (Applied Biosystems, Waltham, MA, USA). Each 20.0 μL reaction contained the following: 10.0 μL TaqMan™ EMM 2.0, 0.6 μL nuclease-free water, 7.0 μL eDNA extract, 2.0 μL IPC assay, and 0.4 μL IPC DNA. A non-template control was also included, utilizing the same volumes except for 7.0 μL of nuclease-free water replacing the eDNA extract. Thermocycler conditions were as follows: 50 °C for two minutes, 95 °C for 10 min, then 40 cycles of 95 °C for 15 s and 60 °C for one minute. We considered wells which showed no exponential amplification or delayed amplification (a Ct value which exceeded the Ct of the non-template control by 3.0) to be inhibited [49,50]. We treated samples that demonstrated inhibition (four) with a OneStep PCR Inhibitor Removal Kit (IRK; Zymo Research, Irvine, CA, USA.) to remove PCR inhibitors. The samples were retested post-treatment to confirm inhibition removal.

2.4. Primer Selection and Evaluation

We limited our primer search to those targeting the 12S mitochondrial region, which have been demonstrated to yield superior results relative to those targeting other mitochondrial regions in previous fish metabarcoding studies [51]. MiFish primers [52] (which produce a 225 bp amplicon including the primers) were selected based on their superior performance relative to other fish metabarcoding primers [53] and their efficacy in previous North American fish metabarcoding studies [41,54]. Although the Batra primer set [55] was designed for use in amphibian metabarcoding, we selected them for use in fish detection since they recognize a segment of DNA near the other end (391 bp from the MiFish amplicon target) of the 12S region, they produce a short (97 bp including the primers) amplicon, and the results of both the in silico and in vitro tests indicated that they were highly compatible with each target fish species found in the GSMNP.
The performance of the MiFish primer set and the Batra primer set were tested using the program PrimerMiner [56]. PrimerMiner allows for in silico evaluation of primer capabilities and offers an improvement over previous evaluation programs by considering the adjacency, position, and type of each mismatch between a primer and its template sequence [56]. Primers were tested against a custom reference database, which we constructed based on fish species known to occur in the GSMNP [57,58]. We amended it slightly to include five additional species following preliminary analysis.

2.5. PCR Amplification and Sequencing

Extracted eDNA was amplified by PCR using the MiFish [52] and Batra [55] primer sets. We used a two-step PCR protocol with a nested tagging approach for library preparation [59]. For the initial PCR, we designed multiple primer variants of the MiFish and Batra primer sets by modifying the original primers; modifications included adding unique tags and varying numbers (0–3) of extra bases to increase heterogeneity as well as adding varying portions of the sequencing primers; these also served as adaptors for Illumina indices added during the second PCR.
Initial PCR reactions were run in triplicate for each primer set, consistent with recommendations of two to three PCR technical replicates per sample which are then pooled for second indexing PCR [60]. First-round PCR reactions were conducted using Thermo Fisher Scientific’s TaqMan Environmental Master Mix 2.0, which includes both inhibitor prevention components and AmpliTaq Gold® DNA Polymerase, a polymerase demonstrated to provide reliable results in previous metabarcoding studies [61,62,63]. PCR reaction components and cycling parameters were developed based on previously published work with these primer sets and in laboratory initial testing and varied slightly by primer set. Batra reactions contained the following: 7.5 μL TaqMan™ EMM 2.0, 1.5 μL human blocking primer, 5.25 μL eDNA extract, and 0.75 μL of the forward and reverse primer combination in an IDTE buffer solution (8.0 pH) at 5 μM (final reaction concentration = 0.25 μM). MiFish reactions contained 7.5 μL TaqMan™ EMM 2.0, 3.75 μL nuclease-free water, 3.0 μL eDNA extract, and 0.75 μL of the forward and reverse primer combination in an IDTE buffer solution (8.0 pH) at 5 μM (final reaction concentration = 0.25 μM). Thermocycler conditions for Batra primers were as follows: an initial denaturation of 95 °C for 10 min, then 36 cycles of 95 °C for 15 s, 57 °C for 30 s, and 72 °C for 60 s, followed by a final elongation of 72 °C for 7 min. Thermocycler conditions for MiFish primers were as follows: an initial denaturation of 95 °C for 15 min, then 36 cycles of 94 °C for 30 s, 65 °C for 1 min and 30 s, and 72 °C for 60 s, followed by a final elongation of 72 °C for 10 min. In addition to field blanks, we included a no-template PCR negative control (nuclease-free water) and positive control (tissue-extracted DNA at 1 µg/mL) for each set of reactions. Each PCR replicate was individually assessed via gel electrophoresis and then pooled into sublibraries using an equal volume of each replicate. The PCR positive and negative controls were discarded once they were confirmed to generate or not generate bands, respectively. Each pooled sublibrary was then purified by ExoSAP-IT™ PCR Product Cleanup Reagent (Applied Biosystems™). The cleanup reaction included the recommended ratios of 3.75 μL sublibrary volume and 1.5 μL ExoSAP-IT™ reagent and was incubated by thermocycler at 37 °C for 15 min and then 80 °C for 15 min, according to protocol.
The purified sublibraries were used as template DNA for a second PCR, which attached Illumina adapters. PCR reactions contained the following: 5.0 μL GoTaq® G2 Flexi buffer (Promega, Madison, WI, USA), 0.125 μL GoTaq® Flexi polymerase (Promega), 0.2 μL dNTP mix, 2.0 μL MgCl2 (25 mM), 14.68 μL nuclease-free water, 1.0 μL of sublibrary template DNA, and 1.0 μL each of forward and reverse primer at 5 μM (final reaction concentration = 0.25 μM). Thermocycler conditions were as follows: an initial denaturation of 95 °C for 10 min, then nine cycles of 95 °C for 30 s, 59 °C for 30 s, and 72 °C for 30 s, followed by a final elongation of 72 °C for 5 min. Each second-round reaction was run separately, without pooling, to prevent tag jumping [64].
Second-round PCR products were quantified using a Qubit™ 3.0 fluorometer (Life Technologies, Carlsbad, CA, USA) and were diluted in nuclease-free water to a final universal concentration of 7.0 nM. When pooling for sequencing, 6.0 μL of each equimolar second-round PCR dilution was added to a 1.5 mL Eppendorf microcentrifuge tube to complete the final library for sequencing. Final libraries were size-specific cleaned using SPRI beads at a ratio of 1x to remove smaller DNA fragments, spiked with 10% PhiX, and sequenced (University of Kentucky Genomics Core) utilizing a Next Seq 2000 P1 and 150 bp paired-end reads with an expected read depth of 420,168 reads per sample. Field blanks were sequenced to establish baseline expectations for contamination levels in sample data, as recommended in metabarcoding studies [65].

2.6. Bioinformatics

Target sequences were demultiplexed, and in-line tags were extracted using Cutadapt 4.4 [66]. Demultiplexed sequences from each primer set were analyzed separately using the Barque v1.8.5 (https://github.com/enormandeau/barque, accessed on 25 November 2024) pipeline to trim, filter, merge, and assign a taxonomic identity to merged sequence clusters [67]. A custom reference database was constructed based on the 73 fish species known to occur in the GSMNP [57,58] and was amended slightly to include five additional species following preliminary analysis; in total, it included 82% of known park species. Missing species included members of the genera Etheostoma (7), Notropis (3), Percina (1), Luxilus (1), Moxostoma (1), and Ichthyomyzon (1).
Species were identified in Barque using a 97% sequence similarity threshold between the merged sequences and the reference database sequences. Merged sequences that were equally similar to reference sequences of multiple species within a genus were identified at the genus level. The collection of sequences that were not identified to species were searched against GenBank using BLASTn.
Conservative parameters were applied in order to guard against Type I errors. We applied a 10-read minimum threshold (if no sample achieved this threshold, the amplicon was disregarded) using MIN_HITS_SAMPLE (Barque pipleline) for use in the detection of taxa present in each sample, two times greater than the minimum threshold applied in similar recent studies quantifying ecological diversity [41,54]. We corrected the read counts by subtracting the maximum number of reads detected in any one sequenced field blank from each of the sample read counts, as in previous similar studies [41,54]. Finally, in order to minimize the probability of false positives [68], we filtered read counts per sample less than a minimum threshold in the final data set (less than 55 for Batra and less than 60 for MiFish) in a manner similar to previous studies [69]. For statistical analysis, the Batra and MiFish abundance results were combined following previous similar studies [41,54,68].

2.7. Data Analysis

Elevation for each site was obtained from DEMs (https://www.gpsvisualizer.com/elevation, accessed on 16 December 2024) based on site coordinates and stream order from QGIS using the “Stream Order” tool. All statistical analyses were performed using R, version 4.4.2 [70], and the richness and community analyses using the package vegan [71]. For richness and community analyses, we used the combined Batra and MiFish reads from each site as a proxy of species abundance, as previously performed in numerous eDNA metabarcoding studies assessing fish communities [72]. The relationship between fish community assemblage and both elevation and stream order was examined via permutational analysis of variance (PERMANOVA). Several constrained ordination methods were performed to further explore and visualize the associations between these variables and fish community structure. We corrected the final number of eDNA reads (see previous processing description) using Hellinger transformations to reduce the importance of species with a high number of reads relative to species with lower read numbers. High read number discrepancies are problematic for RDA analysis, and previous studies have demonstrated the effectiveness of Hellinger transformations in correcting this issue in fish eDNA metabarcoding datasets [73]. Species diversity was assessed utilizing the Shannon diversity index, and differences in Shannon diversity index values between sites of differing stream order were compared using a one-way ANOVA.

2.8. Comparison of eDNA Metabarcoding Data with Traditional Monitoring Data

eDNA metabarcoding data were compared with data obtained from annual electrofishing surveys conducted in collocated sites in the GSMNP between 1984 and 2023. Sites were considered collocated if both sampling events (eDNA sample collection and electrofishing) were conducted within 400 m of one another and if no tributary entered between them. Data were available for comparison for 30 of our 50 eDNA sampling sites. Electrofishing data were collected either via three-pass depletion (quantitative) [74] (25 sites) or as part of the Index of Biotic Integrity monitoring (non-quantitative) [75,76] (10 sites).
Each site was sampled via electrofishing no more than once annually. Comparisons were made by compiling the cumulative number of species observed in electrofishing sampling events for multiple years at a single site. Data available per site ranged from one to 33 sampling events (representing 33 years) per site. As previously outlined, eDNA samples were collected once during the summer of 2023. Because three-pass depletion and Index of Biotic Integrity electrofishing data were each collected in a different manner, the comparisons to eDNA data were made separately for each type of electrofishing data. This provided a total of 35 comparisons of electrofishing and eDNA data: 25 three-pass sites and 10 IBI electrofishing sites.
The relationship between biomass data from three-pass electrofishing surveys and eDNA read counts was examined by comparing biomass data from either one historic sampling event (this was the case for six sites) or a mean of historic sampling events (this was the case for 19 sites) with the eDNA metabarcoding read count data from the same site using single regressions in R. Between 10 and 23 sites were included in comparisons for various species, depending on availability. Comparisons were calculated for each species which was detected in 10 or more sites in both three-pass electrofishing and eDNA surveys (seven species total). Between two and 33 years of sampling events were included in biomass mean calculations, depending on availability. Each mean included a single electrofishing site except for one, in which two electrofishing sites met the collocation standards for one eDNA collection site, so both sites were included in the mean biomass calculation.

3. Results

3.1. Primer Validation

Both primer sets exhibited a high degree of compatibility with all of the fish species in our custom database, which included all GSMNP fish species available in public databases. In the case of MiFish, R primers were a perfect match for all sequences, while F primers had a single mismatch near the 5’ region of the primer. All Batra R primers were perfect matches except for three species for which one mismatch existed (Etheostoma camurum, Etheostoma rufilineatum, and Morone chrysops) while F primers had a single mismatch near the 3’ end of the primer. Mean penalty scores for the primer sets were 85.3 (Batra) and 8.3 (MiFish), with the higher Batra score resulting from the 3’ placement of the Batra F primer mismatch.

3.2. Sequencing Results

The average raw Illumina sequence read count per water sample was 516,595 for the Batra primers and 345,848 for the MiFish primers. Of these raw reads, for the Batra primers, 68.7% were assigned to fish at the species level and 2.2% at the genus level, 1.8% of the fish reads were unassigned, and 27.3% were assigned to non-fish organisms or were unassigned. For the MiFish primers, 61.7% of the raw reads were assigned to fish at the species level and 0.43% at the genus level, 2.7% of the fish reads were unassigned, and 37.2% were assigned to non-fish organisms or were unassigned. In total, species determinations were made from the combined markers with an average of 568,292 reads (355,090 Batra and 213,202 MiFish) assignable to fish species per sample (862,442 raw reads per sample).
Both PCR non-template negative controls in the lab (utilized during library preparation) and field blanks amplified by MiFish primers were visually determined to be negative based on gel electrophoresis. In contrast, several field blanks amplified by Batra primers did show weak bands. All field blanks were processed in parallel with samples during library preparation and then sequenced. Field blanks generally detected few or no fish reads. The number of fish reads in the field blanks was 1.0% and 0.038% of the fish reads assignable at the species or genus level for the Batra and MiFish primers, respectively. The overall number of fish reads in the field blanks (for both primer sets combined) was 0.66% of the fish reads assignable at the species or genus level. In the case of the Batra primers, 88% of these reads in the field blanks came from one species (Cottus bairdii). As previously outlined, all samples were corrected for these field blank reads.
Our attempt to guard against Type I errors by setting minimum read thresholds as in previous studies [69] (less than 55 reads for Batra and less than 60 reads for MiFish) resulted in 36.1% of the total species detections being disregarded due to read counts below the minimum thresholds (30.6% of total Batra reads and 41.5% of total MiFish reads). This represented 0.01% and 0.002% of assigned fish reads for the Batra and MiFish primers, respectively. An average of 3.2 (Batra) and 5.0 (MiFish) species per site were disregarded as suspected false positives. The subset of reads assigned to two or more species was minimal and accounted for 0.33% and 0.006% of the Batra- and MiFish-generated sequences, respectively.

3.3. Species Richness

We detected a total of 40 fish species: 36 with the Batra primer set and 28 with the MiFish primer set; three read clusters remained resolved only to the genus level (Table 3). In total, 60% (24/40 species) were confirmed by both markers in one or more samples (Table 3). Additionally, we detected eight (Batra) and six (MiFish) amplicon sequence variants (ASVs) that could only be assigned at the genus or family level (Table 3); these constituted 1.3% (Batra) and 2.1% (MiFish) of the raw reads.
The number of species detected per sample ranged from 2 to 24 (Batra) and 1–17 (MiFish). Cyprinidae was the most represented family, with 14 species (35% of taxa) (Table 3). Percidae was represented by seven darter species, four in the genus Etheostoma and three in the genus Percina (Table 3). Catostomidae and Centrarchidae were both represented by five species each, Salmonidae by three species, and Clupeidae, Cottidae, Fundulidae, and Ictaluridae each by three or fewer species (Table 3).
Read count contribution was mostly similar between the two primer sets (Figure 3). In both cases, the genus Rhinichthys contributed a significant portion of the assigned reads: 39% of the assigned read count was comprised of R. atratulus and R. cataractae for both primer sets (Figure 3). The family Salmonidae was also a significant taxa contributor to the read count for both Batra (46%) and MiFish (30%). Oncorhynchus mykiss, Salvelinus fontinalis, and Salmo trutta contributed 36%, 8%, and 2% (Batra) and 19%, 10%, and 1% (MiFish) of assigned reads, respectively. Campostoma anomalum comprised 6% and Centrarchidae 1% of the total assigned reads for both primer sets (Table 3). The largest discrepancy in the read count was observed in the family Cottidae, which comprised 0.7% of Batra-assigned reads but only 11% of MiFish-assigned reads (Table 3).

3.4. Assemblage Structure by Elevation and Stream Order

A PERMANOVA analysis of the relationship between the explanatory variables of elevation and stream order and the fish community assemblage indicated that the elevation alone could explain nearly 17% of the variation in the eDNA levels (R2 = 0.16542, p = 0.001) and that stream order alone can explain nearly 10% of the variation (R2 = 0.09722, p = 0.001). PERMANOVA also indicates that the combination of these two variables can explain 24% of the variation in the eDNA levels (R2 = 0.24214, p = 0.001). There is a correlation of r = −0.48 (Pearson’s r) between the explanatory variables, so it is expected that a combination of the two variables has explanatory power less than the sum of the explanatory power of the individual variables.
The axis lengths of the DCA (Detrended Correspondence Analysis) (<3.8) suggest that a linear model is appropriate to describe the relationship between the environmental variables of elevation and stream order and the fish community assemblage. The RDA (Redundancy Analysis), which assumes linear relationships and uses the Euclidean distance metric, identified two significant axes, which together explain 21.7% of the total variation in eDNA levels (p = 0.001 for the first axis, p = 0.01 for the second axis) (Figure S1A). A dbRDA (distance-based RDA) using the Bray–Curtis distance also identified two significant axes, which explain 24.2% of the variation in the eDNA data (p = 0.001 for the first axis, p = 0.01 for the second axis). Likewise, a Canonical Correspondence Analysis (CCA), which uses the chi-squared distance metric and is better suited to visualizing non-linear trends, revealed two axes explaining 18.5% of the total variation in eDNA levels, but only the first axis was significant (p = 0.001 for the first axis, p = 0.1 for the second axis) (Figure S1B).
Species composition analysis revealed that species composition varied with elevation (336 to 1462 m) and order (Table 4). A number of species, including the majority of the members of the family Catostomidae and Centrarchidae, were only observed in high-order streams (Table 4). Darters (family Percidae) differed by genus, with members of the genus Percina occurring in larger numbers in high-order streams, while the genus Etheostoma specimens were found homogeneously in first- or second- to fifth-order streams (Table 4). Salmonidae genera differed in distribution as well: S. fontanilus occurred in greatest abundance in low-order streams, while both O. mykiss and S. trutta occurred in higher abundance in high-order streams (Table 4). The Shannon diversity values ranged from 0.015 to 2.6 and varied significantly by stream order (One-way ANOVA, p = 3.5 × 10⁻⁵) (Table 5). The number of species observed per site was greatest (9–26) in high-order streams (fifth and one sixth) and lowest (3–10) in first-order streams (Table 5).

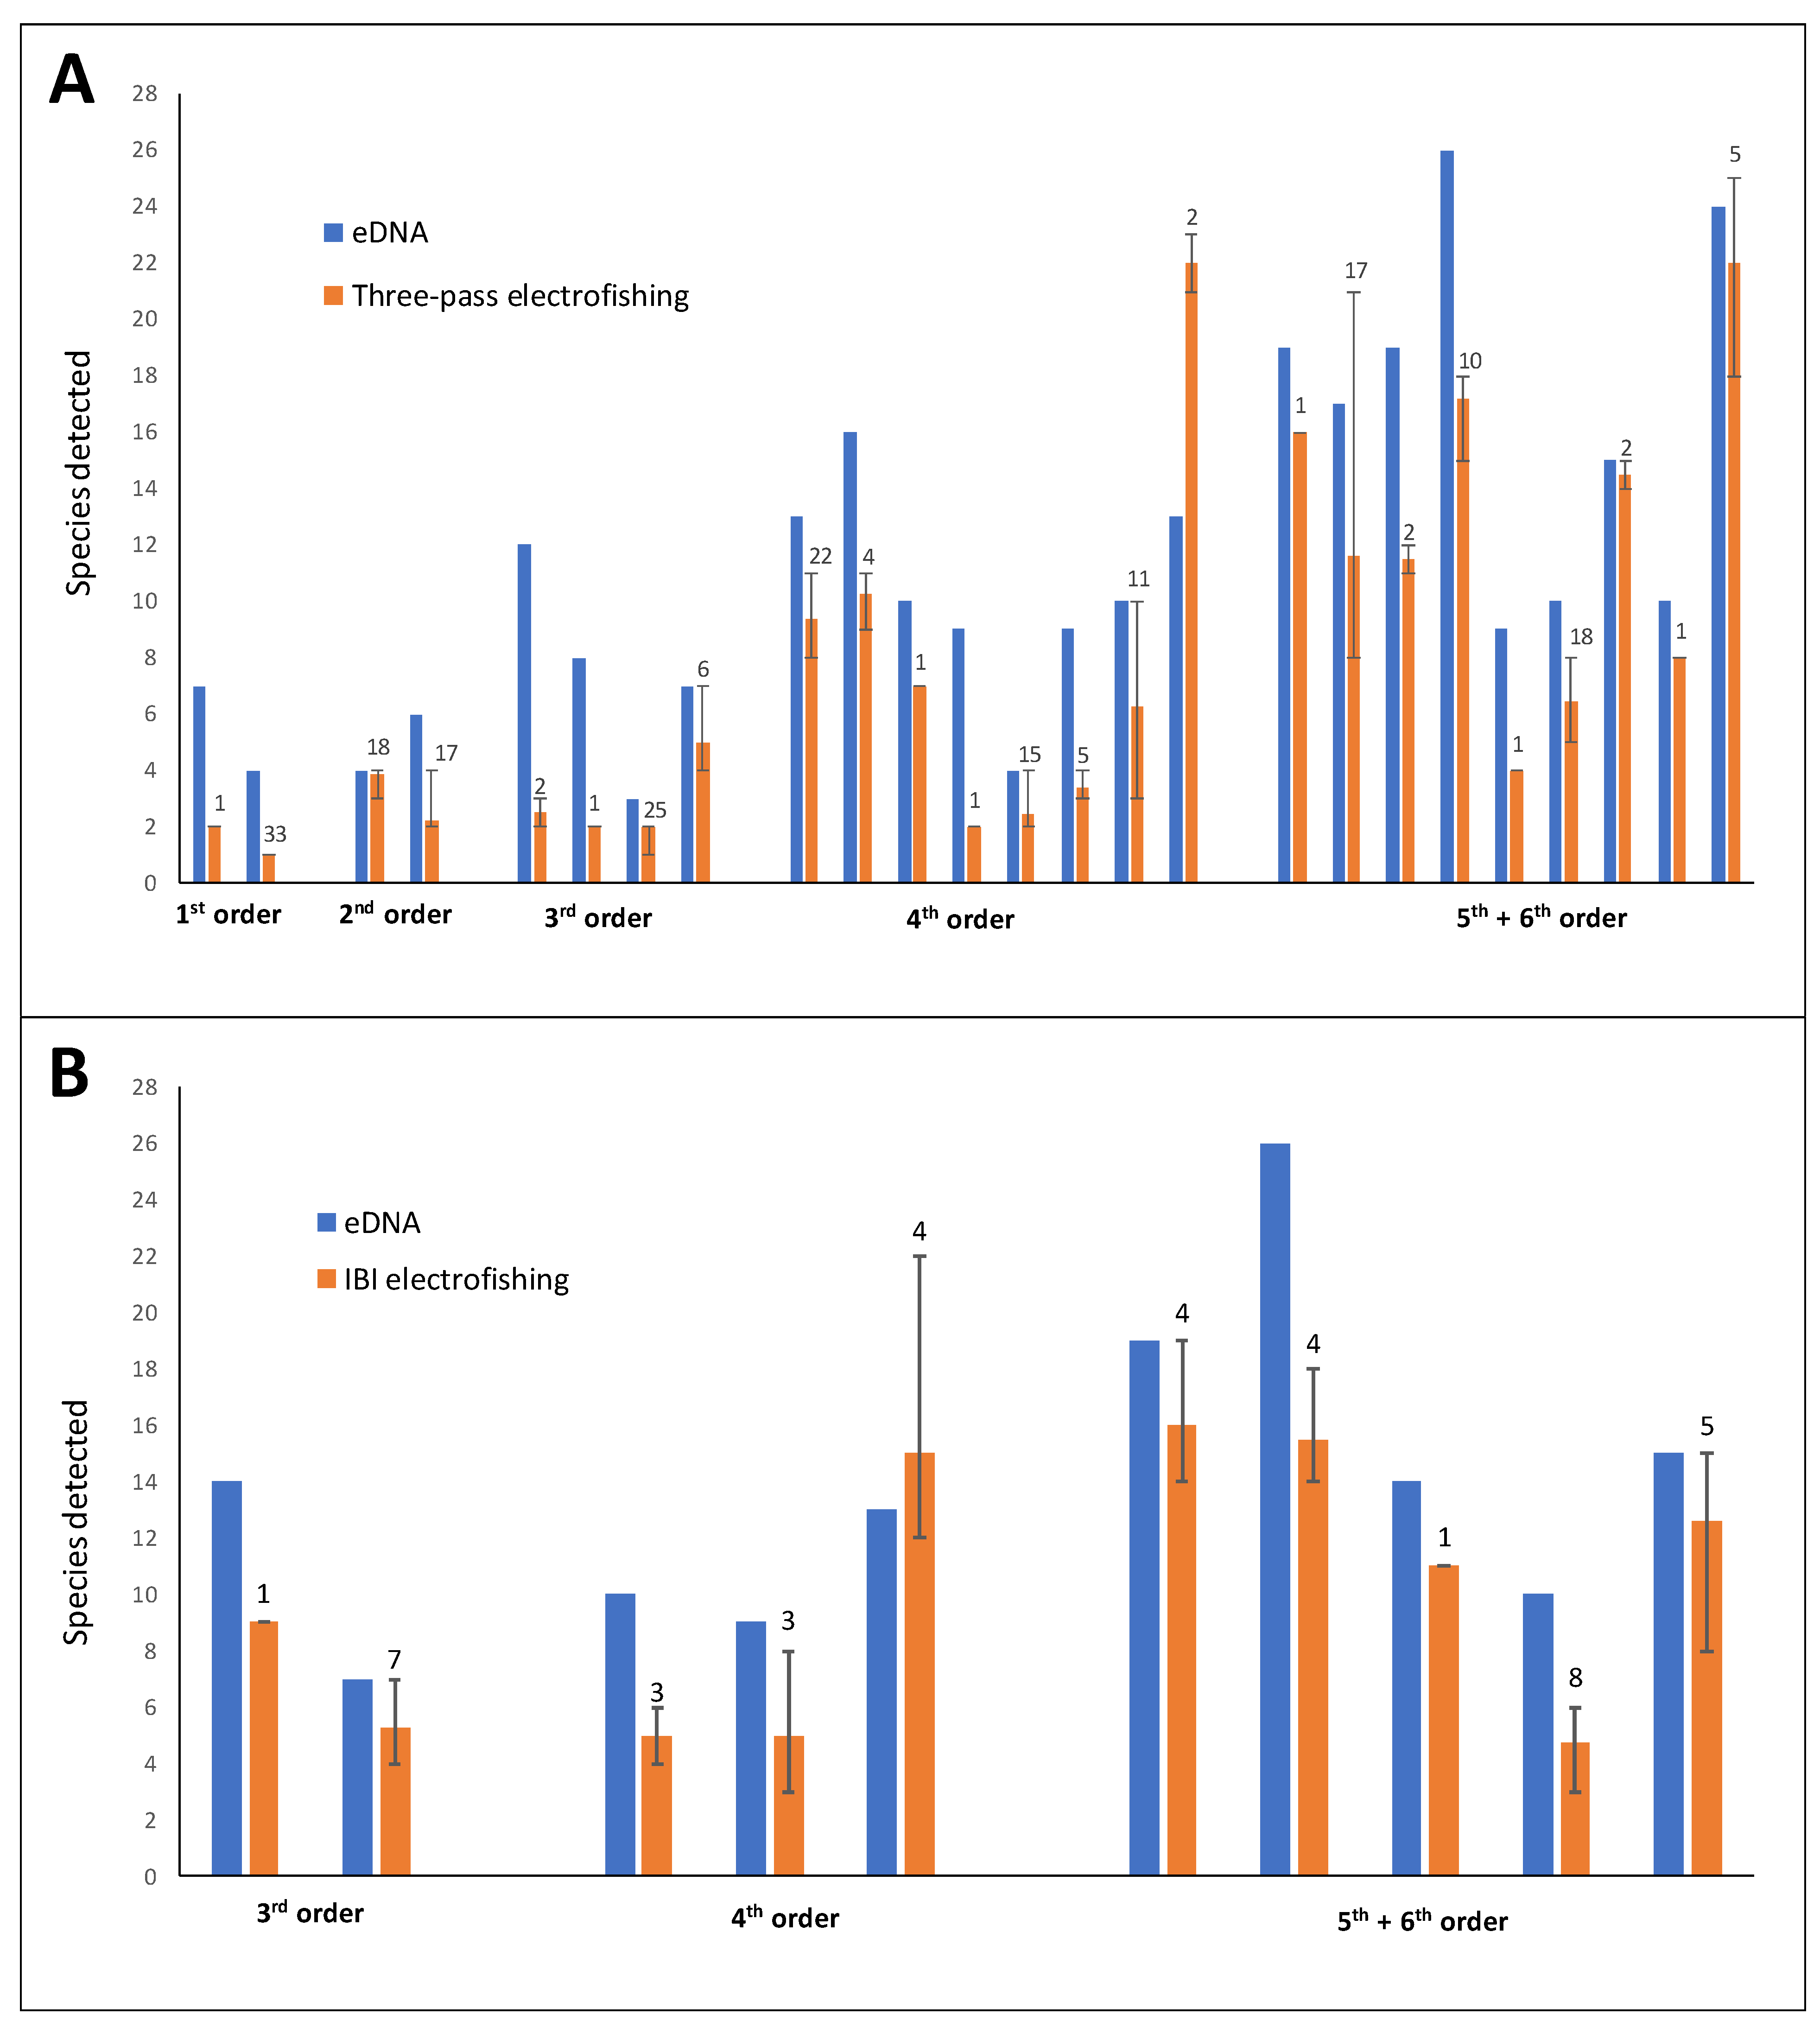
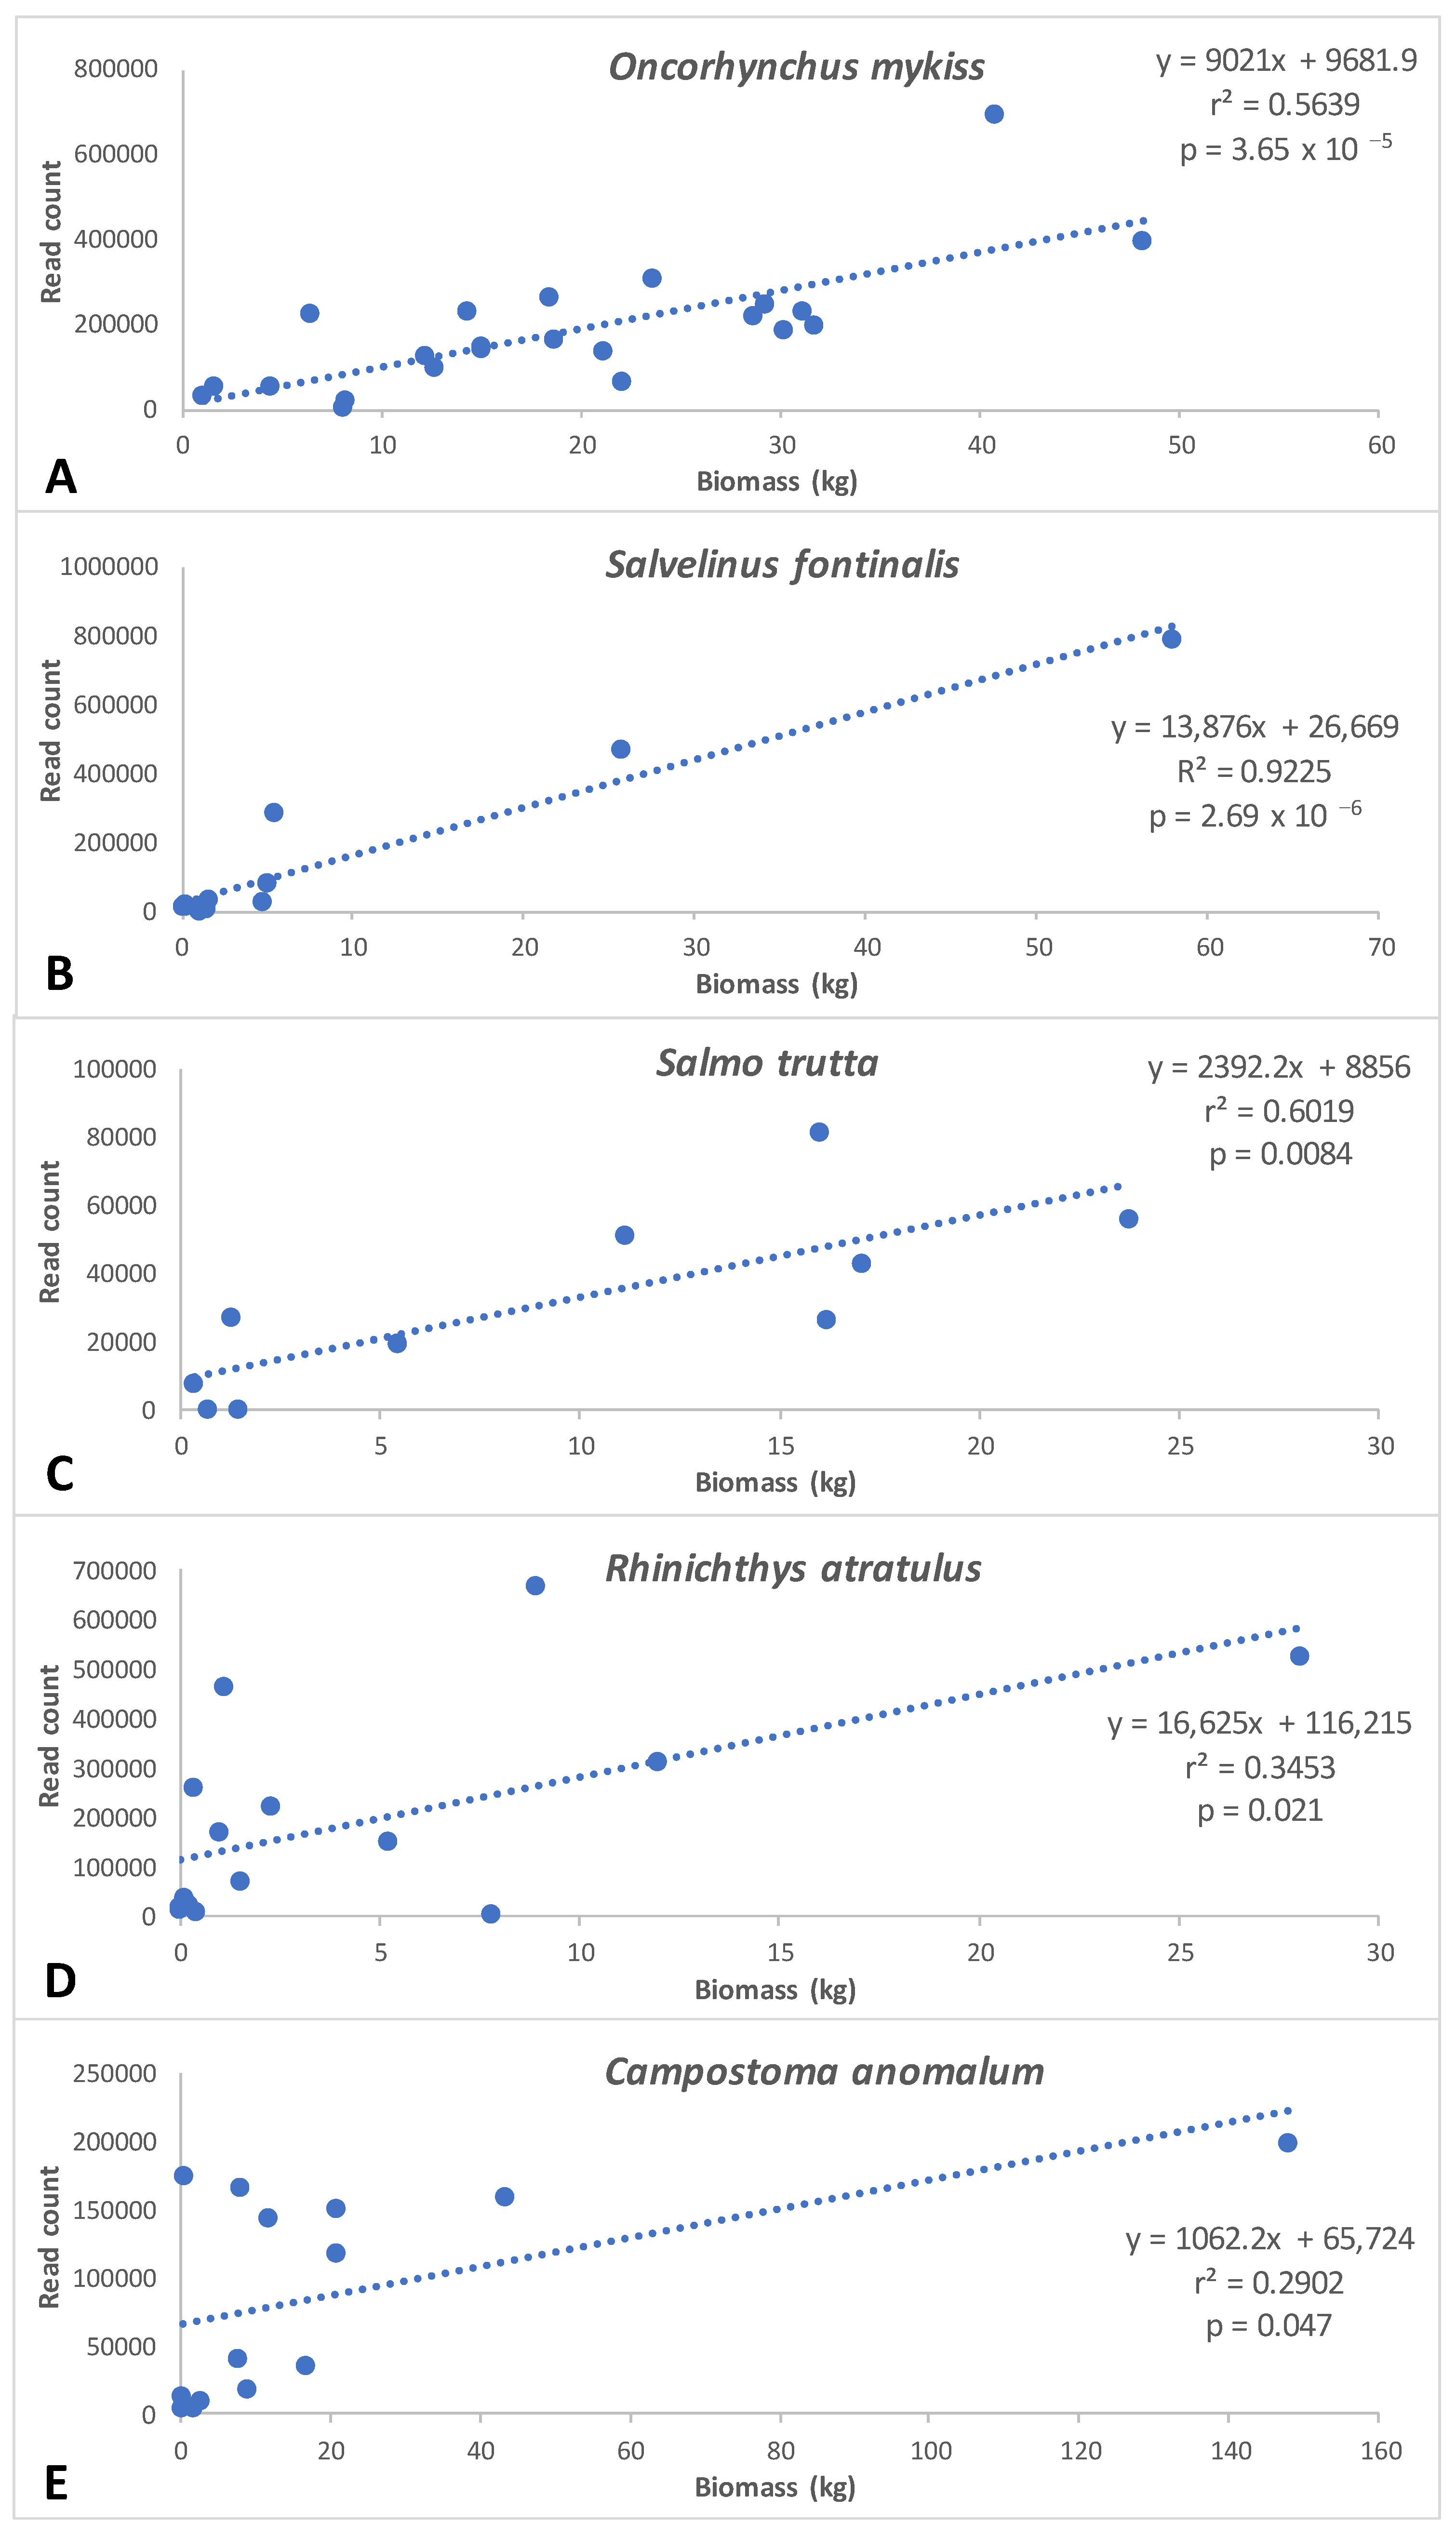
3.5. Comparison of eDNA Metabarcoding Data with Traditional Monitoring Data

A greater number of species were detected via eDNA relative to the mean number of species collected per electrofishing event in annual electrofishing surveys in 33 of the 35 comparisons (Figure 4). An average of 3.6 more species were detected per site via eDNA relative to both electrofishing methods. Only one fourth-order site resulted in a greater number of species detected via both three-pass (nine more species) and IBI (2 more species) electrofishing (Figure 4).
A comparison of the cumulative list of species detected at a site, throughout all years of electrofishing, to the species detected in the single eDNA sampling event reveals that eDNA detected a relatively high percentage, but not all, of the species detected by electrofishing. When only the fish species in the eDNA database are considered, eDNA detected a total of 81% (160/198 species/site detections) of the species detected during all years in the 25 three-pass depletion sites (Table 6 and Table 7) and a total of 78% (83/107 species/site detections) of the species detected during all years in the 10 IBI sites (Table 8). However, this percentage was highest in low-order streams with relatively low numbers of species. In the four first- and second-order streams in which the techniques were compared, eDNA detected 100% (9/9 species/site detections) of fish species observed in all years of electrofishing surveys (Table 6). Additionally, an average of 5.0 (three-pass) (Table 6 and Table 7) and 5.2 (IBI) (Table 8) species were detected per site via eDNA that were not captured via electrofishing surveys.
Significant correlation between biomass and eDNA read counts were observed for five of the seven species examined, including all three salmonid species and two species of family Cyprinidae (Figure 5). Correlation coefficients were highest for salmonid species (0.56–0.92) relative to cyprinid species (0.29 and 0.35) (Figure 5).

4. Discussion

In nearly all sites, eDNA metabarcoding surveys yielded species detections similar to those observed in the historic electrofishing sampling and were consistent with known fish distributions in the GSMNP. Comparison of eDNA surveys with historic electrofishing sampling revealed a high percentage of fish species detected in one-time eDNA surveys (78–81%) relative to the cumulative number of species observed over multiple electrofishing sampling events conducted between 1984 and 2023. Additionally, eDNA consistently detected a greater number of species per site relative to the mean number of species observed per sampling event in historic electrofishing data, similar to other recent studies comparing eDNA and electrofishing data [41,54]. These results are consistent with a growing body of data which indicate congruence between traditional and eDNA fish monitoring [30,33] and suggests that eDNA metabarcoding appears well-suited for use in high-elevation, lotic systems in the Southern Appalachians.

4.1. Primer Performance

Despite lower binding probability demonstrated by in silico analysis and identical cycling numbers in library preparation, the Batra primer set generated 33% more raw reads (25,829,731 for Batra versus 17,292,396 for MiFish) and detected a total of 36 species, including 12 species not detected by the MiFish primers (MiFish detected 28 species, four not detected by Batra). In every case, fish species detected solely by one primer set made a low contribution to the total reads (<1.0%), and each had sufficient coverage in the custom database. Of particular interest, only the Batra primer set detected two species of conservation concern (N. baileyi and N. flavipinnis) as well as five additional species not typically observed in the park that either appear in historical park records, occur near the park boundary, or are known to have been introduced near the park in contiguous watersheds. The Batra and MiFish primers both target a portion of the 12S mitochondrial region, with 391 bp spanning the distance between the amplicons (N. micropogon). The total length of the amplicons produced by the primers (including the primers themselves) is 97 bp for Batra (58 bp between primers) and 225 bp for MiFish (179 bp between primers; all bp numbers from N. micropogon). Enzymatic degradation by DNases associated with saprophytic organisms leads to the breakdown of much of the extracellular DNA in the environment [77,78], and DNA degradation has always been of primary concern to eDNA practitioners [79,80]. Degradation leads to a higher proportion of short fragments in the environment [81,82,83,84], and most eDNA studies target these short fragments [85]. However, amplicons generated by metabarcoding primers used today vary widely in amplicon length produced: a recent review of 22 primer pairs used in fish metabarcoding studies revealed that the reviewed primers produce amplicons between 40 and 413 bp, with only six of the primer pairs producing amplicons less than 100 bp [86]. Some studies do suggest that primers producing a shorter amplicon may be more effective. Bylemans et al. (2018) [85] observed that 285 bp DNA fragments were 24% less abundant than 96 bp DNA fragments following fish removal in tank experiments (20 °C). Comparisons of multiple-marker copy numbers in metabarcoding studies are difficult as most utilize different genes, which has been reported to impact efficacy [51,86]. However, Wei et al. (2018) [87] reported a 12-fold greater copy abundance of 126 bp versus 358 bp invertebrate COI amplicons extracted from lotic sediment samples. A recent meta-analysis of 28 eDNA studies concluded that eDNA degradation rates increase significantly with increasing amplicon length and impact available DNA, but only at intermediate water temperatures (approximately 5–15 °C) [79]. Although water temperatures were not taken as part of this study, water temperatures during the time of water sample collection (July) in the GSMNP vary with elevation (7 °C per 1000 m elevation) and typically range between 15 and 20 °C during the summer months [88], close to the reported temperatures at which amplicon length was a significant factor in DNA degradation rates. These results suggest that, for the conditions encountered in this study, the use of a metabarcoding primer set targeting a shorter amplicon may result in greater efficacy in metabarcoding-based biodiversity studies.

4.2. Metabarcoding Critical Parameters

Multiple factors impact the efficacy of eDNA metabarcoding studies; some of the most notable include volume filtered [89], number of field replicates [90], and sequencing depth [91] (read number). While higher volumes are clearly advantageous, filter clogging is an ever-present threat [92], and many studies report efficacy utilizing volumes of 1 L or less per sample site (including replicates) [55,72,93,94]. Therefore, we chose to utilize a 1 L volume in this study as a result of filter clogging potential. Field replicates have been demonstrated to increase detection probability, and several studies have examined this in detail. Macher et al. (2021) [90] reported detection of 75% of fish and lamprey species with one replicate in the river Mulde (Dessau, Germany), while Lee et al. (2024) [41] reported the detection of 85% of fish species with a single replicate in diverse Ozark streams (Ozarks, MO, USA). In these studies, an approximate total of 10 (Macher) [90] and four (Lee) [41] samples were needed to detect 95% of the species in the system. These data, in combination with eDNA metabarcoding studies that report efficacious detection of fish in freshwater systems by using single-replicate samples [93,95,96,97], suggest that single replicates may be sufficient to detect a large percentage (≥75%) of organisms in systems supporting moderate biodiversity. Sequencing depth is also well documented to affect eDNA metabarcoding efficacy [91], with increasing sequencing depth resulting in increased species detection [91]. Sequencing depths vary widely: a 2019 review of 20 metabarcoding studies of various types reported a median number of 60,000 raw reads per sample [91]. Several eDNA metabarcoding studies targeting freshwater fish in lotic systems report mean raw reads per marker of 78,302 [54], 167,834 [98], and 185,804 [72]. In contrast, we obtained 516,595 (Batra) and 345,848 (MiFish) raw reads per marker per sample (862,443 total per sample), of which 69% (Batra) and 62% (MiFish) were assigned to fish at species level (97% confidence level). Additionally, a comparison of NovaSeq and MiSeq revealed that NovaSeq detected a greater number of species, even at identical read depths, likely as a result of the use of a patterned flow cell (not used in MiSeq) [91]. NextSeq 2000, utilized in this study and first available in 2020, uses an identical patterned flow cell [99]. Although we see few eDNA metabarcoding studies that have utilized NextSeq 2000 [100], in the current study, it appeared to effectively survey biodiversity and offers a cost per read nearly an order of magnitude lower than MiSeq. Although we recognize the importance of high numbers of field replicates in highly biodiverse systems, our results suggest that a single field replicate and increased sequencing depth are sufficient to detect a significant percentage of fish biodiversity in moderately biodiverse environments.

4.3. Comparison with Electrofishing Data

An increasing number of studies report that eDNA is capable of both effectively assessing fish communities in systems of moderate biodiversity [33,40] and detecting a greater number of species relative to conventional methods [30,41]. In this study, the eDNA detection of a significant portion (78–81%) of, but not all of, the species observed in electrofishing surveys was likely, given the comparison of one year of eDNA data with up to 33 years of electrofishing data. A degree of stochasticity in eDNA detection is well documented [101] and, in the case of this study, the continued presence of fish species at a particular site was not guaranteed. In nearly every case, only a portion of species detected cumulatively were detected in any one year via electrofishing surveys. The observation of a greater number of fish species detected via eDNA, often including species not historically observed at these sites (but observed in upstream sites), is also likely due to the nature of eDNA, particularly in relatively small, lotic systems. Numerous studies have detailed the manner in which lotic systems act as “conveyer belts” for eDNA, moving DNA downstream significant distances [90,102]. A recent study examining a large, lotic system reported the detection of caged fish l5,000 m downstream [103]. The temperatures [88] and smaller size [50] of the lotic systems in the GSMNP likely enhance this transport and downstream detectability.
The ability of eDNA metabarcoding to provide insight into species abundance and biomass remains uncertain. PCR-associated biases, including annealing temperature and secondary structure [104], taxon-specific amplification bias [105,106], and polymerase GC preference [61], are well established and likely preclude a truly quantitative application of metabarcoding. However, several studies report correlations between eDNA metabarcoding read counts and abundance or biomass, as determined by established survey methods, in marine [107], freshwater lentic [69,95,108,109,110], and lotic [111] environments. A meta-analysis of 22 studies examining the relationship between taxon biomass and the number of sequences produced by that taxon concluded that a weak quantitative relationship (slope = 0.52 ± 0.34, p < 0.01) may exist between these variables, with a great deal of uncertainty currently remaining [112]. The present study provides a unique opportunity to examine the relationship between these variables, given the opportunity to compare multiple years of fish community biomass data with a single time point eDNA survey. Given the general long-term temporal consistency of GSMNP fish communities [23], the probability of an accurate assessment of the true biomass of species per site was likely enhanced by the multiple years of electrofishing data available and utilized for the majority (76%, 24% of sites only had one year of electrofishing data available) of the sites used in the analysis. We observed significant correlations between five of the seven species examined, including all salmonid species, and correlation values that exceed most currently reported values [112]. These observations support the premise that eDNA metabarcoding read count may be used, albeit with caution, as an approximate indicator of the biomass of target species in small, lotic systems.

4.4. Detection of Unexpected Species

We detected five fish species which are not typically observed in the lotic systems of the GSMNP, each of which is native to the region and the watersheds that comprise the park. Fundulus catenatus (northern studfish), detected at five sites in this study, was reported historically in the park in low-elevation streams prior to 1957 [58,113]. Four of the sites in which F. catenatus was detected in this study are low-elevation (≤500 m), including a stream in which F. catenatus was historically reported as abundant [113]. The native range of Nocomis leptocephalus (bluehead chub), detected at 10 relatively low- elevation (<900 m) sites in this study, is mostly just to the west of the GSMNP, but this species has been reported as introduced in portions of all drainages that comprise the park [114,115,116], likely as a result of “bait bucket” introductions [117]. Nocomis micropogon (river chub), detected at 19 sites, is native to all watersheds of the park, is a common inhabitant of park streams [21,57,113], and was detected at eight of the 10 sites at which N. leptocephalus was detected. Hybridization is well documented between these species [118], including in drainages that comprise the park [114], but would not be discernable when utilizing mitochondrial markers. Additionally, we note that N. leptocephalus was detected by the Batra primer set but not the MiFish primer set, despite primer compatibility and sufficient coverage in the database; it is one of the 21 species detected solely by the Batra primer set. Pimephales notatus (bluntnose minnow) and Ictiobus bubalus (smallmouth buffalo) were each detected in a single site; P. notatus is common in lower-elevation streams adjacent to the park [57] while I. bubalus is native to drainages comprising the park and was recently introduced into one of these drainages in which the species was believed extirpated [119]. Alosa chrysochloris (skipjack herring) is native to many of the large river systems in the eastern USA, and its habitat now includes the reservoirs constructed on these rivers [57]. The single detection of A. chrysochloris in this study was in a relatively large stream (third order, 527 m elevation) 0.32 km above the point at which the stream enters a large reservoir (Fontana) that borders the western edge of the GSMNP. Although we exercised every precaution to prevent false positives, the possibility of prey organism DNA transfer via bird (or other organism) feces [120] remains a possibility, and we recommend further molecular and/or field surveys to confirm these detections.

4.5. Community Composition Observations

Distinct variation in fish community composition across stream order and elevation was evident in eDNA metabarcoding data in this study. Consistent with the River Continuum Concept [121], lotic systems in the GSMNP harbor fish communities that increase in diversity as elevation decreases and stream order increases [21,58], trends evident in eDNA data in the present study. These observations are consistent with similar studies reporting discernable differences in fish community assemblage based on eDNA metabarcoding data [41,54,98] and provide additional support for the congruence between traditional sampling and eDNA methods.

5. Conclusions

These data offer novel insight into the use of eDNA metabarcoding in the assessment of ichthyofaunal communities in high-elevation lotic systems and indicate a relatively high degree of congruence between an extensive body of historic electrofishing data and eDNA metabarcoding data in these systems. The data suggest that metabarcoding primers targeting shorter amplicons may exhibit greater efficacy in these systems; in this study, the primer set creating a 97 bp amplicon detected 90% of species, while the primer set amplifying a longer DNA segment (225 bp) detected only 70% of the 40 total species detected. Additionally, these data represent one of the few observations of correlations between fish biomass determined by conventional methods and eDNA metabarcoding read abundance in lotic systems, an observation more frequently made in lentic systems. This work supports the premise that eDNA metabarcoding appears to be an effective tool for quantifying fish communities in relatively small, high-gradient systems.

Supplementary Materials

The following supporting information can be downloaded at: https://www.mdpi.com/article/10.3390/fishes10040145/s1. Figure S1. Redundancy Analysis (RDA) (A) and Canonical Correspondence Analysis (CCA) (B) plots based on the Hellinger distance matrix of the number of reads per species with elevation (m) and Strahler stream order as the predictors.

Author Contributions

B.F.B. served as the PI of the lab from which this research originated; he obtained funding, participated in and supervised all field and lab work, and wrote the manuscript text, preparing all figures and tables. S.A.B. participated in all field work, conducted the majority of the lab work, and edited the manuscript extensively. K.S.F. and L.E.S. performed much of the lab work and edited the manuscript. M.A.K. supervised the collection of, processed, and provided the electrofishing data and edited the manuscript. B.R.S.M. conducted much of the bioinformatic and statistical analyses and wrote portions of the manuscript. All authors have read and agreed to the published version of the manuscript.

Funding

This research was funded by a Carlos C. Campbell Memorial Fellowship (2023) from the Great Smoky Mountains Conservation Association. Additional support was provided by the Asbury University Department of Science and Health, Shaw School of Science.

Institutional Review Board Statement

Not applicable.

Data Availability Statement

The data presented in this study are available upon request from the corresponding author.

Acknowledgments

We sincerely thank Elizabeth Strasko for her assistance in the field during sample collection and Madeline Cox for the generous preparation of Figure 1 (map of sampling sites). We thank Aaron Aunis for generously sharing mitochondrial sequence data for a Noturus flavipinnis specimen. High-throughput sequencing was completed in the OncoGenomics Shared Resource Facility of the University of Kentucky Markey Cancer Center (P30CA177558).

Conflicts of Interest

Each author declares no conflicts of interest.

References

  1. Ficetola, G.F.; Miaud, C.; Pompanon, F.; Taberlet, P. Species Detection Using Environmental DNA from Water Samples. Biol. Lett. 2008, 4, 423–425. [Google Scholar] [CrossRef] [PubMed]
  2. Takahashi, M.; Saccò, M.; Kestel, J.H.; Nester, G.; Campbell, M.A.; van der Heyde, M.; Heydenrych, M.J.; Juszkiewicz, D.J.; Nevill, P.; Dawkins, K.L.; et al. Aquatic Environmental DNA: A Review of the Macro-Organismal Biomonitoring Revolution. Sci. Total Environ. 2023, 873, 162322. [Google Scholar] [CrossRef]
  3. Blackman, R.; Couton, M.; Keck, F.; Kirschner, D.; Carraro, L.; Cereghetti, E.; Perrelet, K.; Bossart, R.; Brantschen, J.; Zhang, Y.; et al. Environmental DNA: The next Chapter. Mol. Ecol. 2024, 33, e17355. [Google Scholar] [CrossRef]
  4. Bunce, M.; Freeth, A. Looking Further and Deeper into Environmental Protection, Regulation and Policy Using Environmental DNA (eDNA). Policy Q. 2022, 18, 33–39. [Google Scholar] [CrossRef]
  5. Lodge, D.M. Policy Action Needed to Unlock eDNA Potential. Front. Ecol. Environ. 2022, 20, 448–449. [Google Scholar] [CrossRef]
  6. Kelly, R.P.; Lodge, D.M.; Lee, K.N.; Theroux, S.; Sepulveda, A.J.; Scholin, C.A.; Craine, J.M.; Andruszkiewicz Allan, E.; Nichols, K.M.; Parsons, K.M.; et al. Toward a National eDNA Strategy for the United States. Environ. DNA 2024, 6, e432. [Google Scholar] [CrossRef]
  7. Buchner, D.; Sinclair, J.S.; Ayasse, M.; Beermann, A.J.; Buse, J.; Dziock, F.; Enss, J.; Frenzel, M.; Hörren, T.; Li, Y.; et al. Upscaling Biodiversity Monitoring: Metabarcoding Estimates 31,846 Insect Species from Malaise Traps across Germany. Mol. Ecol. Resour. 2025, 25, e14023. [Google Scholar] [CrossRef]
  8. Liu, M.; Clarke, L.J.; Baker, S.C.; Jordan, G.J.; Burridge, C.P. A Practical Guide to DNA Metabarcoding for Entomological Ecologists. Ecol. Entomol. 2020, 45, 373–385. [Google Scholar]
  9. Marquina, D.; Andersson, A.F.; Ronquist, F. New Mitochondrial Primers for Metabarcoding of Insects, Designed and Evaluated Using in Silico Methods. Mol. Ecol. Resour. 2019, 19, 90–104. [Google Scholar] [CrossRef]
  10. de Santana, C.D.; Parenti, L.R.; Dillman, C.B.; Coddington, J.A.; Bastos, D.A.; Baldwin, C.C.; Zuanon, J.; Torrente-Vilara, G.; Covain, R.; Menezes, N.A.; et al. The Critical Role of Natural History Museums in Advancing eDNA for Biodiversity Studies: A Case Study with Amazonian Fishes. Sci. Rep. 2021, 11, 18159. [Google Scholar] [CrossRef]
  11. Leduc, N.; Lacoursière-Roussel, A.; Howland, K.L.; Archambault, P.; Sevellec, M.; Normandeau, E.; Dispas, A.; Winkler, G.; McKindsey, C.W.; Simard, N.; et al. Comparing eDNA Metabarcoding and Species Collection for Documenting Arctic Metazoan Biodiversity. Environ. DNA 2019, 1, 342–358. [Google Scholar] [CrossRef]
  12. Shen, M.; Xiao, N.; Zhao, Z.; Guo, N.; Luo, Z.; Sun, G.; Li, J. eDNA Metabarcoding as a Promising Conservation Tool to Monitor Fish Diversity in Beijing Water Systems Compared with Ground Cages. Sci. Rep. 2022, 12, 11113. [Google Scholar] [CrossRef] [PubMed]
  13. Macher, T.H.; Schütz, R.; Yildiz, A.; Beermann, A.J.; Leese, F. Evaluating Five Primer Pairs for Environmental DNA Metabarcoding of Central European Fish Species Based on Mock Communities. Metabarcoding Metagenom. 2023, 7, e103856. [Google Scholar] [CrossRef]
  14. Beng, K.C.; Corlett, R.T. Applications of Environmental DNA (eDNA) in Ecology and Conservation: Opportunities, Challenges and Prospects. Biodivers. Conserv. 2020, 29, 2089–2121. [Google Scholar] [CrossRef]
  15. Wang, S.; Yan, Z.; Hänfling, B.; Zheng, X.; Wang, P.; Fan, J.; Li, J. Methodology of Fish eDNA and Its Applications in Ecology and Environment. Sci. Total Environ. 2021, 755, 142622. [Google Scholar] [CrossRef] [PubMed]
  16. Schenekar, T. The Current State of eDNA Research in Freshwater Ecosystems: Are We Shifting from the Developmental Phase to Standard Application in Biomonitoring? Hydrobiologia 2022, 850, 1263–1282. [Google Scholar] [CrossRef]
  17. Cortelezzi, A.; Paz, L.E. Macroinvertebrate Biomonitoring in Latin America: Progress and Challenges. Freshw. Sci. 2023, 42, 204–213. [Google Scholar] [CrossRef]
  18. De Brauwer, M.; Clarke, L.J.; Chariton, A.; Cooper, M.K.; de Bruyn, M.; Furlan, E.; MacDonald, A.J.; Rourke, M.L.; Sherman, C.D.H.; Suter, L.; et al. Best Practice Guidelines for Environmental DNA Biomonitoring in Australia and New Zealand. Environ. DNA 2023, 5, 417–423. [Google Scholar] [CrossRef]
  19. Jenkins, M.A. Vegetation Communities of Great Smoky Mountains National Park. Southeast. Nat. 2007, 6, 35–56. [Google Scholar] [CrossRef]
  20. Lennon, R.E. An Annotated List of the Fishes of the Great Smoky Mountains National Park. J. Tenn Acad. Sci. 1962, 37, 5–7. [Google Scholar]
  21. Simbeck, D.J. Distribution of the Fishes of The Great Smoky Mountains National Distribution of the Fishes of The Great Smoky Mountains National Park. Master Thesis, University of Tennessee, Knoxville, TN, USA, December 1990. [Google Scholar]
  22. Bates, P.C.; Miller, J.R.; Styers, D.M.; Langdon, K.; Burda, C.; Davis, R.; Martin, T.; Kloeppel, B.D.; McFarland, S. Natural Resource Condition Assessment Great Smoky Mountains National Park; Natural Resource Report NPS/GRSM/NRR; National Park Service: Fort Collins, CO, USA, 2018. [Google Scholar]
  23. Kulp, M.A.; Moore, S.E. A Case History in Fishing Regulations in Great Smoky Mountains National Park: 1934–2004. N. Am. J. Fish. Manag. 2005, 25, 510–524. [Google Scholar] [CrossRef]
  24. Baldigo, B.P.; Kulp, M.A.; Schwartz, J.S. Relationships between Indicators of Acid-Base Chemistry and Fish Assemblages in Streams of the Great Smoky Mountains National Park. Ecol. Indic. 2018, 88, 465–484. [Google Scholar] [CrossRef]
  25. Deyton, E.B.; Schwartz, J.S.; Robinson, R.B.; Neff, K.J.; Moore, S.E.; Kulp, M.A. Characterizing Episodic Stream Acidity during Stormflows in the Great Smoky Mountains National Park. Water Air Soil. Pollut. 2009, 196, 3–18. [Google Scholar] [CrossRef]
  26. Neff, K.J.; Schwartz, J.S.; Henry, T.B.; Bruce Robinson, R.; Moore, S.E.; Kulp, M.A. Physiological Stress in Native Southern Brook Trout during Episodic Stream Acidification in the Great Smoky Mountains National Park. Arch. Environ. Contam. Toxicol. 2009, 57, 366–376. [Google Scholar] [CrossRef] [PubMed]
  27. Lennon, R.E.; Parker, P.S. The Stoneroller, Campostoma anomalum (Rafinesque), in Great Smoky Mountains National Park. Trans. Am. Fish. Soc. 1960, 89, 263–270. [Google Scholar] [CrossRef]
  28. King, W. A Program for the Management of Fish Resources in Great Smoky Mountains National Park. Trans. Am. Fish. Soc. 1939, 68, 86–95. [Google Scholar] [CrossRef]
  29. Fediajevaite, J.; Priestley, V.; Arnold, R.; Savolainen, V. Meta-Analysis Shows That Environmental DNA Outperforms Traditional Surveys, but Warrants Better Reporting Standards. Ecol. Evol. 2021, 11, 4803–4815. [Google Scholar] [CrossRef]
  30. McElroy, M.E.; Dressler, T.L.; Titcomb, G.C.; Wilson, E.A.; Deiner, K.; Dudley, T.L.; Eliason, E.J.; Evans, N.T.; Gaines, S.D.; Lafferty, K.D.; et al. Calibrating Environmental DNA Metabarcoding to Conventional Surveys for Measuring Fish Species Richness. Front. Ecol. Evol. 2020, 8, 276. [Google Scholar] [CrossRef]
  31. Yates, M.C.; Wilcox, T.M.; Kay, S.; Heath, D.D. A General Framework to Unify the Estimation of Numerical Abundance and Biomass from Quantitative EDNA Data. Environmental DNA. 2025, 7, e70073. [Google Scholar] [CrossRef]
  32. Jerde, C.L. Can We Manage Fisheries with the Inherent Uncertainty from eDNA? J. Fish. Biol. 2021, 98, 341–353. [Google Scholar]
  33. Keck, F.; Blackman, R.C.; Bossart, R.; Brantschen, J.; Couton, M.; Hürlemann, S.; Kirschner, D.; Locher, N.; Zhang, H.; Altermatt, F. Meta-Analysis Shows Both Congruence and Complementarity of DNA and eDNA Metabarcoding to Traditional Methods for Biological Community Assessment. Mol. Ecol. 2022, 31, 1820–1835. [Google Scholar] [CrossRef]
  34. Stoeckle, B.C.; Beggel, S.; Cerwenka, A.F.; Motivans, E.; Kuehn, R.; Geist, J. A Systematic Approach to Evaluate the Influence of Environmental Conditions on eDNA Detection Success in Aquatic Ecosystems. PLoS ONE 2017, 12, e0189119. [Google Scholar] [CrossRef] [PubMed]
  35. Mathieu, C.; Hermans, S.M.; Lear, G.; Buckley, T.R.; Lee, K.C.; Buckley, H.L. A Systematic Review of Sources of Variability and Uncertainty in eDNA Data for Environmental Monitoring. Front. Ecol. Evol. 2020, 8, 135. [Google Scholar] [CrossRef]
  36. Baldigo, B.P.; Sporn, L.A.; George, S.D.; Ball, J.A. Efficacy of Environmental DNA to Detect and Quantify Brook Trout Populations in Headwater Streams of the Adirondack Mountains, New York. Trans. Am. Fish. Soc. 2017, 146, 99–111. [Google Scholar] [CrossRef]
  37. Yates, M.C.; Wilcox, T.M.; McKelvey, K.S.; Young, M.K.; Schwartz, M.K.; Derry, A.M. Allometric Scaling of eDNA Production in Stream-Dwelling Brook Trout (Salvelinus Fontinalis) Inferred from Population Size Structure. Environ. DNA 2021, 3, 553–560. [Google Scholar] [CrossRef]
  38. Urabe, H.; Mizumoto, H.; Tsuda-Yamaguchi, F.; Araki, H. Spatial Heterogeneity of eDNA Concentration as a Predictor of Small Biomass of Fish in a Mountain Stream. Limn 2024, 26, 223–233. [Google Scholar] [CrossRef]
  39. Aunins, A.W.; Eackles, M.S.; Super, P.E.; Kulp, M.A.; Nichols, B.J.; Lubinski, B.A.; Morrison, C.L.; King, T.L. Development of a DdPCR Assay for the Detection of the Smoky Madtom (Noturus baileyi) from eDNA in Stream Water Samples. Conserv. Genet. Resour. 2022, 14, 29–435. [Google Scholar] [CrossRef]
  40. Liu, Z.; Hu, C.; You, W.; Li, S.; Wu, Y.; Liang, Y.; Chu, L.; Yan, Y.; Zhang, C. Comparison Between Environmental DNA Metabarcoding and Traditional Survey Method to Identify Community Composition and Assembly of Stream Fish. Ecol. Evol. 2024, 14, e70627. [Google Scholar] [CrossRef]
  41. Lee, V.M.; Berkman, L.K.; Geheber, A.D.; Landwer, B.; Ludwig, E.J.; Duvernell, D.D. Putting eDNA to the Test: A Field Comparison of eDNA Metabarcoding to Established Protocols for Assessing Biodiversity in Missouri’s Ozark Highland Streams. Environ. DNA 2024, 6, e510. [Google Scholar] [CrossRef]
  42. Strahler, A.N. Quantitative Analysis of Watershed Geomorphology. Eos Trans. Am. Geophys. Union 1957, 38, 913–920. [Google Scholar] [CrossRef]
  43. Majaneva, M.; Diserud, O.H.; Eagle, S.H.C.; Boström, E.; Hajibabaei, M.; Ekrem, T. Environmental DNA Filtration Techniques Affect Recovered Biodiversity. Sci. Rep. 2018, 8, 4682. [Google Scholar] [CrossRef]
  44. Hinlo, R.; Gleeson, D.; Lintermans, M.; Furlan, E. Methods to Maximize Recovery of Environmental DNA from Water Samples. PLoS ONE 2017, 12, e0179251. [Google Scholar] [CrossRef]
  45. Goldberg, C.S.; Pilliod, D.S.; Arkle, R.S.; Waits, L.P. Molecular Detection of Vertebrates in Stream Water: A Demonstration Using Rocky Mountain Tailed Frogs and Idaho Giant Salamanders. PLoS ONE 2011, 6, e22746. [Google Scholar] [CrossRef]
  46. Carvalho, C.O.; Gromstad, W.; Dunthorn, M.; Karlsen, H.E.; Schrøder-Nielsen, A.; Ready, J.S.; Haugaasen, T.; Sørnes, G.; de Boer, H.; Mauvisseau, Q. Harnessing eDNA Metabarcoding to Investigate Fish Community Composition and Its Seasonal Changes in the Oslo Fjord. Sci. Rep. 2024, 14, 10154. [Google Scholar] [CrossRef]
  47. Taberlet, P.; Luikart, G.; Waits, L.P. Noninvasive Genetic Sampling: Look before You Leap. Trends Ecol. Evol. 1999, 14, 323–327. [Google Scholar] [CrossRef]
  48. Goldberg, C.S.; Turner, C.R.; Deiner, K.; Klymus, K.E.; Thomsen, P.F.; Murphy, M.A.; Spear, S.F.; McKee, A.; Oyler-McCance, S.J.; Cornman, R.S.; et al. Critical Considerations for the Application of Environmental DNA Methods to Detect Aquatic Species. Methods Ecol. Evol. 2016, 7, 1299–1307. [Google Scholar] [CrossRef]
  49. Hartman, L.J.; Coyne, S.R.; Norwood, D.A. Development of a Novel Internal Positive Control for Taqman® Based Assays. Mol. Cell Probes 2005, 19, 51–59. [Google Scholar] [CrossRef]
  50. Pierson, T.W.; McKee, A.M.; Spear, S.F.; Maerz, J.C.; Camp, C.D.; Glenn, T.C. Detection of an Enigmatic Plethodontid Salamander Using Environmental DNA. Copeia 2016, 104, 78–82. [Google Scholar] [CrossRef]
  51. Collins, R.A.; Bakker, J.; Wangensteen, O.S.; Soto, A.Z.; Corrigan, L.; Sims, D.W.; Genner, M.J.; Mariani, S. Non-Specific Amplification Compromises Environmental DNA Metabarcoding with COI. Methods Ecol. Evol. 2019, 10, 1985–2001. [Google Scholar] [CrossRef]
  52. Miya, M.; Sato, Y.; Fukunaga, T.; Sado, T.; Poulsen, J.Y.; Sato, K.; Minamoto, T.; Yamamoto, S.; Yamanaka, H.; Araki, H.; et al. MiFish, a Set of Universal PCR Primers for Metabarcoding Environmental DNA from Fishes: Detection of More than 230 Subtropical Marine Species. R. Soc. Open Sci. 2015, 2, 150088. [Google Scholar] [CrossRef]
  53. Li, Y.; Tang, M.; Lu, S.; Zhang, X.; Fang, C.; Tan, L.; Xiong, F.; Zeng, H.; He, S. A Comparative Evaluation of eDNA Metabarcoding Primers in Fish Community Monitoring in the East Lake. Water 2024, 16, 631. [Google Scholar] [CrossRef]
  54. Ludwig, E.J.; Lee, V.M.; Berkman, L.K.; Geheber, A.D.; Duvernell, D.D. Biodiversity Assessment of a Mississippi River Backwater Complex Using eDNA Metabarcoding. Diversity 2024, 16, 495. [Google Scholar] [CrossRef]
  55. Valentini, A.; Taberlet, P.; Miaud, C.; Civade, R.; Herder, J.; Thomsen, P.F.; Bellemain, E.; Besnard, A.; Coissac, E.; Boyer, F.; et al. Next-Generation Monitoring of Aquatic Biodiversity Using Environmental DNA Metabarcoding. Mol. Ecol. 2016, 25, 929–942. [Google Scholar] [CrossRef]
  56. Elbrecht, V.; Leese, F. PrimerMiner: An r Package for Development and in Silico Validation of DNA Metabarcoding Primers. Methods Ecol. Evol. 2017, 8, 622–626. [Google Scholar] [CrossRef]
  57. Etnier, D.E.; Starnes, W.C. The Fishes of Tennessee; University of Tennessee Press: Knoxville, TN, USA, 1993. [Google Scholar]
  58. Lennon, R.E. The Fishes of the Great Smoky Mountains National Park; Bureau of Sport Fisheries and Wildlife: Fairfax, VA, USA, 1960. [Google Scholar]
  59. Glenn, T.C.; Pierson, T.W.; Bayona-Vásquez, N.J.; Kieran, T.J.; Hoffberg, S.L.; Thomas, J.C.; Lefever, D.E.; Finger, J.W.; Gao, B.; Bian, X.; et al. Adapterama II: Universal Amplicon Sequencing on Illumina Platforms (TaggiMatrix). PeerJ 2019, 7, e7786. [Google Scholar] [CrossRef] [PubMed]
  60. Van Den Bulcke, L.; De Backer, A.; Ampe, B.; Maes, S.; Wittoeck, J.; Waegeman, W.; Hostens, K.; Derycke, S. Towards Harmonization of DNA Metabarcoding for Monitoring Marine Macrobenthos: The Effect of Technical Replicates and Pooled DNA Extractions on Species Detection. Metabar. Metagenom. 2021, 5, 233–247. [Google Scholar] [CrossRef]
  61. Nichols, R.V.; Vollmers, C.; Newsom, L.A.; Wang, Y.; Heintzman, P.D.; Leighton, M.; Green, R.E.; Shapiro, B. Minimizing Polymerase Biases in Metabarcoding. Mol. Ecol. Resour. 2018, 18, 927–939. [Google Scholar] [CrossRef]
  62. Campbell, C.D.; MacDonald, A.J.; Sarre, S.D. Evaluation of Genetic Markers for the Metabarcoding of Australian Marsupials from Predator Scats. Wildl. Res. 2024, 51, WR23134. [Google Scholar] [CrossRef]
  63. Fernandes, K.; van der Heyde, M.; Coghlan, M.; Wardell-Johnson, G.; Bunce, M.; Harris, R.; Nevill, P. Invertebrate DNA Metabarcoding Reveals Changes in Communities across Mine Site Restoration Chronosequences. Restor. Ecol. 2019, 27, 1177–1186. [Google Scholar] [CrossRef]
  64. Schnell, I.B.; Bohmann, K.; Gilbert, M.T.P. Tag Jumps Illuminated—Reducing Sequence-to-Sample Misidentifications in Metabarcoding Studies. Mol. Ecol. Resour. 2015, 15, 1289–1303. [Google Scholar] [CrossRef]
  65. Klymus, K.E.; Baker, J.D.; Abbott, C.L.; Brown, R.J.; Craine, J.M.; Gold, Z.; Hunter, M.E.; Johnson, M.D.; Jones, D.N.; Jungbluth, M.J.; et al. The MIEM Guidelines: Minimum Information for Reporting of Environmental Metabarcoding Data. Metabar. Metagenom. 2024, 8, e128689. [Google Scholar] [CrossRef]
  66. Martin, M. Cutadapt Removes Adapter Sequences from High-Throughput Sequencing Reads. EMBnet J. 2011, 17, 10–12. [Google Scholar] [CrossRef]
  67. Mathon, L.; Valentini, A.; Guérin, P.E.; Normandeau, E.; Noel, C.; Lionnet, C.; Boulanger, E.; Thuiller, W.; Bernatchez, L.; Mouillot, D.; et al. Benchmarking Bioinformatic Tools for Fast and Accurate eDNA Metabarcoding Species Identification. Mol. Ecol. Resour. 2021, 21, 2565–2579. [Google Scholar] [CrossRef] [PubMed]
  68. McColl-Gausden, E.F.; Weeks, A.R.; Coleman, R.A.; Robinson, K.L.; Song, S.; Raadik, T.A.; Tingley, R. Multispecies Models Reveal That eDNA Metabarcoding Is More Sensitive than Backpack Electrofishing for Conducting Fish Surveys in Freshwater Streams. Mol. Ecol. 2021, 30, 3111–3126. [Google Scholar] [CrossRef]
  69. Di Muri, C.; Handley, L.L.; Bean, C.W.; Li, J.; Peirson, G.; Sellers, G.S.; Walsh, K.; Watson, H.V.; Winfield, I.J.; Hänfling, B. Read Counts from Environmental DNA (eDNA) Metabarcoding Reflect Fish Abundance and Biomass in Drained Ponds. Metabar. Metagenom. 2020, 4, e56959. [Google Scholar] [CrossRef]
  70. R Core Team. R: A Language and Environment for Statistical Computing; R Foundation for Statistical Computing: Vienna, Austria, 2023. [Google Scholar]
  71. Oksanen, J.; Blanchet, F.G.; Friendly, M.; Kindt, R.; Legendre, P.; Mcglinn, D.; Minchin, P.R.; O’hara, R.B.; Simpson, G.L.; Solymos, P.; et al. Vegan: Community Ecology Package. Ordination Methods, Diversity Analysis and Other Functions for Community and Vegetation Ecologists; R Package Version 2(0); Comprehensive R Archive Network; 2015; Volume 2. [Google Scholar]
  72. Berger, C.S.; Hernandez, C.; Laporte, M.; Côté, G.; Paradis, Y.; Kameni, T.; Kameni, T.D.W.; Normandeau, E.; Bernatchez, L. Fine-Scale Environmental Heterogeneity Shapes Fluvial Fish Communities as Revealed by eDNA Metabarcoding. Environ. DNA 2020, 2, 647–666. [Google Scholar] [CrossRef]
  73. Laporte, M.; Reny-Nolin, E.; Chouinard, V.; Hernandez, C.; Normandeau, E.; Bougas, B.; Côté, C.; Behmel, S.; Bernatchez, L. Proper Environmental DNA Metabarcoding Data Transformation Reveals Temporal Stability of Fish Communities in a Dendritic River System. Environ. DNA 2021, 3, 1007–1022. [Google Scholar] [CrossRef]
  74. Habera, J.W.; Kulp, M.A.; Moore, S.E.; Henry, T.B. Three-Pass Depletion Sampling Accuracy of Two Electric Fields for Estimating Trout Abundance in a Low-Conductivity Stream with Limited Habitat Complexity. N. Am. J. Fish. Manag. 2010, 30, 757–766. [Google Scholar] [CrossRef]
  75. Angermeier, P.L.; Karr, J.R. Applying an Index of Biotic Integrity Based on Stream-Fish Communities: Considerations in Sampling and Interpretation. N. Am. J. Fish. Manag. 1986, 6, 418–429. [Google Scholar] [CrossRef]
  76. Karr, J.R.; Fausch, K.D.; Angermeier, P.L.; Yant, P.R.; Schlosser, I.J. Assessing Biological Integrity in Running Waters: A Method and Its Rationale. Ill. Nat. Hist. Surv. Spec. Publ. 1986, 5, 1–28. [Google Scholar]
  77. Nielsen, K.M.; Johnsen, P.J.; Bensasson, D.; Daffonchio, D. Release and Persistence of Extracellular DNA in the Environment. Environ. Biosaf. Res. 2007, 6, 37–53. [Google Scholar] [CrossRef]
  78. DeFlaun, M.; Paul, J.; Jeffrey, W. Distribution and Molecular Weight of Dissolved DNA in Subtropical Estuarine and Oceanic Environments. Mar. Ecol. Prog. Ser. 1987, 38, 65–73. [Google Scholar] [CrossRef]
  79. Saito, T.; Doi, H. A Model and Simulation of the Influence of Temperature and Amplicon Length on Environmental DNA Degradation Rates: A Meta-Analysis Approach. Front. Ecol. Evol. 2021, 9, 623831. [Google Scholar] [CrossRef]
  80. Barnes, M.A.; Turner, C.R. The Ecology of Environmental DNA and Implications for Conservation Genetics. Conserv. Genet. 2016, 17, 1–17. [Google Scholar] [CrossRef]
  81. Yamamoto, S.; Jo, T.; Murakami, H.; Minamoto, T.; Masuda, R. Effect of Water Temperature and Fish Biomass on Environmental DNA Shedding, Degradation, and Size Distribution. Ecol. Evol. 2019, 9, 1135–1146. [Google Scholar] [CrossRef]
  82. Pietramellara, G.; Ascher, J.; Borgogni, F.; Ceccherini, M.T.; Guerri, G.; Nannipieri, P. Extracellular DNA in Soil and Sediment: Fate and Ecological Relevance. Biol. Fertil. Soils 2009, 45, 219–235. [Google Scholar] [CrossRef]
  83. Zhu, B. Degradation of Plasmid and Plant DNA in Water Microcosms Monitored by Natural Transformation and Real-Time Polymerase Chain Reaction (PCR). Water Res. 2006, 40, 3231–3238. [Google Scholar] [CrossRef]
  84. Woodruff, S.P.; Johnson, T.R.; Waits, L.P. Evaluating the Interaction of Faecal Pellet Deposition Rates and DNA Degradation Rates to Optimize Sampling Design for DNA-Based Mark-Recapture Analysis of Sonoran Pronghorn. Mol. Ecol. Resour. 2015, 15, 843–854. [Google Scholar] [CrossRef]
  85. Bylemans, J.; Furlan, E.M.; Gleeson, D.M.; Hardy, C.M.; Duncan, R.P. Does Size Matter? An Experimental Evaluation of the Relative Abundance and Decay Rates of Aquatic Environmental DNA. Environ. Sci. Technol. 2018, 52, 6408–6416. [Google Scholar] [CrossRef]
  86. Zhang, S.; Zhao, J.; Yao, M. A Comprehensive and Comparative Evaluation of Primers for Metabarcoding eDNA from Fish. Methods Ecol. Evol. 2020, 11, 1609–1625. [Google Scholar] [CrossRef]
  87. Wei, N.; Nakajima, F.; Tobino, T. Effects of Treated Sample Weight and DNA Marker Length on Sediment eDNA Based Detection of a Benthic Invertebrate. Ecol. Indic. 2018, 93, 267–273. [Google Scholar] [CrossRef]
  88. Silsbee, D.G.; Larson, G.L. Water Quality of Streams in the Great Smoky Mountains National Park. Hydrobiologia 1982, 89, 97–115. [Google Scholar] [CrossRef]
  89. Bessey, C.; Jarman, S.N.; Berry, O.; Olsen, Y.S.; Bunce, M.; Simpson, T.; Power, M.; McLaughlin, J.; Edgar, G.J.; Keesing, J. Maximizing Fish Detection with eDNA Metabarcoding. Environ. DNA 2020, 2, 493–504. [Google Scholar] [CrossRef]
  90. Macher, T.H.; Schütz, R.; Arle, J.; Beermann, A.J.; Koschorreck, J.; Leese, F. Beyond Fish Edna Metabarcoding: Field Replicates Disproportionately Improve the Detection of Stream Associated Vertebrate Species. Metabar. Metagenom. 2021, 5, e66557. [Google Scholar] [CrossRef]
  91. Singer, G.A.C.; Fahner, N.A.; Barnes, J.G.; McCarthy, A.; Hajibabaei, M. Comprehensive Biodiversity Analysis via Ultra-Deep Patterned Flow Cell Technology: A Case Study of eDNA Metabarcoding Seawater. Sci. Rep. 2019, 9, 5991. [Google Scholar] [CrossRef]
  92. Brammell, B.F.; Strasko, E.K.; Brewer, S.A.; Piche, R.R.; Sams, C.M.; Mott, C.L.; Stull, M.A. Detecting Fossorial Salamanders Using eDNA: Development and Validation of Quantitative and End-Point PCR Assays for the Detection of Five Species of Ambystoma. Conserv. Genet. Resour. 2023, 15, 187–198. [Google Scholar] [CrossRef]
  93. Fujii, K.; Doi, H.; Matsuoka, S.; Nagano, M.; Sato, H.; Yamanaka, H. Environmental DNA Metabarcoding for Fish Community Analysis in Backwater Lakes: A Comparison of Capture Methods. PLoS ONE 2019, 14, e0210357. [Google Scholar] [CrossRef]
  94. Kumar, K.R.; Cowley, M.J.; Davis, R.L. Next-Generation Sequencing and Emerging Technologies. Semin. Thromb. Hemost. 2024, 50, 1026–1038. [Google Scholar] [CrossRef]
  95. Hänfling, B.; Handley, L.L.; Read, D.S.; Hahn, C.; Li, J.; Nichols, P.; Blackman, R.C.; Oliver, A.; Winfield, I.J. Environmental DNA Metabarcoding of Lake Fish Communities Reflects Long-Term Data from Established Survey Methods. Mol. Ecol. 2016, 25, 3101–3119. [Google Scholar] [CrossRef]
  96. Blabolil, P.; Harper, L.R.; Říčanová, Š.; Sellers, G.; Di Muri, C.; Jůza, T.; Vašek, M.; Sajdlová, Z.; Rychtecký, P.; Znachor, P.; et al. Environmental DNA Metabarcoding Uncovers Environmental Correlates of Fish Communities in Spatially Heterogeneous Freshwater Habitats. Ecol. Indic. 2021, 126, 107698. [Google Scholar] [CrossRef]
  97. Shu, L.; Chen, S.; Li, P.; Peng, Z. Environmental DNA Metabarcoding Reflects Fish DNA Dynamics in Lentic Ecosystems: A Case Study of Freshwater Ponds. Fishes 2022, 7, 257. [Google Scholar] [CrossRef]
  98. Deng, S.; Lin, B.; Luo, Y.; Dang, X.; Ma, C.; Zhou, Y.; Zhang, X.; Zhang, Y.; Xu, N.; Jiang, S.; et al. Assessment of Fish Species Biodiversity in the Yong River Basin Based on Environmental DNA Metabarcoding. Diversity 2025, 17, 35. [Google Scholar] [CrossRef]
  99. Flörl, L.; Cabrera, P.M.; Moccia, M.D.; Plüss, S.; Bokulich, N.A. HighALPS: Ultra-High-Throughput Marker-Gene Amplicon Library Preparation and Sequencing on the Illumina NextSeq and NovaSeq Platforms. Department of Health Sciences and Technology, Laboratory of Food Systems Biotechnology, Institute of Food, Nutrition, and Health, ETH Zurich, Switzerland. bioRxiv, 2024; Preprint uploaded to bioRxiv. [Google Scholar] [CrossRef]
  100. Meng, J.; Xu, F.; Yang, H.; Li, X.; Zhao, P. Exploring Microbiome and Plankton Responses and Interactions in the Mangrove Ecosystem through eDNA and Network Analysis. Sci. Total Environ. 2024, 930, 172581. [Google Scholar] [CrossRef]
  101. Fukaya, K.; Hasebe, Y. Occumb: An R Package for Site Occupancy Modeling of eDNA Metabarcoding Data. National Institute for Environmental Studies, Tsukuba, Ibaraki 305-8506, Japan. bioRxiv, 2025; Preprint uploaded to bioRxiv. [Google Scholar] [CrossRef]
  102. Deiner, K.; Fronhofer, E.A.; Mächler, E.; Walser, J.C.; Altermatt, F. Environmental DNA Reveals That Rivers Are Conveyer Belts of Biodiversity Information. Nat. Commun. 2016, 7, 12544. [Google Scholar] [CrossRef]
  103. Laporte, M.; Berger, C.S.; García-Machado, E.; Côté, G.; Morissette, O.; Bernatchez, L. Cage Transplant Experiment Shows Weak Transport Effect on Relative Abundance of Fish Community Composition as Revealed by eDNA Metabarcoding. Ecol. Indic. 2022, 137, 108785. [Google Scholar] [CrossRef]
  104. Fonseca, V.G.; Nichols, B.; Lallias, D.; Quince, C.; Carvalho, G.R.; Power, D.M.; Creer, S. Sample Richness and Genetic Diversity as Drivers of Chimera Formation in NSSU Metagenetic Analyses. Nucleic Acids Res. 2012, 40, e66. [Google Scholar] [CrossRef]
  105. Elbrecht, V.; Leese, F. Can DNA-Based Ecosystem Assessments Quantify Species Abundance? Testing Primer Bias and Biomass-Sequence Relationships with an Innovative Metabarcoding Protocol. PLoS ONE 2015, 10, e0130324. [Google Scholar] [CrossRef]
  106. Fonseca, V.G. Pitfalls in Relative Abundance Estimation Using Edna Metabarcoding. Mol. Ecol. Resour. 2018, 18, 923–926. [Google Scholar] [CrossRef]
  107. Thomsen, P.F.; Kielgast, J.; Iversen, L.L.; Møller, P.R.; Rasmussen, M.; Willerslev, E. Detection of a Diverse Marine Fish Fauna Using Environmental DNA from Seawater Samples. PLoS ONE 2012, 7, e41732. [Google Scholar] [CrossRef]
  108. Sard, N.M.; Herbst, S.J.; Nathan, L.; Uhrig, G.; Kanefsky, J.; Robinson, J.D.; Scribner, K.T. Comparison of Fish Detections, Community Diversity, and Relative Abundance Using Environmental DNA Metabarcoding and Traditional Gears. Environ. DNA 2019, 1, 368–384. [Google Scholar] [CrossRef]
  109. Lawson Handley, L.; Read, D.S.; Winfield, I.J.; Kimbell, H.; Johnson, H.; Li, J.; Hahn, C.; Blackman, R.; Wilcox, R.; Donnelly, R.; et al. Temporal and Spatial Variation in Distribution of Fish Environmental DNA in England’s Largest Lake. Environ. DNA 2019, 1, 26–39. [Google Scholar] [CrossRef]
  110. Littlefair, J.E.; Hayhurst, L.D.; Yates, M.C.; Rennie, M.D.; Cristescu, M.E. A Strong Relationship between Environmental DNA Metabarcoding and Rank-Based Abundance of Fish. People and Nature Lab, Department of Genetics, Evolution, and Environment, University College London, United Kingdom. bioRxiv, 2025; Preprint uploaded to bioRxiv. [Google Scholar] [CrossRef]
  111. Nakagawa, H.; Fukushima, K.; Sakai, M.; Wu, L.; Minamoto, T. Relationships between the eDNA Concentration Obtained from Metabarcoding and Stream Fish Abundance Estimated by the Removal Method under Field Conditions. Environ. DNA 2022, 4, 1369–1380. [Google Scholar] [CrossRef]
  112. Lamb, P.D.; Hunter, E.; Pinnegar, J.K.; Creer, S.; Davies, R.G.; Taylor, M.I. How Quantitative Is Metabarcoding: A Meta-Analytical Approach. Mol. Ecol. 2019, 28, 420–430. [Google Scholar] [CrossRef]
  113. Lennon, R.E.; Parker, P.S. The Reclamation of Indian and Abrams Creeks, Great Smoky Mountains National Park; US Department of Interior, Fish and Wildlife Service: Washington, DC, USA, 1959. [Google Scholar]
  114. Tracy, B.H.; Rohde, F.C.; Hogue, G.M. An Annotated Atlas of the Freshwater Fishes of North Carolina. Southeast. Fishes Counc. Proc. 2020, 1, 1. [Google Scholar]
  115. Menhinick, E.F. The Freshwater Fishes of North Carolina; North Carolina Wildlife Resources Commission: Raleigh, NC, USA, 1991. [Google Scholar]
  116. Ciccotto, P. Observations of Co-Nest Building and Spawning in Native and Non-Native Chub Species (Nocomis spp. in the Swannanoa River, North Carolina. Southeast. Fish. Counc. Proc. 2024, 1, 5. [Google Scholar]
  117. Nico, L.; Fuller, P. Nocomis leptocephalus (Girard, 1856): U.S. Geological Survey, Nonindigenous Aquatic Species Database, Gainesville, FL. Available online: https://nas.er.usgs.gov/queries/factsheet.aspx?SpeciesID=575 (accessed on 2 January 2025).
  118. Lachner, E.A.; Jenkins, R.E. Systematics, Distribution, and Evolution of the Chub Genus Nocomis girard (Pisces, Cyprinidae) of Eastern United States, with Descriptions of New Species. Smithson. Contrib. Zool. 1971, 91, 1–27. [Google Scholar] [CrossRef]
  119. Etchison, L.; Owensby, D.; Rondel, C. Bringing Back the Natives: Reintroduction of Three Sucker Species in the Upper French Broad River. In Proceedings of the 34th Annual Meeting of the North Carolina Chapter of the American Fisheries Society, Durham, NC, USA, 21–23 February 2023. [Google Scholar]
  120. Bookwalter, J.; Niyas, A.M.M.; Caballero-López, B.; Villari, C.; Claramunt-López, B. Fecal Matters: Implementing Classical Coleoptera Species Lists with Metabarcoding Data from Passerine Bird Feces. J. Insect Conserv. 2023, 27, 557–569. [Google Scholar] [CrossRef]
  121. Vannote, R.L.; Minshall, G.W.; Cummins, K.W.; Sedell, J.R.; Cushing, C.E. The River Continuum Concept. Can. J. Fish. Aquat. Sci. 1980, 37, 130–137. [Google Scholar] [CrossRef]
Figure 1. eDNA sample collection sites in the Great Smoky Mountains National Park. All samples were collected between 14 and 21 July 2023.
Fishes 10 00145 g001
Figure 2. Photos from four of the 50 sites at which water samples were taken for eDNA extraction in the Great Smoky Mountains National Park. The characteristics of these sites are as follows: (A) first order, 1462 m elevation, four species detected; (B) second order, 1380 m elevation, ten species detected; (C) third order, 527 m elevation, fourteen species detected; (D) fourth order, 801 m elevation, ten species detected.
Fishes 10 00145 g002
Figure 3. Krona maps of fish reads attained from (A) the Batra primer set and (B) the MiFish primer set. The whole circle represents all species measured, and the size of the fan indicates the relative proportion of a species based on read count. The cells represent different taxa, and the circle rings indicate the gradual reduction in taxonomic rank from the inside out.
Fishes 10 00145 g003
Figure 4. Number of species detected via eDNA metabarcoding (blue bars) and mean number of species detected at collocated sites in electrofishing surveys (red bars). Electrofishing survey methods were annual three-pass depletion (A) and Index of Biotic Integrity (B); electrofishing surveys were conducted between 1984 and 2023 (three-pass) and 2013–2023 (IBI). Error bar limits represent the maximum and minimum number of species detected in any one collection; the number above red bars represent the total number of collections (different years) used to calculate the mean for a given site.
Fishes 10 00145 g004
Figure 5. Correlations between eDNA metabarcoding read counts and fish abundance/biomass (kg) data from historical (1984–2023) three-pass electrofishing surveys from 25 sites in the GSMNP. Biomass represents either one historic sampling event (six sites) or a mean of historic sampling events (19 sites); between two and 33 years of data were included in mean calculations, depending on site data availability. The number of samples utilized in regressions for each species were: (A) Oncorhynchus mykiss (23), (B) Salvelinus fontinalis (11), (C) Salmo trutta (10), (D) Rhinichthys atratulus (15), and (E) Campostoma anomalum (14).
Fishes 10 00145 g005
Table 1. eDNA sample collection sites within Great Smoky Mountains National Park by primary drainage and USGS hierarchal hydrologic unit code (HUC) 12-digit sub-watershed. “# Samples” = the number of samples collected within each watershed.
DrainageWatershed# Samples
Abrams CreekAbrams Creek5
Big CreekBig Creek1
Calderwood ReservoirLake Cheoah-Little Tennessee River1
Cataloochee RiverCataloochee Creek1
Cataloochee RiverPalmer Creek1
Chilhowee ReservoirChilhowee Lake-Little Tennessee River1
Cosby CreekCosby Creek1
Deep CreekDeep Creek1
Dudley CreekDudley Creek1
Eagle CreekEagle Creek1
Fontana ReservoirFontana Lake-Tuckasegee River3
Fontana ReservoirForney Creek1
Fontana ReservoirHazel Creek1
Fontana ReservoirLower Fontana Lake-Little Tennessee River3
Fontana ReservoirNoland Creek1
Little PigeonUpper Little Pigeon River1
Little PigeonUpper West Prong Little Pigeon River5
Little Pigeon RiverMiddle Prong Little Pigeon River1
Little RiverGoshen Prong-Little River5
Little RiverWest Prong Little River4
Oconaluftee RiverLower Oconaluftee River1
Oconaluftee RiverUpper Oconaluftee River2
Pigeon RiverCold Springs Creek-Pigeon River1
Pigeon RiverCripple Creek-Pigeon River1
Raven ForkLower Raven Fork1
Roaring ForkRoaring Fork1
West Prong Little PigeonLe Conte Creek1
West Prong Little PigeonStraight Fork-Raven Fork3
Table 2. Number of sample collection sites listed by stream order within Great Smoky Mountains National Park according to the Strahler method of stream classification.
Stream OrderNumber Sampled
6th1
5th9
4th14
3rd9
2nd9
1st8
Table 3. Fish species detected via eDNA metabarcoding in the GSMNP. “Batra %” and “MiFish %” indicate the percentage of total reads assigned to fish at the genus or species level. “A” = absent (not detected by the primer set) and “∗” = less than 0.001%.
I.D. LevelFamilyGenus/Species Batra %MiFish %
Species level identificationsCatostomidaeCatostomus commersonii0.340.40
Hypentelium nigricans1.01.6
Ictiobus bubalus0.008A
Moxostoma duquesnei0.040.34
Moxostoma erythrurum0.003A
CentrarchidaeAmbloplites rupestris0.190.16
Lepomis cyanellus0.140.33
Lepomis macrochirus0.350.38
Micropterus dolomieu0.530.33
Micropterus salmoidesA0.0006
ClupeidaeAlosa chrysochloris0.0050.0005
CottidaeCottus bairdii0.746.1
Cottus carolinae0.0024.6
CyprinidaeCampostoma anomalum5.976.1
Clinostomus funduloidesA0.96
Cyprinella galactura0.170.07
Hybopsis amplops0.810.01
Luxilus chrysocephalusA
Nocomis anomalum1.13.9
Nocomis leptocephalus0.92A
Notropis leuciodus0.800.52
Notropis rubellus0.67A
Notropis telescopusA
Pimephales notatus0.004A
Rhinichthys atratulus21.017.3
Rhinichthys cataractae18.021.9
Semotilus atromaculatus1.02.5
FundulidaeFundulus catenatus0.012A
IctaluridaeNoturus baileyi0.013A
Noturus flavipinnis0.005A
PercidaeEtheostoma blennioides0.370.40
Etheostoma flabellare0.23A
Etheostoma zonale0.001A
Etheostoma rufilineatumA1.6
Percina aurantiaca0.0620.05
Percina caprodesA0.07
Percina evides0.0110.02
SalmonidaeOncorhynchus mykiss35.618.6
Salmo trutta2.11.4
Salvelinus fontinalis7.610.3
Genus level identificationsCatostomidaeMoxostoma
CentrarchidaeMicropterus
CottidaeCottus 0.003
Table 4. Distribution heat map of species abundance by stream order. Each horizontal row represents a species, while each vertical column contains the stream order based on the Strahler classification method. The color (see key) reflects read abundance based on the combined total fish read count generated by the Batra and MiFish primer sets.
% Total Read Count Stream Order
1st2nd3rd4th5th
CatostomidaeCatostomus commersonii0.36% Low
Hypentelium nigricans1.25%
Ictiobus bubalus0.01%
Moxostoma duquesnei0.16%
Moxostoma erythrurum0.002%
CentrarchidaeAmbloplites rupestris0.18%
Lepomis cyanellus0.21%
Lepomis macrochirus0.36%
Micropterus dolomieu0.45% High
Micropterus salmoides0.0002%
ClupeidaeAlosa chrysochloris0.003%
CottidaeCottus bairdii2.82%
Cottus carolinae1.80%
CyprinidaeCampostoma anomalum6.02%
Clinostomus funduloides0.37%
Cyprinella galactura0.13%
Hybopsis amplops0.50%
Luxilus chrysocephalus0.00%
Nocomis leptocephalus0.57%
Nocomis micropogon2.22%
Notropis leuciodus0.69%
Notropis rubellus0.41%
Notropis telescopus0.0003%
Pimephales notatus0.002%
Rhinichthys atratulus19.60%
Rhinichthys cataractae19.56%
Semotilus atromaculatus1.59%
FundulidaeFundulus catenatus0.01%
IctaluridaeNoturus baileyi0.01%
Noturus flavipinnis0.003%
PercidaeEtheostoma blennioides0.38%
Etheostoma rufilineatum0.61%
Etheostoma flabellare0.14%
Etheostoma zonale0.0004%
Percina aurantiaca0.06%
Percina caprodes0.03%
Percina evides0.02%
SalmonidaeOncorhynchus mykiss29.02%
Salmo trutta1.83%
Salvelinus fontinalis8.64%
Table 5. All sampled sites, grouped by stream order. Columns display stream order, elevation (m), number (#) of species detected by both primer sets (combined), and the Shannon Diversity Index.
Stream OrderElevation (m)# SpeciesShannon
1st144831.172
1st128261.505
1st77570.220
1st500101.804
1st146240.015
1st53041.078
1st52751.618
1st52631.032
2nd74560.038
2nd338101.346
2nd474171.706
2nd1380100.296
2nd59340.839
2nd75941.323
2nd105890.027
2nd106360.641
2nd49920.833
3rd462120.504
3rd430101.251
3rd471121.110
3rd52661.047
3rd527141.192
3rd53480.981
3rd62570.271
3rd116530.667
3rd66870.810
4th521131.449
4th48870.697
4th442161.863
4th50691.702
4th407101.201
4th85790.867
4th832101.285
4th69140.522
4th51491.351
4th515100.628
4th801101.284
4th52391.141
4th56491.216
4th555131.829
5th410192.387
5th564172.022
5th417191.867
5th338262.463
5th57791.389
5th616141.795
5th751101.417
5th529151.872
5th683101.515
6th336242.639
Table 6. Detection of species by eDNA metabarcoding and three-pass electrofishing in eight first- to third-order stream collection sites. An “X” in the “MB” column indicates that species was detected by eDNA metabarcoding in 2023. An “X” in the “EF” column indicates that species was detected in at least one of the three-pass electrofishing sampling events conducted at the site. “% EF det. by eDNA” indicates the percentage of total electrofishing-detected species which eDNA was able to detect. “Species det. only by eDNA” indicates the number of species detected by eDNA metabarcoding but not by electrofishing survey. “Years of EF data” indicates the number of three-pass electrofishing collections (one per year) included in the comparison.
Site
Site Stream Order 1st1st2nd2nd3rd3rd3rd3rd
MBEFMBEFMBEFMBEFMBEFMBEFMBEFMBEF
Campostoma anomalumX X XXX
Catostomus commersonii X
Cottus bairdii X
Cottus carolinae X
Etheostoma rufilineatumX X X
Hypentelium nigricans X
Lepomis macrochirusX X
Micropterus dolomieu X
Nocomis micropogon X
Oncorhynchus mykissXXX XXXXX XXXXXX
Rhinichthys atratulusXXX X XX XX
Rhinichthys cataractaeX X X XXX X XXX
Salmo trutta XX X
Salvelinus fontinalis XXXXXXXXXXX
Semotilus atromaculatusX X XX X X
% EF det. by eDNA1001001001001001006767
Species det. only by eDNA53406135
Years of EF data133171812562
Table 7. Detection of species by eDNA metabarcoding and three-pass electrofishing in 17 fourth- to sixth-order stream collection sites. An “X” in the “MB” column indicates that species was detected by eDNA metabarcoding in 2023. An “X” in the “EF” column indicates that species was detected in at least one of the three-pass electrofishing sampling events conducted at the site. “% EF det. by eDNA” indicates the percentage of total electrofishing-detected species which eDNA was able to detect. “Species det. only by eDNA” indicates the number of species detected by eDNA metabarcoding but not by electrofishing survey. “Years of EF data” indicates the number of three-pass electrofishing collections (one per year) included in the comparison.
Site Stream Order4th4th4th4th4th4th4th4th5th5th5th5th5th5th5th5th6th
MBEFMBEFMBEFMBEFMBEFMBEFMBEFMBEFMBEFMBEFMBEFMBEFMBEFMBEFMBEFMBEFMBEF
A. rupestris XXXXX X XX
C. anomalumXXXXXX X X XXXXXXXXXXXXXXXXXXX XX
C. commersoniiXX X X XX XXX XX
C. funduloidesXX XXXXX
C. bairdii XXX X XXXXXX XXX XX XX
C. carolinae X X X XXX X X XX XXXXX
C. galactura X XXX XX
E. monachus X
E. blennioides X XXXXX XX
E. chlorobranchium X X X X XX
E. flabellare XX X X X X XX X
E. gutselli X
E. rufilineatum X XXX X XX
E. simoterum X X X X
E. sitikuense X X
E. swannanoa X
E. vulneratum X X
E. zonaleX XXX XX XX
F. catenatus X X X
H. amblops X XX X X XX
H. nigricans XXX XXXXXXXXXXXXXXX XX
I. greeleyi X X
I. bubalus X
L. cyanellus X X X X X
L. macrochirusX X XX X
L. appendix X
L. coccogenis X X X X X X X X X
M. dolomieu X XXX XX XX
M. punctulatus X
M. carinatum X
M. duquesnei X XX X XX
M. erythrurum X
N. leptocephalus X X X X X X X
N. micropogon XXXX XXXXXXXXX XXXXXXXX XX
N. leuciodusXXX X XXXXX XXXX XX
N. photogenis X X
N. rubellusX X X X X X X X
N. rubricroceus X X X X X X
N. spectrunculus X
N. telescopus X XX X X
N. baileyi XX
N. flavipinnis X
O. mykissXXXXX XXXXXXXXXXXXXXXXXXXXXXXXXXXX
P. aurantiaca X X
P. caprodes X
P. evides X X X XX
P. notatus X
R. atratulusXXXXXXXXXXX X XX XXX XXX XX XXXX
R. cataractaeX XXX XXXXX XXXXXXX XXXXXXXXXXXXXX
S. truttaX X X XXXXXX XXXXXX XX XXX
S. fontinalisX XXXXXXXX X XXX XXX
S. atromaculatusXXXXXX X X XX X X X X
% EF det. by eDNA7810071100100100674473868810077100887590
Species det. only by eDNA6740573341036910366
Years of EF data22411551112210181812115
Table 8. Detection of species by eDNA metabarcoding and Index of Biotic Integrity (IBI) electrofishing in 10 third- to fifth-order stream collection sites. An “X” in the “MB” column indicates that species was detected by eDNA metabarcoding in 2023. An “X” in the “EF” column indicates that species was detected in at least one of the IBI electrofishing sampling events conducted at the site. “% EF det. by eDNA” indicates the percentage of total electrofishing-detected species which eDNA was able to detect. “Species det. only by eDNA” indicates the number of species detected by eDNA metabarcoding but not by electrofishing survey. “Years of EF data” indicates the number of IBI electrofishing collections (one per year) included in the comparison.
Site Stream Order3rd3rd3rd4th4th5th5th5th5th5th
MBEFMBEFMBEFMBEFMBEFMBEFMBEFMBEFMBEFMBEF
Etheostoma zonale XX
Cottus carolinaeX X X X X XXX X X
Hybopsis amblops X XX
Moxostoma duquesnei X X
Rhinichthys atratulusX XXX XXXXX X XX
Lepomis macrochirusX X X X
Nocomis leptocephalus X
Salvelinus fontinalisX X X XXX XX
Salmo truttaX XXXXXXXXX XXXXXX
Campostoma anomalum XXXX X XXXXXXXXXXX
Alosa chrysochlorisX
Etheostoma sitikuense X
Semotilus atromaculatusX X X XXXX X
Etheostoma flabellare XXX
Percina evides X X X
Moxostoma erythrurum XX
Lepomis cyanellus X X
Etheostoma chlorobranchium X XX X X X X
Etheostoma blennioidesX X XXXXXXX X
Micropterus salmoides X
Percina caprodes X
Rhinichthys cataractaeXXXXXXXX XXXX XXXXXX
Notropis spectrunculus XX
Cottus bairdiiXX XXXXX XX XXX XX
Ichthyomyzon greeleyi XX
Hypentelium nigricansXX X XXXXXXXXXXXX
Percina squamata X X X
Oncorhynchus mykissXXXXXXXXXXXXX XXXXXX
Etheostoma rufilineatum X XXXX X
Nocomis micropogonXX X XXXXXXXX XX
Moxostoma carinatum X
Ambloplites rupestris XX XX XX
Notropis rubellus XX X XX X
Clinostomus funduloidesXX X XX
Notropis rubricroceus X X
Micropterus dolomieu X XX X
Noturus baileyi XX
Etheostoma simoterum X
Etheostoma swannanoa X
Percina aurantiaca X X
Notropis telescopus X XXX X
Etheostoma tennesseense X XX
Notropis leuciodus X XXXXXXX
Etheostoma gutselli X X X X
Luxilus coccogenis X X X X
Catostomus commersonii X X X
Cyprinella galactura XX
Perca flavescens X XX
Noturus flavipinnis XX
% EF det. by eDNA10057100575392941008863
Species det. only by eDNA82353711454
Years of EF data1733444135
Disclaimer/Publisher’s Note: The statements, opinions and data contained in all publications are solely those of the individual author(s) and contributor(s) and not of MDPI and/or the editor(s). MDPI and/or the editor(s) disclaim responsibility for any injury to people or property resulting from any ideas, methods, instructions or products referred to in the content.

