Article

Effect of Feeding Frequency and Restriction on the Growth Performance, Physiology, and Intestinal Histomorphometry of Colossoma macropomum in a Recirculating Aquaculture System

by
Yhago Patrycky Antunes Souza Assis
,
Matheus Philip Santos Amorim
,
Lívia de Assis Porto
,
Paulo Edson Camilo Mol de Oliveira
,
Carina Alves Santos
,
Gean Paulo Andrade Reis
,
Ronald Kennedy Luz
and
Gisele Cristina Favero
*
Laboratório de Aquacultura, Departamento de Zootecnia, Universidade Federal de Minas Gerais, Avenida Antônio Carlos, n° 6627, Belo Horizonte 30161-970, MG, Brazil
*
Author to whom correspondence should be addressed.
Fishes 2025, 10(4), 148; https://doi.org/10.3390/fishes10040148
Submission received: 28 February 2025 / Revised: 23 March 2025 / Accepted: 25 March 2025 / Published: 26 March 2025
(This article belongs to the Special Issue Fish Farming in Recirculating Aquaculture Systems)

Abstract

This study investigated the growth performance and physiological and intestinal histomorphometry of juvenile tambaqui Colossoma macropomum (51.68 ± 3.87 g), fed continuously or subjected to weekly cycles of feed restriction (one day of no feeding followed by six days of feeding) associated with feeding frequencies of two or three times a day, for 84 days, in a recirculating aquaculture system (RAS). Growth performance and blood parameters were determined after 42 and 84 days. Liver, adipose tissue and intestine were collected after 84 days to determine the somatic indices, liver lipid levels and intestinal histomorphometry. Restricted fish had greater feed intake compared to continuously fed after 42 days, as well as greater specific growth rate (SGR) and better feed conversion between 43 and 84 days. No significant differences were observed for restriction, feeding frequency or the interaction for blood parameters after 42 and 84 days, somatic indices and liver lipid levels after 84 days, with the exception of plasma glucose, which was higher for restricted fish after 84 days. The feed restriction promoted a greater intestinal villi perimeter and height compared to continuously fed fish, as did fish fed twice a day compared to those fed three times a day, with an interaction between factors. We concluded that six days of feeding per week and twice-daily feeding frequency can be used as a feeding protocol for tambaqui juveniles over an 84-day period in RAS and this management protocol can also help reduce feed and labor costs in the production of this species.
Key Contribution: Six days of feeding per week; associated with a feeding frequency of twice a day; can be used as a feeding protocol for juvenile tambaqui during a period of 84 days in RAS.

1. Introduction

Tambaqui, Colossoma macropomum (Characiformes:Serrasalmidae) is one of the most produced freshwater species in South America and the second most produced in aquaculture in Brazil [1], where it is mainly cultivated in farming systems with net tanks and excavated ponds. The physiological characteristics and rusticity of the species favor its greater growth performance in different production systems than other species [2]. The production of tambaqui in recirculating aquaculture systems (RASs) has emerged as a highly efficient and sustainable alternative, as it offers several advantages, including significant water savings, minimization of environmental impacts and precise control of cultivation conditions [3]. The species has shown excellent growth responses in this controlled environment, with superior growth rates and optimized feed conversion [4]. Furthermore, fish health and welfare are improved due to water quality being kept consistently high, which reduces exposure to disease [4,5]. The production of tambaqui in RAS brings a significant increase in the profitability and sustainability of aquaculture and supplies high-quality protein in an environmentally responsible way [3].
Adequate feed management is essential for the success of animal production, as feed represents one of the main costs in productive activities. Furthermore, optimizing feed use in aquaculture can enhance the better use of nutrients [6] and improve animal growth rates and quality [7,8]. Feed costs can also be reduced if there is strategic feed planning, defined according to the requirements of the species [9]. Feed restriction has become a common practice in aquaculture. This management tool consists of reducing or ceasing the amount of feed provided to fish for a determined period [10], aiming to improve feed efficiency and reduce feed and labor costs [7,11,12].
Studies have shown that feed restriction of up to two days a week for tambaqui can result in satisfactory growth by stimulating the use of body energy reserves and improving feed efficiency, in addition to allowing compensatory responses during periods of refeeding [13]. The importance of feed restriction of one day per week as a nutritional management strategy for tambaqui, demonstrated that short periods of restriction do not affect weight gain and improved feed efficiency and nutrient use [7]. Furthermore, this practice did not compromise the survival and well-being of the fish, suggesting that short-term feed restriction may be a promising strategy in tambaqui production and contribute to improved aquaculture.
Another important tool that can influence the physiological and growth responses of cultivated fish is feeding frequency, which refers to the number of times that an animal is fed over a day or other specific period [14,15,16]. In biological contexts, such as ecology, animal husbandry and nutrition, feeding frequency describes the feeding patterns of a species, individual or group, which influences their feeding behavior, digestion, metabolism and nutrient availability [17]. Feeding frequency is a critical factor for fish growth, health and overall performance [18]. Thus, we aimed to investigate growth performance, physiological parameters and intestinal histomorphometry of juvenile tambaqui, Colossoma macropomum, subjected to weekly cycles of feed restriction (one day of no feeding followed by six days of feeding) and two feeding frequencies (two or three times a day) in RAS.

2. Materials and Methods

2.1. Experimental Conditions

The experiment was carried out at the Aquaculture Laboratory (LAQUA) of the Veterinary School of the Federal University of Minas Gerais (UFMG), Belo Horizonte, Minas Gerais, Brazil, and was approved by the Ethics Committee on the Use of Animals (CEUA), protocol 187/2022.
A total of 128 juvenile tambaqui (51.68 ± 3.87 g, 13.95 ± 0.30 cm) were randomly distributed in 16 rectangular tanks (useful capacity of 120 L), at a density of eight fish per tank, in a recirculating aquaculture system (RAS), equipped with mechanical (acrylic whool) and biological (crushed stones of 1 to 2 cm) filters, supplementary aeration and heaters with thermostats for temperature control. The water of the RAS had the following water quality parameters (measured weekly): dissolved oxygen of 7.54 ± 0.16 mg/L and temperature of 27.19 ± 0.14 °C (Ecosense® DO200A oximeter, YSI, Yellow Springs, OH, USA); pH of 8.1 ± 0.05 (K39-0014PA peagometer, Kasvi, Pinhais, PR, Brazil); and total ammonia of 0.25 mg/L (Labcon Test colorimetric kit—www.alconpet.com.br—accessed on 24 March 2025).

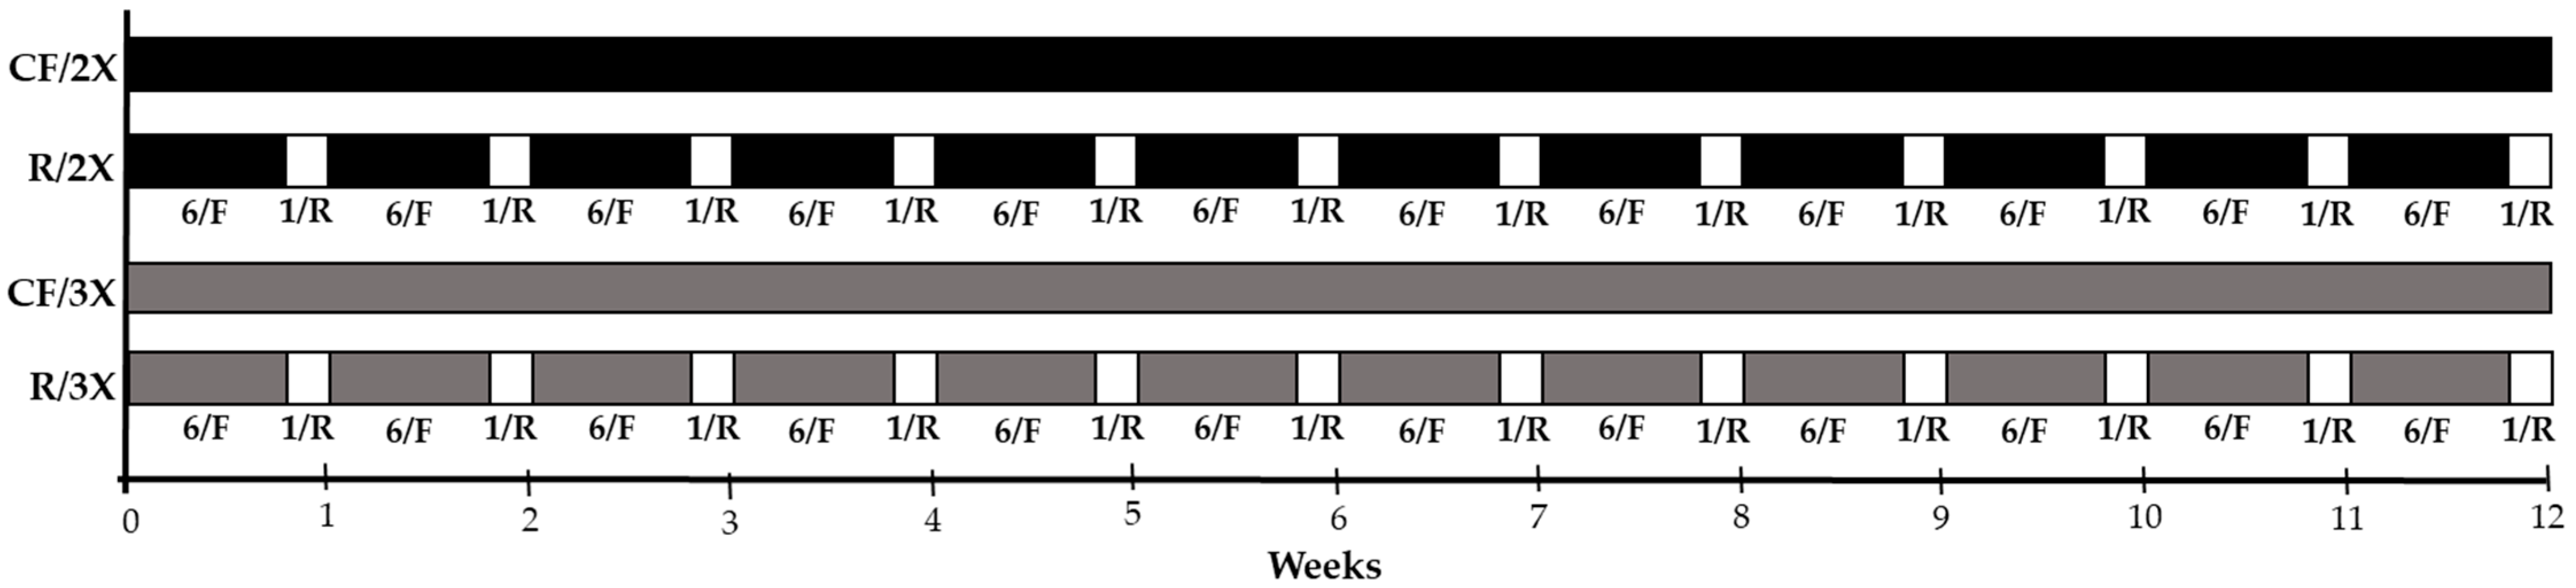
2.2. Experimental Design

The experimental design was a 2 × 2 factorial scheme, in a completely randomized design, with two feeding protocols and two feeding frequencies, with four replicates each, as follows and as represented in Figure 1:
-
CF/2x: Fish continuously fed, twice a day (08:00 and 16:00), for 12 weeks (84 days);
-
R/2x: Fish subjected to feed restriction [weekly cycles of one day of restriction (Sunday) and six days of feeding], twice a day (at 08:00 and 16:00), for 12 weeks (84 days);
-
CF/3x: Fish continuously fed, three times a day (08:00, 12:00 and 16:00), for 12 weeks (84 days);
-
R/3x: Fish subjected to feed restriction [weekly cycles of one day of restriction (Sunday) and six days of feeding], three times a day (08:00, 12:00 and 16:00), for 12 weeks (84 days).
Feed was provided ad libitum until apparent satiety, and leftover feed was collected, dried and weighed to calculate feed intake for each tank. All treatments received an extruded commercial diet (Aquos Starter, Total Alimentos,) measuring 3–4 mm in diameter and containing 36% crude protein, 8% ether extract, 5% crude fiber, 10% ash, 1–2% calcium and 1% phosphorous.

2.3. Growth Performance Parameters

Biometrics were performed after 42 and 84 days of the experiment by weighing (digital scale—Marte Científica, model AD5002, São Paulo, Brazil) and measuring the total length (ruler) of the fish to determine the following growth performance parameters [19,20]:
-
Final weight (g);
-
Weight gain (g) = final weight (g) − initial weight (g);
-
Specific growth rate (%/day) = 100 [(ln final weight − ln initial weight)]/number of days;
-
Feed conversion ratio = feed intake (g)/weight gain (g).
Feed intake was determined by weighing the pot of feed in each tank before consumption and after consumption, discounting the weight of leftovers (collected after 30 min of feeding) and calculated by the difference between the weight of the diet and the weight of leftovers [21].

2.4. Blood Biochemical Parameters

Eight fish from each experimental treatment (two fish per tank) were used to determine plasma biochemical variables after 42 and 84 days. Fish were carefully removed from the tanks and blood was immediately collected by caudal venipuncture, using heparinized syringes, and placed in microtubes containing the anticoagulant heparin (10 µL/mL). The blood was then centrifuged at 1075× g for 10 min to separate the plasma and subsequently determine glucose, triglycerides, cholesterol and total protein levels. Glucose, triglycerides and cholesterol were determined by colorimetric method, using commercial kits (Quibasa-Bioclin, Belo Horizonte, Brazil) and reading on a spectrophotometer (Biochrom Libra S22, Kensington, MD, USA) while total protein was determined using a manual refractometer (RHC 200-ATC, Huake Instrument Co., Ltd.—https://www.allproducts.com/manufacture98/instrument/—accessed on 25 March 2025).

2.5. Euthanasia, Tissue Collection and Analysis

The same fish used for blood collection at the end of the 84 experimental days (eight fish from each group) were euthanized by 285 mg/L eugenol overdose [22], to collect the liver, mesenteric adipose tissue. The liver and mesenteric adipose tissue were weighed to determine somatic indices, according to the following formulas:
-
Hepatosomatic index (%) = (liver weight/body weight) × 100;
-
Mesenteric fat index (%) = (adipose tissue weight/body weight) × 100.
Subsequently, the liver was stored individually in identified aluminum foil, frozen at −20 °C for subsequent determination of lipid levels [23].

2.6. Intestinal Histomorphometry

The anterior portion of the intestine was removed for histomorphometry analysis. In this way, with the aid of a scalpel and tweezers, and subsequently placed in a bottle containing Bouin’s solution, where it was kept for 24 h followed by washing in 70% alcohol. The tissue underwent dehydration in an increasing alcohol series (70%, 85%, 90%, 100%, 100%, 100%), followed by washing in a xylene series and subsequent inclusion in histological paraffin.
After fixation, the formed blocks were sectioned at a thickness of 2 μm and the sections were mounted on slides, which were stained by the Hematoxylin-Eosin staining technique. The material was analyzed using a microscope (E200 Microscope Nikon, Melville, NY, USA), with the perimeter and height of 10 intestinal villi being measured per slide, using ImageJ® software (version 1.53h 2021). Height was measured from the base to the tip of the villus crest, and the perimeter was measuring the entire vicinity of the intestinal villus.

2.7. Statistical Analysis

All data on growth performance, blood biochemistry, biometric indices, liver lipids and histomorphometry were subjected to normality (Shapiro–Wilk) and homoscedasticity (Levene’s) tests. When normally distributed, the data were subjected to analysis of variance (two-way ANOVA), followed by Tukey’s post-hoc test (at the 5% level) to compare means.
Values are expressed as mean ± standard deviation. Growth performance (after days 42 and 84) and histomorphometric variables, such as perimeter and height of intestinal villi, were not normally distributed and, therefore, were transformed into 1/√ before applying two-way ANOVA.

3. Results

3.1. Growth Performance Parameters

There was no mortality throughout the experimental period. After 42 days (Table 1), fish subjected to feed restriction had greater feed intake than those continuously fed. There was no effect of feeding protocol for the other parameters (final weight, weight gain, specific growth rate and feed conversion ratio), nor for feeding frequency or interaction between factors.
During the period from 43 to 84 days, significant differences were found between feeding protocols (continuously fed and restricted), with higher SGR and better feed conversion ratio for fish subjected to restriction. Furthermore, an interaction was also observed between feeding protocol and feeding frequency (Table 2). The group CF/3x had lower final weight and SGR when compared to CF/2x and R/3x.
A better feed conversion ratio was observed for R/2x, in relation to CF/2x and R/3x. A better feed conversion ratio was observed for R/3x, when compared to R/2x.

3.2. Blood Biochemical Parameters, Somatic Indices and Liver Lipids Levels

After 42 experimental days, no significant effects were observed in feeding protocol, feeding frequency or their interaction for all blood biochemical parameters analyzed. After 84 days, fish subjected to feed restriction had higher plasma glucose levels than continuously fed fish; however, there were no significant effects for feeding frequency or the interaction between factors (Table 3).
No effects were observed for the other blood biochemical parameters and biometric indices (hepatosomatic index and mesenteric fat index) and liver lipids levels (Table 4).

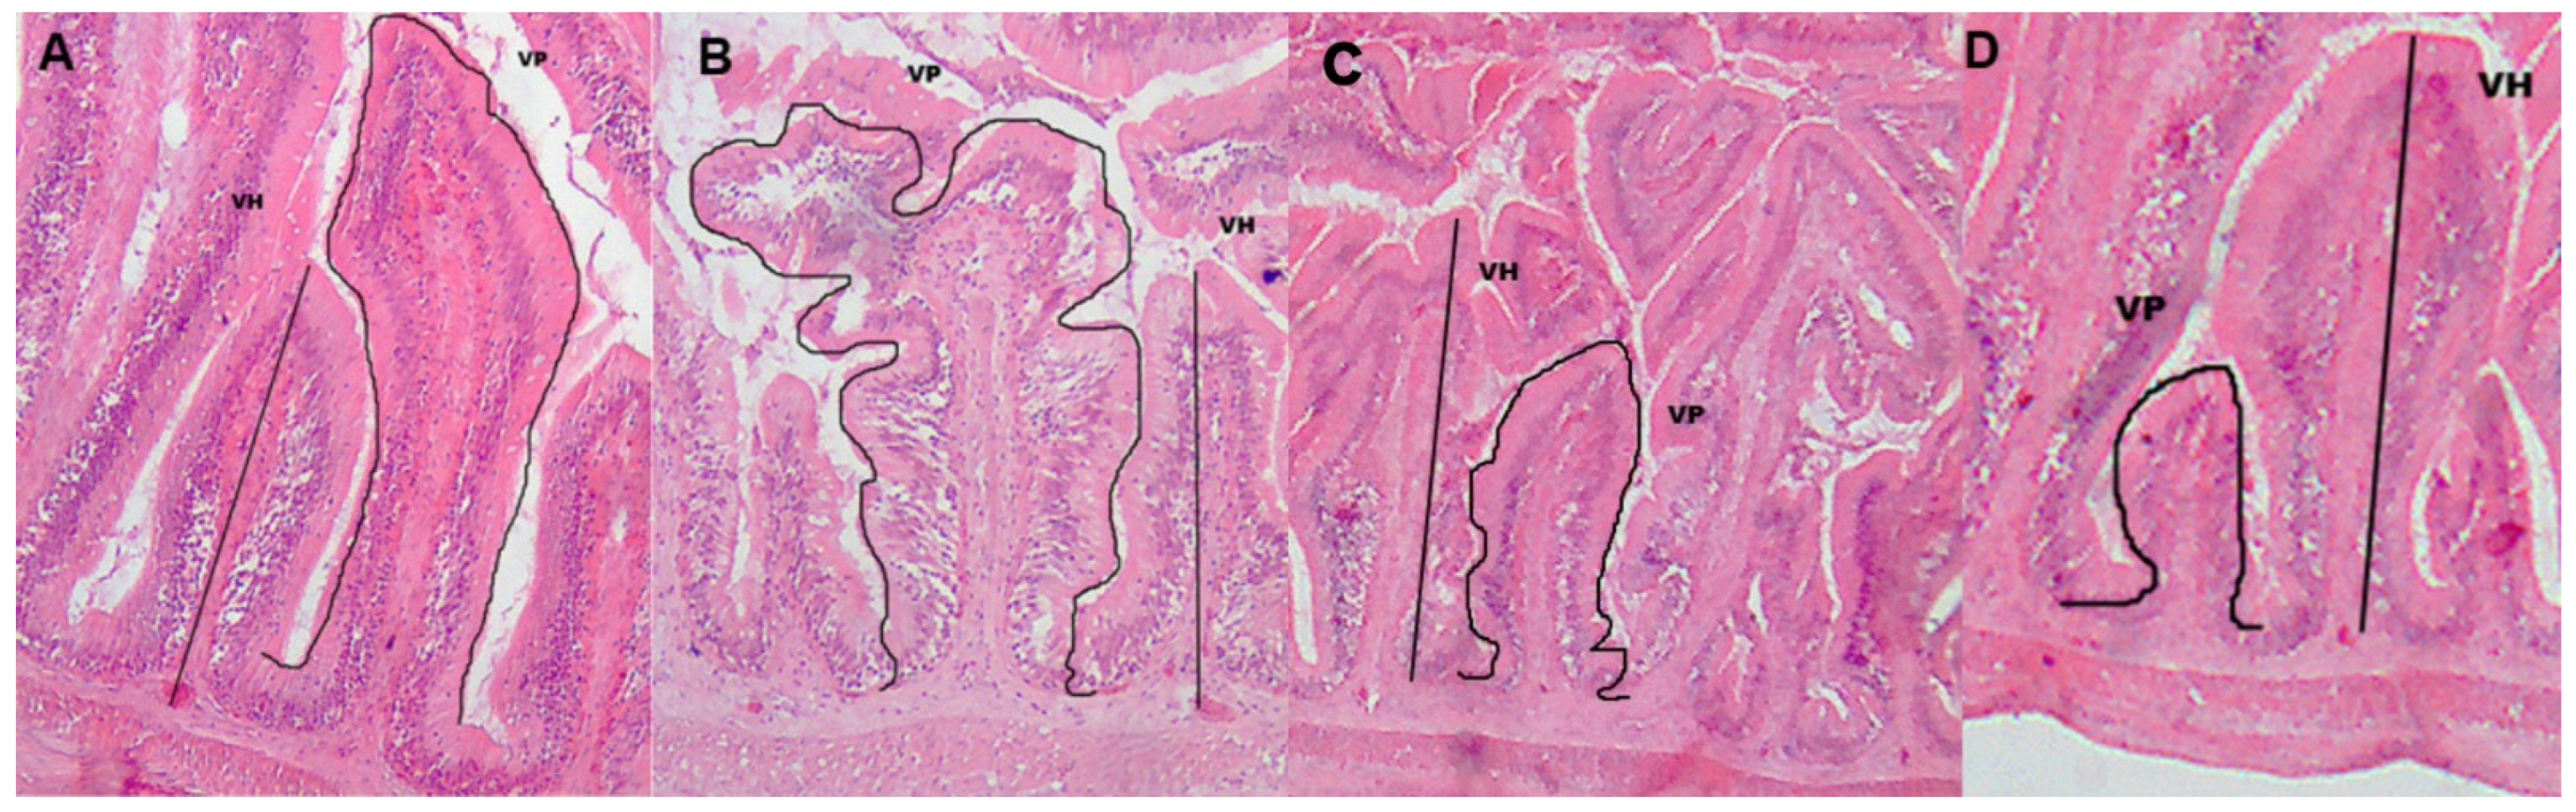
3.3. Intestinal Histomorphometry

Fish subjected to feed restriction had greater perimeter and height of intestinal villi than continuously fed fish (Table 5). Differences were also observed for feeding frequency, with fish fed twice a day having greater villi perimeter and height than fish fed three times a day.
There was also an interaction between feeding protocol and feeding frequency for histomorphometric parameters evaluated (Table 6). Both perimeter and height of the villi were greater for the R/2x group, when compared to the other groups (CF/2x, CF/3x and R/3x). For the protocol of continuously fed (CF) fish, greater perimeter and height of the villi were observed in the feeding frequency of three times a day (3x), in relation to twice a day (2x). Figure 2 represents the histological sections of the anterior portion of the intestine in each experimental group.

4. Discussion

The present study evaluated whether feed restriction and feeding frequency influence the growth performance, physiology and intestinal histomorphometry of juvenile tambaqui produced in RAS, for 84 days. The protocol of one day of feed restriction per week promoted an increase in feed intake during the first 42 days of the experiment, compared to continuous feeding, with an impact between 43 and 84 days of better responses for SGR and feed conversion for the restricted fish. This increase in feed intake at 42 days may be related to hyperphagia, a common behavior by which fish that have gone through a restricted feeding cycle ingest a greater amount of feed compared to fish that are continuously fed [24], which can lead to compensatory growth—that is, it allows animals that have been subjected to feed deprivation to reach weights similar to animals that are continuously fed [25].
The increased appetite and physiological changes that occur during feed restriction (catabolic phase), which precedes compensatory growth, potentiate hyperphagia and accelerate growth when feeding is reestablished [26], which can be explained by the increase in the levels of appetite-inducing hormones during this catabolic phase, such as ghrelin [27,28,29,30,31] and neuropeptide Y—NPY [27,32]. Regarding C. macropomum, there is still no information on the action of these hormones in situations of feed restriction. However, in a recent study [33] in which tambaquis were exposed to a critical climate change scenario, the authors found higher levels of NPY expression in the telencephalon of animals exposed to 800 ppm CO2 and temperature of 4.5 °C above the current climatic scenario and stated that drastic climate changes will probably lead to an increase in the fish’s appetite.
The use of restriction and refeeding cycles can optimize the use of the nutrients provided [13,34,35]. For example, it can increase the efficiency of digestive system enzyme activity [36], leading to better growth rates and feed conversion ratio, as occurred in the present study. It can also lead to reduced feed [13,37] and labor costs [13,34]. Also observed was an improvement in antioxidant enzyme activity in Oreochromis niloticus subjected to feed restriction and refeeding [37]. The authors state that this may be the result of promoting fish well-being due to improved water quality in the cultivation environment due to the smaller amount of feed provided. In this way, it is clear that the weekly cycles of feed restriction for one day and refeeding for six days employed in the present study had a positive impact on the growth performance of tambaqui, corroborating other studies using the same feeding protocol for tambaqui juveniles of ~18.0 g, in RAS [7].
The present study found significant interactions between the factors of feeding protocol and feeding frequency for final weight and SGR, with a decrease for CF/3x, compared to CF/2x and R/3x, as well as a worse feed conversion ratio when compared to R/3x. Studies aimed at testing different feeding frequencies in fish have shown that growth performance is more efficient with increasing feeding frequency [38,39,40,41]. However, some studies have also found worse responses, such as a decrease in feed efficiency in Oreochromis niloticus fed five times a day until apparent satiety, compared to fish fed ad libitum three times a day [15], worse feed conversion ratio in Lates calcarifer fed three or four times a day, compared to twice a day [42]. In addition, also found was a decrease in the activity of digestive enzymes in Megalobrama amblycephala [43], a decrease in weight gain and an increase in body lipid content in Sebastes schlegeli [44].
The present study shows that the feeding frequency of three times a day can be used with very satisfactory results for the growth of juvenile tambaqui in RAS if the animals are subjected to a feeding protocol of one day a week, which seems to allow better use of feed compared to fish continuously fed at the same frequency.
The protocol of one day of feed restriction per week combined with feeding frequencies of two or three times a day did not modify the blood biochemical parameters of juvenile tambaqui after 42 and 84 experimental days, with the only exception being plasma glucose levels after 84 days, which were higher in fish subjected to feed restriction, compared to continuously fed fish. The increase or even maintenance of glucose levels during periods of feed restriction are responses that have already been found by many studies with different species of fish, such as Rhamdia quelen [45], Pagrus pagrus [46], Carassius auratus [47], Oreochromis niloticus [48], and Piaractus mesopotamicus [35]. According to these studies, this increase or maintenance of glucose levels is caused mainly by the breakdown of hepatic glycogen reserves into glucose, which is transported to extrahepatic tissues to meet the body’s energy needs.
Although we did not determine hepatic glycogen concentrations in our study, changes in hepatosomatic index could be important indicators of its use by fish. However, no significant differences were observed for this index after 84 days. Therefore, a possible explanation for the higher plasma glucose levels in fish subjected to feed restriction is the better use of nutrients from feeding periods, confirmed by the greater feed intake over 42 days and the higher SGR and better feed conversion ratio between 43 and 84 experimental days, as discussed previously. This same observation can be made for other blood biochemical parameters, such as triglycerides, cholesterol and total proteins after 42 and 84 days and mesenteric fat index and liver lipids after 84 days, for which there were no significant differences between restricted and continuously fed fish. These results indicate that tambaqui has a great adaptive capacity to deal with fluctuations in feed availability.
Feeding protocols play a crucial role in fish farming, as they directly affect intestinal development [49]. The intestine is the main interface that controls the digestion and absorption processes and presents a temporal dynamic of changes in situations of feed restriction, such as changes in its epithelial configuration (enterocyte size and villi length) [50]. Adequate feed management, combined with supplying essential nutrients, promotes healthy growth of the intestinal tract, making it intact and optimizing nutrient absorption [51]. In the studied scenario, fish subjected to feed restriction experienced a significant increase in the perimeter and height of intestinal villi compared to continuously fed fish. This increase can be considered a possible adaptation of the fish digestive system in response to feed scarcity [52] and this adaptation may be a way to improve nutrient absorption when feed is supplied less frequently [53]. Larger intestinal villi provide greater surface area for nutrient absorption [54], the effect of which was observed in the present study through better responses for SGR and feed conversion ratio after 84 days.
Feeding frequency is also a factor that can trigger significant differences in the size of intestinal villi. For the present study, when feeding frequency is evaluated separately from feed restriction, feeding tambaqui juveniles twice a day provided an increase in the perimeter and height of intestinal villi, compared to three times a day. In a study with Micropterus salmoides [55], the authors found greater thickness of the intestinal muscle layer and greater activity of digestive enzymes, such as amylase and lipase, in fish fed twice a day, compared to four times a day. The authors report that the greater feeding frequency reduced intestinal digestive function and the ability to absorb nutrients, impacting the growth of the animals. Statistical analysis of the interaction between the factors of feeding protocol and feeding frequency revealed a significant increase in villi perimeter and height for fish subjected to feed restriction of one day and fed twice a day, when compared to the other treatments. However, this increase was not accompanied by improved fish growth, as the R/3x and CF/2x groups showed similar responses for final weight, specific growth rate and feed conversion ratio after 84 experimental days.

5. Conclusions

Six days of feeding per week, associated with a feeding frequency of twice a day, can be used as a feeding protocol for juvenile tambaqui over a period of 84 days in RAS, with excellent responses in growth performance, as well as in physiology and intestinal histomorphometric parameters. The adoption of this management can also help reduce feed and labor costs.

Author Contributions

Conceptualization, G.C.F., Y.P.A.S.A. and R.K.L.; methodology, G.C.F., R.K.L. and Y.P.A.S.A.; data collection: Y.P.A.S.A., M.P.S.A., L.d.A.P., P.E.C.M.d.O., C.A.S., G.P.A.R., G.C.F. and R.K.L.; formal analysis: Y.P.A.S.A., M.P.S.A., L.d.A.P., P.E.C.M.d.O., C.A.S., G.C.F. and R.K.L.; writing—original draft preparation: Y.P.A.S.A., G.C.F. and R.K.L.; writing—review and editing, G.C.F., Y.P.A.S.A. and R.K.L. All authors have read and agreed to the published version of the manuscript.

Funding

This research was funded by Conselho Nacional de Desenvolvimento Científico e Tecnológico (CNPq-Brazil—402952/2021-9 and CNPq-Brazil—316901/2021-0), Fundação de Amparo à Pesquisa do Estado de Minas Gerais (FAPEMIG-Brazil APQ-00645-22) and Coordenação de Aperfeiçoamento de Pessoal de Nível Superior (CAPES-Brazil). G.C.F. received research fellowships from CNPq (CNPq No. 316901/2021-0) and R.K.L. received research fellowships from CNPq (CNPq No. 310170/2023-0).

Institutional Review Board Statement

The animal study protocol was approved by the Ethics Committee on Animal Use of Universidade Federal de Minas Gerais. Protocol 187/2022.

Data Availability Statement

All data needed to evaluate the conclusions in the paper are present in the main text. Detailed numerical data will be made available to individuals upon request.

Acknowledgments

The authors thank Conselho Nacional de Desenvolvimento Científico e Tecnológico (CNPq), Fundação de Amparo à Pesquisa do Estado de Minas Gerais (FAPEMIG) and Coordenação de Aperfeiçoamento de Pessoal de Nível Superior(CAPES) for financial support.

Conflicts of Interest

The authors declare no conflicts of interest.

References

  1. Food and Agriculture Organization of the United Nations [FAO]. Field guide to the culture of tambaqui (Colossoma macropomum, Cuvier, 1816). In FAO Fisheries and Aquaculture Technical Paper; FAO: Rome, Italy, 2019; 136p. [Google Scholar]
  2. Guilherme, H.O.; Santos, F.A.; Costa, L.S.; Prado, V.G.; Palheta, G.D.; Melo, N.F.A.C.; Luz, R.K.; Ribeiro, P.A. Feeding, growth, and blood chemistry of the tambaqui (Colossoma macropomum) held under self-feeding and time-restricted automatic feeding conditions. Aquac. Int. 2022, 30, 323–339. [Google Scholar]
  3. Santos, F.A.; Boaventura, T.P.; Julio, G.S.C.; Cortezzi, P.P.; Figueiredo, L.G.; Favero, G.C.; Palheta, G.D.A.; Melo, N.F.A.C.; Luz, R.K. Growth performance and physiological parameters of Colossoma macropomum in a recirculating aquaculture system: Importance of stocking density and classification. Aquaculture 2021, 534, 736274. [Google Scholar]
  4. Ferreira, A.L.; Ferreira, N.S.; Almeida, P.G.D.; Takata, R.; Luz, R.K. Effects of stocking density on survival, growth and stress resistance of juvenile tambaqui (Colossoma macropomum) reared in a recirculating aquaculture system (RAS). Aquac. Int. 2021, 29, 609–621. [Google Scholar]
  5. Tavares-Dias, M.; Araujo, C.S.O.; Porto, S.M.A.; Viana, G.M.; Monteiro, P.C. Sanidade do Tambaqui Colossoma macropomum nas Fases de Larvicultura e Alevinagem; Embrapa Amapá: Macapá, Brazil; Universidade Nilton Lins, Instituto de Pesquisas da Amazônia: Manaus, Brazil, 2013; 46p. [Google Scholar]
  6. Aroucha, R.J.N.; Ribeiro, F.B.; Bomfim, M.A.D.; Siqueira, J.C.; Marchão, R.S.; Nascimento, D.C.N. Digestible methionine plus cystine requirement in tambaqui (Colossoma macropomum) diets: Growth performance and plasma biochemistry. Aquac. Rep. 2023, 32, 101725. [Google Scholar]
  7. Assis, Y.P.A.S.; Porto, L.A.; Melo, N.F.A.C.; Palheta, G.D.A.; Luz, R.K.; Favero, G.C. Feed restriction as a feeding management strategy in Colossoma macropomum juveniles under recirculating aquaculture system (RAS). Aquaculture 2020, 529, 735689. [Google Scholar]
  8. Garcez, J.R.; Ferreira, R.C.; Santos, G.F.D.; Oliveira, J.; Freire, G.M. Efeito da restrição alimentar no crescimento do tambaqui (Colossoma macropomum, Cuvier 1818) em sistema semi-intensivo. Rev. Cient. Mult. 2023, 4, e483759. [Google Scholar]
  9. Souza, R.C.; Campeche, D.F.B.; Campos, R.M.L.; Figueiredo, R.A.C.R.; Melo, J.F.B. Frequência de alimentação para juvenis de tambaqui. Arq. Bras. Med. Vet. Zoot. 2014, 66, 927–932. [Google Scholar]
  10. Ali, M.; Nicieza, A.; Wootton, R.J. Compensatory growth in fishes: A response to growth depression. Fish Fish. 2003, 4, 147–190. [Google Scholar]
  11. Santos, E.L.; Soares, A.C.L.; Tenório, O.L.D.; Soares, E.C.; Silva, T.J.; Gusmão Júnior, L.F.; Santos, E.L. Desempenho de tambaquis (Colossoma macropomum) submetidos a restrição alimentar e a realimentação em tanques-rede. Arq. Bras. Med. Vet. Zoot. 2018, 70, 931–938. [Google Scholar]
  12. Dawood, M.A.O.; Amer, A.A.; Gouda, A.H.; Gewaily, M.S. Interactive effects of cyclical fasting, refeeding, and dietary protein regimes on the growth performance, blood health, and intestinal histology of Nile tilapia (Oreochromis niloticus). Aquaculture 2023, 573, 739620. [Google Scholar]
  13. Roa, F.G.B.; Silva, S.S.; Hoshiba, M.A.; Silva, L.K.S.; Barros, A.F.; Abreu, J.S. Production performance of tambaqui juveniles subjected to short feed-deprivation and refeeding cycles. Bol. Inst. Pesca 2019, 45, 466. [Google Scholar] [CrossRef]
  14. Riche, M.; Garling, D. Feeding tilapia in intensive recirculating systems. Extension Fact. Sheets, paper 6 North Central Regional Aquaculture Center, p. 4. 2003. Available online: https://extension.rwfm.tamu.edu/wp-content/uploads/sites/8/2013/09/NCRAC-Fact-Sheet-Series-No.-114-Feeding-Tilapia-in-Intensive-Recirculating-Systems.pdf (accessed on 24 March 2025).
  15. Riche, M.; Haley, D.I.; Oetker, M.; Garbrecht, S.A.R.A.H.; Garling, D.L. Effect of feeding frequency on gastric evacuation and the return of appetite in tilapia Oreochromis niloticus (L.). Aquaculture 2004, 234, 657–673. [Google Scholar] [CrossRef]
  16. Jobling, M. Mathematical models of gastric emptying and the estimation of daily rates of food consumption for fish. J. Fish Biol. 1981, 19, 245–257. [Google Scholar] [CrossRef]
  17. Islam, M.A.; Mely, S.S.; Alam, M.S.; Rahman, M.H. Effect of different feeding rates on growth performance and survival rate of tilapia (Oreochromis niloticus L. 1758) fingerlings reared in rectangular hapas. Asian J. Fish. Aquac. Res. 2023, 25, 18–30. [Google Scholar] [CrossRef]
  18. López-Olmeda, J.F.; Noble, C.; Sánchez-Vázquez, F.J. Does feeding time affect fish welfare? Fish Physiol. Biochem. 2012, 38, 143–152. [Google Scholar] [CrossRef] [PubMed]
  19. Aydin, I.; Ak, O.; Küçük, E.; Polat, H.; Ceylan, B. Optimum temperature and growth performance of hatchery reared Black Sea flounder (Platichthys flesus luscus Pallas, 1814). Turk. J. Vet. An. Sci. 2012, 36, 101–106. [Google Scholar] [CrossRef]
  20. Aydin, I. The effect of ploidy on growth and feeding pattern of diploid and triploid turbot Scophthalmus maximus under communal rearing condition. Turk. J. Fish. Aquat. Sci. 2021, 21, 275–281. [Google Scholar] [CrossRef]
  21. Boaventura, T.P.; Oliveira, C.G.; Santos, F.A.C.; Correia, R.O.; Silva, S.S.; Souza, A.S.; Ananias, I.M.C.; Silva, N.C.S.; Oliveira, J.E.; Luz, R.K. Use of the essential oil of Thymus vulgaris (thyme) and its nanoemulsion as an anesthetic during the cultivation of tambaqui (Colossoma macropomum): Anesthesia induction and recovery curve, physiology, performance, and feed consumption. Aquac. Int. 2024, 32, 9375–9391. [Google Scholar] [CrossRef]
  22. Mattioli, C.C.; Takata, R.; Leme, F.O.P.; Costa, D.C.; Luz, R.K. Physiological and metabolic responses of juvenile Lophiosilurus alexandri catfish to air exposure. Fish Physiol. Biochem. 2019, 45, 455–467. [Google Scholar] [CrossRef]
  23. Bligh, E.G.; Dyer, W.J.A. A rapid method for total lipid extraction and purification. Can. J. Biochem. Physiol. 1959, 37, 911–917. [Google Scholar] [CrossRef]
  24. Liu, W.; Lu, X.; Jiang, M.; Wu, F.; Tian, J.; Yang, C.; Yu, L.; Wen, H. Effects of dietary manipulation on compensatory growth of juvenile genetically improved farmed tilapia (Oreochromis niloticus). Fish Physiol. Biochem. 2019, 45, 21–32. [Google Scholar]
  25. Py, C.; Elizondo-González, R.; Peña-Rodríguez, A. Compensatory growth: Fitness cost in farmed fish and crustaceans. Rev. Aquac. 2022, 14, 1389–1417. [Google Scholar]
  26. Won, E.T.; Borski, R.J. Endocrine regulation of compensatory growth in fish. Front. Endocrinol. 2013, 4, 74. [Google Scholar]
  27. Ji, W.; Ping, H.-C.; Wei, K.-J.; Zhang, G.-R.; Shi, Z.-C.; Yang, R.-B.; Zou, G.-W.; Wang, W.-M. Ghrelin, neuropeptide Y (NPY) and cholecystokinin (CCK) in blunt snout bream (Megalobrama amblycephala): cDNA cloning, tissue distribution and mRNA expression changes responding to fasting and refeeding. Gen. Comp. Endocrinol. 2015, 223, 108–119. [Google Scholar] [PubMed]
  28. Jönsson, E. The role of ghrelin in energy balance regulation in fish. Gen. Comp. Endocrinol. 2013, 187, 79–85. [Google Scholar]
  29. Amole, N.; Unniappan, S. Fasting induces preproghrelin mRNA expression in the brain and gut of zebrafish, Danio rerio. Gen. Comp. Endocrinol. 2009, 161, 133–137. [Google Scholar] [PubMed]
  30. Murashita, K.; Kurokawa, T.; Nilsen, T.O.; Ronnestad, I. Ghrelin, cholecystokinin, and peptide YY in Atlantic salmon (Salmo salar): Molecular cloning and tissue expression. Gen. Comp. Endocrinol. 2009, 160, 223–235. [Google Scholar] [PubMed]
  31. Unniappan, S.; Canosa, L.F.; Peter, R.E. Orexigenic actions of ghrelin in goldfish: Feeding-induced changes in brain and gut mRNA expression and serum levels, and responses to central and peripheral injections. Neuroendocrinology 2004, 79, 100–108. [Google Scholar]
  32. Hosomi, N.; Furutami, T.; Takahashi, N.; Masumoto, T.; Fukada, H. Yellowtail neuropeptide Y: Molecular cloning, tissue distribution, and response to fasting. Fish. Sci. 2014, 80, 483–492. [Google Scholar]
  33. Carmo, T.L.L.; Lima, M.C.M.; Lima, J.L.V.; Souza, S.S.; Val, A.L. Tissue distribution of appetite regulation genes and their expression in the Amazon fish Colossoma macropomum exposed to climate change scenario. Total Sci. Environ. 2023, 854, 158729. [Google Scholar]
  34. Lui, T.A.; Silva, W.P.; Nervis, J.A.L.; Brum, J.M.D.; Bittencourt, F.; Neu, D.H.; Boscolo, W.R. Food restriction in Nile tilapia juveniles (Oreochromis niloticus). Span. J. Agric. Res. 2020, 18, e0607. [Google Scholar]
  35. Takahashi, L.S.; Biller, J.D.; Criscuolo-Urbinati, E.; Urbinati, E.C. Feeding strategy with alternate fasting and refeeding: Effects on farmed pacu production. J. Anim. Physiol. Anim. Nutr. 2011, 95, 259–266. [Google Scholar]
  36. Yengkokpam, S.; Sahu, N.P.; Pal, A.K.; Debnath, D.; Kumar, S.; Jain, K.K. Compensatory growth, feed intake and body composition of Labeo rohita fingerlings following feed deprivation. Aquac. Nutr. 2013, 20, 101–108. [Google Scholar]
  37. El-Araby, D.A.; Amer, S.A.; Khalil, A.A. Effect of different feeding regimes on the growth performance, antioxidant activity, and health of Nile tilapia, Oreochromis niloticus. Aquaculture 2020, 528, 735572. [Google Scholar]
  38. Baloi, M.; Carvalho, C.V.A.; Sterzelecki, F.C.; Passini, G.; Cerqueira, V.R. Effects of feeding frequency on growth, feed efficiency and body composition of juveniles Brazilian sardine, Sardinella brasiliensis (Steindacher 1879). Aquac. Res. 2016, 47, 554–560. [Google Scholar]
  39. Başçınar, N.; Çakmak, E.; Çavdar, Y.; Aksungur, N. The effect of feeding frequency on growth performance and feed conversion rate of black sea trout (Salmo trutta labrax Pallas, 1811). Turk. J. Fish. Aquat. Sci. 2007, 7, 13–17. [Google Scholar]
  40. Jamabo, N.A.; Fubana, R.I.; Dienye, H.E. Feeding frequency on growth and feed conversion of Clarias gariepinus (Burchell, 1822) fingerlings. Int. J. Fish. Aquat. Stud. 2015, 3, 353–356. [Google Scholar]
  41. Karadal, O.; Gürog, D.; Türkmen, G. Effects of feeding frequency and Spirulina on growth performance, skin coloration and seed production on kenyi cichlids (Maylandia lombardoi). Aquac. Int. 2017, 25, 121–134. [Google Scholar]
  42. Salama, A.J. Effects of different feeding frequency on the growth, survival and feed conversion ratio of the Asian sea bass Lates calcarifer juveniles reared under hypersaline seawater of the Red Sea. Aquac. Res. 2008, 39, 561–567. [Google Scholar]
  43. Tian, H.-Y.; Zhang, D.-D.; Li, X.-F.; Zhang, C.-N.; Qian, Y.; Lui, W.-B. Optimum feeding frequency of juvenile blunt snout bream Megalobrama amblycephala. Aquaculture 2015, 437, 60–66. [Google Scholar]
  44. Lee, S.-M.; Cho, S.H.; Kim, D.-J. Effects of feeding frequency and dietary energy level on growth and body composition of juvenile flounder, Paralichthys olivaceus (Temminck & Schlegel). Aquac. Res. 2000, 31, 917–921. [Google Scholar]
  45. Barcellos, L.J.G.; Marqueze, A.; Trapp, M.; Quevedo, R.M.; Ferreira, D. The effects of fasting on cortisol, blood glucose and liver and muscle glycogen in adult jundiá Rhamdia quelen. Aquaculture 2010, 300, 231–236. [Google Scholar]
  46. Laiz-Carrión, R.; Viana, I.R.; Cejas, J.R.; Ruiz-Jarabo, I.; Jerez, S.; Martos, J.A.; Eduardo, A.B.; Mancera, J.M. Influence of food deprivation and high stocking density on energetic metabolism and stress response in red porgy, Pagrus pagrus L. Aquac. Int. 2012, 20, 585–599. [Google Scholar]
  47. Li, H.; Xu, W.; Jin, J.; Yang, Y.; Zhu, X.; Han, D.; Liu, H.; Xie, S. Effects of starvation on glucose and lipid metabolism in gibel carp (Carassius auratus gibelio var. CAS III). Aquaculture 2018, 496, 166–175. [Google Scholar]
  48. Nebo, C.; Gimbo, R.Y.; Kojima, J.T.; Overturf, K.; Dal-Pai-Silva, M.; Portella, M.C. Depletion of stored nutrients during fasting in Nile tilapia (Oreochromis niloticus) juveniles. J. Appl. Aquac. 2013, 30, 157–173. [Google Scholar] [CrossRef]
  49. Honorato, C.A.; Cruz, C.; Carneiro, D.J.; Machado, M.R.F. Histologia e histoquímica do intestino anterior de tilápia do Nilo (Oreochromis niloticus) alimentadas com dietas contendo silagem de peixe. Braz. J. Vet. Res. Anim. Sci. 2011, 48, 281–288. [Google Scholar]
  50. Zaldúa, N.; Naya, D.E. Digestive flexibility during fasting in fish: A review. Comp. Biochem. Physiol. A 2014, 169, 7–14. [Google Scholar]
  51. Cavali, J.; Nóbrega, B.A.; Saturnino, K.C.; Ferreira, E.; Dantas Filho, J.V.; Schons, S.V.; Porto, M.O. Intestinal histomorphometry and biometric indexes of tambaqui (Colossoma macropomum) grown under different feeding rates. Braz. J. Dev. 2020, 6, 80546–80561. [Google Scholar]
  52. Shaibani, M.E.; Amiri, B.M.; Khodabandeh, S. Starvation and refeeding effects on pyloric caeca structure of Caspian salmon (Salmo trutta caspius, Kessler 1877) juvenile. Tissue Cell 2013, 45, 204–210. [Google Scholar]
  53. Eroldogan, O.T.; Kumlu, M.; Aktas, M. Optimum feeding rates for European sea bass Dicentrarchus labrax L. reared in seawater and freshwater. Aquaculture 2004, 231, 501–515. [Google Scholar]
  54. Ferreira, C.M.; Antoniassi, N.A.B.; Silva, F.G.; Povh, J.A.; Potença, A.; Moraes, T.C.H.; Silva, T.K.S.T.; Abreu, J.S. Características histomorfométricas do intestino de juvenis de tambaqui após uso de probiótico na dieta e durante transporte. Pesq. Vet. Bras. 2014, 34, 1258–1260. [Google Scholar]
  55. Wang, Y.; Xie, S.; Nie, Z.; Li, Q.; Sun, Y.; Shao, N.; Gao, J.; Hu, J.; Xu, P.; Xu, G. Optimum feeding frequency of juvenile largemouth bass (Micropterus salmoides) reared in in-pond raceway recirculating culture system. Fish Physiol. Biochem. 2020, 46, 2197–2212. [Google Scholar] [PubMed]
Figure 1. Experimental design of the 84-day feeding trial (12 weeks). 6/F: six days of feed; 1/R: one day of feed restriction.
Fishes 10 00148 g001
Figure 2. Histological sections of the anterior portion of the tambaqui intestine with 100x magnification under an optical microscope coupled to an image analyzer system to measure the height (VH) and perimeter (VP) of the villi, in HE staining after 84 experimental days. (A): CF/2x; (B): CF/3x; (C): R/2x; (D): R/3x.
Fishes 10 00148 g002
Table 1. Growth performance at 0–42 and 43–84 days for juvenile tambaqui subjected to weekly cycles of feed restriction of one day and refeeding for six days or continuously fed and feeding frequencies of two or three times a day.
0–42 daysFinal weight (g)Weight gain (g)SGR (%/Day)Feed intake (g/Fish)Feed conversion ratio
Means for feeding protocol
Continuously fed140.20 ± 37.5439.38 ± 10.761.55 ± 0.3130.83 ± 9.87 b0.79 ± 0.22
Restricted136.70 ± 34.7844.88 ± 12.741.82 ± 0.4043.27 ± 6.23 a1.00 ± 0.16
Means for feeding frequency
Twice a day (2x)138.72 ± 38.3145.38 ± 13.231.80 ± 0.4338.58 ± 8.020.88 ± 0.18
Three times a day (3x)138.14 ± 34.0238.88 ± 9.811.56 ± 0.2935.52 ± 12.460.91 ± 0.26
p-values
Feeding protocol0.5840.3820.1610.0120.059
Feeding frequency0.9280.3040.2400.4790.781
Interaction0.3790.7470.4700.3130.665
43–84 daysFinal weight (g)Weight gain (g)SGR (%/day)Feed intake (g/fish)Feed conversion ratio
Means for feeding protocol Continuously fed (CF)
Restricted (R)217.60 ± 68.4858.63 ± 25.830.80 ± 0.23 b79.52 ± 26.071.42 ± 0.24 a
Means for feeding frequency208.20 ± 66.8681.50 ± 29.371.06 ± 0.25 a76.49 ± 19.010.98 ± 0.15 b
Twice a day (2x)205.00 ± 65.3971.63 ± 26.810.94 ± 0.2281.08 ± 23.711.18 ± 0.21
Three times a day (3x)220.90 ± 69.2868.50 ± 33.230.93 ± 0.3374.93 ± 21.511.22 ± 0.38
p-values
Feeding protocol0.4320.1090.0230.799<0.001
Feeding frequency0.1830.8170.6000.6060.589
Interaction0.0190.0960.0230.3020.024
Different letters within the same column are significantly different (Tukey test, p < 0.05). Data were expressed as mean ± standard deviation. SGR: specific growth rate.
Table 2. Interactions of growth performance parameters (43–84 days) for juvenile tambaqui subjected to weekly cycles of feed restriction of one day and refeeding for six days or continuously fed and feeding frequencies of two or three times a day.
Feeding ProtocolFeeding FrequencyFinal Weight (g)SGR (%/Day)Feed Conversion Ratio
Continuously fed (CF)Twice a day (2x)222.28 ± 66.55 Aa0.94 ± 0.23 Aa1.28 ± 0.24 Aa
Three times a day (3x)187.63 ± 60.34 Bb0.67 ± 0.15 Bb1.55 ± 0.18 Aa
Restricted (R)Twice a day (2x)213.00 ± 71.10 Aa0.94 ± 0.24 Aa1.06 ± 0.11 Ab
Three times a day (3x)228.81 ± 67.60 Aa1.19 ± 0.22 Aa0.89 ± 0.14 Ba
Means followed by lowercase letters indicate differences between feeding protocols for each feeding frequency by Tukey’s test (p < 0.05). Different capital letters indicate differences between feeding frequency for each feeding protocol by Tukey’s test (p < 0.05). Data were expressed as mean ± standard deviation. SGR: specific growth rate.
Table 3. Blood biochemical parameters at 0–42 and 43–84 days for juvenile tambaqui subjected to weekly cycles of feed restriction of one day and refeeding for six days or continuously fed and feeding frequencies of two or three times a day.
0–42 DaysGlucose (mg/dL)Triglycerides (mg/dL)Cholesterol (mg/dL)Total Proteins
(g/dL)
Means for feeding protocol
Continuously fed (CF)61.43 ± 7.52178.71 ± 49.47187.47 ± 64.785.85 ± 0.35
Restricted (R)65.67 ± 14.80186.30 ± 32.08219.84 ± 35.485.85 ± 0.14
Means for feeding frequency
Twice a day (2x)64.95 ± 11.55173.87 ± 27.82207.62 ± 36.015.78 ± 0.22
Three times a day (3x)62.14 ± 12.06191.13 ± 50.74199.70 ± 68.445.91 ± 0.28
p-values
Feeding protocol0.3460.6140.0841.000
Feeding frequency0.5310.2570.6650.176
Interaction0.5220.6620.0880.488
43–84 daysGlucose (mg/dL)Triglycerides (mg/dL)Cholesterol (mg/dL)Total proteins
(g/dL)
Means for feeding protocol
Continuously fed (CF)54.22 ± 6.04 b278.51 ± 26.19182.92 ± 83.696.02 ± 0.31
Restricted (R)67.88 ± 10.78 a284.86 ± 25.13223.15 ± 49.025.94 ± 0.45
Means for feeding frequency
Twice a day (2x)60.17 ± 9.99277.36 ± 25.20209.83 ± 71.435.98 ± 0.42
Three times a day (3x)61.92 ± 12.28286.02 ± 25.76196.24 ± 71.205.98 ± 0.36
p-values
Feeding protocol<0.0010.4980.1150.587
Feeding frequency0.5820.3570.5870.928
Interaction0.4140.3920.4600.153
Different letters within the same column are significantly different (Tukey test, p < 0.05). Data were expressed as mean ± standard deviation.
Table 4. Somatic indices (hepatosomatic index and mesenteric fat index) and liver lipid levels after 84 days for juvenile tambaqui subjected to weekly cycles of feed restriction of one day and refeeding for six days or continuously fed and feeding frequencies of two or three times a day.
Hepatosomatic Index
(%)
Mesenteric Fat Index
(%)
Liver Lipid Levels
(mg/g)
Means for feeding protocol
Continuously fed (CF)1.45 ± 0.502.17 ± 1.0849.92 ± 12.49
Restricted (R)1.66 ± 0.591.95 ± 0.8554.50 ± 12.55
Means for feeding frequency
Twice a day (2x)1.52 ± 0.711.80 ± 0.9351.39 ± 16.00
Three times a day (3x)1.59 ± 0.332.32 ± 0.9653.02 ± 8.24
p-values
Feeding protocol0.3080.5140.455
Feeding frequency0.7250.1310.788
Interaction0.9020.1590.083
Table 5. Histomorphometry of the intestine (villi perimeter and villi height) after 84 days for juvenile tambaqui subjected to weekly cycles of feed restriction of one day and refeeding for six days or continuously fed and feeding frequencies of two or three times a day.
Villi Perimeter (µm)Villi Height (µm)
Means for feeding protocol
Continuously fed (CF)306.03 ± 98.55 b102.52 ± 29.58 b
Restricted (R)712.78 ± 558.13 a235.13 ± 164.80 a
Means for feeding frequency
Twice a day (2x)649.13 ± 554.28 a211.69 ± 164.66 a
Three times a day (3x)329.77 ± 95.42 b111.31 ± 33.13 b
p-values
Feeding protocol<0.001<0.001
Feeding frequency<0.001<0.001
Interaction<0.001<0.001
Different letters within the same column are significantly different (Tukey test, p < 0.05). Data were expressed as mean ± standard deviation.
Table 6. Interactions of intestinal histomorphometry in juvenile tambaqui subjected to weekly cycles of feed restriction of one day and refeeding for six days or continuous feeding and feeding frequencies of two or three times a day.
Feeding ProtocolFeeding FrequencyVilli Perimeter (µm)Villi Height (µm)
Continuously fed (CF)Twice a day (2x)289.13 ± 83.70 Bb98.39 ± 24.50 Bb
Three times a day (3x)330.74 ± 116.05 Aa108.39 ± 35.92 Aa
Restricted (R)Twice a day (2x)1051.49 ± 581.61 Aa340.10 ± 161.54 Aa
Three times a day (3x)328.92 ± 77.55 Ba114.00 ± 31.56 Aa
Means followed by lowercase letters indicate differences between feeding protocols within each feeding frequency by Tukey’s test (p < 0.05). Different capital letters indicate differences between feeding frequencies for each feeding protocol by Tukey’s test (p < 0.05). Data are expressed as mean ± standard deviation.
Disclaimer/Publisher’s Note: The statements, opinions and data contained in all publications are solely those of the individual author(s) and contributor(s) and not of MDPI and/or the editor(s). MDPI and/or the editor(s) disclaim responsibility for any injury to people or property resulting from any ideas, methods, instructions or products referred to in the content.

