Article

Fungal Protein from Non-Food Bioresources in Diets for Rainbow Trout (Oncorhynchus mykiss)

by
Ashwath Gaudhaman
1,
Sajjad Karimi
2,
Torbjörn Lundh
1,
Margareth Øverland
3,
Mohammad J. Taherzadeh
2,
Markus Langeland
4,
Kartik Baruah
1,† and
Aleksandar Vidakovic
1,*,†
1
Department of Applied Animal Science and Welfare, Faculty of Veterinary Medicine and Animal Sciences, Swedish University of Agricultural Sciences, 750 07 Uppsala, Sweden
2
Department of Resource Recovery and Building Technology, Faculty of Textiles, Engineering and Business, University of Borås, 501 90 Borås, Sweden
3
Department of Animal and Aquacultural Sciences, Faculty of Biosciences, Norwegian University of Life Sciences, NO-1432 Ås, Norway
4
Department of Agriculture and Food, RISE Research Institutes of Sweden, 402 29 Göteborg, Sweden
*
Author to whom correspondence should be addressed.
These authors contributed equally to this work.
Fishes 2025, 10(4), 149; https://doi.org/10.3390/fishes10040149
Submission received: 14 February 2025 / Revised: 24 March 2025 / Accepted: 25 March 2025 / Published: 27 March 2025
(This article belongs to the Section Nutrition and Feeding)

Abstract

The growing aquaculture industry has an increasing demand for novel, sustainably produced protein sources for aquafeed. This study aimed to determine the apparent digestibility (AD%), pellet quality, and protein score of four novel fungal proteins in rainbow trout (Oncorhynchus mykiss), namely, PEKILO® (PEK) derived from Paecilomyces variotii, Aspergillus oryzae (AO), Rhizopus oligosporus (RO), and Rhizopus delemar (RD). All fungi were grown on various side-streams, such as beet vinasse, thin stillage, and whole stillage. The diets were produced by extrusion technology and consisted of control and test diets with a 30:70 test ingredient/control ratio. Feeding lasted for 39 days. Each tank had 20 fish, with three replicates per dietary treatment. One-way ANOVA was performed to compare the means of the groups with each other. The dry matter (DM) digestibility of PEK was significantly higher than that of AO, RD, and RO, all with similar digestibility. The crude protein AD% for PEK was 86.5%, which is significantly higher than that of the other fungal sources. AO, PEK, RD, and RO had similar crude fat AD% compared to each other, at 83.8%, 87.4%, 90.5%, and 88.5%, respectively. The pellet quality was found to deteriorate with addition of fungal proteins. PEK had high AD% for most of the macronutrients tested and better pellet quality.
Key Contribution: This manuscript evaluates the feasibility of using various filamentous fungi grown from industrial and agricultural side-streams as feed for rainbow trout by evaluating the digestibility and pellet quality of the feed.

1. Introduction

The rapid global economic development has led to higher per capita incomes [1], which are often associated with increased consumption of animal-based foods [2], particularly fish, thereby driving growth in aquaculture. Aquaculture is crucial for global food security, especially in the context of the United Nations’ zero hunger goal [3]. However, to remain sustainable, aquaculture must minimize its environmental impact.
Adopting circular economy principles is one strategy for sustainable aquaculture growth. But climate change threatens food security [4], with predictions suggesting a decline in aquaculture production due to its effects [5]. Climate change, along with geopolitical instability, could also disrupt feed ingredients’ availability, creating bottlenecks in production. Thus, exploring alternative feed ingredients from diverse sources, such as byproducts from forestry [6,7], food compost [8], and agriculture [9], is essential for resilience and sustainability.
Historically, extruded pellets for salmonids were made using fish meal and oil [3]. However, capture fisheries have plateaued over the past 30 years, with many stocks overfished [10]. In contrast, aquaculture is rapidly growing [10], which will increase the demand for aquafeed [11]. While plant-based ingredients like soy and rapeseed have been used to ease pressure on fisheries, the ethical concerns surrounding plant proteins that humans could consume must also be considered [7]. Developing novel, sustainable ingredients should take into account not only environmental impacts (such as carbon footprint and biodiversity) but also societal costs (such as ethical sourcing and land use) to avoid shifting one problem to another.
Fungal protein sources hold promise for overcoming the challenges described above, due to several advantages over conventional protein sources. Firstly, they can be produced on a variety of organic substrates that are not suitable for human consumption [7]. Additionally, they have a high crude protein content, with some yeast species containing approximately 50% crude protein, comparable to the 34% to 42% found in soybeans [12,13,14]. Fungi are also sustainable and resource-efficient compared to fish meal [15,16,17]. They can be tailored to produce different amino acid compositions and nutrients, based on their substrates and growing conditions. Fungi offer a wide variety of species options based on specific needs. Lastly, fungal components can provide health benefits due to their immune-stimulating properties, in addition to their nutritional effects [18].
Despite their benefits, fungi have limitations that restrict their use in feed production today, such as strong cell walls that reduce their digestibility in fish [19]. Downstream processing to improve digestibility adds costs and should be implemented only when necessary. To address the cost concerns, it is crucial to explore different side-streams and substrates for microbial biomass production, and to identify the ideal substrate–fungi combination that requires minimal modification for use as a feed ingredient in aquaculture.
Among the various types of fungi currently being evaluated as feed ingredients, filamentous fungi emerge as particularly interesting candidates, in part due to their ability to valorize side-streams. Several important criteria must be considered when evaluating filamentous fungi as potential protein sources for salmonid feed. First, the fungi must be safe for human consumption, meaning that they are non-toxic and non-infectious. Additionally, it is crucial that they are produced from non-food sources and have a high protein content with an amino acid composition similar to that of fish meal. Moreover, the ingredients should have high digestibility and must not negatively impact the physical parameters of the feed. The physical quality of a fish feed pellet can affect feeding behavior, which, in turn, influences fish health, environmental impact, and economic losses [20]. Pellets that sink too quickly may not give fish enough time to consume them, potentially leading to economic losses and environmental pollution from uneaten feed. Pellets with low water stability can lead to abdominal distension syndrome and oil belching [20,21,22]. Additionally, during storage, handling, and transportation, pellets can become crushed, resulting in further losses. The broken feed particles may be too small for fish to consume or might float instead of sinking, which can also contribute to feed waste.
The microbial ingredients tested in this study include Paecilomyces variotii, Aspergillus oryzae, Rhizopus oligosporus, and Rhizopus delemar. P. variotii (PEKILO®) was originally used in the 1960s and 1970s to produce mycoprotein biomass from Finnish paper pulp waste. Today, PEKILO® production is focused on optimizing the valorization of various side-streams and sustainable substrates, leveraging its well-studied properties and the existing infrastructure for large-scale production [23]. A. oryzae, R. oligosporus, and R. delemar can be cultivated on industrial side-streams such as spent sulfite liquor or ethanol stillage while exhibiting high crude protein content, making them potential alternative protein sources for rainbow trout (Oncorhynchus mykiss) [24,25,26]. Additionally, Karimi S. et al. [27] observed that the nutritional composition of several filamentous fungi, such as A. oryzae grown on a pure substrate, is comparable to that of fish meal.
To the best of our knowledge, there are a limited number of studies analyzing the digestibility of selected multicellular fungi in rainbow trout. The digestibility of the ingredients can differ even among related species like Atlantic salmon (Salmo salar) and rainbow trout [28]. Hence, digestibility trials with the specific species are required to identify the correct digestibility values. The objective of this study is to evaluate four multicellular fungi derived from industrial side-streams for their suitability as feed ingredients for rainbow trout, assessing the ingredient nutrient composition, digestibility, and pellet quality parameters.

2. Materials and Methods

2.1. Test Ingredients and Diets

The test ingredients were PEKILO® (a product based on P. variotii KCL-24) (PEK), A. oryzae CBS 819.72 (AO), R. oligosporus CBS 112.07 (RO), and R. delemar CBS 145940 (RD). PEK was grown on French sugar beet vinasse, a byproduct from bio-ethanol production, as a substrate in an aerobic continuous fermenter. The medium suitably diluted vinasse, providing 20 g/L utilizable carbon sources (mainly glycerol and residual sugars), (NH4)2SO4 5 kg, KCl 150 g, MgSO4 ∙ 7 H2O 150 g, and Vogel’s trace elements, was continuously fed at a dilution rate of ~0.3 h−1 to the aerobic fermentation at 37 °C. The biomass was continuously collected at the same rate and harvested by mechanical filtration using a Larox filter press (Lappeenranta, Finland). The filtered biomass cake was ground and dried in a fluid bed dryer at ~65 °C to a dry matter content of about 94%. RD and AO were grown on thin stillage provided by Lantmännen Agroetanol (Norrköping, Sweden), using a submerged fermentation technique. Cultivation of RD and AO was carried out in a demo-scale reactor (1000 L working capacity, Process- & Industriteknik AB, Kristianstad, Sweden). The inoculum (20 L) was prepared from spores by two-step cultivation in a 1 L shake flask followed by a 26 L airlift bioreactor. Then, for the cultivation, thin stillage was diluted 1:4 with tap water, heat-sterilized at 121 °C, and fermented at 35 °C for 72 h at pH 4.7 ± 0.3 without any supplementation of other nutrients. Then, the fungal biomass was harvested, dewatered, squeezed and dried at 60 °C, and milled before use. The RO was grown on dried whole stillage provided by Lantmännen Agroetanol in Sweden, adjusted to 50% humidity and cultivated in a solid-state fermentation demo plant at 30 °C for 24 h by Millow AB (Västra Frölunda, Sweden), without any supplementation of other nutrients. Then, it was dried at 60 °C and milled before use.
A total of five diets were used in the experiment, including one reference diet and four test diets. The test diets contained 70% reference diets and 30% test ingredients, as described previously [29]. The composition of each diet is presented in Table 1. All diets were manufactured on a laboratory twin-screw extruder (Ketse 20/40, Anton Paar TorqueTec (Brabender) GmbH Duisburg, Germany), featuring 5 heating zones and using a 2 mm die head at the feed technology laboratory of the Swedish University of Agricultural Sciences, Uppsala. The extruder parameters recorded during the production of the experimental diets are available in the Supplementary Table S1.

2.2. Fish Management and Feeding

The experiment was conducted at Vattenbrukscentrum Norr AB, Kälarne, Sweden (Decimal degrees (DD): 62.977, 16.106) for 39 days. A total of 296 rainbow trout previously raised at the same facility were selected according to their size. A group of 20 fish with an average weight of 61.8 ± 15.3 g were randomly distributed in 15 tanks. Each tank was randomly assigned a diet among control, AO, RO, RD, and PEK. The tanks were supplied with 10 L/minflow-through water with a mean temperature of 11.6 ± 1.9 °C. The water was derived from Lake Ansjön, and was filtered using a drum filter prior to use. The dissolved oxygen content of the water was around 8.5 mg/L.
There were 15 tanks, each of which was randomly assigned one of the 5 diets. Each tank had a volume of 340 L. The fish were manually fed once daily in the morning (10:00 h). They were fed initially at 2% of their body weight, and the feeding level was later adjusted to satiation based on the quantity of uneaten feed. The fish were monitored for abnormal swimming activity or mortality every other day throughout the feeding period. The data on mortality is available in the Supplementary Table S2.
The feces were collected by stripping once during week 4 and twice each week during weeks 5 and 6 (a total of 5 times). Before stripping, the fishes were sedated in the tanks at a 40 mg/L final concentration of MS-222. The fish from each group were then removed and anesthetized with an 80 mg/L solution of tricaine methanesulfonate (MS-222) (Western Chemical Inc., Ferdale, WA, USA). The water droplets that were dripping were removed carefully using a tissue paper to prevent them from flowing into the sample tubes. They were stripped by squeezing the posterior intestine, as previously described by Austreng E. [30]. The fish were then returned to the tanks filled with fresh water. All feces samples from the same tanks were pooled together and stored in a −20 °C freezer for further analysis. The fishes were euthanized using a lethal dose of 240 mg/L after the end of the last stripping.

2.3. Proximate Analysis

The feed was milled into fine particles. The feces were freeze-dried, and thereafter the dry matter (DM) was analyzed by drying a part of the samples at 103 °C for 16 h, followed by cooling in a desiccator for 2 h and weighing. For ash determination, the dried samples were heated in a furnace at 550 °C for 3 h. The samples were then cooled in a desiccator and weighed. Total nitrogen was determined by the Kjeldahl method using a 20 digester and 8400 Kjeltec analyzer unit and 8460 sampler unit (Foss, Hillerød, Denmark). The crude protein content was calculated using the N*6.25 method [31]. The crude fat analysis was performed by the Soxhlet method [32] using a Soxhlet extraction unit (1047 Hydrolyzing Unit, Soxtec System HT 1043, FOSS Analytical A/S). Titanium dioxide was used as an inert marker and was analyzed with the same method as used by Short et al. [33], using spectrophotometry at 410 nm (UV 1800 Shimadzu, Kyoto, Japan).

2.4. Pellet Quality Analysis

Pellet diameter and expansion were calculated by selecting 30 random pellets and arranging them in ascending order based on their length. The middle 15 were chosen to measure the width. Expansion was calculated from the width and the die diameter using the formula below.
The water stability analysis was conducted as originally described by Baeverfjord et al. [22], using metal mesh baskets and a shaker (Haake SWB20, Karlsruhe, Germany), with the following modifications: 5 g feed samples were used, and dry matter was determined at 0, 30, 90, and 180 min.

2.5. Calculations

The weight gain % and corrected feed conversion ratio (FCR) were calculated using the following formula:
Total dry feed intake (g) = Total feed given (on dry matter basis) (g) − Uneaten feed (on dry matter basis) (g)
Weight gain (g) = Final weight (g) − Initial weight (g)
Corrected weight gain (g) = Weight gain (g) − (Number of fishes dead × average initial weight of the fishes (g))
Corrected   weight   gain   % = C o r r e c t e d   w e i g h t   g a i n   g T o t a l   i n i t i a l   w e i g h t   g × 100  
Specific   growth   rate   SGR %   day 1 = l n F B W l n I B W E x p e r i m e n t a l   p e r i o d   d a y s × 100
Corrected   FCR   = T o t a l   d r y   f e e d   i n t a k e   g C o r r e c t e d   w e i g h t   g a i n   g
The dietary apparent digestibility (AD%) of dry matter, protein, and fat was calculated using the following formulae described by Cho and Slinger [29] and modified by Bureau et al. [34]:
AD nutrient / energy = 1 M a r k e r f e e d × N u t r i e n t f e c e s M a r k e r f e c e s × N u t r i e n t f e e d × 100
AD dry   matter = 1 M a r k e r f e e d / M a r k e r f e c e s × 100
where
Markerfeed = Marker content as % of dry matter of the feed;
Markerfaeces = Marker content as % of dry matter of the feces;
Nutrientfeed = Nutrient content as % of dry matter of the feed;
Nutrientfaeces = Nutrient content as % of dry matter of the feces.
The ADCs of the test ingredients were calculated using the following equation adopted from [34]:
AD ingredient = AD testfeed + AD testfeed   AD ref . feed × 0.7 × N u t r i e n t r e f . 0.3 × N u t r i e n t i n g r e d i e n t
where
Nutrientref. = nutrient content as % of reference diet (as is);
Nutrientingredient = nutrient content as % of test ingredient (as is).
Water stability = (Final dry sample/Initial dry sample) × 100
Pellet expansion = ((Pellet width − Die diameter)/Die diameter) × 100
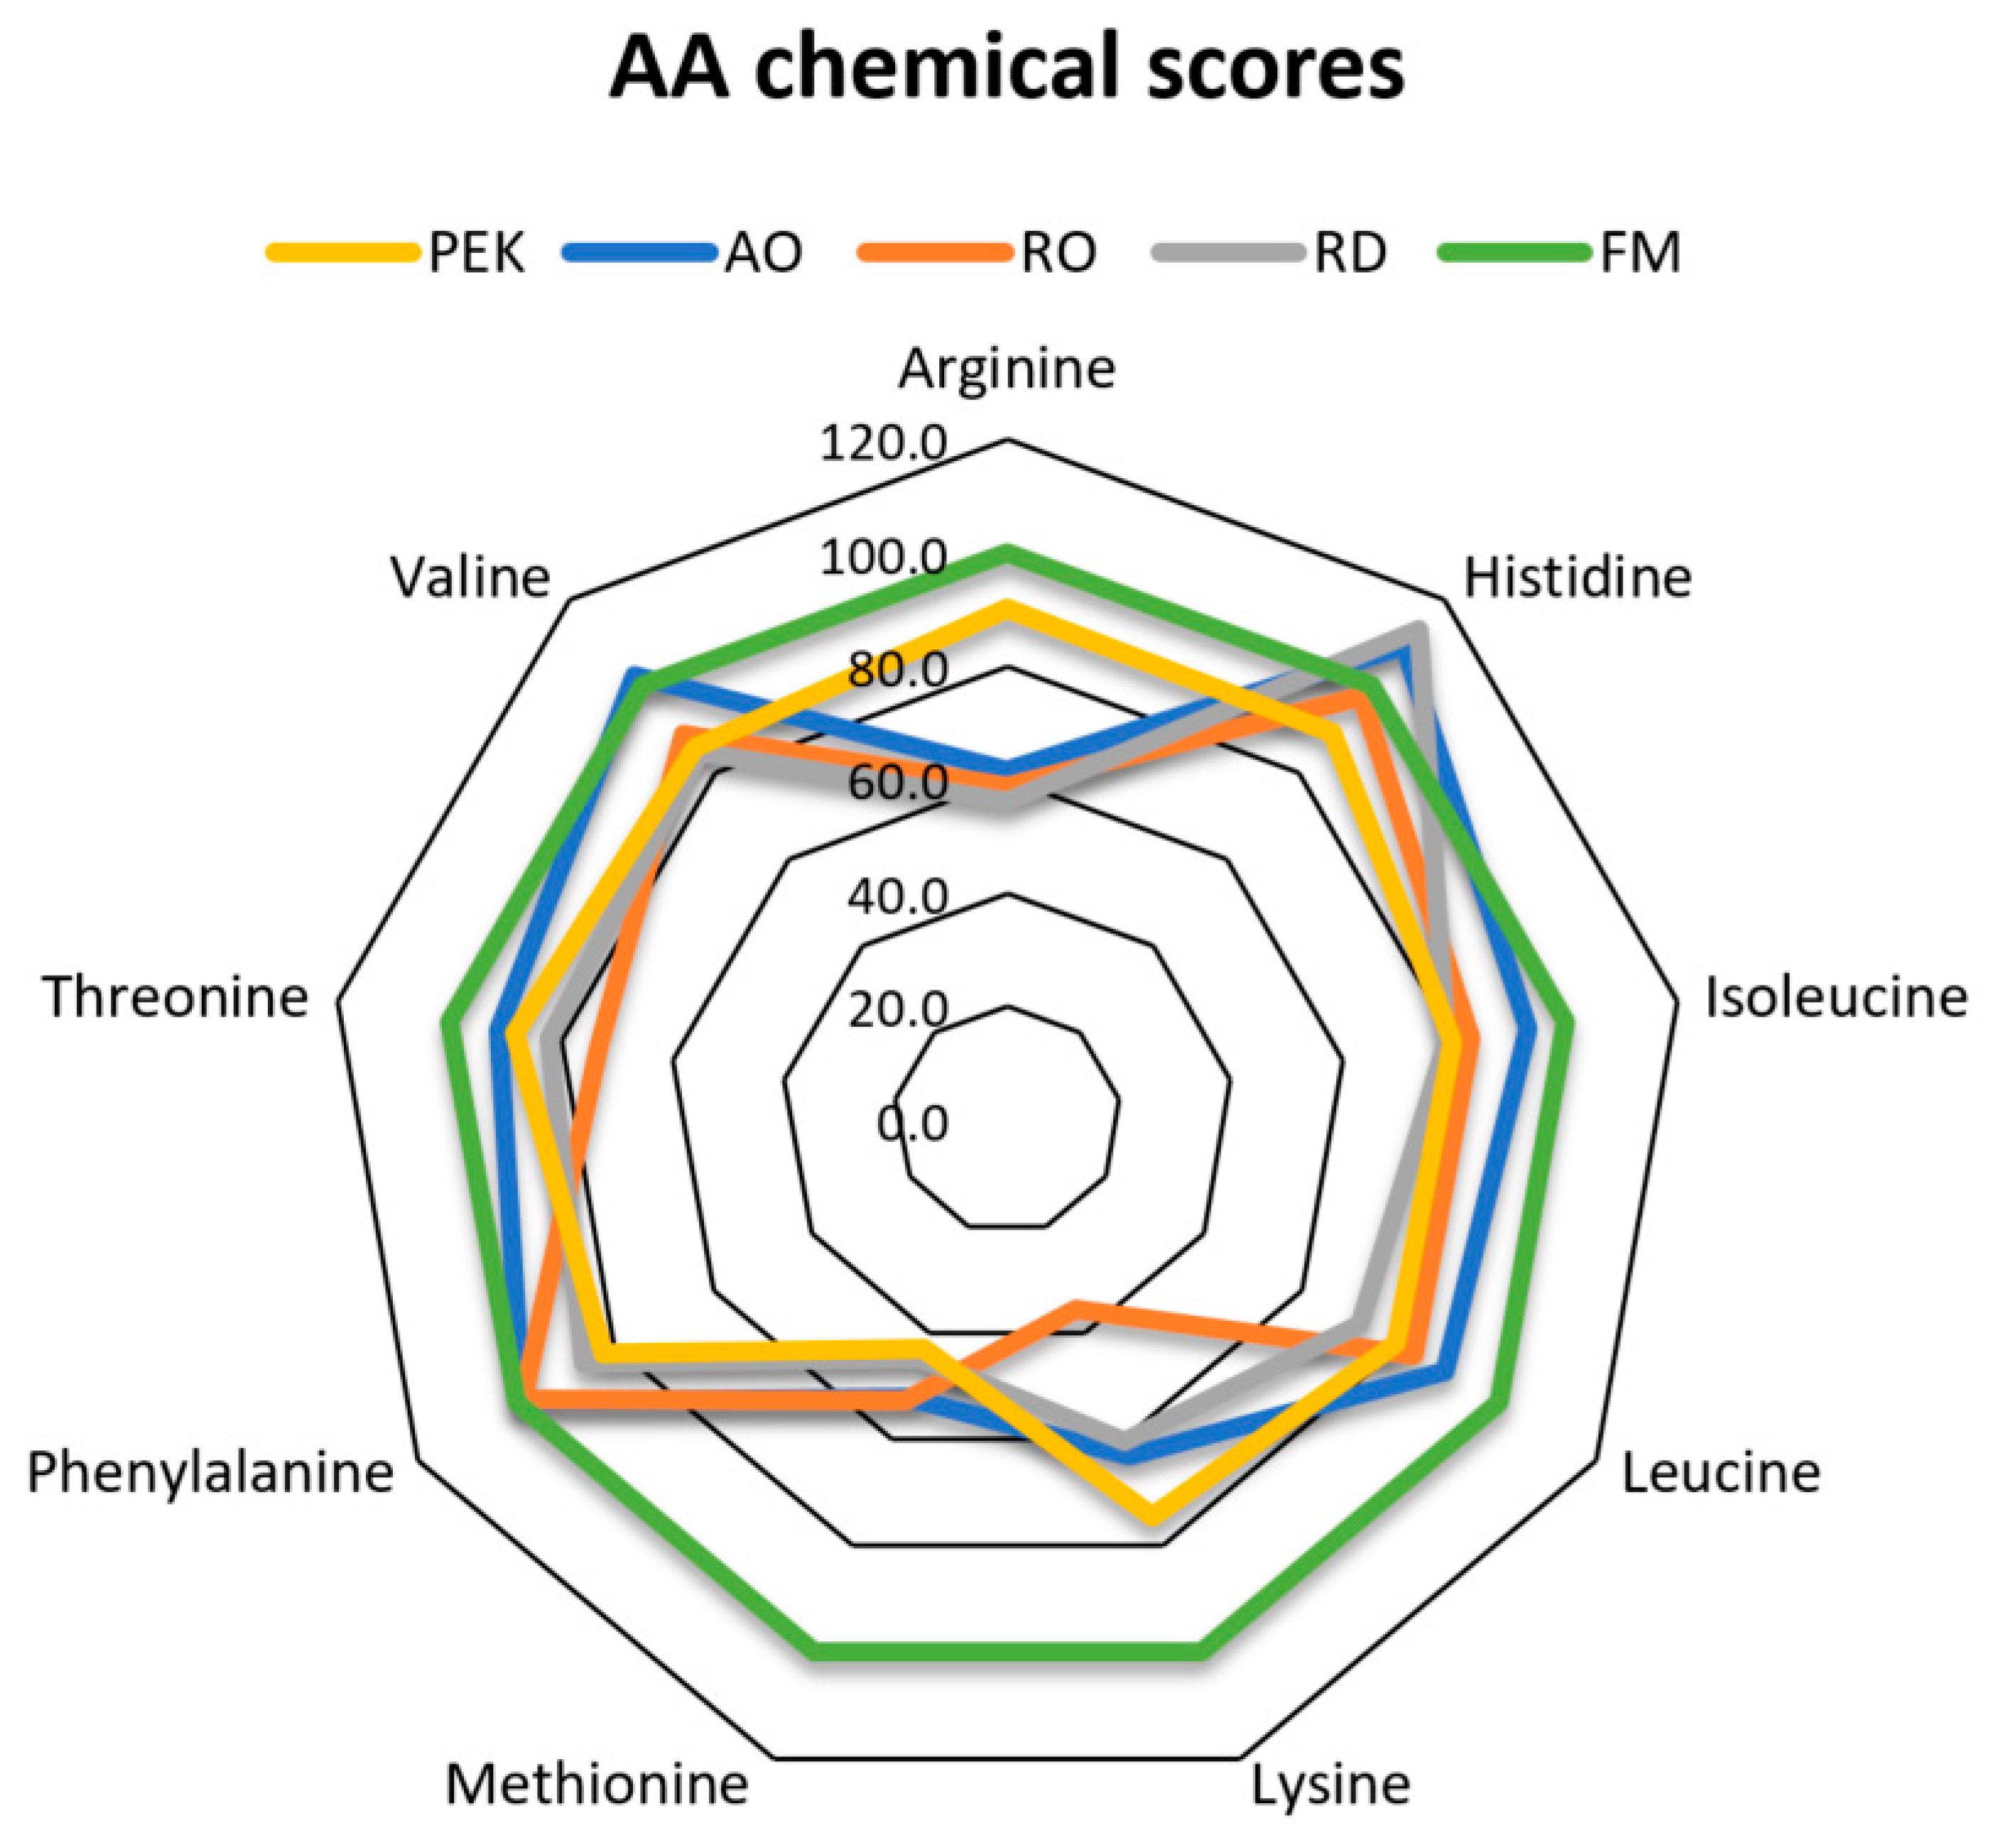
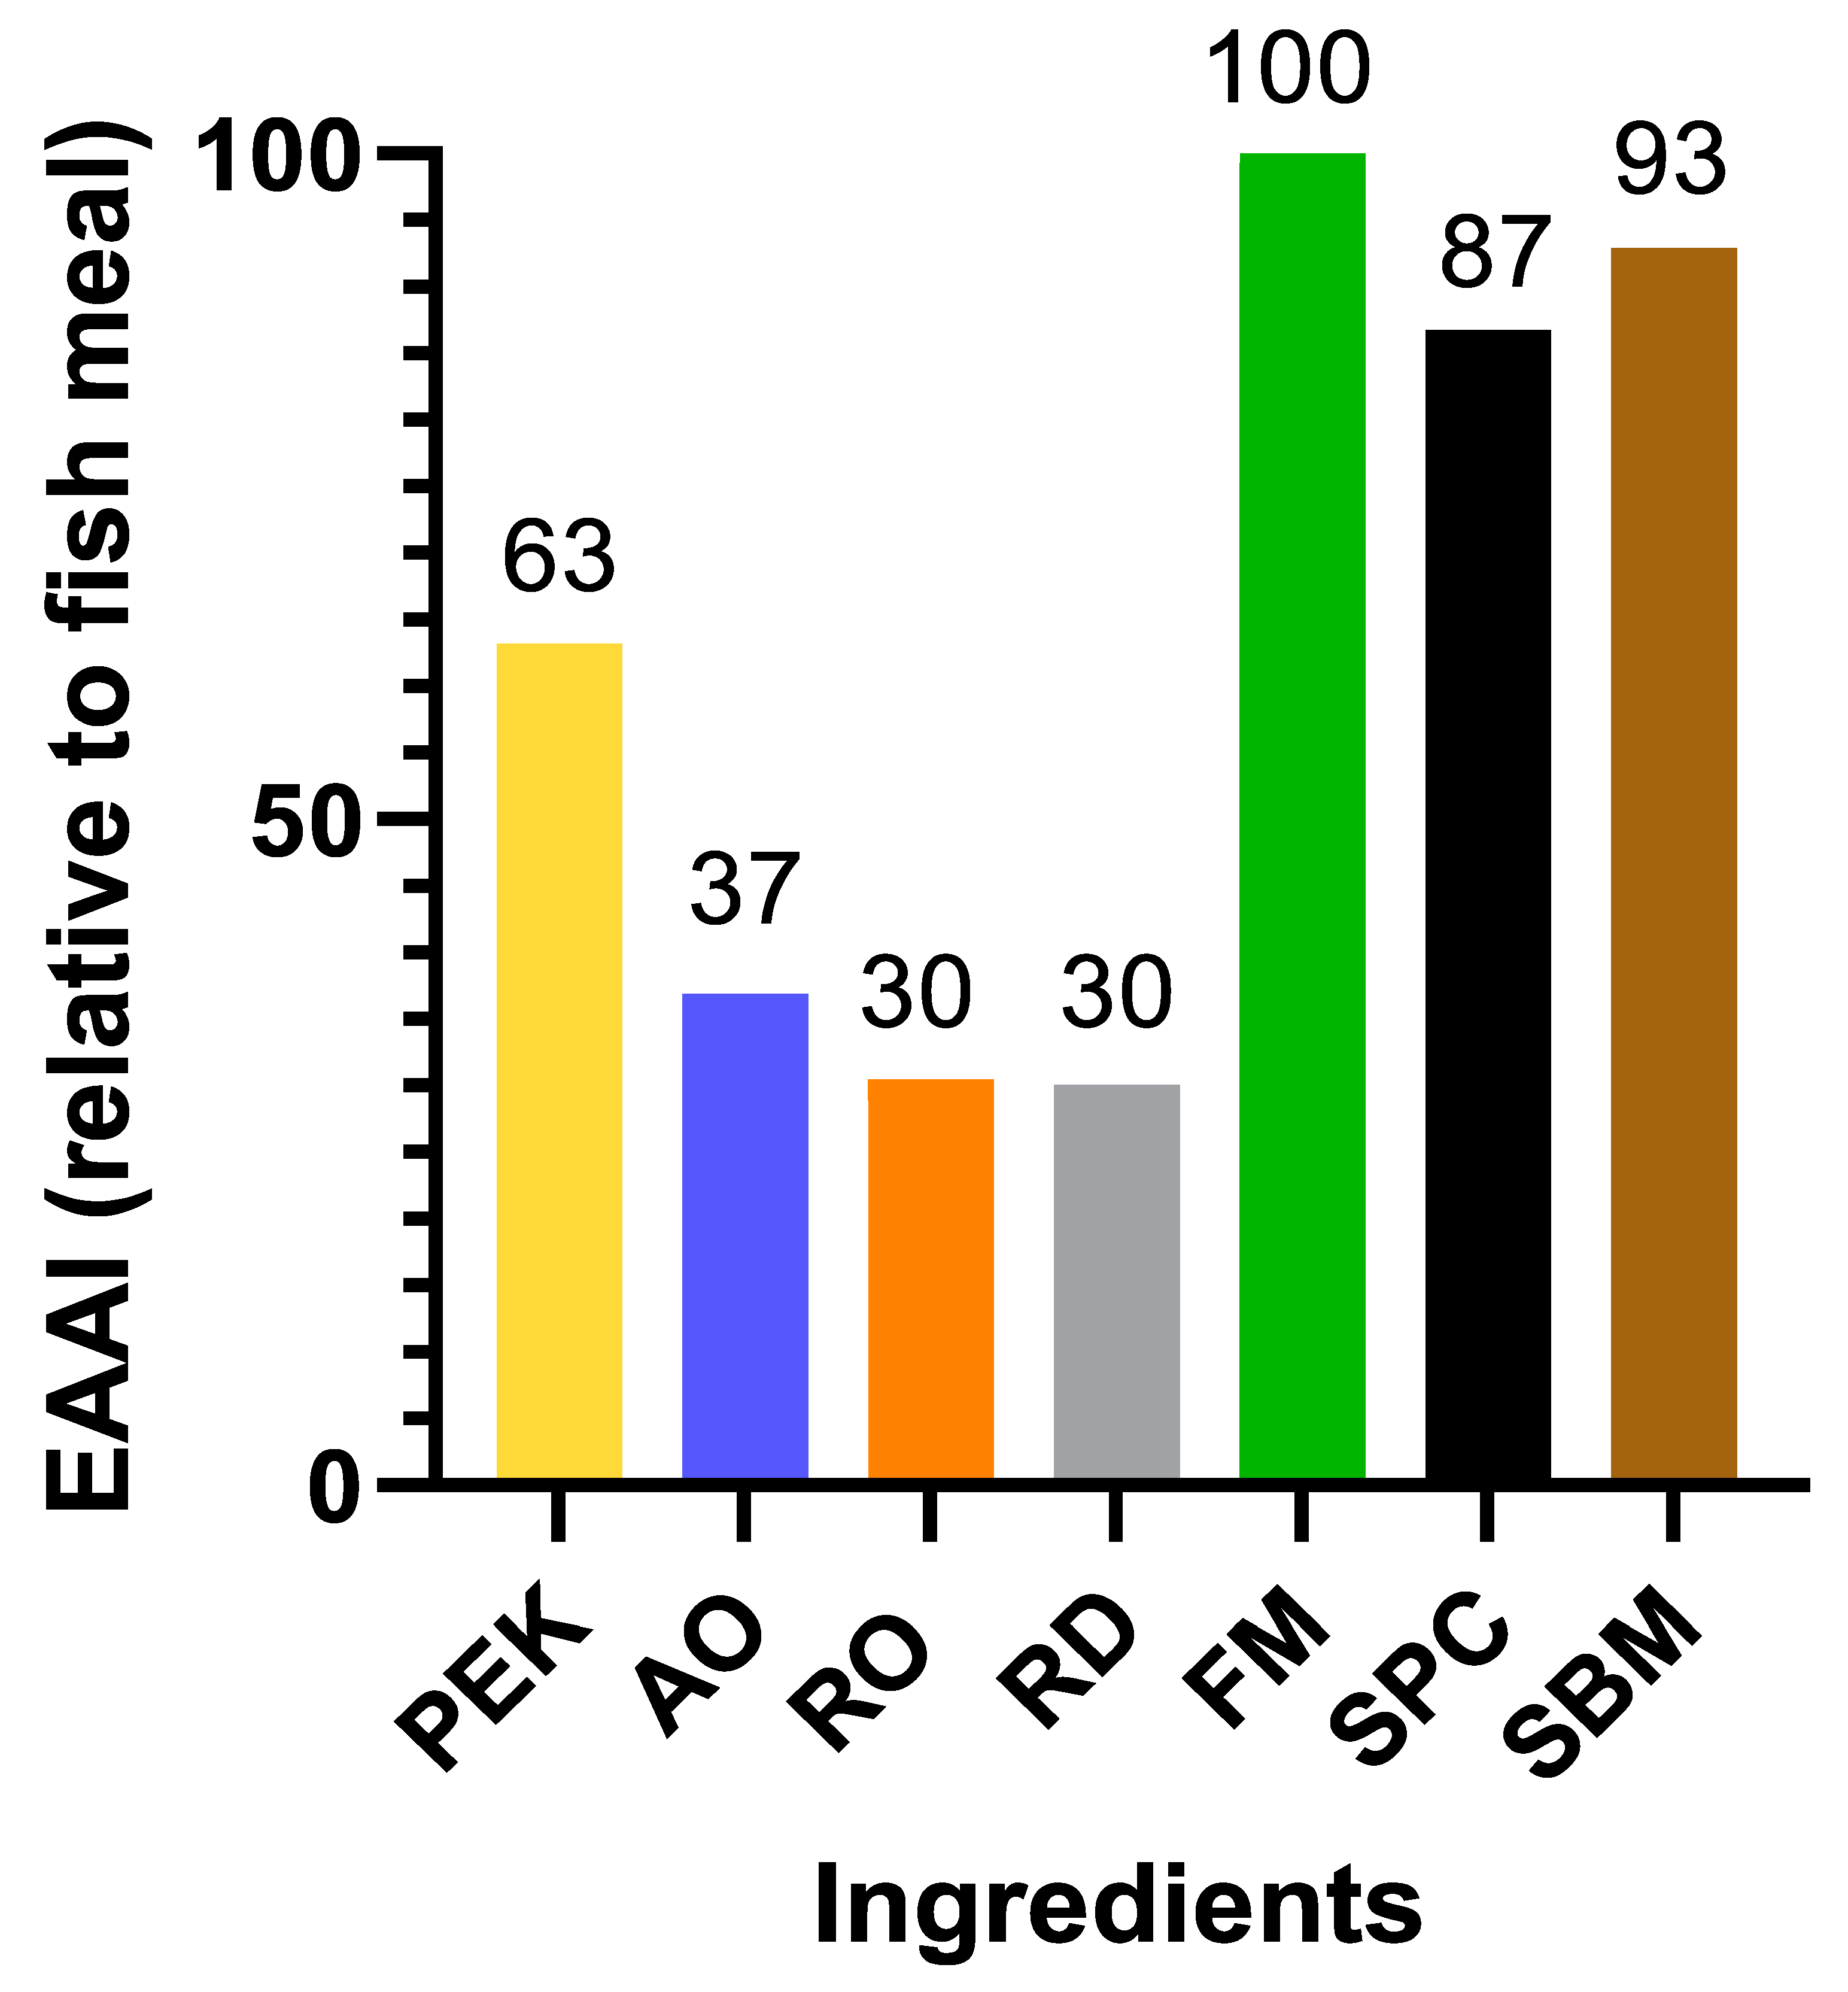
The protein value of each ingredient was evaluated using chemical scores (CSs) proposed by Mitchell et al. [35] and modified by Veldkamp [36]. The chemical score (Figure 1) compares the amino acid composition of the different ingredients with each other and fish meal. The chemical score considers each amino acid individually and, hence, does not give a comprehensive overview of the requirements, whereas the essential amino acid index (EAAI) gives a single score for all of the amino acids combined, based on the requirements for rainbow trout. This EAAI calculation was made following the formula described by Oser BL [37]. The integrated amino acid compositions were used to calculate the EAAI (Figure 2) using the formula below. The EAAI was then used to compare and identify the ingredients with the best amino acid composition.
EAAI   = aa 1 AA 1 × aa 2 AA 2 × aa 3 AA 3 aan AAn n

2.6. Statistical Analysis

The statistical analysis was carried out using GraphPad Prism version 10.1.0 (316). One-way analysis of variance (ANOVA) was conducted to compare the means of the groups with each other. The differences were considered significant at a p-value < 0.05. If the results were significantly different, then pairwise comparisons were performed using Tukey’s test with the same criteria.

3. Results

3.1. Proximate Analyses

The proximate analysis of the different microbial ingredients was carried out, and the values are presented in Table 2. The crude protein content (DM basis) of the filamentous fungi ranged from 44.1% (AO) to 66.8% (PEK). The fat content of the different ingredients varied between 3.4% (RO) and 12.5% (AO). The gross energy levels of the ingredients varied between 21.3 (PEK) and 22.3 MJ/kg DM (AO).
The proximate composition of the feeds is shown in Table 3. The crude protein content of the feeds varied from 46.9% (AO) to 53.8% (PEK) on a DM basis. The fat content in the diets ranged from 150.0 g/kg DM (PEK) to 219.6 g/kg (AO), and the gross energy levels were similar in all of the tested diets, ranging from 21.6 (RD) to 23.7 (control) MJ/kg DM.

3.2. Growth Performance and Feed Intake

The weight gain % was not significantly different between the groups fed different test diets and the control. The corrected FCR was significantly higher in the RO-fed group than in the control group, while there were no differences between the other treatments (Table 4). The feed intake of the different diets is also mentioned in Table 4. There were no significant differences observed between the different groups.

3.3. Apparent Digestibility

The ingredients’ ADs (%) are shown in Table 5. The apparent digestibility of dry matter (ADDM) of the different ingredients ranged from 23.6% (RD) to 59.3% (PEK) for the tested ingredients. PEK, with an ADDM of 59.3%, was significantly more digestible than AO, RD, and RO. The crude protein apparent digestibility (ADCP) of the different ingredients ranged from 44.9% to 86.5% and was significantly highest for PEK. RO had significantly higher ADCP than AO, whereas RD had significantly lower ADCP than AO, RO, and PEK. The apparent digestibility for crude fat (ADCF) of the different ingredients ranged from 83.8% (AO) to 90.5% (RD), and the tested ingredients were not significantly different from each other. The apparent digestibility of essential amino acids (ADAA) of the various ingredients is given in Table 5. The values for ADAA are given with their pooled standard errors of the mean. The methionine ADAA ranged from around 55.3% (RD) to 91.5% (PEK), and that of lysine ranged from 56.7% (RO) to 93.8% (PEK).
The AD values for the diets are shown in Table 6. The ADDM of the control diet was 83.3%. The ADDM of all of the test diets was significantly lower than that of the control and ranged from 65.1% (RD) to 76.0% (PEK). PEK-based diets had significantly higher dry matter digestibility than the AO-, RD-, and RO-based diets. No significant difference in the ADDM was observed between the groups fed AO, RD, and RO diets (Table 6). The ADCP of the experimental diets ranged from 76.8% (RD) to 91.2% (control). The ADCP of the test diets was significantly lower than that of the control in all of the diets except for PEK, where the ADCP did not differ significantly from that of the control. The ADCF of the test diets ranged from 90.5% (RD) to 95.3% (control). The ADCF for the PEK and RO diets did not significantly differ from that of the control diet, whereas that of AO and RO was significantly lower.

3.4. Physical Pellet Quality

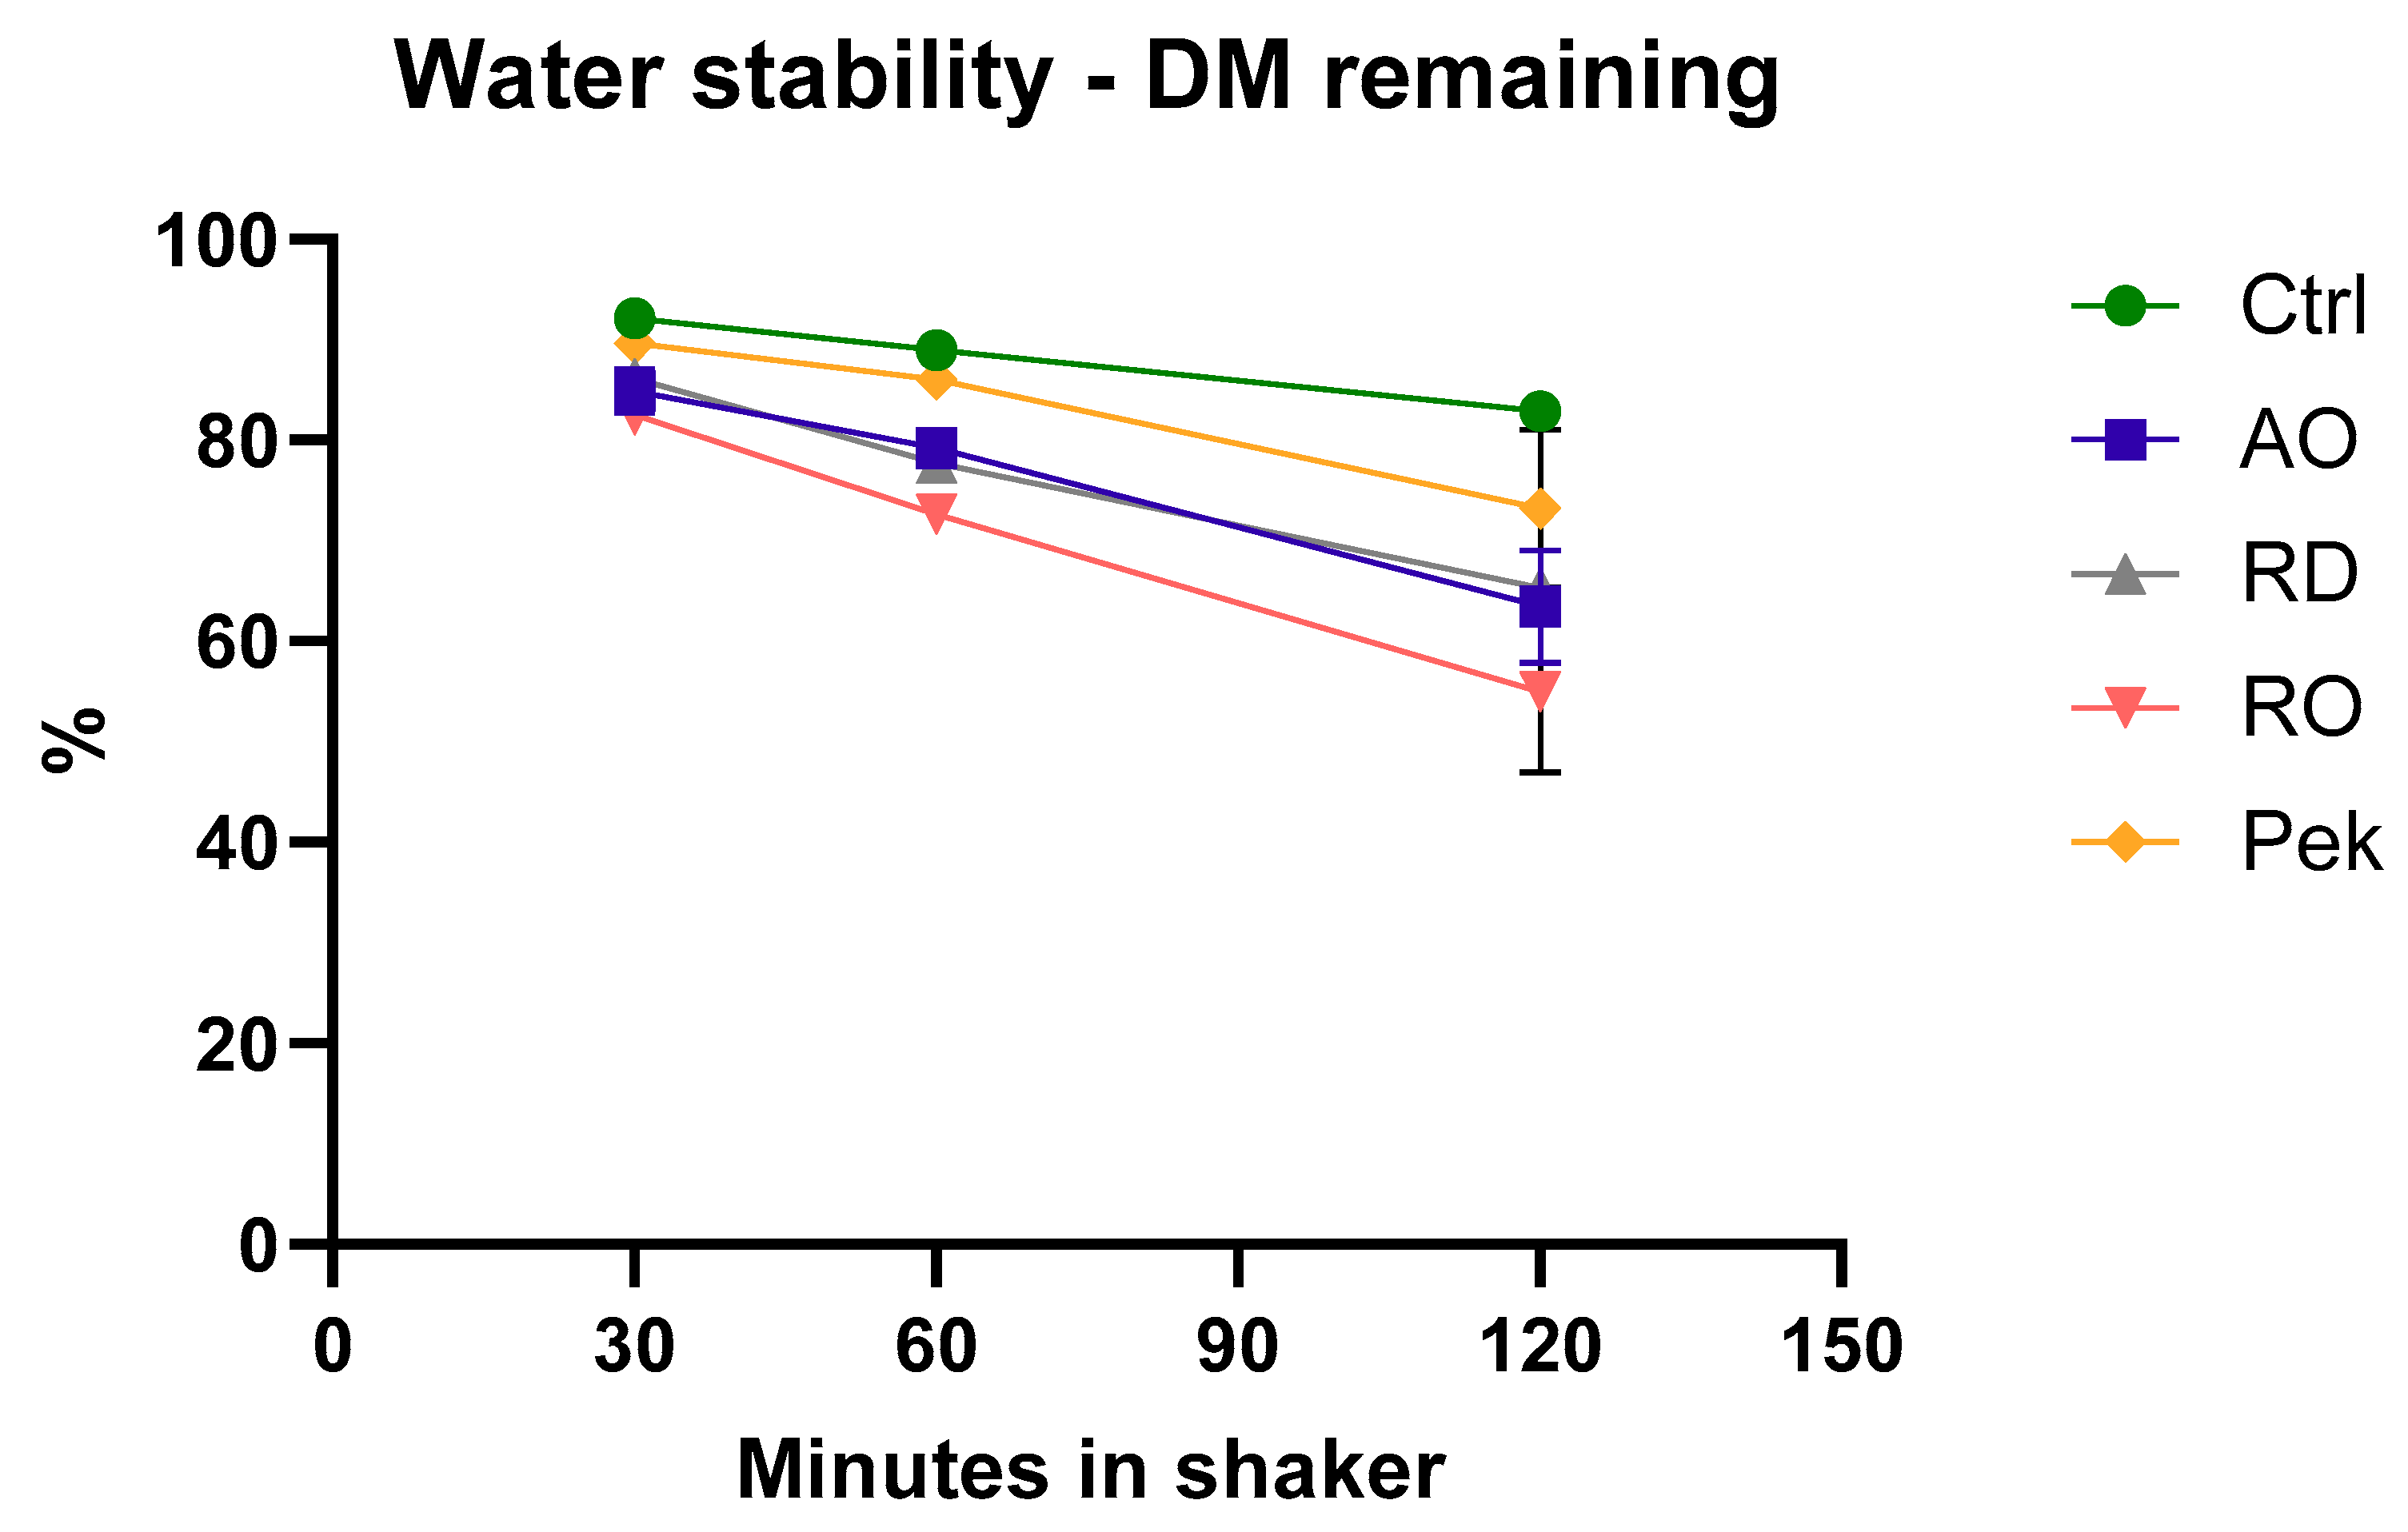
The pellet diameter and the expansion ratio are given in Table 7. The highest expansion ratio was measured in the control diet, whereas the lowest was found in the RD diet. The water stability index (WSI %) values of all diets at 30 min, 60 min, and 120 min are given in Table 7. After 30 min, the WSI was highest for the control diet and lowest for RO, while there were no differences between the other treatments. At 60 min, the differences in WSI were augmented, where the control and PEK diets had the highest values, followed by AO, RD, and RO. At 120 min, the differences were further enlarged. The control diet had the highest WSI (82.9%), whereas the RO diet had the lowest (54.9%). A graphical representation is given in Figure 3.

4. Discussion

There is a growing interest in using microbial ingredients, particularly those produced through the valorization of waste streams, as protein sources in aquaculture diets. However, safety, digestibility, palatability, and scalability of production remain significant barriers to incorporating microbial ingredients into fish feed. In this study, we evaluated four different microbial ingredients, grown on various waste streams, for their potential as feed ingredients in the diet of farmed rainbow trout. A digestibility trial was conducted to assess the quality and suitability of these ingredients as alternative feed sources. Studies including nutrient ADs (%) of multicellular fungi are quite scarce. To the best of our knowledge, this is one of the first studies to describe and compare the ADs (%) of various multicellular fungi in rainbow trout.
The different dietary treatments did not result in any statistically significant differences in weight gain percentage among the fish. This is in agreement with the findings of Vidakovic et al. [39], where high inclusion levels of fungal biomass did not result in varying growth. Regardless, Dahlberg [40] has shown differences in weight gain percentage even after 4–5 weeks of feeding. The lack of significant differences in weight gain % can be viewed as a positive outcome in the context of this study. However, considering the brief duration of the feeding trial, the lack of significant differences in growth is not surprising. Future research should focus on long-term growth performance trials utilizing the same ingredients within nutritionally balanced diets to gain a more comprehensive understanding of their effects. In addition, the FCR values were all below 1, indicating good conversion levels. RO had a significantly higher FCR than the other diets, indicating that the nutrients may not have been used as optimally as in the other diets. The total feed intake (Table 4) across all test diets did not differ significantly from the control. This indicates that, even at inclusion levels of 30%, the test ingredients did not contain compounds that adversely impacted feed palatability.
The crude protein (CP) content of the ingredients in this study ranged from 41% to 63%, with RO having a CP of 48.7%, slightly higher than the 47.9% reported by Langeland M. et al. [16]. The CP value for PEKILO® in the present study was slightly higher, at 66.7%, compared to the results of Hooft, J.M. et al. [23], at 62.5%. In contrast, the CP values of AO (44.1%) and RD (49.3%) in this study were lower compared to the ranges of 48.6% to 53.7% for AO and 48.6% to 53.2% for RD reported by Karimi S. et al. [9]. This variation in CP content could be attributed to differences in the substrates used, the extraction methods, the fungal strains, or the cultivation parameters [41,42,43].
The amino acid CS and EAAI (Figure 1) indicate that PEK has the most favorable amino acid composition among the different ingredients tested in this trial. Methionine and lysine are the major limiting amino acids in salmonid feeds [44]. The lower chemical score of methionine for all tested ingredients indicates a major drawback when using these fungal proteins to replace fish meal and soy, as it limits their use at higher inclusion levels in diets for rainbow trout. Karimi et al. [27] observed that the methionine composition of the multicellular fungi derived from pure cultures was lower than that of fish meal, although the CS and EAAI were not calculated. For PEK, the CS of lysine is above 100, indicating higher lysine composition in its crude protein compared with fish meal. The chemical score for lysine is below 50% for RO, indicating that lysine could be a limiting amino acid. Karimi et al. [27] observed that the lysine levels of the multicellular fungi grown on pure streams were the about the same as those of fish meal. The EAAI value of SBM, when fish meal was used as a reference diet, was 93%, which is almost the same as described in an earlier study by Agboola et al. [12]. However, in that study, the tested ingredients had higher EAAI values, ranging from 67 to 79, compared to the lower range of 30 to 63 observed in this study. This would indicate that, compared with multicellular fungi, yeasts might have an amino acid composition that is better suited for salmonids. However, filamentous fungi can still be advantageous compared to single-celled fungi, owing to their crude protein content and the ease with which they can be separated from their culture medium on a large scale. The deficiency of the amino acids in commercial feeds can be counteracted by adding synthetic amino acids at an additional cost. However, the amino acid composition and content in fungi can be altered to a degree through substrate optimization [45,46,47]. Theoretically, it is possible to develop multicellular fungi with improved methionine content, thus enhancing their potential inclusion levels in fish feed without compromising nutritional quality.
Hardy et al. [48] defined an ingredient as protein-rich if it contains more than 35% crude protein content. Rainbow trout diets require a digestible protein content of 38% [48]. Hence, ingredients added as protein sources need to have a protein content significantly higher than that, due to the presence of other ingredients that might not have a high enough protein content and may have other roles in the feed. The ingredients used in this experiment have protein contents in the range of 44 to 66.8%. PEKILO® has a crude protein content of 66.8%. This is much higher than the crude protein content of the other alternative feed ingredients, such as multicellular fungi, which have a crude protein content of around 51% [9]. Yeast biomass contains crude protein contents ranging from 40 to 55% [12], while commonly used feed ingredients such as fish meal and soy protein concentrate have protein contents ranging from around 62% to 70% (NRC 2011). The fat content of the ingredient is not a major concern, as the necessary fats are typically added later in the form of oils. However, fats can influence the extrusion process. The physical quality of novel aquafeed ingredients is of high importance for successful extrusion, since it affects the feed’s ability to maintain its shape, texture, and nutritional quality during processing. Ingredients that do not meet physical quality standards can lead to issues such as poor pellet durability, inconsistent feeding behavior, and nutrient leaching [19,49].
As natural lubricants, high fat levels can cause instability during extrusion [50,51], making it important to keep their concentrations as low as possible. Except for AO, which has 12.46% fat, all of the other ingredients have relatively low fat contents. This is also reflected in the expansion rate, where AO has a significantly lower expansion rate (%) during extrusion compared with the control and PEK diet pellets.
High water stability is preferred in rainbow trout feeds, as low feed stability, combined with certain environmental factors, can lead to issues like oil belching and abdominal distention syndrome [20,21,22]. The water stability of a diet is influenced by the composition of its ingredients [20,52]. Among the tested diets, the one containing PEK showed the highest water stability, as well as the highest ADCP. This finding aligns with those of previous studies, which suggest that increased feed stability is associated with higher ADCP and ADCF [22].
The water stability index (WSI) of PEK was not statistically different from that of the control diet, even after 60 min of exposure, which can be considered to be a positive outcome. This minimizes the risk of the digestibility-related issues mentioned above and suggests that the feed is more likely to remain intact when consumed by the fish. Additionally, Hooft et al. [23] observed that including the microbial ingredient PEKILO® enhanced the water stability. However, in our study, the inclusion of microbial ingredients actually reduced the feed stability. One possible explanation for this discrepancy could be the differences in inclusion levels and ingredient composition. Since the diets in our study were formulated using a 70:30 formula, the levels of starch, which is an important binding agent, may have varied, affecting the overall stability of the feed.
The digestibility of dietary dry matter ADDM (Table 6) was significantly higher in the control than in the other diets. PEK had the second-highest, whereas AO, RD, and RO had statistically the same ADDM. The ingredient dry matter ADDM (Table 5) of RD and RO was 23.6% and 24.1%, respectively. This lower digestibility may be attributed to the presence of indigestible components such as cell walls in the microbial biomass, or to residual substrates from the fermentation process [53,54]. At the same time, feces collection through stripping may lead to an underestimation of AD [55]. Previous studies have shown that the method of feces collection may lead to under- or overestimation of AD [55,56]. In addition, repeated handling has been shown to depress the feed intake and growth in rainbow trout [57], and this may raise concerns in relation to the potential effects on digestibility. However, despite this, the ADCP for the control diet in our study was found to be 91.2%, which is in agreement with other studies in salmonids, where fish-meal-based diets’ digestibility usually ranged from 82.7 to 92.1% [16,39,54]. The digestibility of proteins can be negatively affected by cell walls present in fungi [12,58,59]. The sum of the crude protein, crude fat, and ash contents for AO, RO, RD, and PEK was 642, 537, 638, and 802 g/kg DM, respectively. This indicates that the carbohydrate fractions, and possibly the fiber fractions, of AO, RO, and RD are much higher. This is further supported by the lower pellet expansion in the diets with RO, RD, and AO. Hansen et al. [60] have observed that expansion decreased with the increase in non-soluble polysaccharide (NSP) inclusion. This could be one of the reasons for the differing protein digestibility among the different multicellular fungi observed in the present trial. Further studies on the cell wall composition could shed light on any possible correlations.
Comparing the ADAA for methionine and lysine (Table 5), PEK demonstrated better quality compared to the other tested ingredients. A higher AD reflects a greater amino acid absorption, reducing the proportion that is excreted undigested and enhancing nutrient utilization. The ADCP varies among diets, likely due to differences between species, but also in substrate composition, extraction methods, or cultivation parameters. The composition of fungal cell walls is highly dynamic and is influenced by environmental conditions and processing methods. Factors such as temperature, pH, osmotic pressure, and nutrient availability affect the cell wall structure, enzyme activities, and digestibility [61,62,63,64,65]. These parameters regulate the biosynthesis of key polysaccharides (e.g., chitin, β-glucans, α-glucans) and the expression of remodeling enzymes, impacting fungal growth and downstream applications in biotechnology and feed production. Adjusting the fermentation strategies and environmental conditions can modify the fungal structure and potentially enhance digestibility. Studies on various yeast species have reported ADDM values ranging from 38% to 53% [66]. Similarly, the ADCP values in the same research ranged between 63% and 73%, which are comparable to the ADCP values observed for AO, RO, and RD in this study, but lower than that of PEK. In salmonids, the ADCP of inactivated yeast generally falls within the range of 51% to 91% [16,67,68], aligning with the findings of the present study. Improvements in downstream processing have also been shown to enhance ADCP [68].
P. variotii, a fungus produced from sour lye, which is a byproduct of textile cellulose production, has shown ADDM values between 51.5% and 66% in previous studies. The same research reported ADCP values ranging from 82.6% to 88.4% and ADCF values between 72.8% and 99.8% [40]. These results are consistent with the findings for PEKILO® in the current study, indicating a potential similarity between the ingredients despite differences in their substrate origins.
5. Conclusions

In essence, our overall results indicate that PEK is a promising candidate among the microbial ingredients tested here and merits further investigation as a novel feed ingredient for rainbow trout. Its high crude protein content, excellent digestibility, and capacity to promote feed intake highlight its potential for commercial use. Additionally, PEK has already been produced at scale and approved by the European Food Safety Authority (EFSA) for use in animal feed. However, one potential limitation is its lower chemical score for methionine, a limiting amino acid. This deficiency could pose challenges in formulating a balanced diet and may restrict its application as a protein source at high inclusion levels. Future research should focus on conducting growth trials at varying inclusion levels to determine the maximum inclusion rate that supports optimal growth and health performance without adverse effects. Additional considerations should include assessing the environmental footprint and resource use during the production of PEK, through Life Cycle Assessment (LCA).

Supplementary Materials

The following supporting information can be downloaded at https://www.mdpi.com/article/10.3390/fishes10040149/s1: Supplementary Table S1: Extruder parameters during the production of the experimental diets containing the different test ingredients. Extruder: Lab-Compounder KETSE 20/40 twin-screw extruder (Anton Paar TorqueTec (Brabender) GmbH, Duisburg, Germany); Supplementary Table S2: Mortality of the fishes, along with the tank numbers.

Author Contributions

Conceptualization, A.G., with assistance from A.V., K.B., T.L. and M.Ø.; software, A.G.; formal analysis, A.G.; investigation, A.G., with assistance from A.V.; resources, K.B., S.K., T.L., M.J.T., M.L. and S.K.; data curation, A.G.; writing—original draft preparation, A.G. and A.V.; writing—review and editing, A.G., A.V., K.B., T.L., M.Ø., M.J.T. and S.K.; visualization, A.G.; supervision, K.B., A.V., M.Ø. and T.L.; project administration, A.V. and K.B.; funding acquisition, K.B., A.V., T.L. and M.L. All authors have read and agreed to the published version of the manuscript.

Funding

This work was supported by the NORDICFEED project ’Biokonvertering av bioresurser’ (project number: 24931000) funded by FORMAS and NORDFORSK, ‘Fish from Ethanol residues-environmentally friendly feed for future farmed fish’ (grant number 20200097) funded by the Kamprad Family Foundation, and the ForestFeed project ‘En nordisk blågrön värdekedja från skog till fiskfilé’ (Project number: 2023-00132) funded by VINNOVA.

Institutional Review Board Statement

The animal study protocol was approved by the Institutional Review Board (or Ethics Committee) of the Swedish Board of Agriculture (5.8.18–16,347/2017) for studies involving animals.

Informed Consent Statement

Not applicable.

Data Availability Statement

Data can be made available upon request.

Acknowledgments

The authors would like to thank Eniferbio, Peuraniitty 5 B 25, 02750 Espoo, Finland. We would also like to thank the staff of the feed technology lab at SLU, especially Vilma Johansson, for their help in manufacturing the feeds, as well as Astrid Gumucio and the general laboratory staff at THV (SLU) for their help with analysis. A special thanks to the staff at Vattenbruk Centrum Norr AB, especially Mariana Backberg, for their support and help during the feeding stage of the trial. The authors express their appreciation to Millow AB and in particular Coralie Hellwig who contributed with solid-state fermentation. Finally, we thank the anonymous reviewers for their time and effort in improving the quality of this manuscript.

Conflicts of Interest

The authors declare no conflicts of interest. The funders had no role in the design of the study; in the collection, analyses, or interpretation of data; in the writing of the manuscript; or in the decision to publish the results.

Abbreviations

The following abbreviations are used in this manuscript:
ADCApparent digestibility coefficient
PEKPEKILO®
AOAspergillus oryzae
RORhizopus oligosporus
RDRhizopus delemar
DMDry matter
FCRFeed conversion ratio
ADApparent digestibility
CSChemical score
EAAIEssential amino acid index
ANOVAAnalysis of variance
ADCPCrude protein apparent digestibility
ADCFApparent digestibility for crude fat
ADAAApparent digestibility of amino acids
WSIWater stability index
SPCSoy protein concentrate
SBMSoybean meal
NSPNon-soluble polysaccharide
EFSAEuropean Food Safety Authority

References

  1. Bolt, J.; van Zanden, J.L. Maddison-style estimates of the evolution of the world economy: A new 2023 update. J. Econ. Surv. 2024, 38, 631–671. [Google Scholar] [CrossRef]
  2. Barange, M. The State of World Fisheries and Aquaculture—Sustainability in Action; FAO: Rome, Italy, 2020. [Google Scholar]
  3. Colombo, S.M.; Roy, K.; Mraz, J.; Wan, A.H.L.; Davies, S.J.; Tibbetts, S.M.; Overland, M.; Francis, D.S.; Rocker, M.M.; Gasco, L.; et al. Towards achieving circularity and sustainability in feeds for farmed blue foods. Rev. Aquac. 2022, 15, 1115–1141. [Google Scholar] [CrossRef]
  4. Gosling, S.N.; Arnell, N.W. A global assessment of the impact of climate change on water scarcity. Clim. Change 2016, 134, 371–385. [Google Scholar] [CrossRef]
  5. Froehlich, H.E.; Gentry, R.R.; Halpern, B.S. Global change in marine aquaculture production potential under climate change. Nat. Ecol. Evol. 2018, 2, 1745–1750. [Google Scholar] [CrossRef] [PubMed]
  6. Singh, A.; Vidakovic, A.; Hjertner, B.; Krikigianni, E.; Karnaouri, A.; Christakopoulos, P.; Rova, U.; Dicksved, J.; Baruah, K.; Lundh, T. Effects of dietary supplementation of lignocellulose-derived cello-oligosaccharides on growth performance, antioxidant capacity, immune response, and intestinal microbiota in rainbow trout (Oncorhynchus mykiss). Aquaculture 2024, 578, 740002. [Google Scholar] [CrossRef]
  7. Overland, M.; Skrede, A. Yeast derived from lignocellulosic biomass as a sustainable feed resource for use in aquaculture. J. Sci. Food Agric. 2017, 97, 733–742. [Google Scholar] [CrossRef]
  8. Chenebault, C.; Moscoviz, R.; Trably, E.; Escudié, R.; Percheron, B. Lactic acid production from food waste using a microbial consortium: Focus on key parameters for process upscaling and fermentation residues valorization. Bioresour. Technol. 2022, 354, 127230. [Google Scholar] [CrossRef]
  9. Karimi, S.; Agnihotri, S.; Ferreira, J.A.; Taherzadeh, M.J. Evaluating three fungal biomasses grown on diluted thin stillage as potential fish feed ingredients. Bioresour. Technol. Rep. 2023, 24, 101677. [Google Scholar] [CrossRef]
  10. FAO. The State of World Fisheries and Aquaculture 2022. Towards Blue Transformation; FAO: Rome, Italy, 2022. [Google Scholar]
  11. Tacon, A.G.J.; Metian, M. Feed Matters: Satisfying the Feed Demand of Aquaculture. Rev. Fish. Sci. Aquac. 2015, 23, 1–10. [Google Scholar] [CrossRef]
  12. Agboola, J.O.; Overland, M.; Skrede, A.; Hansen, J.O. Yeast as major protein-rich ingredient in aquafeeds: A review of the implications for aquaculture production. Rev. Aquac. 2021, 13, 949–970. [Google Scholar] [CrossRef]
  13. Hassan, S.M. Soybean, Nutrition and Health. In Soybean—Bio-Active Compounds; El-Shemy, H.A., Ed.; IntechOpen: London, UK, 2013; pp. 453–472. [Google Scholar] [CrossRef]
  14. Grieshop, C.M.; Fahey, G.C. Comparison of quality characteristics of soybeans from Brazil, China, and the United States. J. Agric. Food Chem. 2001, 49, 2669–2673. [Google Scholar] [CrossRef] [PubMed]
  15. Van Immerseel, F.; Eeckhaut, V.; Moore, R.J.; Choct, M.; Ducatelle, R. Beneficial microbial signals from alternative feed ingredients: A way to improve sustainability of broiler production? Microb. Biotechnol. 2017, 10, 1008–1011. [Google Scholar] [CrossRef]
  16. Langeland, M.; Vidakovic, A.; Vielma, J.; Lindberg, J.E.; Kiessling, A.; Lundh, T. Digestibility of microbial and mussel meal for Arctic charr (Salvelinus alpinus) and Eurasian perch (Perca fluviatilis). Aquac. Nutr. 2016, 22, 485–495. [Google Scholar] [CrossRef]
  17. Overland, M.; Karlsson, A.; Mydland, L.T.; Romarheim, O.H.; Skrede, A. Evaluation of Candida utilis, Kluyveromyces marxianus, and Saccharomyces cerevisiae yeasts as protein sources in diets for Atlantic salmon (Salmo salar). Aquaculture 2013, 402, 1–7. [Google Scholar] [CrossRef]
  18. Rocha, S.D.C.; Lei, P.; Morales-Lange, B.; Mydland, L.T.; Overland, M. From a cell model to a fish trial: Immunomodulatory effects of heat-killed Lactiplantibacillus plantarum as a functional ingredient in aquafeeds for salmonids. Front. Immunol. 2023, 14, 1125702. [Google Scholar] [CrossRef]
  19. Sharma, S.; Hansen, L.D.; Hansen, J.O.; Mydland, L.T.; Horn, S.J.; Overland, M.; Eijsink, V.G.H.; Vuoristo, K.S. Microbial Protein Produced from Brown Seaweed and Spruce Wood as a Feed Ingredient. J. Agric. Food Chem. 2018, 66, 8328–8335. [Google Scholar] [CrossRef]
  20. Sorensen, M. A review of the effects of ingredient composition and processing conditions on the physical qualities of extruded high-energy fish feed as measured by prevailing methods. Aquac. Nutr. 2012, 18, 233–248. [Google Scholar]
  21. Aas, T.S.; Terjesen, B.F.; Sigholt, T.; Hillestad, M.; Holm, J.; Refstie, S.; Baeverfjord, G.; Rorvik, K.A.; Sorensen, M.; Oehme, M.; et al. Nutritional responses in rainbow trout (Oncorhynchus mykiss) fed diets with different physical qualities at stable or variable environmental conditions. Aquac. Nutr. 2011, 17, 657–670. [Google Scholar] [CrossRef]
  22. Grete Baeverfjord, S.R. Per Krogedal and Torbjørn Åsgård Low feed pellet water stability and fluctuating water salinity cause separation and accumulation of dietary oil in the stomach of rainbow trout (Oncorhynchus mykiss). Aquaculture 2006, 261, 11. [Google Scholar]
  23. Hooft, J.M.; Montero, R.; Morales-Lange, B.; Blihovde, V.F.; Purushothaman, K.; Press, C.M.; Mensah, D.D.; Agboola, J.O.; Javed, S.; Mydland, L.T.; et al. Paecilomyces variotii (PEKILO ®) in novel feeds for Atlantic salmon: Effects on pellet quality, growth performance, gut health, and nutrient digestibility and utilization. Aquaculture 2024, 589, 740905. [Google Scholar] [CrossRef]
  24. Ferreira, J.A.; Lennartsson, P.R.; Niklasson, C.; Lundin, M.; Edebo, L.; Taherzadeh, M.J. Spent Sulphite Liquor for Cultivation of an Edible Rhizopus Sp. Bioresources 2012, 7, 173–188. [Google Scholar]
  25. Ferreira, J.A.; Lennartsson, P.R.; Taherzadeh, M.J. Correction: Production of Ethanol and Biomass from Thin Stillage Using Food-Grade Zygomycetes and Ascomycetes Filamentous Fungi. Energies 2014, 7, 3872–3885. Energies 2014, 7, 4199–4201. [Google Scholar] [CrossRef]
  26. Rasmussen, M.L.; Khanal, S.K.; Pometto, A.L.; van Leeuwen, J. Water reclamation and value-added animal feed from corn-ethanol stillage by fungal processing. Bioresour. Technol. 2014, 151, 284–290. [Google Scholar] [CrossRef] [PubMed]
  27. Karimi, S.; Soofiani, N.M.; Mahboubi, A.; Ferreira, J.A.; Lundh, T.; Kiessling, A.; Taherzadeh, M.J. Evaluation of Nutritional Composition of Pure Filamentous Fungal Biomass as a Novel Ingredient for Fish Feed. Fermentation 2021, 7, 152. [Google Scholar] [CrossRef]
  28. Krogdahl, A.; Sundby, A.; Olli, J.J. Atlantic salmon (Salmo salar) and rainbow trout (Oncorhynchus mykiss) digest and metabolize nutrients differently: Effects of water salinity and dietary starch level. Aquaculture 2004, 229, 335–360. [Google Scholar] [CrossRef]
  29. Cho, E.Y.; Slinger, S.L. Apparent Digestibility Measurement in Foodstuff for Rainbow Trout. In World Symposium on Fin Fish Nutrition and Fish Feed Technology; Halver, J.O., Tiews, K., Eds.; Heeneman: Berlin, Germany, 1979; pp. 239–247. [Google Scholar]
  30. Austreng, E. Digestibility Determination in Fish Using Chromic Oxide Marking and Analysis of Contents from Different Segments of Gastrointestinal-Tract. Aquaculture 1978, 13, 265–272. [Google Scholar] [CrossRef]
  31. Analysis, N.C.o.F. Nitrogen. Determination in foods and feeds according to Kjeldahl. 1976. Available online: https://scholar.google.com/scholar_lookup?title=Nitrogen.%20Determination%20in%20foods%20and%20feeds%20according%20to%20Kjeldahl&author=Nordic%20Committee%20on%20Food&publication_year=1976 (accessed on 3 February 2025).
  32. Communities, O.J.o.t.E. Determination of crude oils and fat. Method B. 1984. Available online: https://scholar.google.com/scholar_lookup?title=Determination%20of%20Crude%20Oils%20and%20Fat.%20Method%20B&author=Official%20Journal%20of%20the%20European%20Communities&publication_year=1984 (accessed on 3 February 2025).
  33. Short, F.J.; Gorton, P.; Wiseman, J.; Boorman, K.N. Determination of titanium dioxide added as an inert marker in chicken digestibility studies. Anim. Feed Sci. Technol. 1996, 59, 215–221. [Google Scholar] [CrossRef]
  34. Bureau, D.P.; Harris, A.M.; Cho, C.Y. Apparent digestibility of rendered animal protein ingredients for rainbow trout (Oncorhynchus mykiss). Aquaculture 1999, 180, 345–358. [Google Scholar] [CrossRef]
  35. Mitchell, H.H.; Block, R.J. Some Relationships between the Amino Acid Contents of Proteins and Their Nutritive Values for the Rat. J. Biol. Chem. 1946, 163, 599–620. [Google Scholar]
  36. Teun Veldkamp, G.B. Insects: A protein-rich feed ingredient in pig and poultry diets. Anim. Front. 2015, 5, 45–50. [Google Scholar]
  37. Oser, B.L. Method for Integrating Essential Amino Acid Content in the Nutritional Evaluation of Protein. J. Am. Diet. Assoc. 1951, 27, 396–402. [Google Scholar] [CrossRef]
  38. International Aquaculture Feed Formulation Database (IAFFD). Available online: https://www.iaffd.com (accessed on 3 February 2025).
  39. Vidakovic, A.; Huyben, D.; Sundh, H.; Nyman, A.; Vielma, J.; Passoth, V.; Kiessling, A.; Lundh, T. Growth performance, nutrient digestibility and intestinal morphology of rainbow trout (Oncorhynchus mykiss) fed graded levels of the yeasts Saccharomyces cerevisiae and Wickerhamomyces anomalus. Aquac. Nutr. 2020, 26, 275–286. [Google Scholar] [CrossRef]
  40. Dahlberg, A. Filamentous fungus Paecilomyces variotii in Feed for Rainbow trout (Oncorhynchus mykiss); Swedish University of Agricultural Sciences: Uppsala, Sweden, 2019. [Google Scholar]
  41. Aswathy, S.; Shyamalagowri, S.; Hari, S.; Kanimozhi, M.; Meenambiga, S.S.; Thenmozhi, M.; Karthiyayini, R.; Suresh, D.; Manjunathan, J. Comparative studies on the cultivation, yield, and nutritive value of an edible mushroom, Pleurotus tuber-regium (Rumph. ex Fr.) Singer, grown under different agro waste substrates. 3 Biotech 2024, 14, 123. [Google Scholar] [CrossRef]
  42. Coman, G.; Leustean, I.; Georgescu, L.; Bahrim, G. Optimization of Protein Production by Geotrichum candidum Miug 2.15 by Cultivation on Paper Residues, Using Response Surface Methodology. Bioresources 2012, 7, 5290–5303. [Google Scholar]
  43. Maseko, K.H.; Regnier, T.; Wokadala, O.C.; Bartels, P.; Meiring, B. Effect of Culture Media on the Yield and Protein Content of Pleurotus ostreatus (Jacq.) Kumm Mycelia. Int. J. Food Sci. 2024, 2024, 5562732. [Google Scholar] [CrossRef] [PubMed]
  44. Nunes, A.J.P.; Sá, M.V.C.; Browdy, C.L.; Vazquez-Anon, M. Practical supplementation of shrimp and fish feeds with crystalline amino acids. Aquaculture 2014, 431, 20–27. [Google Scholar] [CrossRef]
  45. Gmoser, R.; Ferreira, A.J.; Lennartsson, P.R.; Taherzadeh, M.J. Filamentous ascomycetes fungi as a source of natural pigments. Fungal Biol. Biotechnol. 2017, 4, 4. [Google Scholar] [CrossRef]
  46. Lübeck, M.; Lübeck, P.S. Fungal Cell Factories for Efficient and Sustainable Production of Proteins and Peptides. Microorganisms 2022, 10, 753. [Google Scholar] [CrossRef]
  47. Rao, M.; Varma, A.J.; Deshmukh, S.S. Production of Single Cell Protein, Essential Amino Acids, and Xylanase By Penicillium janthinellum. Bioresources 2010, 5, 2470–2477. [Google Scholar]
  48. NRC. Nutrient Requirements of Fish and Shrimp; National Academies Press: Washington, DC, USA, 2011. [Google Scholar]
  49. Glencross, B.D. A feed is only as good as its ingredients: An update on the nutritional research strategies for the optimal evaluation of ingredients for aquaculture feeds. Aquac. Nutr. 2020, 26, 1871–1883. [Google Scholar] [CrossRef]
  50. Morken, T.; Kraugerud, O.F.; Sorensen, M.; Storebakken, T.; Hillestad, M.; Christiansen, R.; Overland, M. Effects of feed processing conditions and acid salts on nutrient digestibility and physical quality of soy-based diets for Atlantic salmon (Salmo salar). Aquac. Nutr. 2012, 18, 21–34. [Google Scholar] [CrossRef]
  51. Cavalcanti, W.B.; Behnke, K.C. Effect of composition of feed model systems on pellet quality: A mixture experimental approach. II. Cereal Chem. 2005, 82, 462–467. [Google Scholar] [CrossRef]
  52. Behnke, K.C. Feed manufacturing technology: Current issues and challenges. Anim. Feed Sci. Technol. 1996, 62, 49–57. [Google Scholar] [CrossRef]
  53. Li, M.H.H.; Oberle, D.F.; Lucas, P.M. Apparent digestibility of alternative plant-protein feedstuffs for channel catfish, Ictalurus punctatus (Rafinesque). Aquac. Res. 2013, 44, 282–288. [Google Scholar] [CrossRef]
  54. Gong, Y.; Guterres, H.A.D.S.; Huntley, M.; Sorensen, M.; Kiron, V. Digestibility of the defatted microalgae Nannochloropsis sp. and Desmodesmus sp. and when fed to Atlantic salmon, Salmo salar. Aquac. Nutr. 2018, 24, 56–64. [Google Scholar] [CrossRef]
  55. Vandenberg, G.W.; De la Noüe, J. Apparent digestibility comparison in rainbow trout (Oncorhynchus mykiss) assessed using three methods of faeces collection and three digestibility markers. Aquac. Nutr. 2001, 7, 237–245. [Google Scholar] [CrossRef]
  56. Hajen, W.E.; Higgs, D.A.; Beames, R.M.; Dosanjh, B.S. Digestibility of Various Feedstuffs by Post-Juvenile Chinook Salmon (Oncorhynchus-Tshawytscha) in Sea-Water. 2. Measurement of Digestibility. Aquaculture 1993, 112, 333–348. [Google Scholar] [CrossRef]
  57. Hoskonen, P.; Pirhonen, J. Effects of repeated handling, with or without anaesthesia, on feed intake and growth in juvenile rainbow trout, Oncorhynchus mykiss (Walbaum). Aquac. Res. 2006, 37, 409–415. [Google Scholar] [CrossRef]
  58. Irvin, S.; Blyth, D.; Bourne, N.; Glencross, B. A study of the discrete and interactive effects of different polysaccharides on the digestibility of diets fed to barramundi (Lates calcarifer). Aquac. Nutr. 2016, 22, 1047–1054. [Google Scholar] [CrossRef]
  59. Glencross, B.D.; Huyben, D.; Schrama, J.W. The Application of Single-Cell Ingredients in Aquaculture Feeds—A Review. Fishes 2020, 5, 22. [Google Scholar] [CrossRef]
  60. Hansen, J.O.; Storebakken, T. Effects of dietary cellulose level on pellet quality and nutrient digestibilities in rainbow trout (Oncorhynchus mykiss). Aquaculture 2007, 272, 458–465. [Google Scholar] [CrossRef]
  61. Yoshimi, A.; Miyazawa, K.; Abe, K. Cell wall structure and biogenesis in Aspergillus species. Biosci. Biotechnol. Biochem. 2016, 80, 1700–1711. [Google Scholar] [CrossRef]
  62. Malavazi, I.; Goldman, G.H.; Brown, N.A. The importance of connections between the cell wall integrity pathway and the unfolded protein response in filamentous fungi. Brief. Funct. Genom. 2014, 13, 456–470. [Google Scholar] [CrossRef]
  63. Guerriero, G.; Silvestrini, L.; Obersriebnig, M.; Salerno, M.; Pum, D.; Strauss, J. Sensitivity of Aspergillus nidulans to the Cellulose Synthase Inhibitor Dichlobenil: Insights from Wall-Related Genes’ Expression and Ultrastructural Hyphal Morphologies. PLoS ONE 2013, 8, 38. [Google Scholar] [CrossRef]
  64. Colin, V.L.; Baigoríi, M.D.; Pera, L.M. Tailoring fungal morphology of Aspergillus niger MYA 135 by altering the hyphal morphology and the conidia adhesion capacity: Biotechnological applications. AMB Express 2013, 3, 27. [Google Scholar] [CrossRef]
  65. Gow, N.A.R.; Latge, J.P.; Munro, C.A. The Fungal Cell Wall: Structure, Biosynthesis, and Function. Microbiol. Spectr. 2017, 5, 1–25. [Google Scholar] [CrossRef]
  66. Agboola, J.O.; Lapeña, D.; Overland, M.; Arntzen, M.O.; Mydland, L.T.; Hansen, J.O. Yeast as a novel protein source- Effect of species and autolysis on protein and amino acid digestibility in Atlantic salmon (Salmo salar). Aquaculture 2022, 546, 737312. [Google Scholar] [CrossRef]
  67. Cheng, Z.J.; Hardy, R.W.; Huige, N.J. Apparent digestibility coefficients of nutrients in brewer’s and rendered animal by-products for rainbow trout (Oncorhynchus mykiss (Walbaum)). Aquac. Res. 2004, 35, 1–9. [Google Scholar] [CrossRef]
  68. Hansen, J.O.; Lagos, L.; Lei, P.; Reveco-Urzua, F.E.; Morales-Lange, B.; Hansen, L.D.; Schiavone, M.; Mydland, L.T.; Arntzen, M.O.; Mercado, L.; et al. Down-stream processing of baker’s yeast (Saccharomyces cerevisiae)—Effect on nutrient digestibility and immune response in Atlantic salmon (Salmo salar). Aquaculture 2021, 530, 735707. [Google Scholar] [CrossRef]
Figure 1. Radar chart showing the amino acid chemical scores (CSs) for the different filamentous fungi compared to fish meal (FM). The value for fish meal was obtained from the ‘Feed Ingredient Composition Database (FICD) v10.0 https://app.iaffd.com/ficd (accessed on 25 October 2024) [38]. The results are presented as percentages of amino acid content of crude protein in the test ingredient compared with the amino acid content of crude protein in the fish meal. A score of 100 would indicate that the amino acid content in the ingredient is the same as the amino acid content in fish meal. The scale is in multiples of 20, ranging from 0 to 120.
Fishes 10 00149 g001
Figure 2. Essential amino acid index (EAAI) of the different filamentous fungi species for rainbow trout observed in this trial compared to fish meal (FM), considered as the reference protein for both Atlantic salmon and rainbow trout. The values for fish meal (FM), soy protein concentrate (SPC), and soy bean meal (SBM) are taken from the IAFFD database—‘Feed Ingredient Composition Database (FICD) v10.0 https://app.iaffd.com/ficd (accessed on 25 October 2024) [38]. PEK—PEKILO®, AO—A. oryzae, RO—R. oligosporus and RD—R. delemar.
Fishes 10 00149 g002
Figure 3. The water stability index (%) of the different diets at various timepoints. CTRL—control, PEK—PEKILO®, AO—A. oryzae, RO—R. oligosporus, and RD—R. delemar.
Fishes 10 00149 g003
Table 1. Feed composition of the control and the test diets. All units are expressed in g/kg on a DM basis. Titanium dioxide was used as an inert marker for digestibility calculations.
Diets 1
ControlPEKAORORD
Fish meal 2400280280280280
Soy protein concentrate 310070707070
Wheat gluten 411077777777
Wheat meal 5200140140140140
Pot starch 6107777
Fish oil 7159111111111111
Vitamin mineral premix 8107777
PEK 300
AO 300
RO 300
RD 300
Monocalcium phosphate 9107777
Titanium dioxide11111
Total10001000100010001000
1 PEK—PEKILO®, AO—A. oryzae, RO—R. oligosporus, and RD—R. delemar. 2 Group 1 fish meal, Pelagia, Bergen, Norway. 3 HP310, Hamlet Protein A/S, Horsens, Denmark. 4 Repal GL21, Lantmännen Reppe AB, Lidköping, Sweden. 5 Wheatmeal standard, Axfood AB, Sweden. 6 Potatismjöl, Axfood AB, Sweden. 7 Fish oil herring, AB Salmonfarm Oy, Kasnäs, Finland. 8 Per kg of premix: Vit A 2,266,667 IU/kg, Vit D3 1,000,000 IU/kg, menadione 6667 mg/kg, thiamine 6000 mg/kg, riboflavin 8667 mg/kg, pantothenic acid 26,667 mg/kg, pyridoxine 5667 mg/kg, Vit B12 20,000 μg/kg, nicotinic acid 50,000 mg/kg, folic acid 3333 mg/kg, biotin 263,667 μg/kg, Vit C 90,000 mg/kg, inositol 165,000 mg/kg, zinc 25,000 mg/kg, iodine 1067 mg/kg, copper 1318 mg/kg, manganese 1640 mg/kg, citric acid 180 mg/k, BHT 536 mg/kg, BHA 256 mg/kg. 9 MCP—Monocalcium phosphate, Aako, Leusden, the Netherlands.
Table 2. Proximate composition (g/kg DM), energy (MJ/kg DM), and amino acid (g/kg DM) content of the microbial ingredients.
PEKAORORD
Dry matter %94.292.895.695.9
Ash content93761684
Crude protein668441487493
Gross energy 21.322.321.721.5
Crude fat411253461
Essential amino acids
Arginine26.815.416.716.2
Histidine9.78.99.110.7
Isoleucine19.016.416.616.0
Leucine33.728.430.126.5
Lysine29.120.913.423.1
Methionine9.86.67.66.6
Phenylalanine20.916.218.416.3
Threonine18.816.41517.1
Valine21.520.119.919.2
Non-essential amino acids
Alanine26.720.420.119.4
Aspartic acid40.128.129.732.8
Cysteine + Cystine5.54.39.45.8
Glutamic acid82.354.9101.058.3
Glycine25.317.716.616.6
Proline25.327.231.233.5
Table 3. Proximate composition (g/kg DM), energy (MJ/kg DM), and amino acid content (g/kg DM) of the experimental diets. All units are in g/kg DM unless stated otherwise.
Diets 1
ControlPEKAORORD
Dry matter %93.493.193.694.192.6
Ash content 68.6118.066.754.670.3
Crude protein500.9538.8469.0474.9486.9
Gross energy 23.722.222.422.121.6
Fat content197.2150.0219.6206.7196.9
Essential amino acids
Arginine25.926.822.523.822.7
Histidine9.69.79.49.59.7
Isoleucine16.719.016.816.216.1
Leucine31.333.730.430.129.4
Lysine24.329.123.120.822.4
Methionine9.59.88.78.88.2
Phenylalanine18.420.917.317.917.4
Threonine16.718.815.815.916.2
Valine19.921.520.019.118.8
Non-essential amino acids
Alanine22.626.721.621.120.9
Aspartic acid34.240.131.131.932.1
Cysteine + Cystine5.95.54.76.45.2
Glutamic acid86.282.374.787.375.5
Glycine23.425.321.420.820.6
Proline28.425.324.928.128.7
Serine20.521.918.219.719.2
1 PEK—PEKILO®, AO—A. oryzae, RO—R. oligosporus, and RD—R. delemar.
Table 4. The corrected FCR, weight gain % (WG), SGR (%/day), and feed intake (g/tank) for different diets and the control. The novel ingredients in the different diets are PEK—PEKILO®, AO—Aspergillus oryzae, RD—Rhizopus delemar, RO—Rhizopus oligosporus, and Control—control diet.
ControlPEKAORORDPooled SEM 1p-Value 2
WG (%)95.5109.7101.696.9110.79.0670.3638
Corrected FCR0.8 b0.8 ab0.9 ab1.0 a0.9 ab0.05130.0257
SGR (%/day)1.521.681.591.541.690.10140.3618
Feed intake (g/tank)948.971090.131134.80997.101081.67105.30.4387
1 Pooled standard error of the mean, 2 Significance of one-way ANOVA. Values in the same row with different superscripts indicate significant differences as determined by Tukey’s multiple comparison test (p ≤ 0.05).
Table 5. Apparent digestibility (AD%) of the different ingredients. PEK—PEKILO®, AO—Aspergillus oryzae, RD—Rhizopus delemar, RO—Rhizopus oligosporus, and Control—control diet.
PEKAORORDPooled SEM 1p-Value 2
Dry matter59.3 a31.3 b24.1 b23.6 b6.3460.0003
Crude protein86.5 a56.5 c71.0 b44.9 d2.041<0.0001
Crude fat87.483.888.590.54.967<0.0001
Essential amino acids
Arginine93.9 a78.3 b72.4 bc68.9 c2.482<0.0001
Histidine92.0 a66.6 b54.2 c54.3 c3.323<0.0001
Isoleucine90.5 a67.6 b52.2 c50.7 c3.501<0.0001
Leucine91.1 a69.3 b57.4 c54.8 c3.458<0.0001
Lysine93.8 a74.1 b56.7 c58.1 c3.413<0.0001
Methionine91.5 a69.7 b61.8 bc55.3 c3.902<0.0001
Threonine88.4 a58.0 b52.0 b46.5 b5.0040.0001
Valine89.7 a67.7 b50.6 c49.5 c3.938<0.0001
Total AA90.5 a68.0 b57.2 b56.3 b3.692<0.0001
1 Pooled standard error of the mean. 2 Significance of one-way ANOVA. Values in the same row with different superscripts indicate significant differences as determined by Tukey’s multiple comparison test (p ≤ 0.05).
Table 6. Apparent digestibility (AD%) of the different diets. PEK—PEKILO®, AO—Aspergillus oryzae, RD—Rhizopus delemar, RO—Rhizopus oligosporus, and Control—control diet.
ControlPEKAORORDPooled SEM 1p-Value 2
Dry matter83.3 a76.0 b67.8 c65.2 c65.1 c1.698<0.0001
Crude protein91.2 a89.5 a81.3 b79.5 bc76.8 c0.4929<0.0001
Crude fat95.3 a94.3 ab93.1 b94.8 ab90.5 c0.7078<0.0001
Essential amino acids
Arginine96.4 a95.6 a91.5 b89.6 bc88.9 c0.6197<0.0001
Histidine92.4 a92.3 a84.8 b81.1 c81.0 c0.9101<0.0001
Isoleucine94.3 a93.0 a86.3 b81.9 c81.5 c0.9502<0.0001
Leucine94.9 a93.7 a87.4 b84.0 c83.4 c0.9121<0.0001
Lysine92.5 a93.0 a87.2 b82.9 c82.8 c0.8846<0.0001
Methionine93.8 a93.1 a87.0 b84.7 bc83.4 c1.002<0.0001
Threonine92.0 a90.8 a82.2 b80.4 b78.7 b1.346<0.0001
Valine94.1 a92.7 a86.1 b81.4 c81.2 c1.053<0.0001
Total amino acids93.6 a92.6 a86.3 b83.0 c82.9 c0.9763<0.0001
1 Pooled standard error of the mean. 2 Significance of one-way ANOVA. Values in the same row with different superscripts indicate significant differences as determined by Tukey’s multiple comparison test (p ≤ 0.05).
Table 7. Pellet width, expansion, and water stability index (WSI %) of the different diets. PEK—PEKILO®, AO—A. oryzae, RO—R. oligosporus, and RD—R. delemar.
Pellet Quality ParameterControlPEKAORORDPooled SEM 1p-Value 2
Pellet width (mm)2.8 a2.6 b2.3 c2.3 c2.1 d0.05<0.0001
Expansion (%)37.8 a29.0 b13.4 c17.0 c4.0 d2.42<0.0001
WSI (%) 30 min92.1 a89.6 ab84.9 ab82.6 b86.1 ab2.73<0.0001
WSI (%) 60 min89.0 a86.1 ab79.2 bc72.6 c77.7 c1.840.0030
WSI (%) 120 min82.9 a73.2 b63.5 c54.9 d65.3 bc4.630.0296
1 Pooled standard error of the mean. 2 Significance of one-way ANOVA. Values in the same row with different superscripts indicate significant differences as determined by Tukey’s multiple comparison test (p ≤ 0.05).
Disclaimer/Publisher’s Note: The statements, opinions and data contained in all publications are solely those of the individual author(s) and contributor(s) and not of MDPI and/or the editor(s). MDPI and/or the editor(s) disclaim responsibility for any injury to people or property resulting from any ideas, methods, instructions or products referred to in the content.