Article

An Inexpensive 3D Camera System Based on a Completely Synchronized Stereo Camera, Open-Source Software, and a Raspberry Pi for Accurate Fish Size, Position, and Swimming Speed

by
Ólavur av Fløtum Mittún
1,
Lars Emil Juel Andersen
2,
Morten Bo Søndergaard Svendsen
3 and
John Fleng Steffensen
1,*
1
Marine Biological Section, Department of Biology, University of Copenhagen, Strandpromenaden 5, DK-3000 Elsinore, Denmark
2
DTU-Aqua, National Institute of Aquatic Resources, Technical University of Denmark, Henrik Dams Alle, Bygn. 202, DK-2800 Kongens Lyngby, Denmark
3
DTU-Health-Tech, Department of Health Technology, Technical University of Denmark, Ørsteds Plads, Building 345C, DK-2800 Kongens Lyngby, Denmark
*
Author to whom correspondence should be addressed.
Fishes 2025, 10(4), 139; https://doi.org/10.3390/fishes10040139
Submission received: 31 December 2024 / Revised: 3 March 2025 / Accepted: 17 March 2025 / Published: 21 March 2025
(This article belongs to the Special Issue Technology for Fish and Fishery Monitoring)

Abstract

The visual underwater monitoring of fish size, position, and swimming speed is experiencing increasing interest in aquaculture and marine research. Despite the long-standing use of video monitoring, there is no methodological consensus, but numerous researchers and developers advocate for 3D video capture techniques to facilitate biometric estimations. Most of the previous systems, however, use partially synchronized cameras (within one frame), which causes an inherent error if observing moving fish in relation to the camera. This study proposes the use of a completely synchronized 3D camera system for underwater video capture, which can be calibrated, and which allows analyses to be performed using open-source software(s). We present data on the maximum theoretical error in the size estimation of swimming fish. This article presents a guide on how to build and set up the camera hardware and run the system, including a formal study investigating pre-measured lengths, and an informal study investigating the lengths of Atlantic cod (Gadus morhua).
Key Contribution: Description of a completely synchronized and inexpensive 3D camera system able to capture video and calculate fish size, swimming speed, and distance to nearest neighbor.

1. Introduction

The visual monitoring of fish and other aquatic organisms is becoming crucial for environmental management, aquaculture, commercial fisheries, and marine research [1,2]. Video-based measuring methods are widely accepted for their accuracy and are used extensively today [3,4]. The ability to identify and measure the size, swimming speed, and behavior of individual fish with minimal human interaction saves time and money, making further technological advancements imperative.
Traditional 2D cameras are commonly used for species identification and counting but are inadequate for precise length estimation due to the lack of depth information [5]. While it is possible to install pre-measured objects in the camera’s view to calibrate distances, this method can disrupt natural conditions and requires fish to pass at a specific distance [6]. In contrast, 3D reconstruction methods offer the opportunity to identify, count, track, and measure fish without invading the environment [7].
Several 3D vision systems, such as structured light, laser calipers, and stereovision, have been proposed to estimate fish sizes and positions [8,9,10]. Stereovision is the most commonly used, as it is valued for its simplicity and cost-effectiveness, and performs well underwater. However, issues such as limited field of view, hardware limitations, and camera synchronization persist [2,11]. Synchronization is critical, as even a single frame out of sync between the cameras will skew measurements [12,13].
Both authors and companies often state that they use synchronized camera setups; however, in practice, these cameras are rarely completely synchronized. Instead, they are typically partially synchronized only to the duration within a single frame [14,15]. Seeming small, this limitation can introduce errors of significant magnitude when analyzing videos of moving objects.
The duration of one frame period is the reciprocal of the recording frequency (1/fps). For standard frame rates of 25 Hz and 30 Hz, this corresponds to time gaps of up to 40 milliseconds (ms) and 33 ms, respectively. Even this small delay can lead to substantial errors when tracking fast-moving subjects. For example, consider a 0.4 m long fish swimming at 2.5 body lengths per second (bl/s) perpendicular to the stereo camera setup. This corresponds to a swimming speed of 1 m per second (m/s). If two images, assumed to be synchronized, are captured with a delay of 40 ms, the fish would have traveled 1 m/s × 0.04 s = 0.04 m. This displacement is 10% of the fish’s body length, introducing a significant error in the XY plane (Figure 1). The distance to the fish also interacts, creating a Z error affecting the position of the fish too. These errors can drastically affect measurements of object size, position, trajectory, velocity, and acceleration.
The impact on the Z-coordinate (distance from the camera) is equally concerning. If the fish’s motion aligns with the camera’s trigger sequence, the perceived distance can be erroneously underestimated by up to 10% when the fish moves in the same direction as the camera’s trigger sequence or overestimated by up to 10% when the fish moves opposite the camera’s trigger sequence (Figure 1). These depth estimation errors can compromise the accuracy of the 3D reconstruction’s and subsequent measurements, particularly in studies requiring high precision, such as biomechanics, behavioral analysis, and ecological monitoring.
Previously, with analog cameras, the only method to obtain completely synchronized videos was to use industrial cameras daisy-chained such that one acts as the master and the other as the slave, and the recording is triggered by a signal from the master. According to our knowledge, no handy cams or action cams have ever had the option of recording synchronization between units. With most digital cameras, there is no way to synchronize the cameras to anything more precisely than within one frame, e.g., by using clapping or light strobes. Bear in mind that this comes with an assumption that the frame rates of the cameras are exactly the same and constant.
Many who claim to use synchronized cameras actually rely on a strobe light for alignment. They synchronize video streams by identifying the flash in both recordings and matching them accordingly. However, the strobe lights used are often the same as those found on emergency marine beacons, fishing gear, or nighttime construction markers, each with varying flash periods. LED-based markers flash slowly, regular light bulb strobes flash even slower and may appear across multiple frames, while some xenon strobes are so fast that their flashes can occur between images, making them difficult to detect in the video. We tested the on-time of four different strobe lights with a regular Samsung S22 mobile phone recording in slow motion at 240 frames per second. The longest flash period was a New Star KS-68A Flash Light https://www.radiobuoy.com/webls-en-us/product-%E6%B5%B7%E7%87%88-strobe.html (Accessed on 18 March 2025) that slowly increased the intensity for about 70 ms, then was fully illuminated for about 140 ms, and then slowly decreased the intensity for about 170 ms = total 380 ms, equal to 9–10 frames if filming at 25 fps. A four-LED version of the KS-68A is KS-68 https://www.lindgren-pitman.com/products/strobe-light-2-d-cell-ks-l68-1 (Accessed on 18 March 2025), which has a much shorter flash time of only about 12 ms. The fastest, however, are the xenon types like the Leland Emergency Strobe Light https://www.bestglide.com/products/esl-i-emergency-strobe-light?_pos=1&_sid=aac7cb5c0&_ss=r (Accessed on 18 March 2025) and the ACR Electronics C-Strobe Model # 3355 https://www.marineelectronics.com/products/product/c-strobe--with-c-clip (Accessed on 18 March 2025) both with flash lengths of less than 4 ms.
This project aims to describe an inexpensive yet highly accurate, completely synchronized underwater 3D camera system for estimating various metrics. Our 3D camera system costs EUR 900, which is ten times cheaper than other similar systems (see the Supplementary Materials for specific hardware expenses). It consists of a stereo camera connected to a Raspberry Pi, housed in a waterproof case. The system connects to the network via an Ethernet cable and is controlled remotely from a computer. It is capable of recording and transferring synchronized videos for data analysis.

2. Materials and Methods

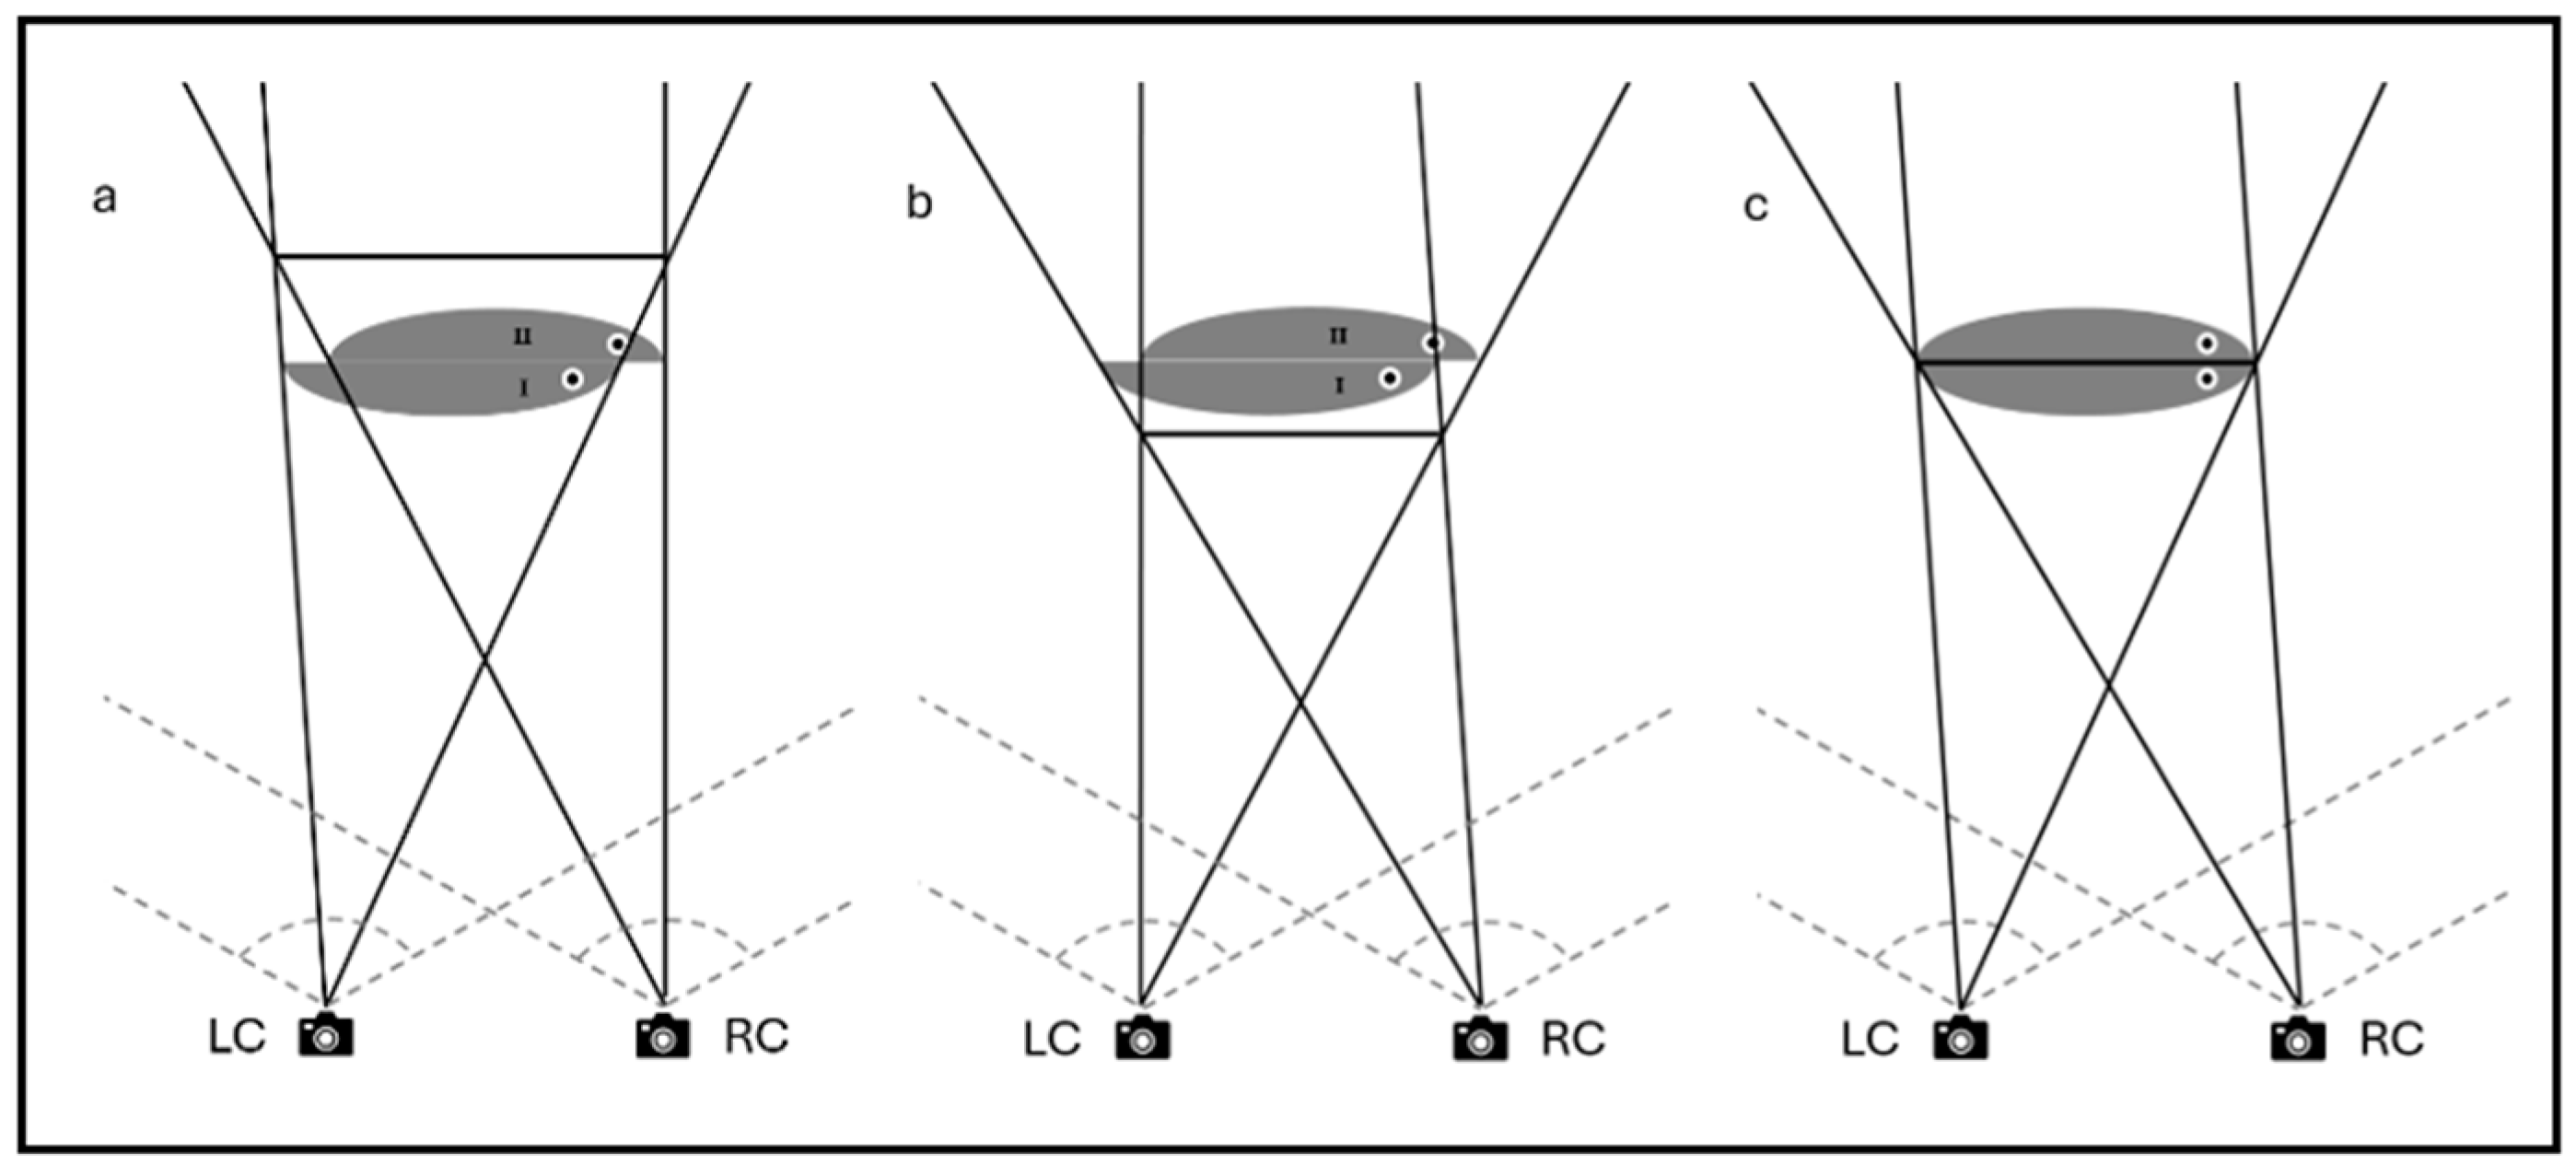
2.1. Principles of 3D Visualization and Calibration

The general principle of 3D stereo imaging involves using two cameras that capture synchronized images with an overlapping field of view from two slightly different perspectives. This allows for an estimation of the distance to objects or individuals, similar to human vision. When an object is identified in the image of both cameras, and the relative rotation and translation between the two cameras can be calculated, it becomes possible to estimate the objects or individual’s position in the three-dimensional space relative to the camera setup [16]. To estimate the metrics of objects in the images, the use of the free, open-source MacOS application VidSync v1.721 can be applied. The application uses OpenCV library computer vision algorithms to process stereo recordings [17,18]. All calculations for 3D measurements in the application are detailed by the developers on the website (vidsync.org).
Prior to estimating any metrics, the footage from the 3D camera system was processed using Python’s OpenCV library and FFMPEG v7.0 [18,19,20]. Lens distortion is particularly pronounced by refraction when recording underwater through any housing. Correction factors, or distortion parameters, are determined by locating corners on a chessboard pattern or a calibration frame and arranging them into straight lines. The chessboard pattern can also be used to calculate the projection matrices for each camera by matching the known physical 2D node coordinates on each face of the calibration frame with screen coordinates. The coordinates are recorded manually in VidSync by clicking on the center of each node in the video recordings. The 3D coordinates of a point are calculated in VidSync through iterative triangulation, aiming to establish two lines of sight that approximately intersect at the point of interest. This is performed by clicking on different points of the lead line in each video recording. The calibration frame is the only source of information on the scaling of the 3D measurements.

2.2. Camera Setup

The 3D camera system includes an ArduCam Global Shutter Synchronized stereo camera hat with 2 separate cameras (SKU: B0492R) [21], a Raspberry Pi 4B with 4 GB RAM with Raspberry Pi OS (Debian version 11—Bullseye) [22], and a waterproof cabinet with a transparent polycarbonate lid (Fibox ET30) [23,24]. The system is powered and connected to the internet via cables and can be accessed remotely with available remote access software. In this project, the system was accessed via RealVNC and Chrome Remote Desktop [25,26]. There are numerous software solutions available for remote access, and the appropriateness can depend on local IT governance policies. A list of examples and a comparison is available online [27]. Hardware specifications can be found in the Supplementary Materials.
The 3D camera system consists of a Raspberry Pi, model 4b (RPI), connected to two stereo cameras mounted 30.8 cm apart. Each camera has a resolution of 1920 × 1020 pixels, global shutter, a 2.8 mm lens with a viewing angle of 120 Deg, an F-stop of 2.8, and a focal length of 3.6 mm. The camera can record videos stitched with a resolution of up to 3840 × 1220 pixels at 38 fps; we used 3840 × 1080 at 30 fps. The system was housed inside a waterproof cabinet with a clear see-through lid, which could be submerged underwater. The system was powered and connected to the internet via cables fed through the box using BlueRobotics cable penetrators [28]. It was noticed while testing the system that increasing the length of the 5-volt power cable for the RPI caused a significant loss in voltage, inevitably causing the RPI to warn for low voltage and, more importantly, not run at a constant frame rate when recording. The issue could be corrected by using a 12 V supply and an adjustable voltage regulator inside the UW box, set at the recommended Raspberry Pi voltage of 5.2 V [29]. In system tests, the system was submerged only so the two stereo cameras were underwater at a 45° angle.

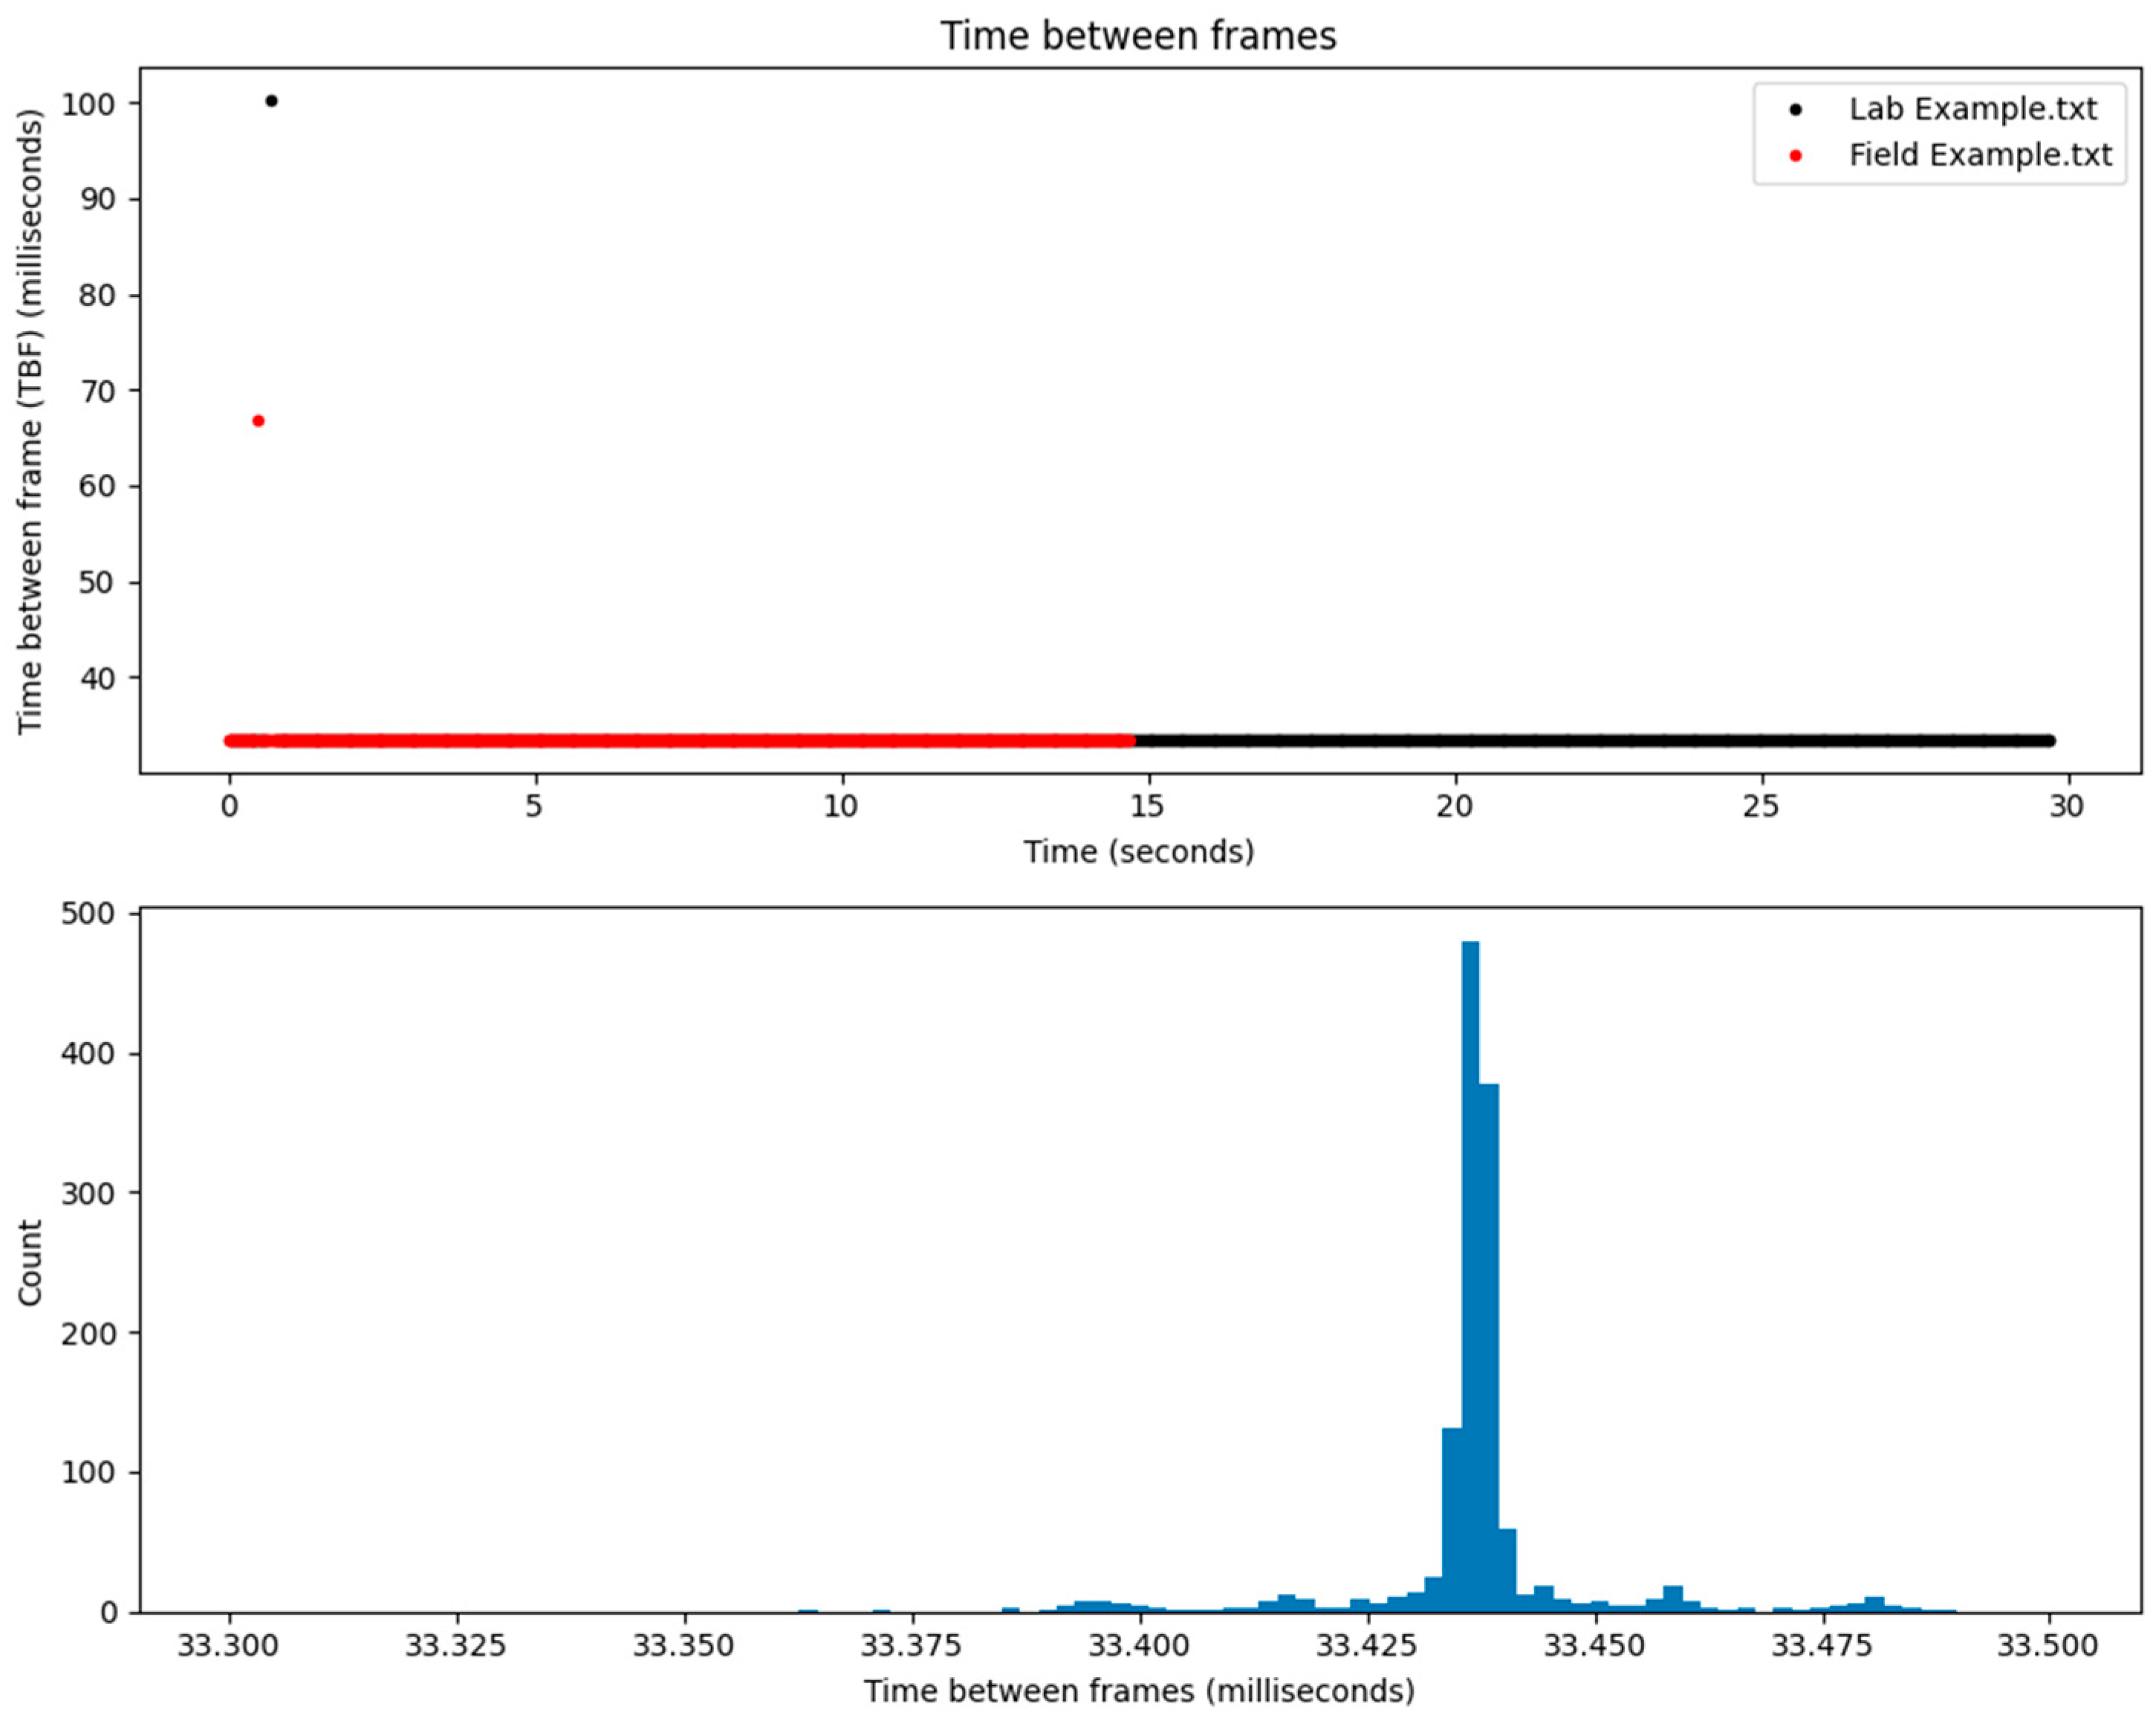
2.3. Footage Capturing and Processing

The footage is captured in .MJPEG format and processed using Python OpenCV library and FFMPEG [19,20], along with a logfile with time stamps for each frame in the video. The footage is split into two 1920 × 1080 videos for analysis. Calibration and lens distortion correction is performed in VidSync, with detailed steps provided in the VidSync video tutorial [17].
When the system was ready for remote access, the 3D camera unit was semi-submerged at a 45° angle in a tank in the Øresund Aquarium (University of Copenhagen, Elsinore, Denmark). The RPI was accessed from a laptop or mobile phone and the recording was initiated by calling a function using the open-source software library libcamera (libcamera.org). Due to limited RPI storage and processing capability, the footage was captured in .MJPEG format and then transferred from the RPI for post-processing. The processing of footage was performed using the open-source formatting media tool FFMPEG and OpenCV computer vision library [18,20]. All code was written in Python3 and run in Python v3.12.1 [19]. When the command is called in the terminal, the script/program splits the .MJPEG footage from one 3840 × 1080 video into two 1920 × 1080 videos, which are then the footage from the left camera and the right camera in the 3D camera unit. When the videos have been split, they are then converted to .MP4 files, and the frame number is embedded in the bottom left corner. Lastly, the script saves three separate .MP4 files: a converted version of the 3840 × 1080 footage, the footage from the left camera, and the footage from the right camera. The footage was post-processed on a Windows operating unit, after which the files were transferred to a MacOS unit for calibration and further data analysis in VidSync. To successfully transfer the files from Windows to MacOS and ensure compatibility, it is important to convert the .MJPEG to a video format that is compatible with the video player of MacOS, QuickTime. By using a virtual machine, with MacOS, all the analyses could be performed on the same physical PC. Likewise, the post-processing could take place on a MacOS unit for a more optimal data flow.

2.4. Calibration in VidSync

To obtain the depth information in the captured images, a 3D calibration and lens distortion correction were performed in VidSync. Firstly, to address the fisheye view of the camera lens, the lens distortion was corrected. This is performed by identifying the corners of the black and white squares on the chessboard. VidSync has its own built-in function that can automatically identify the corners, and only in a few cases must some corrections be made manually. The lens distortion parameters from our calibration can be found in the Supplementary Materials. The 3D calibration is performed by applying XYZ-coordinates to the nodes printed on the calibration frame. The XY-coordinates are the length and height from the bottom left node, starting at (0, 0). The Z-coordinate is the distance between the front and back plates, which makes the z-value for the front plate 0 and that for the back plate 20. The units used for these coordinates serve as the measurement and output units for VidSync. Additionally, refraction correction is also built into VidSync, and the user needs to input the values of the thickness of the front quadrant material, the refractive index of the material, and the refractive index of the water. The correction and calibration can be performed in any given frame of the footage, and once calculated, the correction and calibration factors can be saved and re-used on any other video clips made in the same environment. VidSync provides a full video tutorial on how to operate the application on their webpage.

3. Results

3.1. Measurement Tests

Following the calibration of the system, it was tested to see whether the footage from the 3D camera unit and the calibrations in VidSync would result in measurements that resemble the true conditions. The testing was performed by drawing up lines with a specific distance between them on an easily identifiable object, which was then submerged into the two cameras’ field of view. In the present case, a white broomstick was marked with a permanent marker, with lines drawn along the length at 0, 100, 250, 350, 500, 650, 750, 900, and 1000 mm. In VidSync, measuring is performed by manually clicking on specific points on each of the cameras, and then for each new point, a measurement can be extrapolated. It is possible to measure length, distance, and swimming speed, among other metrics, in VidSync, as illustrated in their video tutorial. Additional tests were conducted to assure the usefulness of the system, during which the broomstick was placed at a greater distance in the tank, further into the field of view, to see whether there were any inaccuracies concerning the depth information.
As the measurement performed in VidSync concerns only a single frame, it was possible to capture all of the incremental broomstick’s positions in one video sequence. The measurements made in VidSync with footage of the broomstick only exceeded a difference of maximum 5% from the true measurements in rare instances.
To demonstrate a practical scenario, the lengths of several Atlantic cod in the tank were measured. This test serves as an illustration of the 3D camera system’s effectiveness rather than a formal case study, as the recorded fish lengths (46–56 cm) were compared to estimates (approx. 50 cm) provided by the aquarium staff.

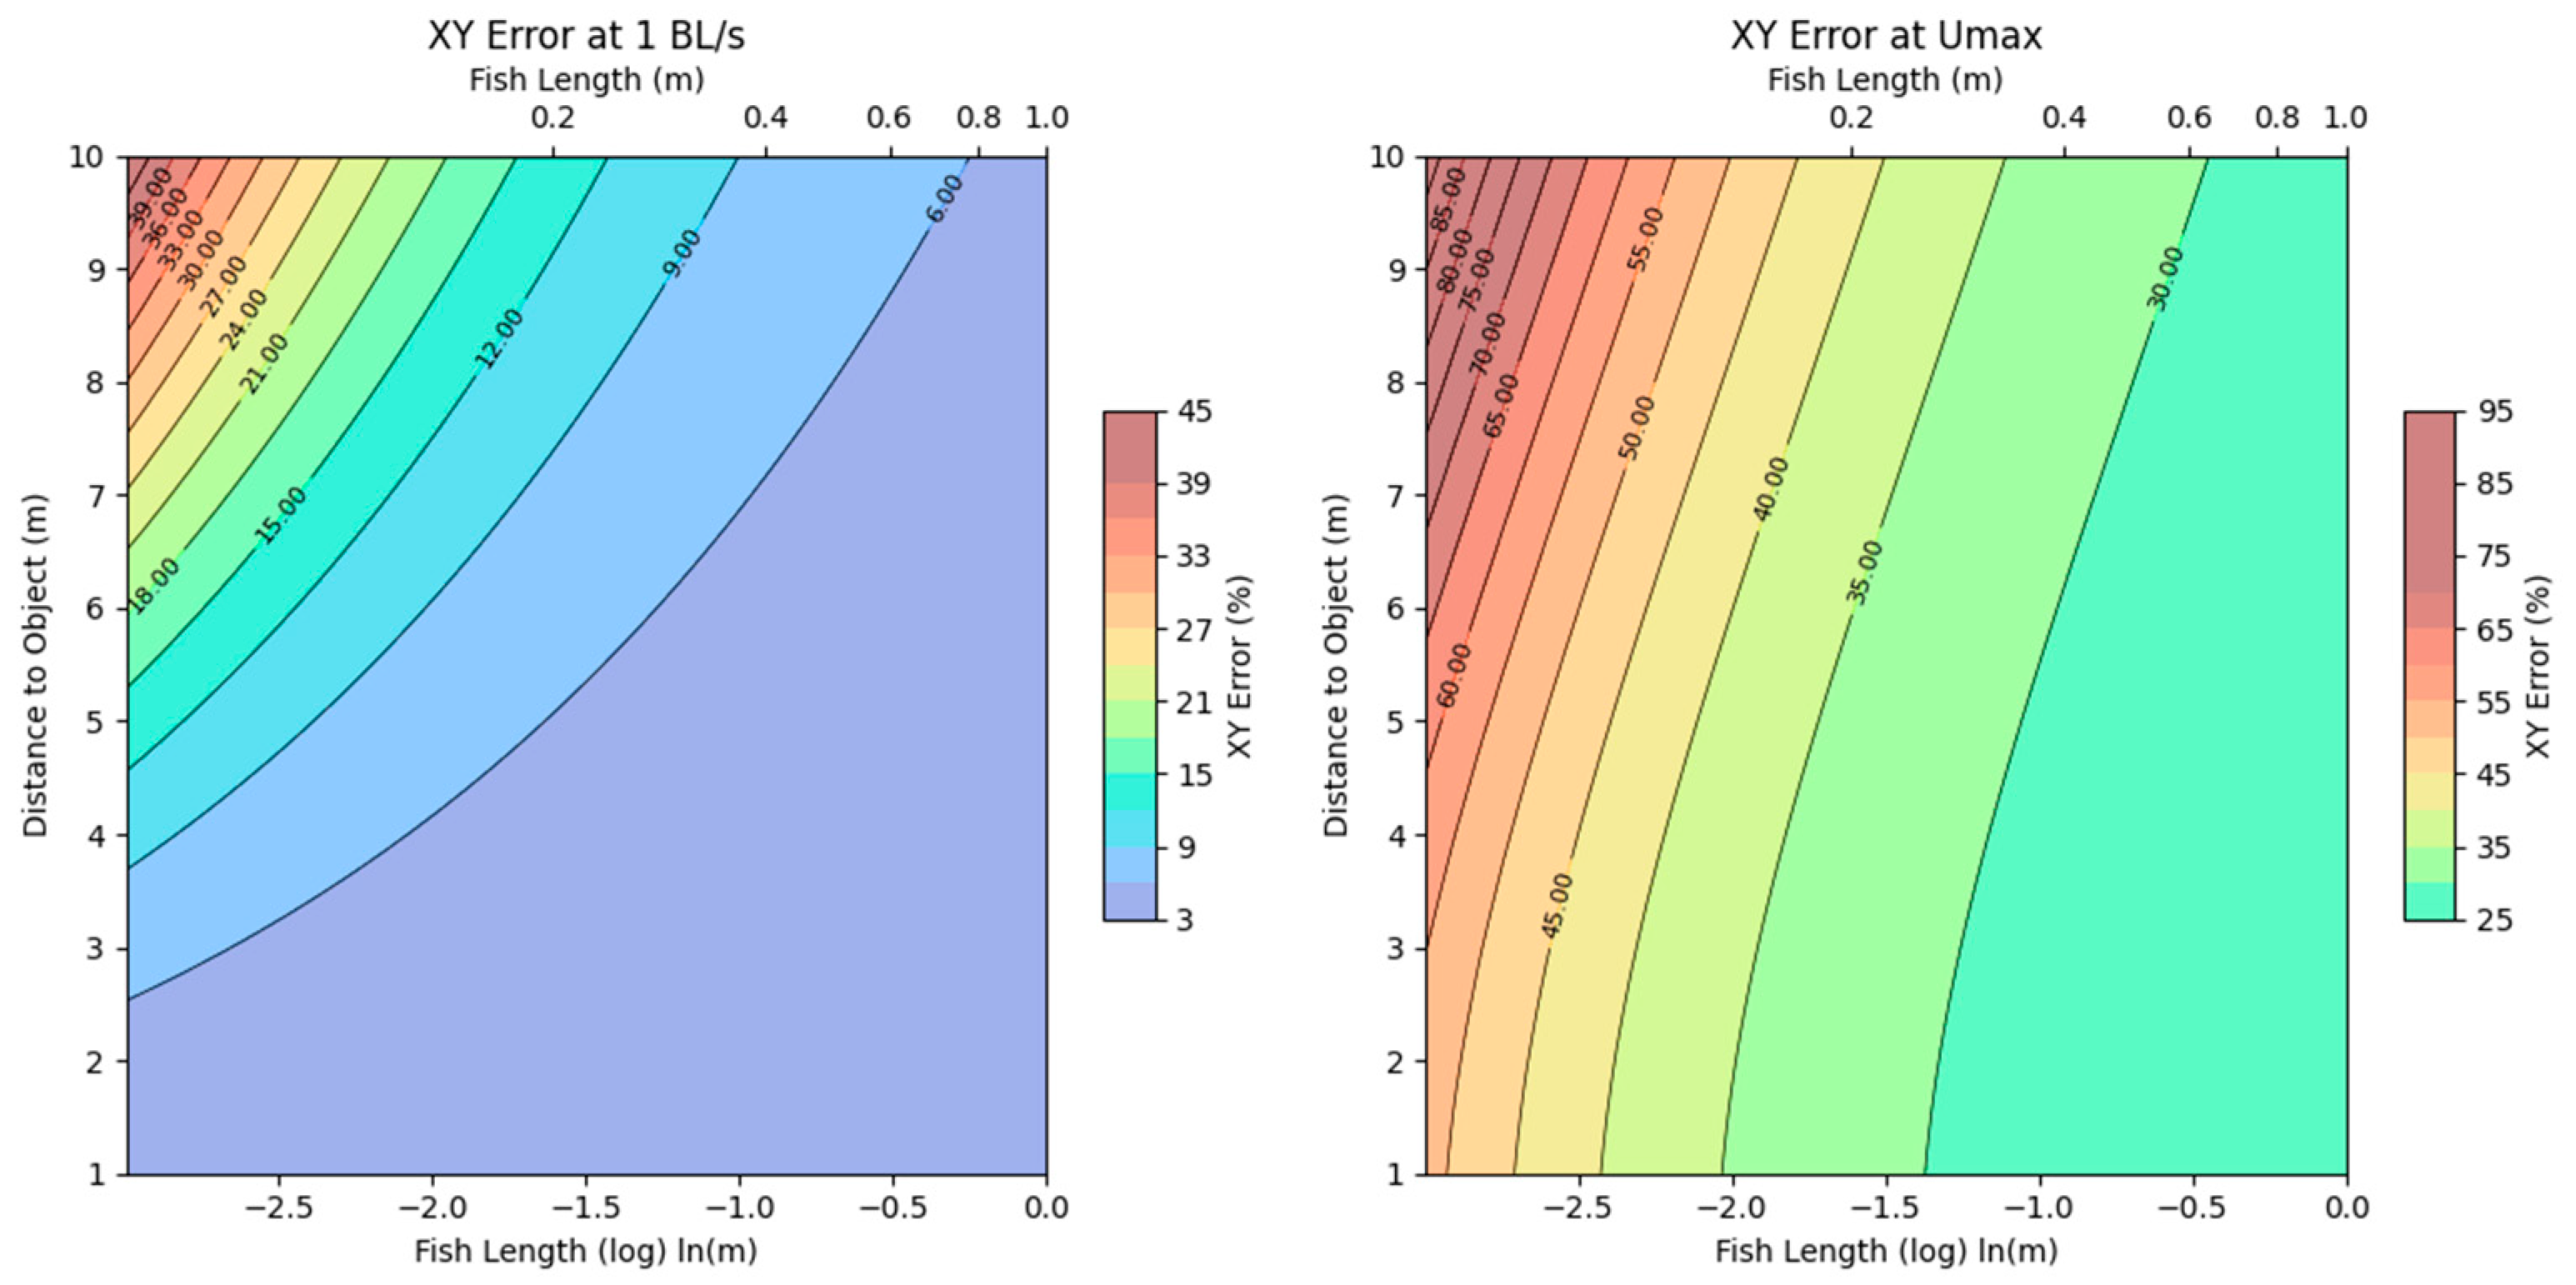
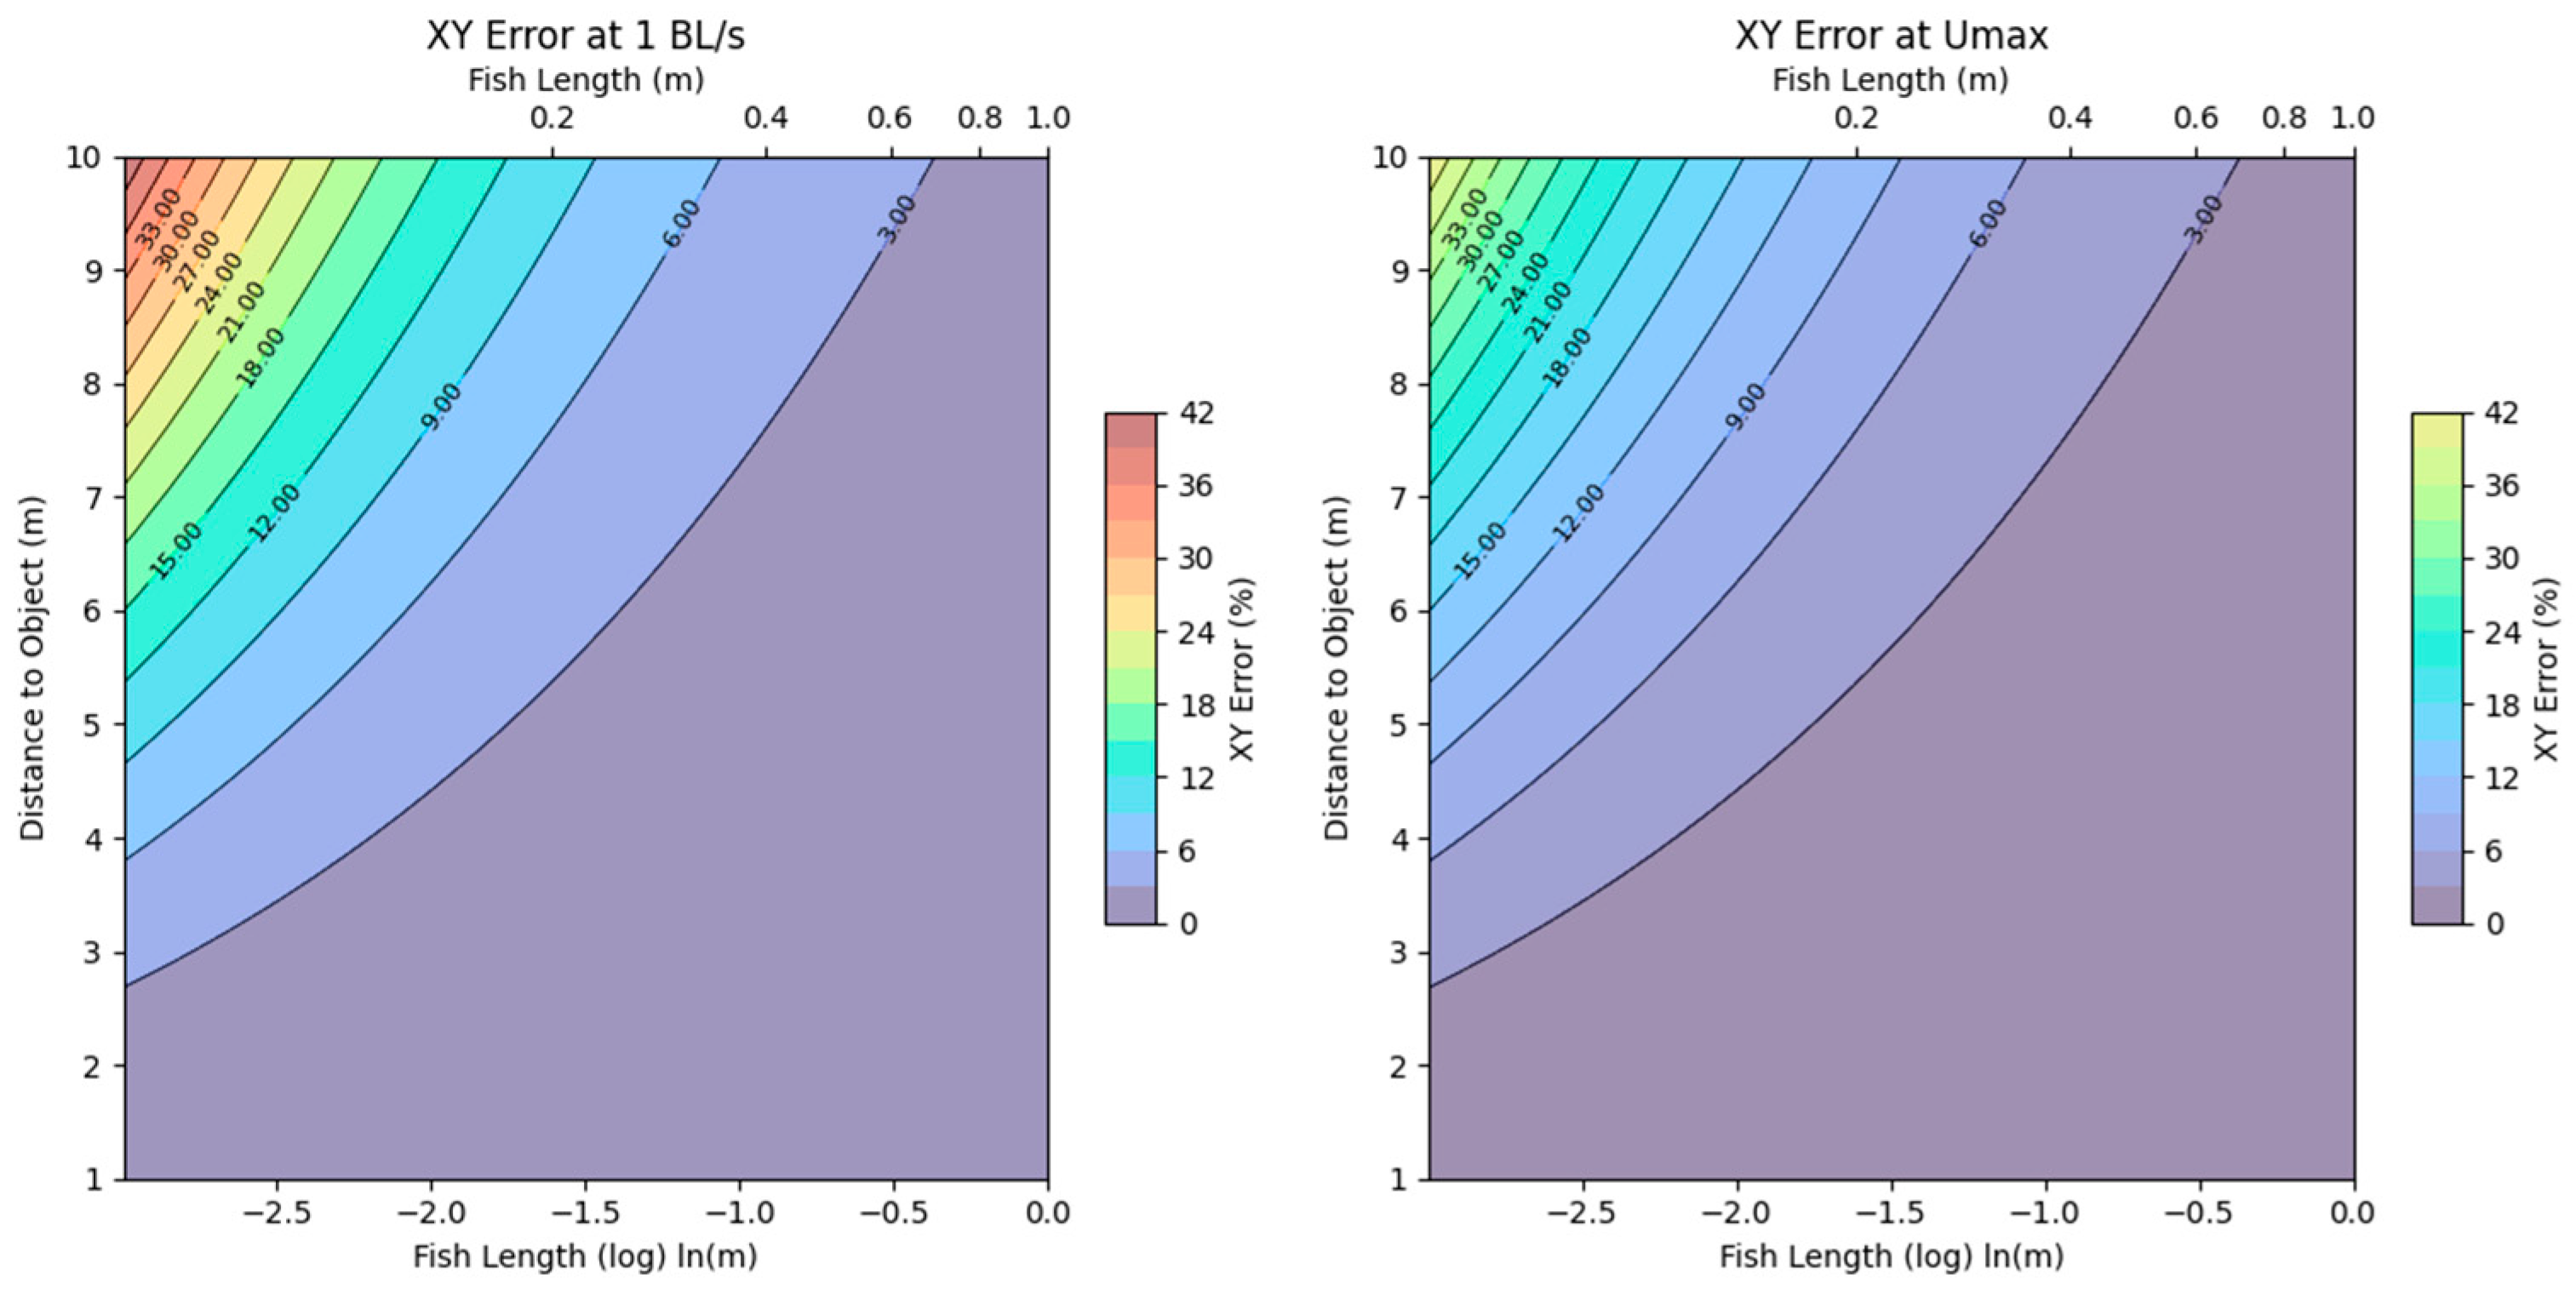
3.2. Camera Error Estimations

Figure 2 and Figure 3 demonstrate the expected errors given the fish sizes and swimming speeds to illustrate the errors in complete synchronization and partial (one frame off) synchronization for different-size fish at different distances and two different swimming speeds.
The analysis presented in this study estimates the total error associated with measuring the position of a moving object, such as a fish, using a stereo camera system. The calculations incorporate both the error arising from stereo triangulation and the error introduced by the motion of the object between consecutive frames. These errors are evaluated under two different swimming speeds: a cruising speed of 1 body length per second (BL/s) and the maximum swimming speed based on empirical relationships described by Videler (1993) and Svendsen et al. (2016) [30,31].
We developed a function based on principles from Mansour et al. (2019) [32], with the following variables: distance to the object (Z) (in meters), the camera’s focal length (f) (in millimeters), the baseline distance between the stereo cameras (B) (in millimeters), the correlation error (in pixels), the pixel size (p) (in meters per pixel), the speed of the object (v) (in meters per second), and the time difference between frames (dt) (in seconds). The stereo triangulation error in the XY plane is calculated using the formula dXY = Z·m·p, where the disparity (d) is calculated as d = (f·B)/Z, with f and B being the focal length and baseline in meters, respectively.
The motion error is computed as the product of the object speed and the time delay between frames: dXYmotion = v·dt. The total XY error is then calculated as the sum of the stereo triangulation error and the motion error: dXYtotal = dXYstereo + dXYmotion. In the figure (Figure 2 and Figure 3), this error is expressed as a percentage of the fish length (L) to provide a relative measure of accuracy.
The estimation of the maximum swimming speed is based on the empirical relationship U = 0.4 + 7.4·L, where L is the fish length in meters [30,31]. This allows for a comparison between errors calculated at 1 BL/s and the maximum swimming speed at a given size fish.
This revised method provides an assessment of the errors in the XY plane, considering the stereo camera system’s inherent triangulation errors as well as the additional uncertainty introduced by the object’s motion between frames. By combining these error sources, we obtain an estimate of the system’s accuracy in tracking moving fishes at different speeds and distances. For visualization, fish lengths ranging from 0.05 to 1 m and distances ranging from 1 m to 10 m are considered. We plotted contour plots with a logarithmic scale for the fish length axis to better visualize the range of values, while a secondary x-axis provides the corresponding non-logarithmic fish lengths for reference. The color bars are labeled with percentages to indicate the magnitude of the errors.
This method highlights the risk of large errors when measuring fast-moving objects, particularly due to imperfect synchronization between stereo cameras. Even small delays between frames can lead to significant errors in both position and depth estimation, highlighting the importance of using high frame rates and complete synchronization in such analyses. Errors from the partial synchronization can be mitigated by a higher frame rate. The 3D camera system demonstrated high accuracy in measuring the lengths of underwater objects and fish. The system’s ability to capture synchronized footage and process it for 3D measurements was validated through multiple tests. The results showed that the system could estimate lengths with over 95% accuracy compared to manually measured lengths. The broomstick test and the measurements of Atlantic cod both confirmed the system’s precision and reliability.
Finally, the stability of the frame recording from the system used both locally and remotely is seen in Figure 4.

4. Discussion

4.1. Improved Accuracy and Cost-Effectiveness

Synchronized 3D camera systems can provide reliable, high-accuracy measurements in underwater environments, overcoming the limitations of traditional 2D imaging. The ability to capture detailed 3D information allows for more precise monitoring of marine life, particularly in monitoring fish population size distributions and interactions within ecosystems. The cost-effectiveness of these systems makes them accessible to research institutions focused on marine biology. By offering a balance between accuracy and affordability, synchronized 3D camera systems enable more widespread studies of fish populations in various habitats, including coastal waters, estuaries, and deep-sea environments. The ability to collect high-resolution data without expensive, specialized equipment allows more research groups to conduct similar research, thereby increasing the overall understanding of marine biodiversity using common methods.

4.2. Remote Access and Control

The capability for remote access and control significantly enhances the system’s usability for marine biologists studying fish in different underwater environments. Researchers can monitor fish behavior and population dynamics without needing to be physically present. This is particularly useful for observations where human presence might disturb the natural behavior of fish. Likewise, it enables the ability to collect data from multiple locations simultaneously, supporting comparative studies of fishes across different locations. For example, researchers can simultaneously monitor fish behavior in a coral reef and a nearby seagrass meadow, providing insights into how different habitats influence species interactions. Additionally, reducing the need for frequent on-site visits saves time and resources, making long-term studies on fish populations more feasible.

4.3. Usability

The simplicity of the system encourages broader adoption among marine biologists, facilitating collaborative research and data sharing. For example, multiple research teams can use the system to monitor fish populations in different regions, contributing to large-scale studies on the effects of climate change or habitat degradation on marine biodiversity. The ease of use also supports educational initiatives, enabling students to participate in hands-on research and gain valuable experience in marine biology.

4.4. Future Development and Perspectives

We plan to further develop and test the 3D camera system based on the combination of a Raspberry Pi and the ArduCam stereo camera. Among others, we plan to test the herein described system vs. a dual GoPro 8 camera system (GoPro, Inc., San Mateo, CA, USA) by tracking spinning disks with at least a couple of dots—at variable speed—and to calculate the distance to the fish and the distance between points when spinning in either direction. This should be an easy test that everybody can perform, and we expect to obtain time deviations between the two GoPro cameras ranging from −36 to +36 ms—if filming @ 25 fps and with a shutter speed of 1/250 s. With the ArduCam Global Shutter Synchronized Camera SKU: B0492R system (ArduCam, Nanjing, China), we expect to find a negligible time deviation between the two cameras.
It is our hope that colleagues working with either fast-moving fish or 3D cameras, or both, in the future will understand the difference between partly and completely synchronized 3D camera systems, and the importance when calculating the distance to and length of the object. If you work with sedentary animals and fixed GoPro cameras, do not worry—you will be OK even if your cameras are only partly synchronized.

5. Conclusions

Cameras should be completely synchronized for stereo dynamic vision setups such as for moving fishes, especially if the fishes are small, move fast, or have varying distances to the camera setup.
The proposed synchronized 3D camera system offers a reliable and accurate method for estimating fish metrics in various aquatic environments. Its cost-effectiveness and easy setup make it a practical solution for both research and commercial applications. The system’s ability to provide precise measurements with minimal human intervention represents a significant advancement in underwater monitoring technology. Further advancements could enhance its autonomy and expand its applicability, making it a versatile tool for a wide range of aquatic studies and applications.

Supplementary Materials

The following supporting information can be downloaded at: https://www.mdpi.com/article/10.3390/fishes10040139/s1.

Author Contributions

Conceptualization, Ó.a.F.M., L.E.J.A., M.B.S.S. and J.F.S.; methodology, Ó.a.F.M., L.E.J.A., M.B.S.S. and J.F.S.; software, Ó.a.F.M., L.E.J.A., M.B.S.S. and J.F.S.; validation, Ó.a.F.M., L.E.J.A., M.B.S.S. and J.F.S.; formal analysis, Ó.a.F.M., L.E.J.A., M.B.S.S. and J.F.S.; data curation, Ó.a.F.M. and M.B.S.S.; writing—original draft preparation, Ó.a.F.M.; writing—review and editing, Ó.a.F.M., L.E.J.A., M.B.S.S. and J.F.S.; visualization, Ó.a.F.M., L.E.J.A., M.B.S.S. and J.F.S.; funding acquisition, J.F.S. All authors have read and agreed to the published version of the manuscript.

Funding

This research was funded by the University of Copenhagen and project PROMPT—PROcessus Migratoires Potentiels du Thon rouge de l’Atlantique, Filière Pêche, France.

Institutional Review Board Statement

Not applicable.

Informed Consent Statement

Not applicable.

Data Availability Statement

Source code available at GitHub repository; SynCam3D: https://github.com/Ollibolli98/SynCam3D (Accessed on 18-03-2025).

Acknowledgments

We are thankful to the Øresund Aquarium, University of Copenhagen, for providing access to recording and testing at their facilities.

Conflicts of Interest

The authors declare no conflicts of interest. The funders had no role in the design of this project; in the setup, collection, analysis, or interpretation of the data; in the writing of the manuscript; or in the decision to publish the results.

References

  1. Føre, M.; Frank, K.; Norton, T.; Svendsen, E.; Alfredsen, J.A.; Dempster, T.; Eguiraun, H.; Watson, W.; Stahl, A.; Sunde, L.M.; et al. Precision fish farming: A new framework to improve production in aquaculture. Biosyst. Eng. 2018, 173, 176–193. [Google Scholar] [CrossRef]
  2. Mallet, D.; Pelletier, D. Underwater video techniques for observing coastal marine biodiversity: A review of sixty years of publications (1952–2012). Fish. Res. 2014, 154, 44–62. [Google Scholar] [CrossRef]
  3. Murphy, H.M.; Jenkins, G.P. Observational methods used in marine spatial monitoring of fishes and associated habitats: A review. Mar. Freshw. Res. 2010, 61, 236–252. [Google Scholar] [CrossRef]
  4. Smith, J.E.; Pinter-Wollman, N. Observing the unwatchable: Integrating automated sensing, naturalistic observations and animal social network analysis in the age of big data. J. Anim. Ecol. 2021, 90, 62–75. [Google Scholar] [CrossRef] [PubMed]
  5. Shortis, M.; Abdo, E.H.D. A review of underwater stereo-image measurement for marine biology and ecology applications. In Oceanography and Marine Biology; CRC Press: Boca Raton, FL, USA, 2016; pp. 269–304. [Google Scholar]
  6. Miranda, J.M.; Romero, M. A prototype to measure rainbow trout’s length using image processing. Aquac. Eng. 2017, 76, 41–49. [Google Scholar] [CrossRef]
  7. Shortis, M.R.; Ravanbakskh, M.; Shaifat, F.; Harvey, E.S.; Mian, A.; Seager, J.W.; Culverhouse, P.F.; Cline, D.E.; Edgington, D.R. A review of techniques for the identification and measurement of fish in underwater stereo-video image sequences. In Proceedings of the Videometrics, Range Imaging, and Applications XII; and Automated Visual Inspection, SPIE Optical Metrology 2013, Munich, Germany, 16–17 May 2013; Volume 8791, pp. 107–116. [Google Scholar] [CrossRef]
  8. Harvey, E.; Shortis, M. A system for stereo-video measurement of sub-tidal organisms. Mar. Technol. Soc. J. 1995, 29, 10–22. [Google Scholar]
  9. Heppell, S.A.; Semmens, B.X.; Archer, S.K.; Pattengill-Semmens, C.V.; Bush, P.G.; McCoy, C.M.; Heppell, S.S.; Johnson, B.C. Documenting recovery of a spawning aggregation through size frequency analysis from underwater laser calipers measurements. Biol. Conserv. 2012, 155, 119–127. [Google Scholar] [CrossRef]
  10. Lopes, F.; Silva, H.; Almeida, J.M.; Pinho, C.; Silva, E. Fish farming autonomous calibration system. In Proceedings of the OCEANS 2017-Aberdeen, Aberdeen, UK, 19–22 June 2017; pp. 1–6. [Google Scholar] [CrossRef]
  11. Risholm, P.; Mohammed, A.; Kirkhus, T.; Clausen, S.; Vasilyev, L.; Folkedal, O.; Johnsen, Ø.; Haugholt, K.H.; Thielemann, J. Automatic length estimation of free-swimming fish using an underwater 3D range-gated camera. Aquacultural Engineering 2022, 97, 102227. [Google Scholar] [CrossRef]
  12. Kulawik, J.; Kubanek, M. Detection of false synchronization of stereo image transmission using a convolutional neural network. Symmetry 2021, 13, 78. [Google Scholar] [CrossRef]
  13. Chen, X.; Wu, X.; Gao, S.; Xie, X.; Huang, Y. Synchronization and calibration of a stereo vision system. In Proceedings of the Global Oceans 2020: Singapore—U.S. Gulf Coast, Biloxi, MS, USA, 5–30 October 2020; pp. 1–6. [Google Scholar] [CrossRef]
  14. Savina, E.; Krag, L.A.; Madsen, N. Developing and testing a computer vision method to quantify 3D movements of bottom-set gillnets on the seabed. ICES J. Mar. Sci. 2018, 75, 814–824. [Google Scholar] [CrossRef]
  15. Dunkley, K.; Dunkley, A.; Drewnicki, J.; Keith, I.; Herbert-Read, J.E. A low-cost, long-running, open-source stereo camera for tracking aquatic species and their behaviours. Methods Ecol. Evol. 2023, 14, 2549–2556. [Google Scholar] [CrossRef]
  16. Schmidt, V.E.; Rzhanov, Y. Measurement of micro-bathymetry with a GOPRO underwater stereo camera pair. In Proceedings of the 2012 Oceans, Hampton Roads, VA, USA, 14–19 October 2012; pp. 1–6. [Google Scholar] [CrossRef]
  17. Neuswanger, J.R.; Wipfli, M.S.; Rosenberger, A.E.; Hughes, N.F. Measuring fish and their physical habitats: Versatile 2D and 3D video techniques with user-friendly software. Can. J. Fish. Aquat. Sci. 2016, 73, 1861–1873. [Google Scholar] [CrossRef]
  18. Bradski, G.; Kaehler, A. OpenCV. Dr. Dobb’s J. Softw. Tools 2000, 120, 122–125. [Google Scholar]
  19. Van Rossum, G.; Drake, F.L. Python Reference Manual; Centrum voor Wiskunde en Informatica: Amsterdam, The Netherlands, 1995; Volume 111, pp. 1–52. [Google Scholar]
  20. Tomar, S. Converting video formats with FFmpeg. Linux J. 2006, 146, 10. [Google Scholar]
  21. Arducam.com. Available online: https://www.arducam.com/product/arducam-2-3mp2-ar0234-color-global-shutter-synchronized-stereo-camera-bundle-kit-for-raspberry-pi/ (accessed on 30 December 2024).
  22. Raspberrypi.com. Available online: https://www.raspberrypi.com/products/raspberry-pi-4-model-b/ (accessed on 30 December 2024).
  23. Dk.rs-online.com. Available online: https://dk.rs-online.com/web/p/allround-kabinetter/0251356?cm_mmc=DK-PLA-DS3A-_-google-_-CSS_DK_DK_Pmax_Test-_--_-251356&matchtype=&&gad_source=1&gclid=CjwKCAjwk8e1BhALEiwAc8MHiBh_5-iOa4enfQVwSI4WvDxYiNdGTNyTXV4Hwl3_Vgt9yA7HjpaqkxoCw_EQAvD_BwE&gclsrc=aw.ds (accessed on 30 December 2024).
  24. Tme.eu. Available online: https://www.tme.eu/dk/en/details/ekp30-t/enclosures-other-accessories/fibox/ekp-30t/?gad_source=1&gclid=CjwKCAjwk8e1BhALEiwAc8MHiJhZJ2pqFnnzzS4XbaYj5sxLXmNlGGcl2YyaIUIcgyfFzBezGr-BChoCSTEQAvD_BwE&gclsrc=aw.ds (accessed on 30 December 2024).
  25. Realvnc.com. Available online: https://www.realvnc.com/en/ (accessed on 30 December 2024).
  26. Remotedesktop.google.com. Available online: https://remotedesktop.google.com/ (accessed on 30 December 2024).
  27. Wikipedia.com. Available online: https://en.wikipedia.org/wiki/Comparison_of_remote_desktop_software (accessed on 30 January 2025).
  28. BlueRobotics.com. Available online: https://bluerobotics.com/product-category/cables-connectors/penetrators/ (accessed on 30 December 2024).
  29. Elextra.dk. Available online: https://www.elextra.dk/sv-se/p/dc-dc-step-down-konverter-4-40v-125-37v-15w-2a/H29272 (accessed on 30 December 2024).
  30. Videler, J.J. Fish Swimming; Springer Sci. & Bus. Media: Berlin/Heidelberg, Germany, 1993; p. 260. ISBN 978-0-412-40860-1. [Google Scholar]
  31. Svendsen, M.B.S.; Domenici, P.; Marras, S.; Krause, J.; Boswell, K.M.; Rodriguez-Pinto, I.; Wilson, A.D.M.; Kurvers, R.H.J.M.; Viblanc, P.E.; Finger, J.S.; et al. Maximum swimming speeds of sailfish and three other large marine predatory fish species based on muscle contraction time and stride length: A myth revisited. Biol. Open 2016, 5, 1415–1419. [Google Scholar] [CrossRef] [PubMed]
  32. Mansour, M.; Davidson, P.; Stepanov, O.; Piché, R. Relative importance of binocular disparity and motion parallax for depth estimation: A computer vision approach. Remote Sens. 2019, 11, 1990. [Google Scholar] [CrossRef]
Figure 1. Left camera (LC), right camera (RC). For the trigger sequences in (a,b), the fish moves from position (I) to (II) within one frame. (a) Camera trigger sequence: LC-RC, object appears further away/larger. (b) Camera trigger sequence: RC-LC, object appears closer/smaller. (c) Camera trigger sequence: synchronized, object appears at correct position and size.
Fishes 10 00139 g001
Figure 2. Error estimation for partially synchronized camera setup. Error estimates for determining the length of a fish using stereo camera setup: (Left) illustrates error moving at 1 BL/s, and (Right) illustrates error when the fish swims at Umax (sensu Videler 1993). Fish length, X, is displayed on a logarithmic scale for visualization purposes, and the corresponding non-log measure is seen on the top of the graphs. Lines represent iso-error, and error is in percent body length. There is a notable difference in error between 1 BL/s and Umax.
Fishes 10 00139 g002
Figure 3. Error estimates for synchronized cameras. Error estimates for determining the length of a fish using stereo camera setup: (Left) illustrates error moving at 1 BL/s, and (Right) illustrates error when the fish swims at Umax (sensu Videler 1993). Lines represent iso-error, and error is in percent body length. Fish length, X, is displayed on a logarithmic scale for visualization purposes, and the corresponding non-log measure is seen on the top of the graphs. Same calculation as Figure 2; however, as there is no motion of the object between the frames, then the error estimates are the same at the two swimming speeds. Error values are approx. half of the 1 BL/s situation in Figure 2, and approx. 10 times smaller at Umax.
Fishes 10 00139 g003
Figure 4. Time between frames. The (top) figure shows two different examples of the time between frames over two recordings of 15 s (red dots: from field experiment, remote-accessed) and 30 s (black dots: from the lab, local setup). Note that after a few frames in the beginning, one and two frames are skipped, caused by the camera start-up (see main text). The (bottom) graph illustrates histograms of time between frames from the two recordings. Note the difference between the expected values (30 fps = 33.33 ms), and that the majority are approximately 33.44 ms apart. This highlights the importance of having a time-stamp log of the recording available to ensure that the analysis can be performed with the correct parameters. For longer recordings, a considerable error can accumulate this way if one is not aware of it.
Fishes 10 00139 g004
Disclaimer/Publisher’s Note: The statements, opinions and data contained in all publications are solely those of the individual author(s) and contributor(s) and not of MDPI and/or the editor(s). MDPI and/or the editor(s) disclaim responsibility for any injury to people or property resulting from any ideas, methods, instructions or products referred to in the content.

