Article

Growth, Reproductive Parameters and Stock Status of Brown-Marbled Grouper Epinephelus fuscoguttatus, a Commonly Targeted Grouper in Saleh Bay, Indonesia

1
Ocean Program, Yayasan Konservasi Indonesia, Jakarta 12510, Indonesia
2
Institute for Marine and Antarctic Studies, University of Tasmania, 15-21 Nubeena Crescent Taroona, Hobart 7053, Australia
3
Centre for Sustainable Aquatic Ecosystems Research, Harry Butler Institute, School of Environmental and Conservation Sciences, Murdoch University, Perth 6150, Australia
4
Department of Fishery Resources Utilizations, Faculty of Fisheries and Marine Sciences, IPB University, Bogor 16680, Indonesia
*
Author to whom correspondence should be addressed.
Fishes 2025, 10(12), 611; https://doi.org/10.3390/fishes10120611 (registering DOI)
Submission received: 6 October 2025 / Revised: 26 November 2025 / Accepted: 26 November 2025 / Published: 27 November 2025

Abstract

The brown-marbled grouper (Epinephelus fuscoguttatus), a high-value species in international trade, has experienced population declines due to intensive fishing. It is one of 12 grouper and snapper species prioritized for management in Saleh Bay, West Nusa Tenggara, Indonesia. This study analyzed catch data (2017–2022) and biological samples (2020–2021) to update key life history parameters, including natural mortality, von Bertalanffy growth parameters, asymptotic length, and size at maturity. Growth was estimated using an ELEFAN-optimized model applied to catch length–frequency data, while maturity was determined through macroscopic examination of gonads. The updated estimates (L50 = 488 mm for both sex; L95 = 568 mm for females and 616 mm for males) were incorporated into a length-based spawning potential ratio (SPR) assessment. Annual SPR values ranged from 0.13 to 0.28, substantially higher than previous estimates of 0.05–0.07, mainly due to the lower L50 used in this study. Despite this improvement, SPR values remain below the management target of 0.30 for groupers and snappers in Saleh Bay. Limited biological samples, particularly the scarcity of larger individuals and males, introduce uncertainty in the estimates. These findings emphasize the value of locally derived life history information and highlight the need for continued biological sampling to refine growth and reproductive parameters and support sustainable fisheries management.
Key Contribution: This study provides a new estimation of the stock condition (spawning potential ratio) of brown-marbled grouper Epinephelus fuscoguttatus in Saleh Bay using estimates of life history parameters generated from biological sampling rather than empirical relationships.

1. Introduction

Groupers (Serranidae) are a crucial fishery resource due to their significant economic value and play a vital role in sustaining the livelihoods of local communities and contributing to global seafood [1]. The escalating demand for these species has led to a gradual increase in total grouper landings globally. An evaluation of the conservation status of grouper categorized 19 of the 71 assessed species, as “threatened” according to the International Union for Conservation of Nature’s (IUCN) Red List of Threatened Species [2]. In addition to these species of conservation concern, a comprehensive study of 716 grouper and snapper (Lutjanidae) fisheries worldwide indicated that approximately half are currently overexploited [1].
Indonesia plays an important role in global grouper production from wild capture fisheries and aquaculture [1,3]. From 2019 to 2023, Indonesia’s yearly grouper (Serranidae) capture production averaged 199,534 metric tons, accounting for 79% of the global annual production (FAO Statistics, accessed on 10 September 2025). These catches contributed ~10% to the overall landings of demersal and reef-associated fish species in Indonesia, and are primarily catches in small-scale fisheries [1,4,5].
Recognizing the decline in fish stocks in recent years, Indonesia has taken steps to develop and implement harvest strategies for various economically significant fishery resources, including groupers [6]. Presently, Indonesia has two interim harvest strategies specifically designed for snapper and grouper species in Fisheries Management Areas (FMAs) 713 and 573. The FMA 713 interim harvest strategy, established in 2020, encompasses 10 provinces, including West Nusa Tenggara (WNT). This province was the first in Indonesia to successfully formulate a comprehensive action plan for grouper and snapper fisheries in 2018, with specific initiatives implemented in various locations, including Saleh Bay [7]. In this bay, 12 grouper and snapper species have been identified for management and monitoring, and their stock conditions are monitored each year, reflecting a commitment to sustainable fisheries management practices.
The brown-marbled grouper (Epinephelus fuscoguttatus) is among the 12 species under management focus in Saleh Bay [7]. This species is found throughout the Indo-Pacific region, from the Red Sea, along the African coast to Mozambique, extending eastward to Samoa and the Phoenix Islands, northward to Japan, and southward to Australia [8]. Throughout Indonesia, E. fuscoguttatus is a common grouper species targeted by small-scale fisheries for local and export markets (e.g., refs. [9,10] and is also the main species for grouper aquaculture [11,12]. It is characterized by its long lifespan (up to 42 years), late maturation (~six to nine years), and follows a protogynous reproductive pattern ([2,13,14]).
Epinephelus fuscoguttatus is a primary target in the grouper fishery of Saleh Bay [15]. From the results of a fisheries landing monitoring program (FLM) by the local fisheries management authority, an analysis of these data for grouper and snapper stocks in Saleh Bay using the length-based spawning potential ratio method (LB-SPR) indicated that E. fuscoguttatus is under significant fishing pressure [16]. According to the study, E. fuscoguttatus had the lowest spawning potential ratio (SPR), ranging between 0.05 and 0.06 and the highest relative fishing mortality (F/M), ranging from 2.20 to 2.21, compared to the 10 other species monitored.
Stock assessments using the LB-SPR approach require information on various life history parameters for the assessed species [17,18]. These parameters include the ratio of natural mortality (M) to the instantaneous growth parameter (k) from the von Bertalanffy growth equation (M/k), von Bertalanffy’s estimated asymptotic length (L), as well as the lengths at 50% and 95% maturity (L50 and L95) [17]. However, such life history information is typically unavailable in data-limited fisheries, as was found by Halim et al. (2020) [4] when assessing six species of grouper and snapper by the LB-SPR in Saleh Bay, Pepela, and Rote. Frequently, the life history information needed for length-based stock assessment is sourced from studies conducted in other locations (e.g., ref. [18]. As biological and fishery characteristics vary spatially, this introduces high uncertainty in the results of stock assessment.
The precarious condition of E. fuscoguttatus stocks in Saleh Bay raises significant concerns for the fisheries management authority. However, it is worth noting that the extremely low current SPR estimate for this species may not be entirely accurate, given that large specimens of this species continue to be caught by fishers. Therefore, the present study aimed to estimate biological parameters for E. fuscoguttatus in Saleh Bay and use these contemporary estimates to re-evaluate the status of the stock in this system, i.e., use them as the basis for estimating the SPR and compare these estimates with the previous estimates by [19], based on biological parameters of E. fuscoguttatus from other global regions.

2. Materials and Methods

2.1. Study Site and Data Sources

This study was conducted in Saleh Bay on the island of Sumbawa, West Nusa Tenggara, Indonesia (Figure 1). Two primary data sources were used: (i) catch data from FLM conducted monthly by the fisheries management authority from January 2017 to December 2022 [15] and (ii) biological samples collected from January 2020 to August 2021. Landing data were collected at four sites over 7 to 15 days each month, which involved the direct observation of fish landing activities, measurements of the catch, and post-fishing trip interviews with fishers (Figure 1). Information on the fishing gear used in each trip was also recorded during these monitoring activities, which enabled comparison of catch length distributions among major gears. During the 5 years of FLM, measurements of 488 E. fuscoguttatus were recorded from 263 fishing trips.
Samples of E. fuscoguttatus were obtained from four main fish landing sites in Saleh Bay from January 2020 to August 2021 (Figure 1). Initially, monthly purchases were planned, but these were disrupted by the COVID-19 pandemic in 2020. During this period, fishing activities in Saleh Bay declined substantially as international trade and domestic travel restrictions reduced market demand for groupers. These restrictions, together with limitations on field travel, constrained access to landing sites and reduced the availability of samples. Fish samples were purchased whole from local fishers and collectors and stored in a freezer at −20 °C.

2.2. Age and Growth

The total length (TL) and weight of 116 E. fuscoguttatus were measured to the nearest 1 mm and 1 g, respectively. The length–weight relationship was determined using the formula W = a L b , where W represents the weight in grams, and L denotes the TL in mm. The coefficients, denoted as a and b, were established by fitting the model to the individual observed length at weight data. The coefficients a and b values in the allometric length–weight equation were estimated by loge-transforming the measurements to linearize the power (potential) relationship [20]. Subsequently, the data were fitted using simple linear regression to: log e ( W ) = log e ( a ) + b   log e ( L ) . Total length (TL) was recorded in millimeters (mm) but converted to centimeters (cm) only for the length–weight relationship, following the reporting convention of Froese et al. (2011) [21]; all other analyses use TL in mm.
Sagittal otoliths were extracted from each specimen following the “open-the-hatch” technique [22], cleaned, dried, and stored in labeled vials. Each otolith was embedded in thermoplastic glue and sectioned transversely (~0.3 mm thick) through the nucleus using a low-speed diamond saw. Sections were polished sequentially with fine wet sandpaper, rinsed, and stored before imaging under a stereomicroscope. The digital images were processed to enhance contrast, and annuli were identified and marked using ImageJ software (ver. 13.0.6).
Otoliths were read twice by each reader, with a two-week interval between readings. Consequently, a total of four replicate otolith readings were obtained. Only otoliths with a minimum of two identical counts were included in the analyses, reducing the sample size from 108 to 97. Although insufficient otoliths were obtained at monthly intervals to validate the annual formation of opaque zones, the annual formation of opaque zones has been confirmed in two closely related species, Epinephelus areolatus and E. bilobatus [23,24]. For aging purposes, it is thus assumed that a single opaque zone is formed annually in the otoliths of E. fuscoguttatus. The individual length at age data were fitted using non-linear least-squares regression of the von Bertalanffy growth function (vBGF) to estimate the growth characteristics of the species.
Decimal age estimation involved determining the number of delineated opaque bands in sectioned otoliths, taking into account the typical timing of zone formation throughout the year, relative birthdates and the capture date of the samples [24]. Since no clear seasonal trend was observed in the preliminary analysis of monthly GSI data and in other tropical serranids spawning occurs throughout the year (e.g., refs. [23,24]), the birthdate was arbitrarily set at 1 January. Given the uncertain date of capture from the FLM program, date of capture of fish collected monthly was set as the 15th day of each month of capture. It is also assumed that the opaque growth zone forms from mid-winter (July) to early Austral Spring (September) when water temperatures are at their lowest, as in [23].
The von Bertalanffy growth curves (vBGCs) were fitted to the TLs at age of E. fuscoguttatus. The von Bertalanffy growth equation has the form, T L = T L ( 1 e k t t 0 ) , where TL is the total length (mm) at age t (years), TL is the asymptotic total length (mm) predicted by the equation, k is the growth coefficient (year−1) and t0 is the hypothetical age (years) at which fish would have zero length.
In addition to the otolith-based analysis, growth parameters were also estimated using length–frequency data from the fish landing monitoring (FLM) program (2017–2022). The estimation employed the ELEFAN-optimized method implemented in RStudio (for Mac ver. 2024.09.0+375) using the TopFishR package [25]. The use of the ELEFAN approach was justified by the broader size range of the FLM data (297–860 mm TL) compared to the biological samples used for otolith readings (307–730 mm TL; see size distributions in Section 3.1).
Because the biological dataset lacked the largest individuals, the otolith-based estimates of the asymptotic length (L) and growth coefficient (k) may have been biased toward smaller values. To reduce this bias and obtain growth parameters more representative of the full population structure, the ELEFAN-derived L and k were subsequently used in the estimation of natural mortality (M), the M/k ratio, and the length-based spawning potential ratio (LB-SPR). The otolith-based estimates were retained to validate the growth pattern and age–length relationship, thereby providing biological support for the length-based analysis.

2.3. Collection of Gonad Sample, Gonad Development and Maturity

The sex of each specimen was determined through macroscopic examination of the gonads, which were staged following the five-stage maturity scheme of Rhodes and Sadovy (2002) (Ref. [26]; Appendix A.1). Individuals with gonads at stage III or higher were classified as sexually mature. The total number of mature individuals (n = 71 females; n = 44 males) was limited, and males were predominantly observed in the largest size classes. Owing to this unbalanced sex–size distribution and restricted sample size, it was not feasible to fit logistic (S-shaped) maturity ogives. Instead, histograms were used to describe the length–frequency distribution and the composition of mature and immature individuals for each sex, providing an approximate visual representation of maturity by size class. For each sex, the length at 50% maturity (L50) was inferred from the midpoint of the first length class in which ≥50% of individuals were mature, while the length at 95% maturity (L95) was estimated as the length class in which ≥95% of individuals were mature.

2.4. Estimation of Natural Mortality

Natural mortality (M) was estimated using maximum age, L, k, age at maturity, and GSI by 13 methods (Appendix A.2) from the Barefoot Ecologist’s Toolbox (http://barefootecologist.com.au/; accessed on 26 November 2025). Uncertainty was added to all M estimations by assuming a log-normal type of error and a 0.31 standard deviation, as suggested by Cope and Hamel (2022) [27]. Furthermore, a composite value (mean and median) of M was calculated from values of M using a weighting method. Weighting values for each method ranged from 0 to 1, where a value of 0 removes the contribution while a value of 1 is full weighting. The default values are determined by the redundancies present in methods that share similar information. For example, each of the four longevity-based methods (Then_lm, Then_Amax, Then_vbgf, and Jensen_k1) is assigned a weight of 0.25, and when combined, these weights sum up to 1. While 13 methods were available for estimating M, three of them (GSI, ZA_CA_dem, and ZA_CA_pel) produced values that were substantially lower than the other estimators and biologically implausible for a long-lived, slow-growing species. Cope and Hamel [27] recommend down-weighting or excluding empirical estimators that generate extreme outliers; following this guidance, these three methods were not included in the final composite M.

2.5. Estimation of Spawning Potential Ratio

The LB-SPR model relies on several inputs, including M/k, the mean asymptotic length (L), the coefficient of variation of the asymptotic length (CVL∞), and parameters related to size at maturity (L50 and L95, denoting the lengths at which 50% and 95% of the stock is anticipated to be mature, respectively) [17]. The predetermined values for M/k and L, and the length composition data from the exploited stock’s catch are used to estimate the SPR using maximum likelihood methods to concurrently estimate selectivity at length parameters (presumed to follow the logistic curve) and the relative fishing mortality (F/M) [28]. The LB-SPR was estimated using the SPR application in the Barefoot Ecologist’s Toolbox.
To calculate SPR, this study employs the L and k values obtained from von Bertalanffy’s growth model through the ELEFAN-optimized method in the TopFishR application as larger individuals were under-represented in the biological data for E. fuscoguttatus in this study (see Results under Section 3.1). Additionally, the instantaneous k value from the ELEFAN estimation was used to determine the M/k value, with the M value estimated using the methods described above. The estimates of 50% and 95% size at maturity (L50 and L95) were also used in the estimation of SPR (see Results under Section 3.2.4).
Because E. fuscoguttatus is a protogynous species and sex-specific maturity curves could not be fitted reliably across the full size range, the SPR was estimated under three maturity scenarios to evaluate the potential influence of uncertainty in L50 and L95. The primary analysis used the female maturity parameters (L50 and L95), consistent with the LBSPR formulation, which parameterizes reproductive schedules in terms of female spawning potential [17]. Two additional sensitivity runs were conducted using (i) a sex-combined maturity schedule derived from all biological samples and (ii) a male-based maturity schedule representing a conservative case reflecting the predominance of males in the largest size classes. All scenarios used identical growth, selectivity, and M/k inputs; only the maturity parameters differed.

2.6. Statistical Analyses

The mean sizes of fish were compared between the FLM and biological sampling programs using a two-tailed t-test and among fishing methods and years using one-way Analysis of Variance (ANOVA) tests. The non-parametric Kolmogorov–Smirnov (K–S) test was used to compare the length distributions of fish between the two sampling programs and among methods and years.

3. Results

3.1. Length and Age Structure

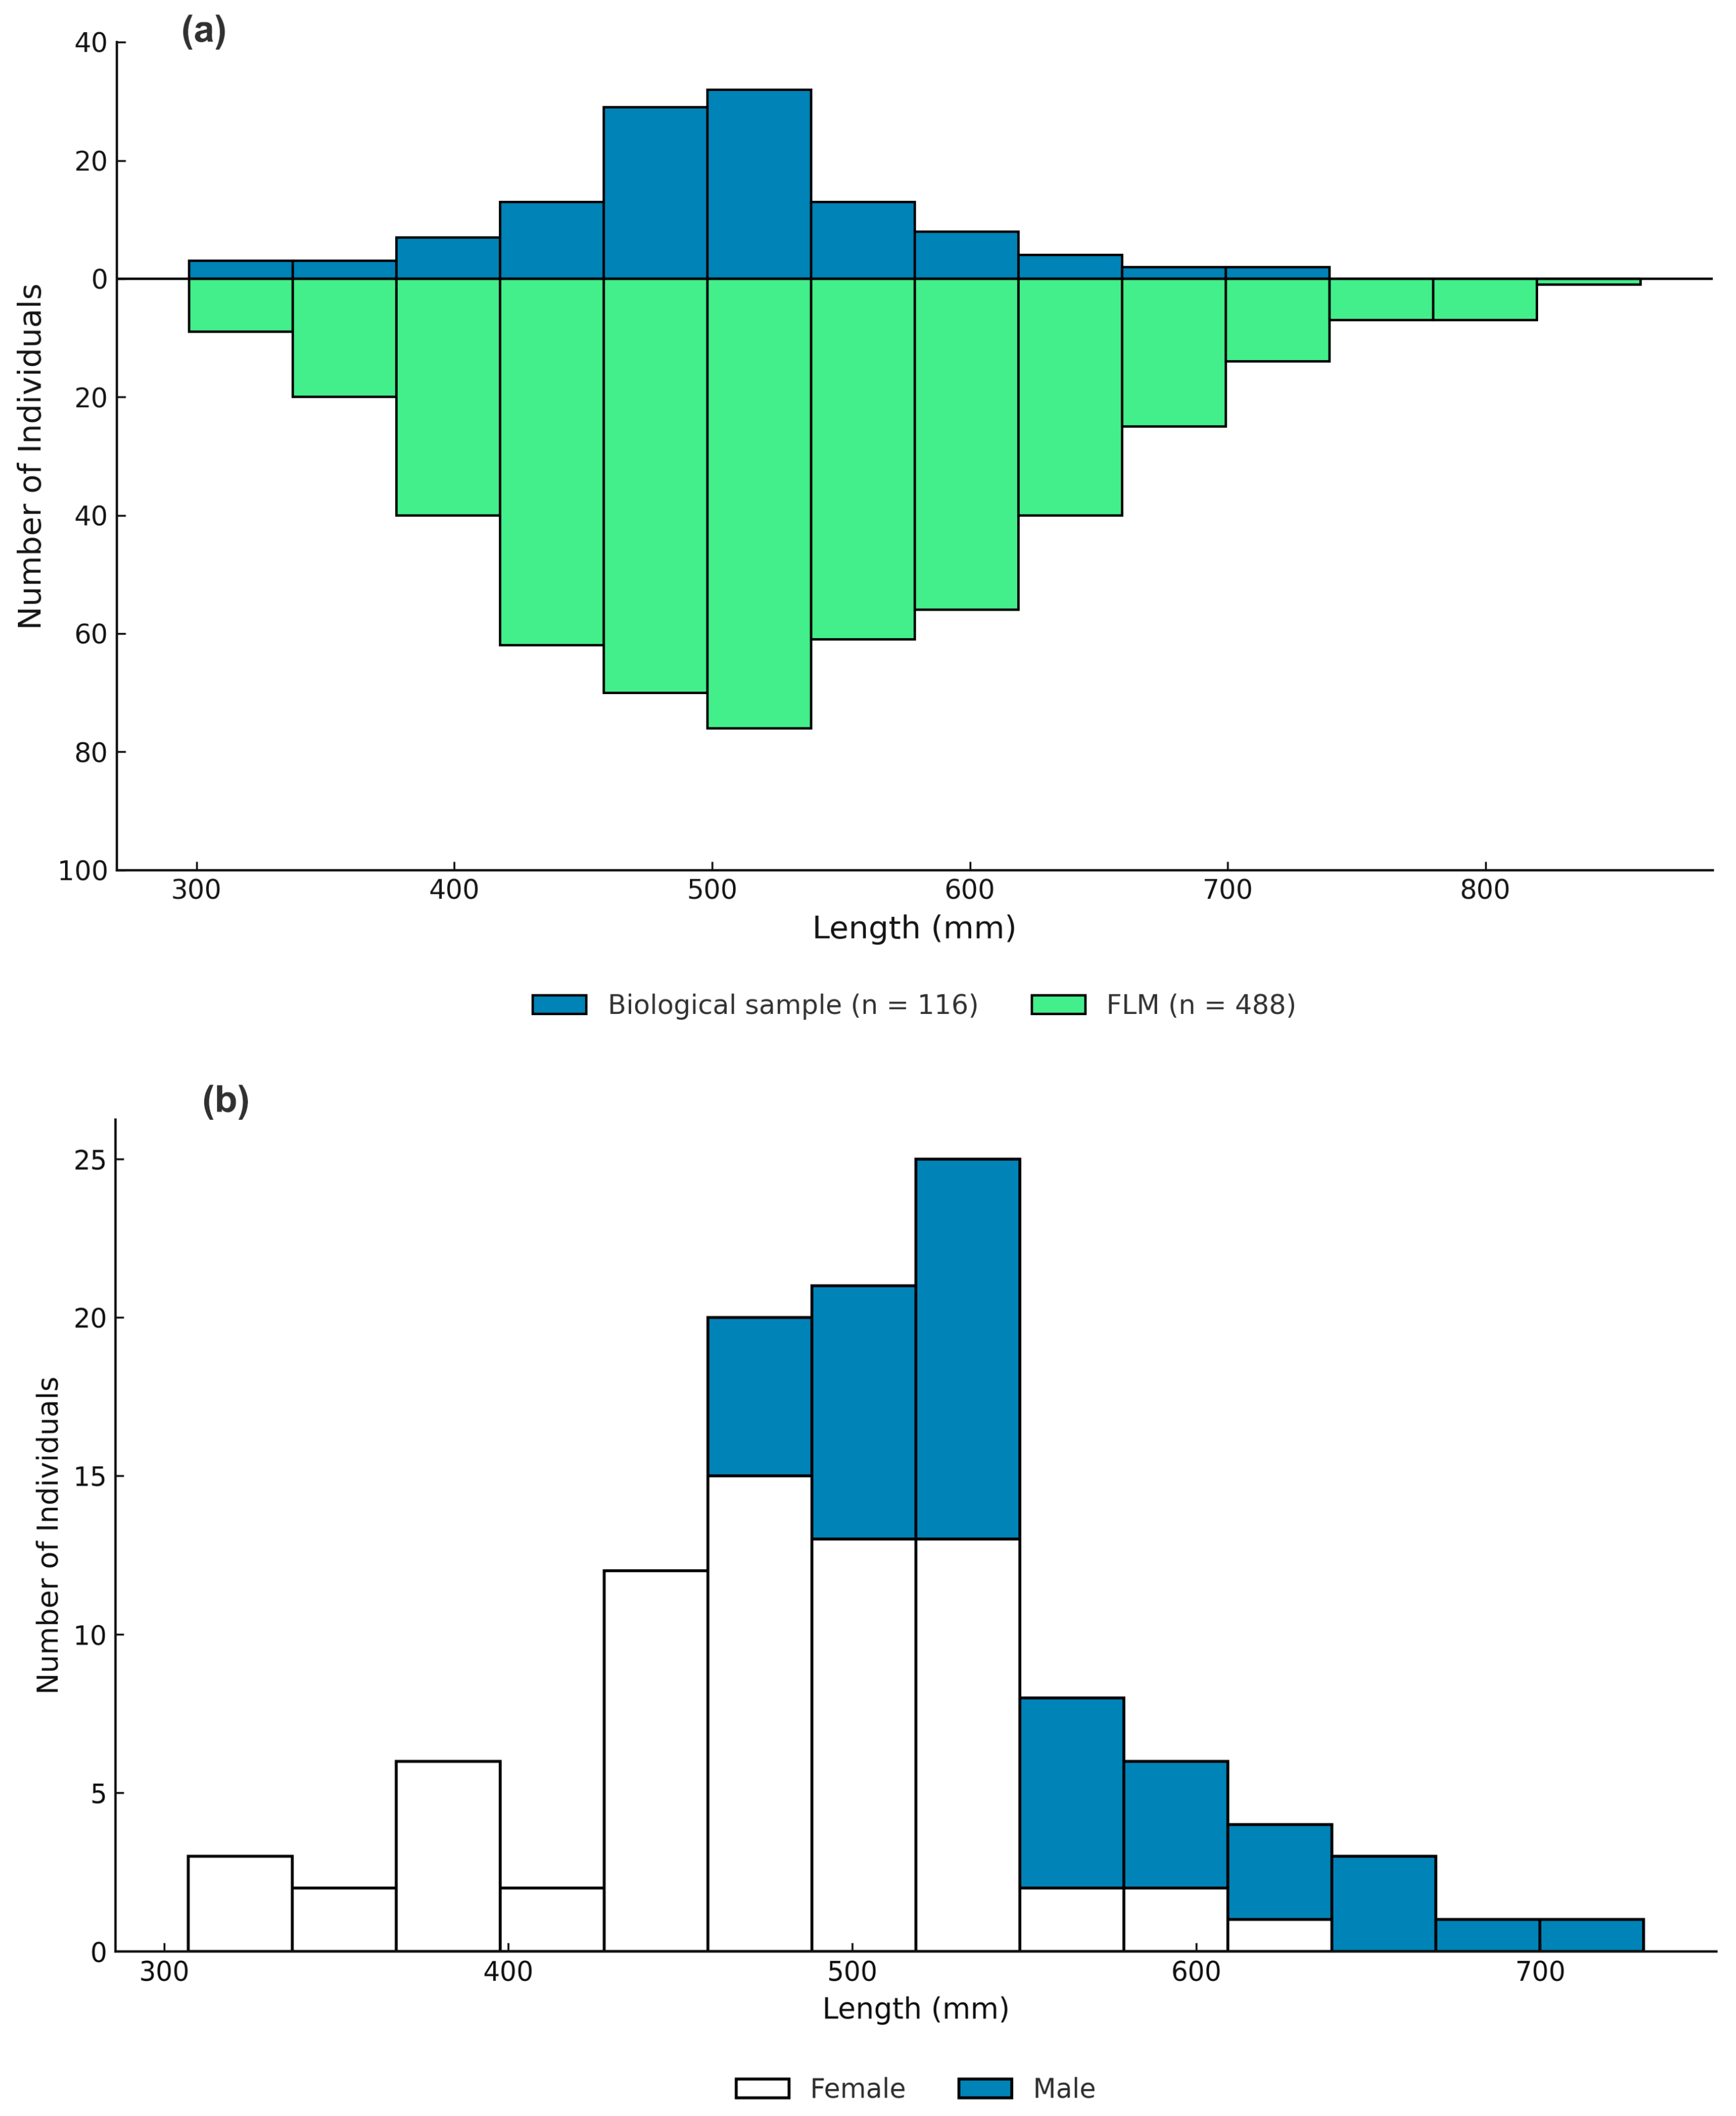
A total of 488 E. fuscoguttatus measured from the fish landing monitoring (FLM) ranged from 297 to 860 mm TL, with a mean of 528 mm, a median of 513 mm, and a mode of 500 mm (Figure 2). The 116 specimens collected for biological analysis ranged from 307 to 730 mm TL, comprising females of 307–610 mm and males of 480–730 mm, with a median of 500 mm and a mode of 530 mm. A two-sample t-test indicated that the mean length from the FLM data (528 mm) was significantly greater than that from the biological samples (500 mm; t602 = 2.69, p = 0.0073). A K–S test further confirmed that the length–frequency distributions differed significantly between the two datasets (K–S = 0.2046, p < 0.001), with the FLM samples containing a higher proportion of large individuals (>700 mm TL) than the biological samples (Figure 2).
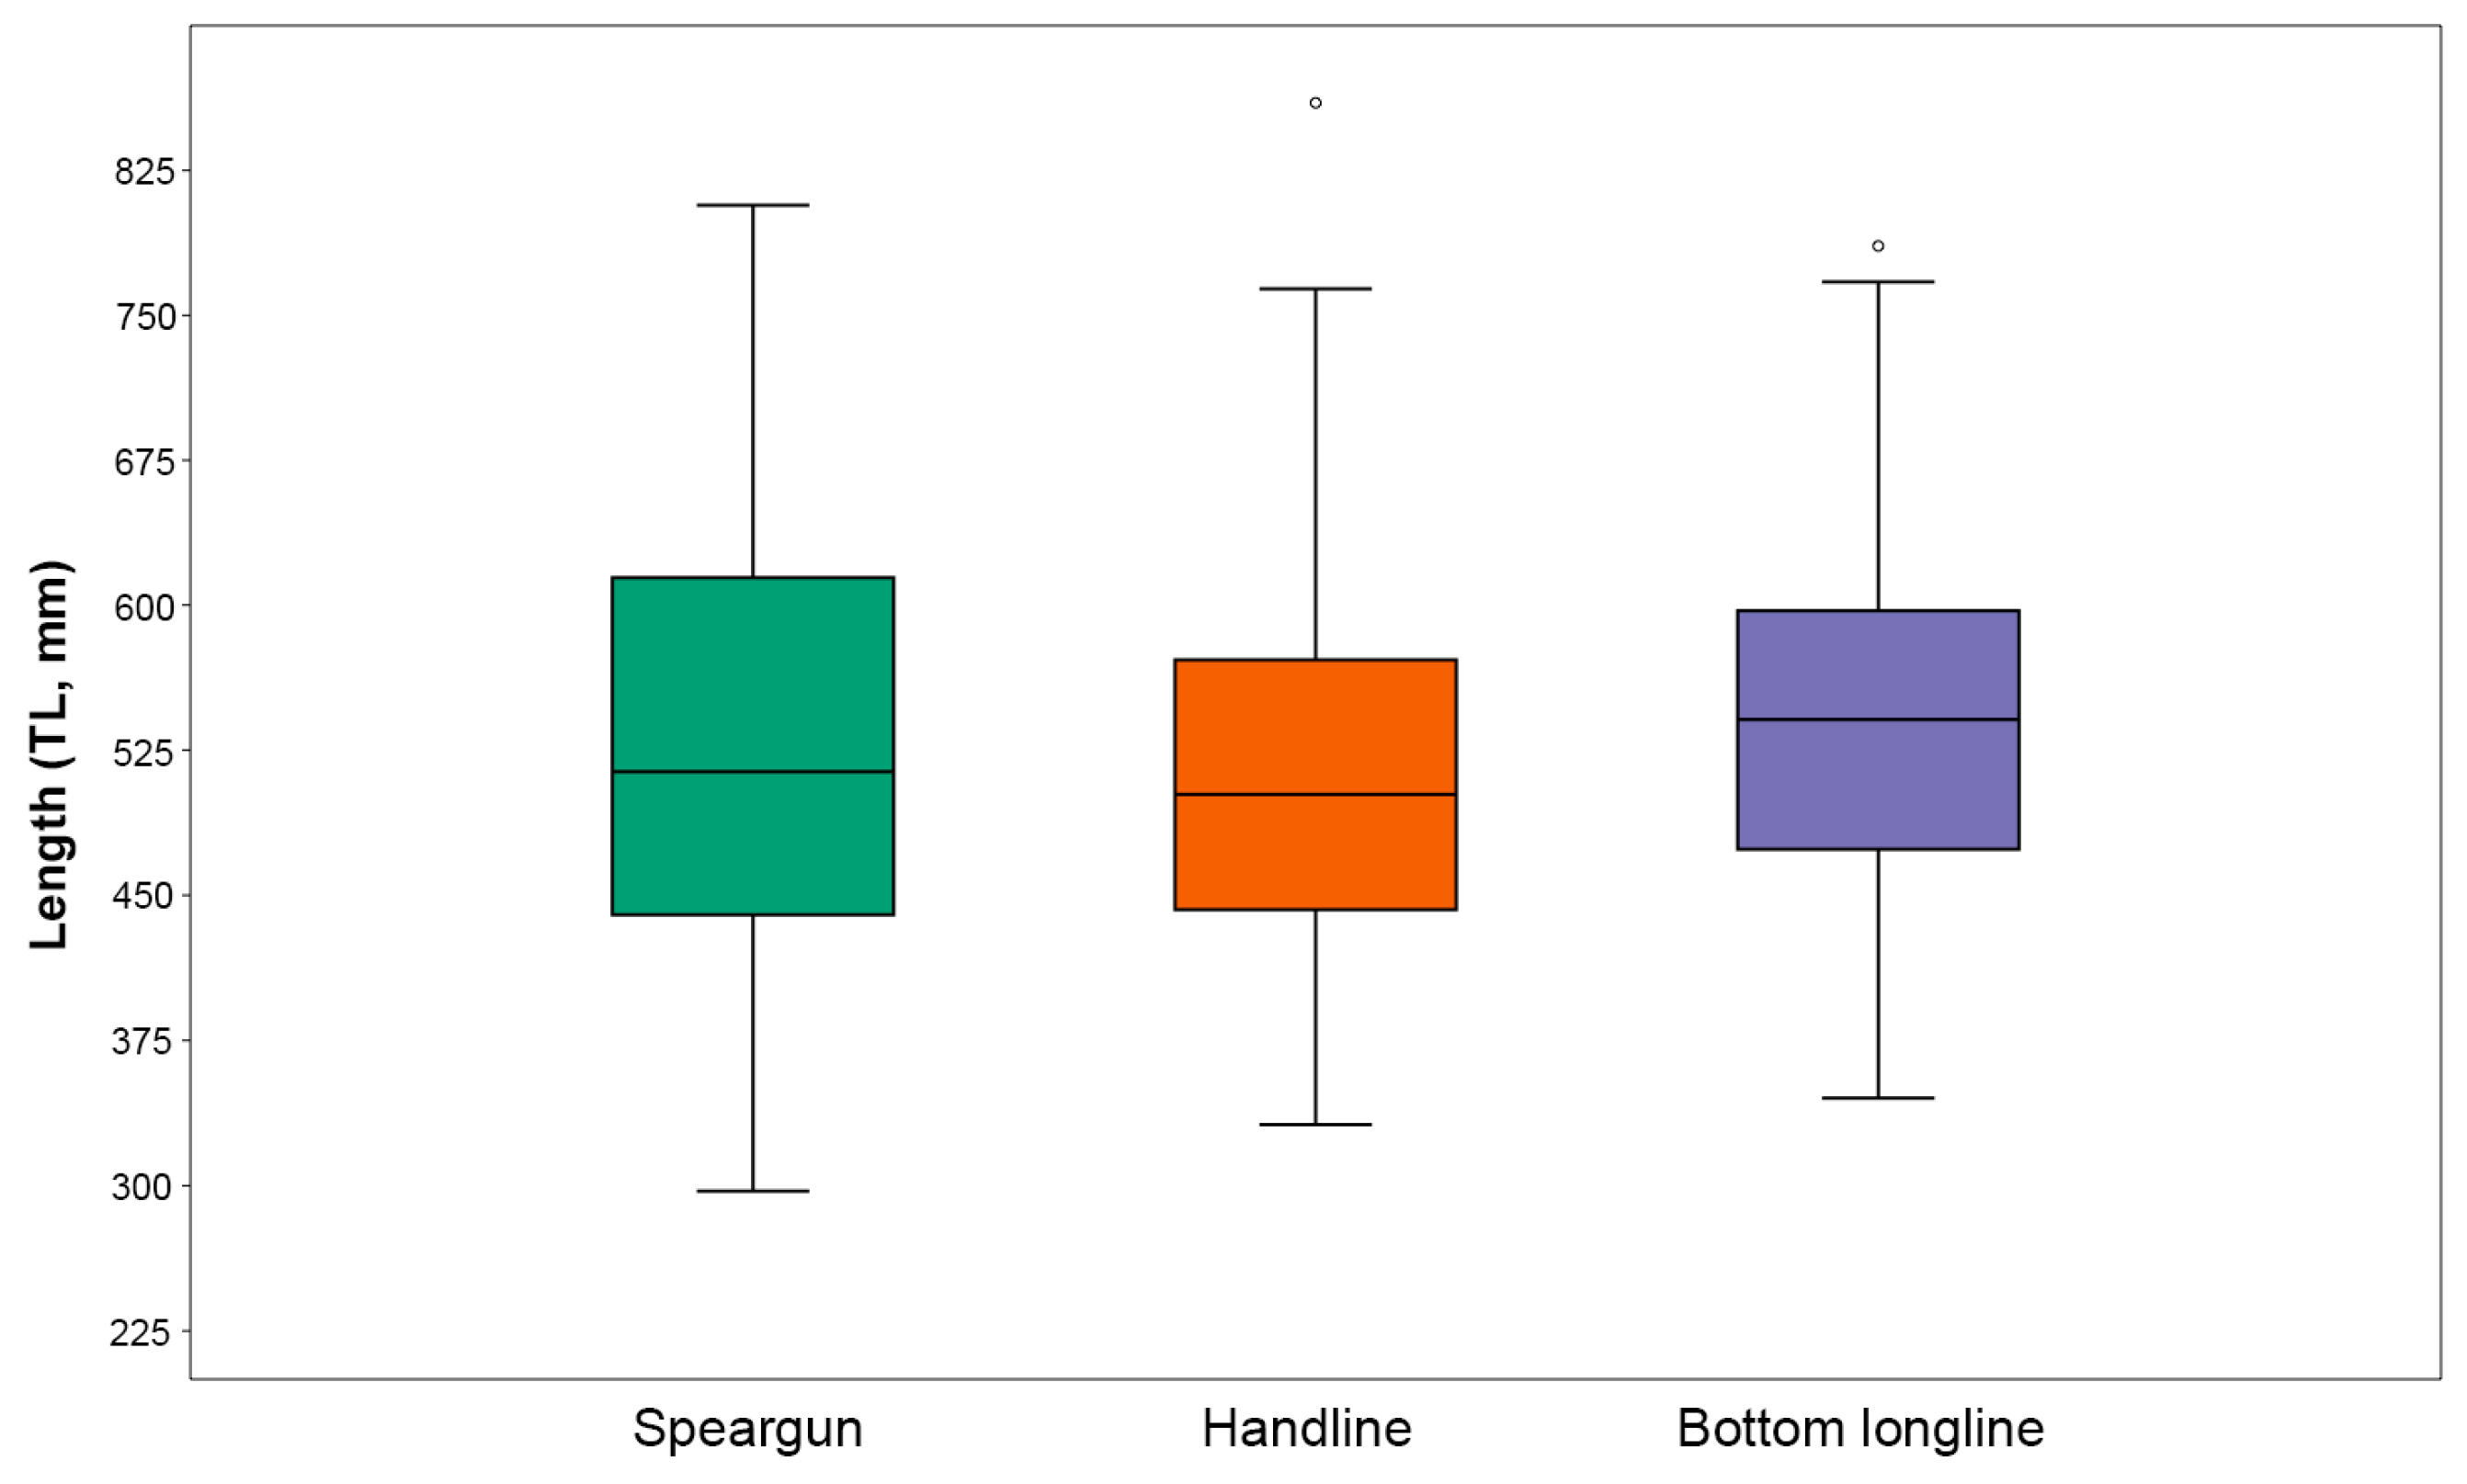
Of the 488 E. fuscogutattus from the FLM data, 469 (96.1%) were from spearguns, handlines and bottom longlines, while the remaining 19 catch records were from droplines and gillnets. The mean TL (±1 SE) of E. fuscoguttatus caught by spearguns, handlines, and bottom longlines were 525.6 ± 7.1 mm, 536.4 ± 21.1 mm, and 544.6 ± 9.2 mm, respectively (Figure 3). ANOVA showed no significant differences in the mean TL among these methods (F(2, 424) = 0.659, p = 0.518), and the Kruskal–Wallis test showed no significant difference in the median TL among fishing methods (KW = 2.142, p = 0.343). The largest fish (860 mm) was caught by handline and the smallest fish (297 mm) by speargun.

3.2. Biological Parameters

3.2.1. Length–Weight Relationship

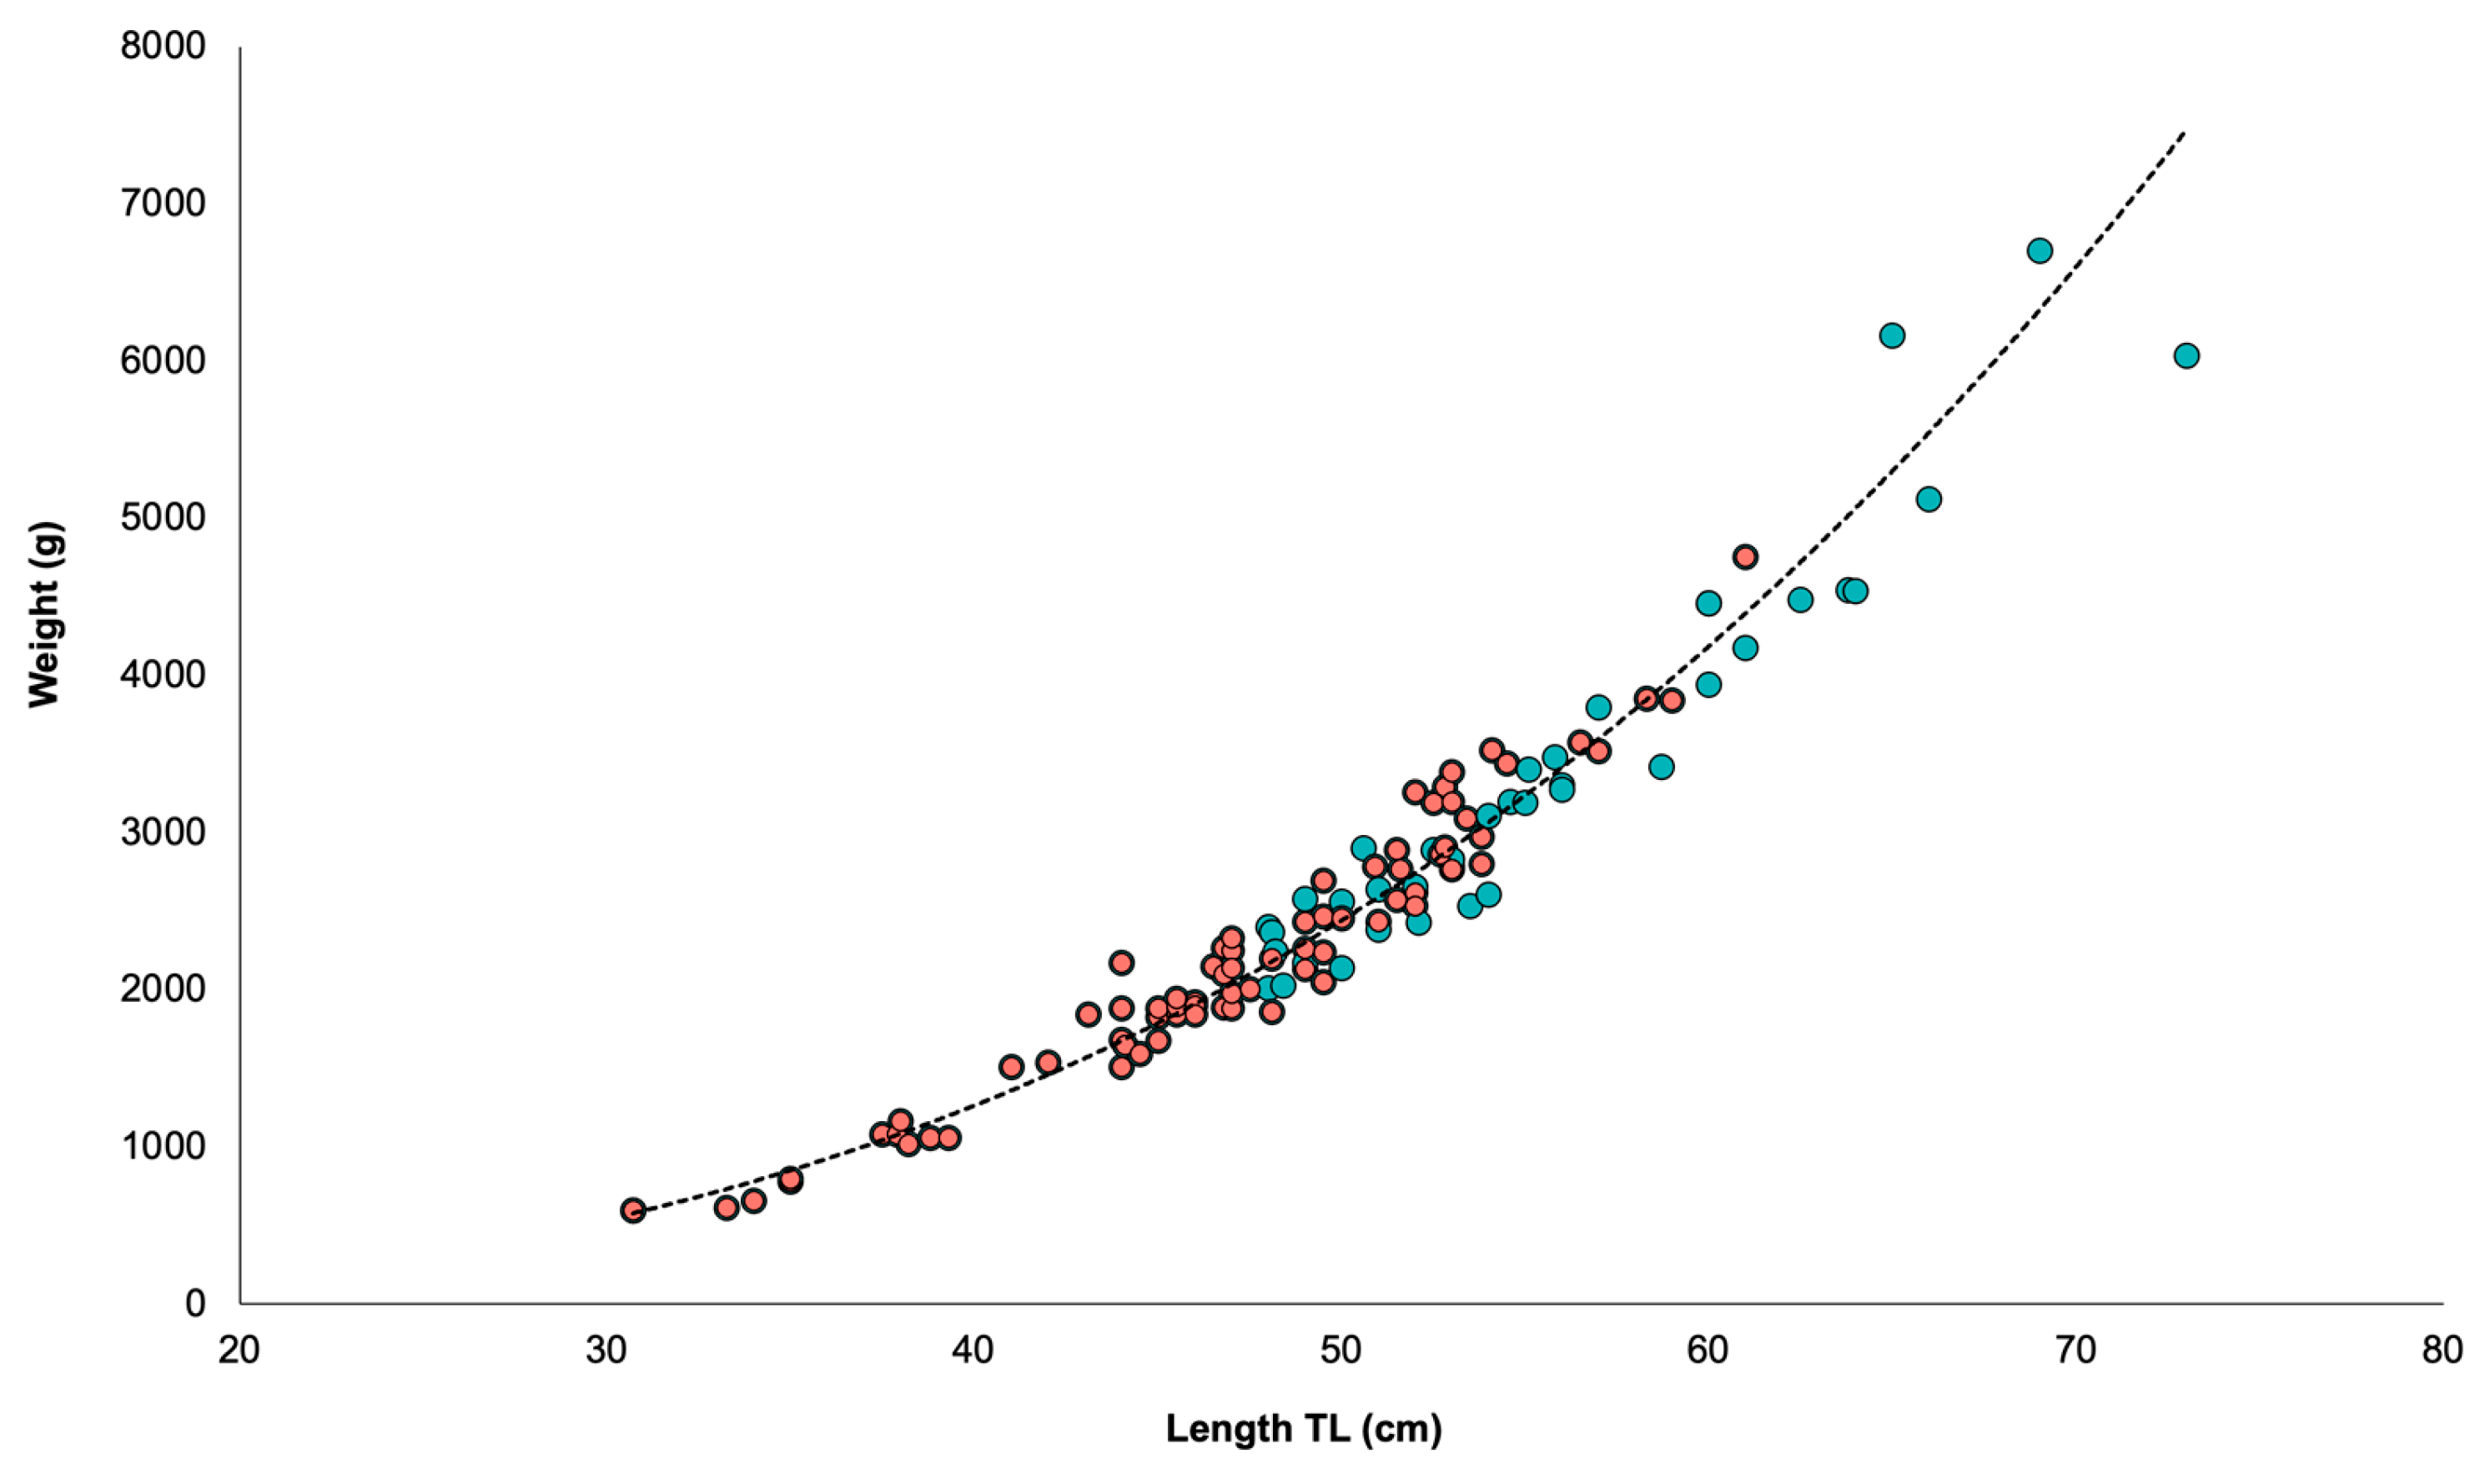
Epinephalus fuscogutattus from Saleh Bay ranged in weight from 596 to 6700 g. The longest female was 610 mm and weighed 4750 g, while the longest male was 730 mm, weighing 6030 g, and the heaviest male was 6700 g (690 mm). The smallest male was 480 mm TL and weighed 2010 g (Figure 4). The length–weight relationship of E. fuscogutattus (all sexes combined) was W = 0.02319TL2.956 (R2 = 0.945). A high coefficient b = 2.956 (95% CI: 2.852–3.060) suggests this species follows an isometric growth pattern (Figure 4). Only five of the 71 females were >550 mm.

3.2.2. Growth and Size at Maturity

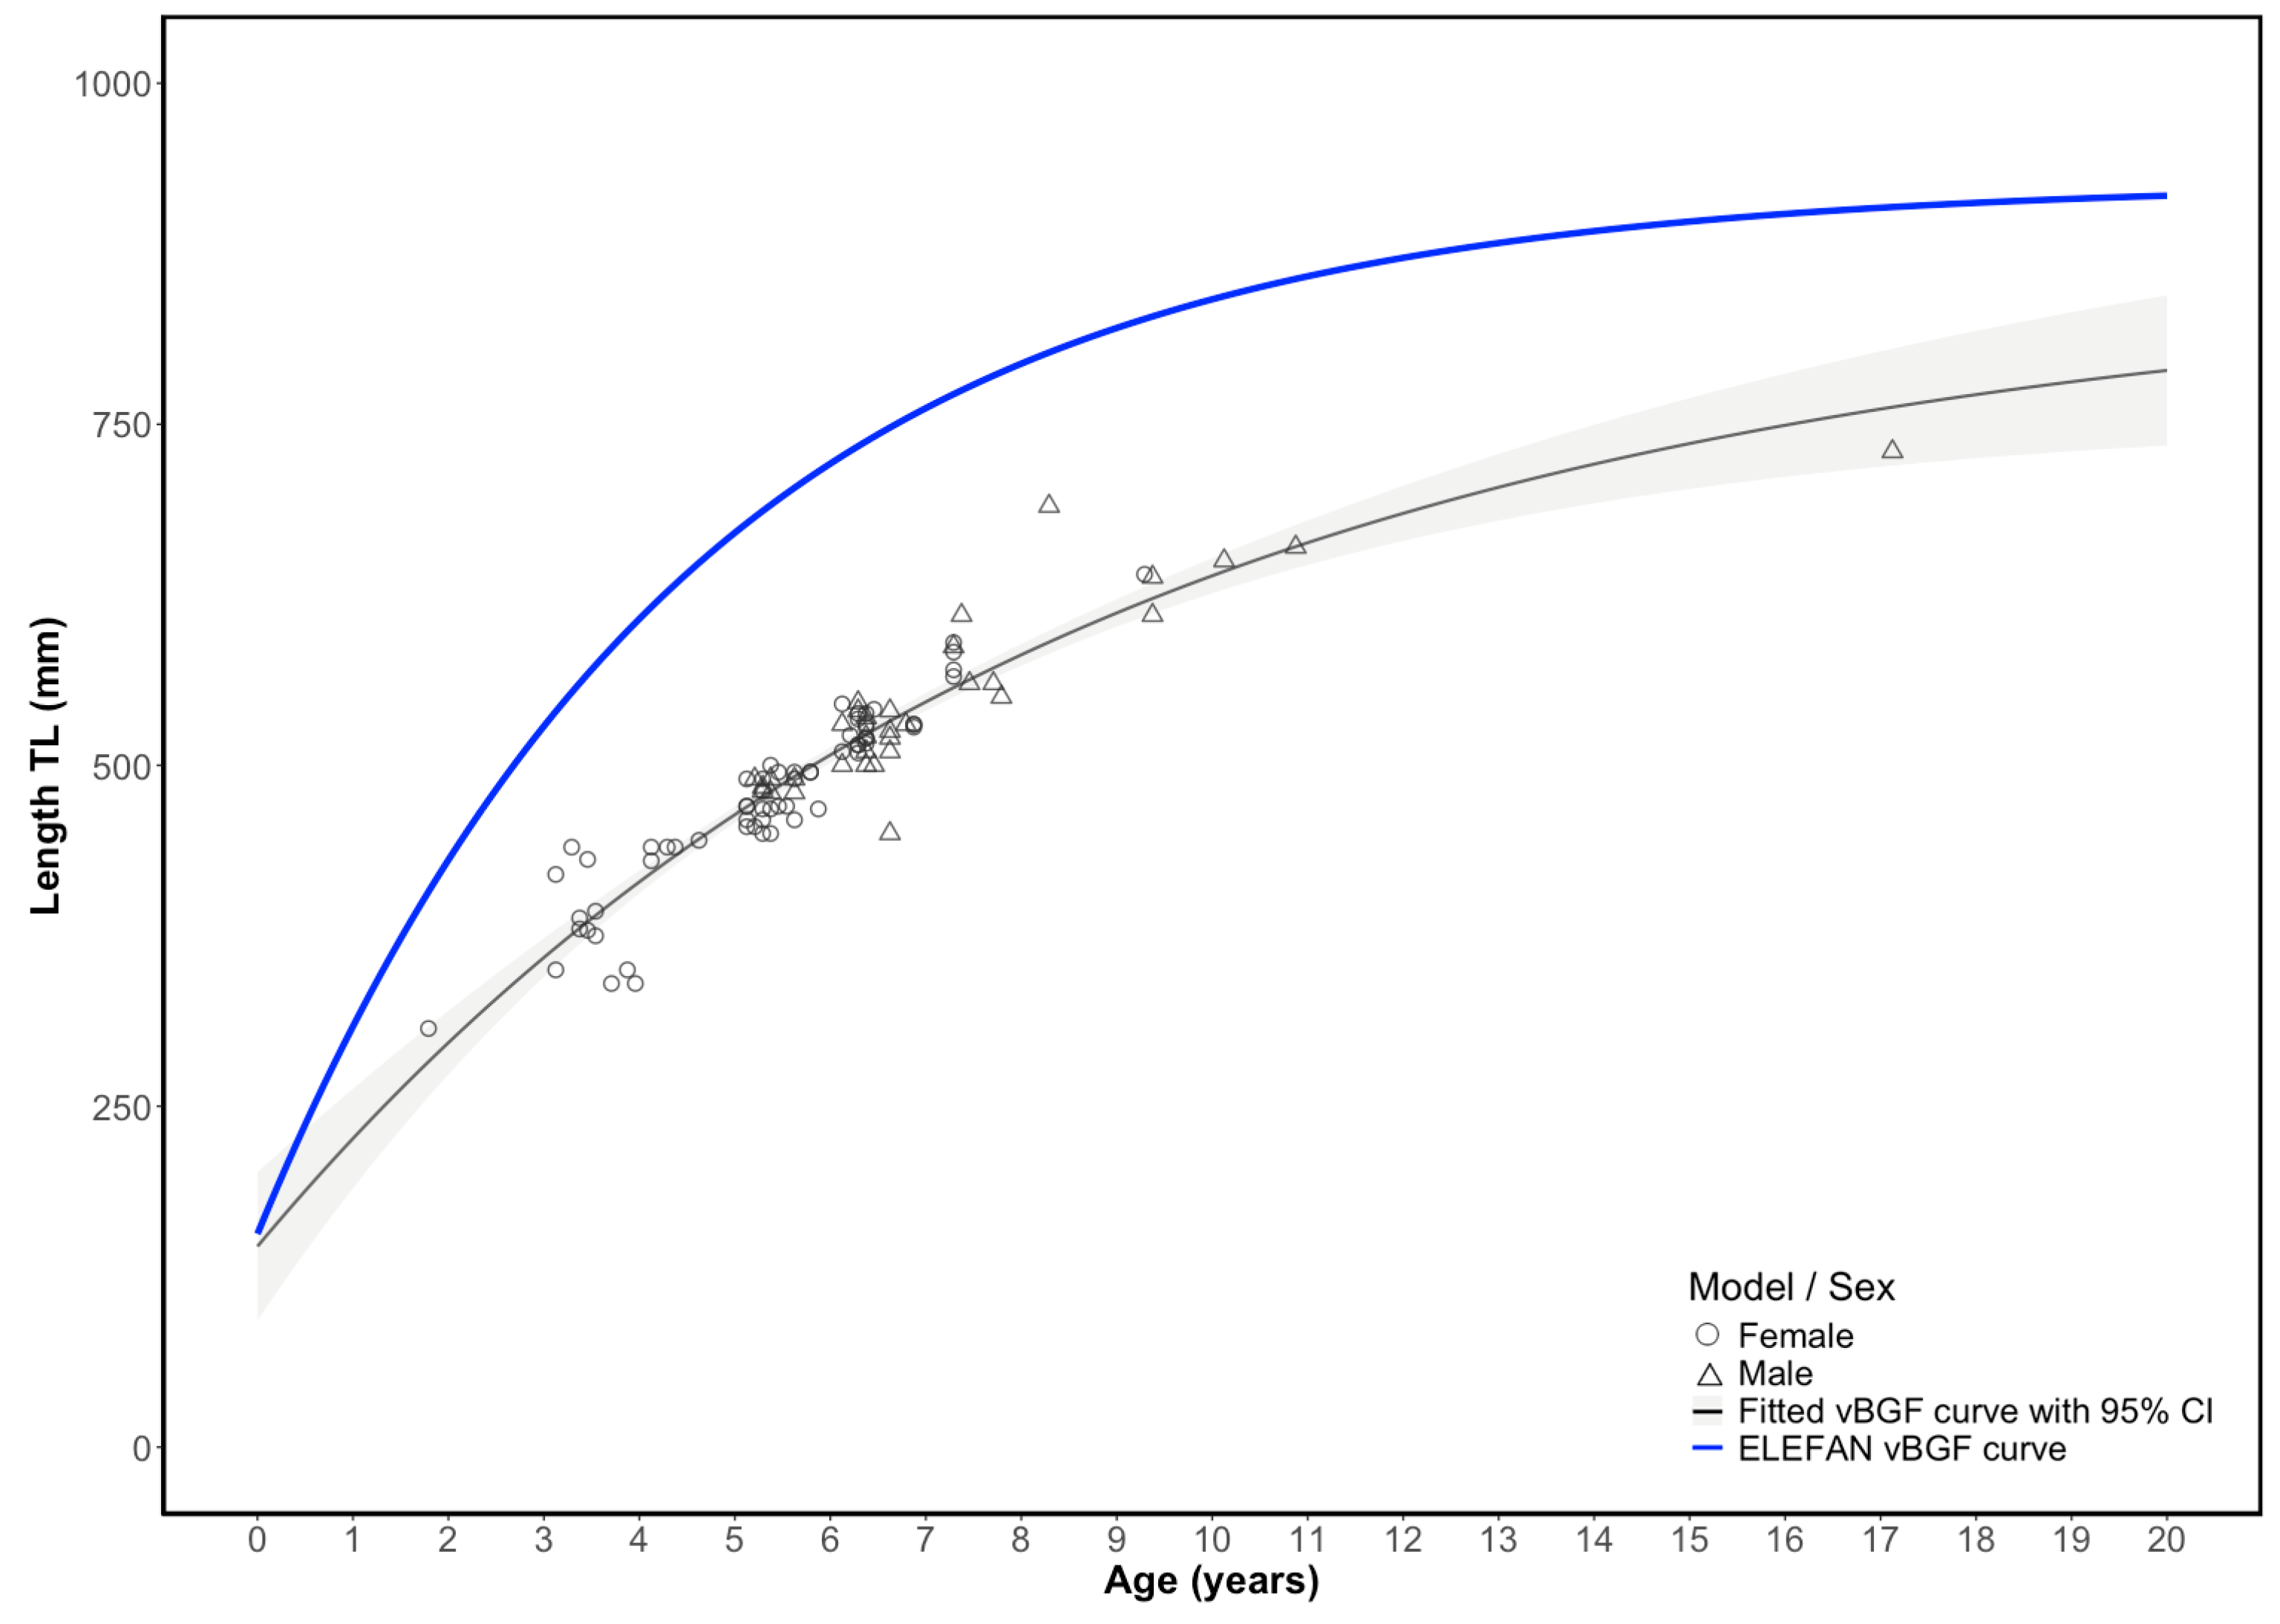
The number of annuli counted in the otoliths from 97 E. fuscoguttatus ranged from 2 to 18. The von Bertalnaffy growth curve fitted the data well (Figure 5). The estimated von Bertalanffy asymptotic length (L) was 855.9 mm, the instantaneous growth coefficient (k) was 0.12 years−1 (p < 0.001), and t0 = −1.59 years (Table 1; Figure 5). The maximum length (95% L) is reached at 26.2 years. The estimated von Bertalanffy growth parameters using historical catch data from the FLM were higher than those from otolith data. Estimates of L and k from the optimized ELEFAN method were both higher than the estimates derived from the von Bertalanffy growth equation fitted to inidividual lengths at age (Table 1). Because the ELEFAN model incorporates a broader size range and more accurately reflects the population structure, it was selected as the growth model for subsequent analyses.
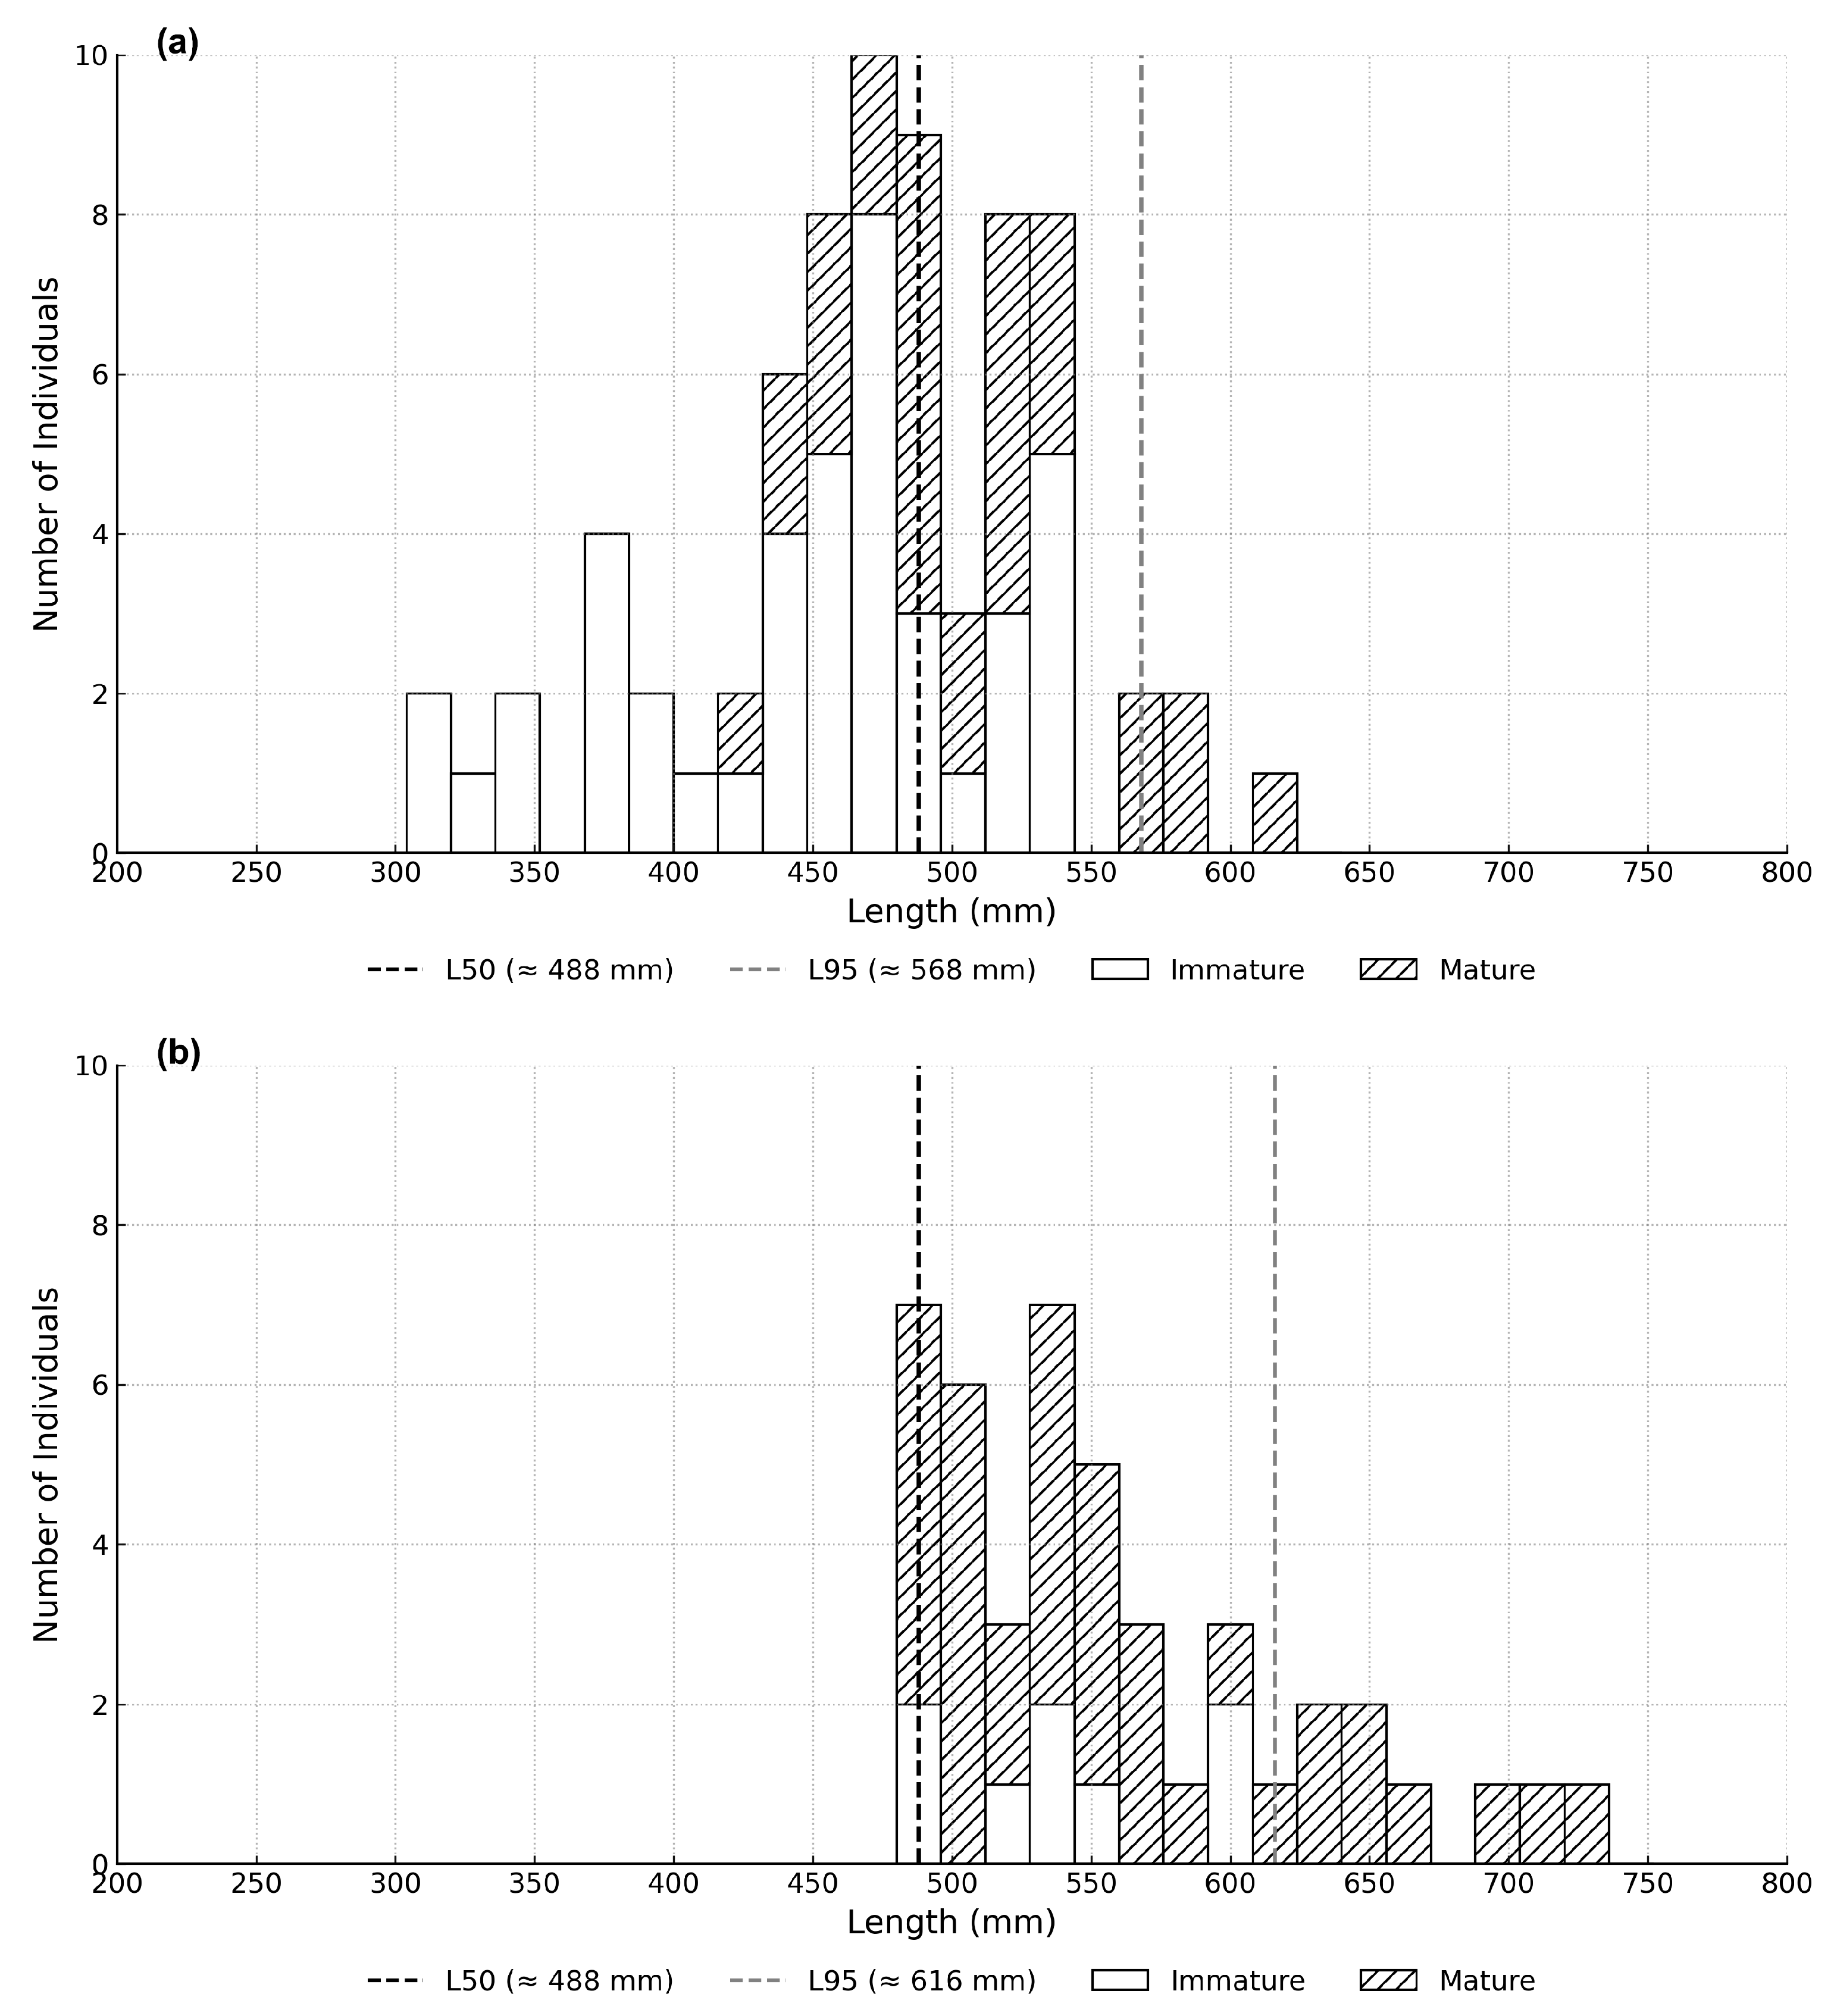
Length–frequency distributions and maturity compositions for E. fuscoguttatus are presented separately for females and males (Figure 6). Immature females ranged from 307–538 mm TL, while mature females ranged from 420–610 mm TL. The proportion of mature females increased from approximately 0.3 in the 440–455 mm length class to 0.6 in the 475–490 mm class, and reached 1.0 in the 557–573 mm class, indicating that nearly all females larger than 560 mm TL were mature. The estimated lengths at 50% and 95% maturity (L50 and L95) for females were approximately 488 mm and 568 mm TL, respectively. Mature males occurred only in the larger size classes, with L50 and L95 estimated at approximately 488 mm and 616 mm TL, respectively. These results indicate that male E. fuscoguttatus generally reached full maturity at larger sizes than females. A combined-sex maturity curve was also constructed to provide a population-level representation of maturity (Appendix B). The combined-sex ogive yielded an approximated L95 of 600.9 mm TL.

3.2.3. Estimation of Natural Mortality (M)

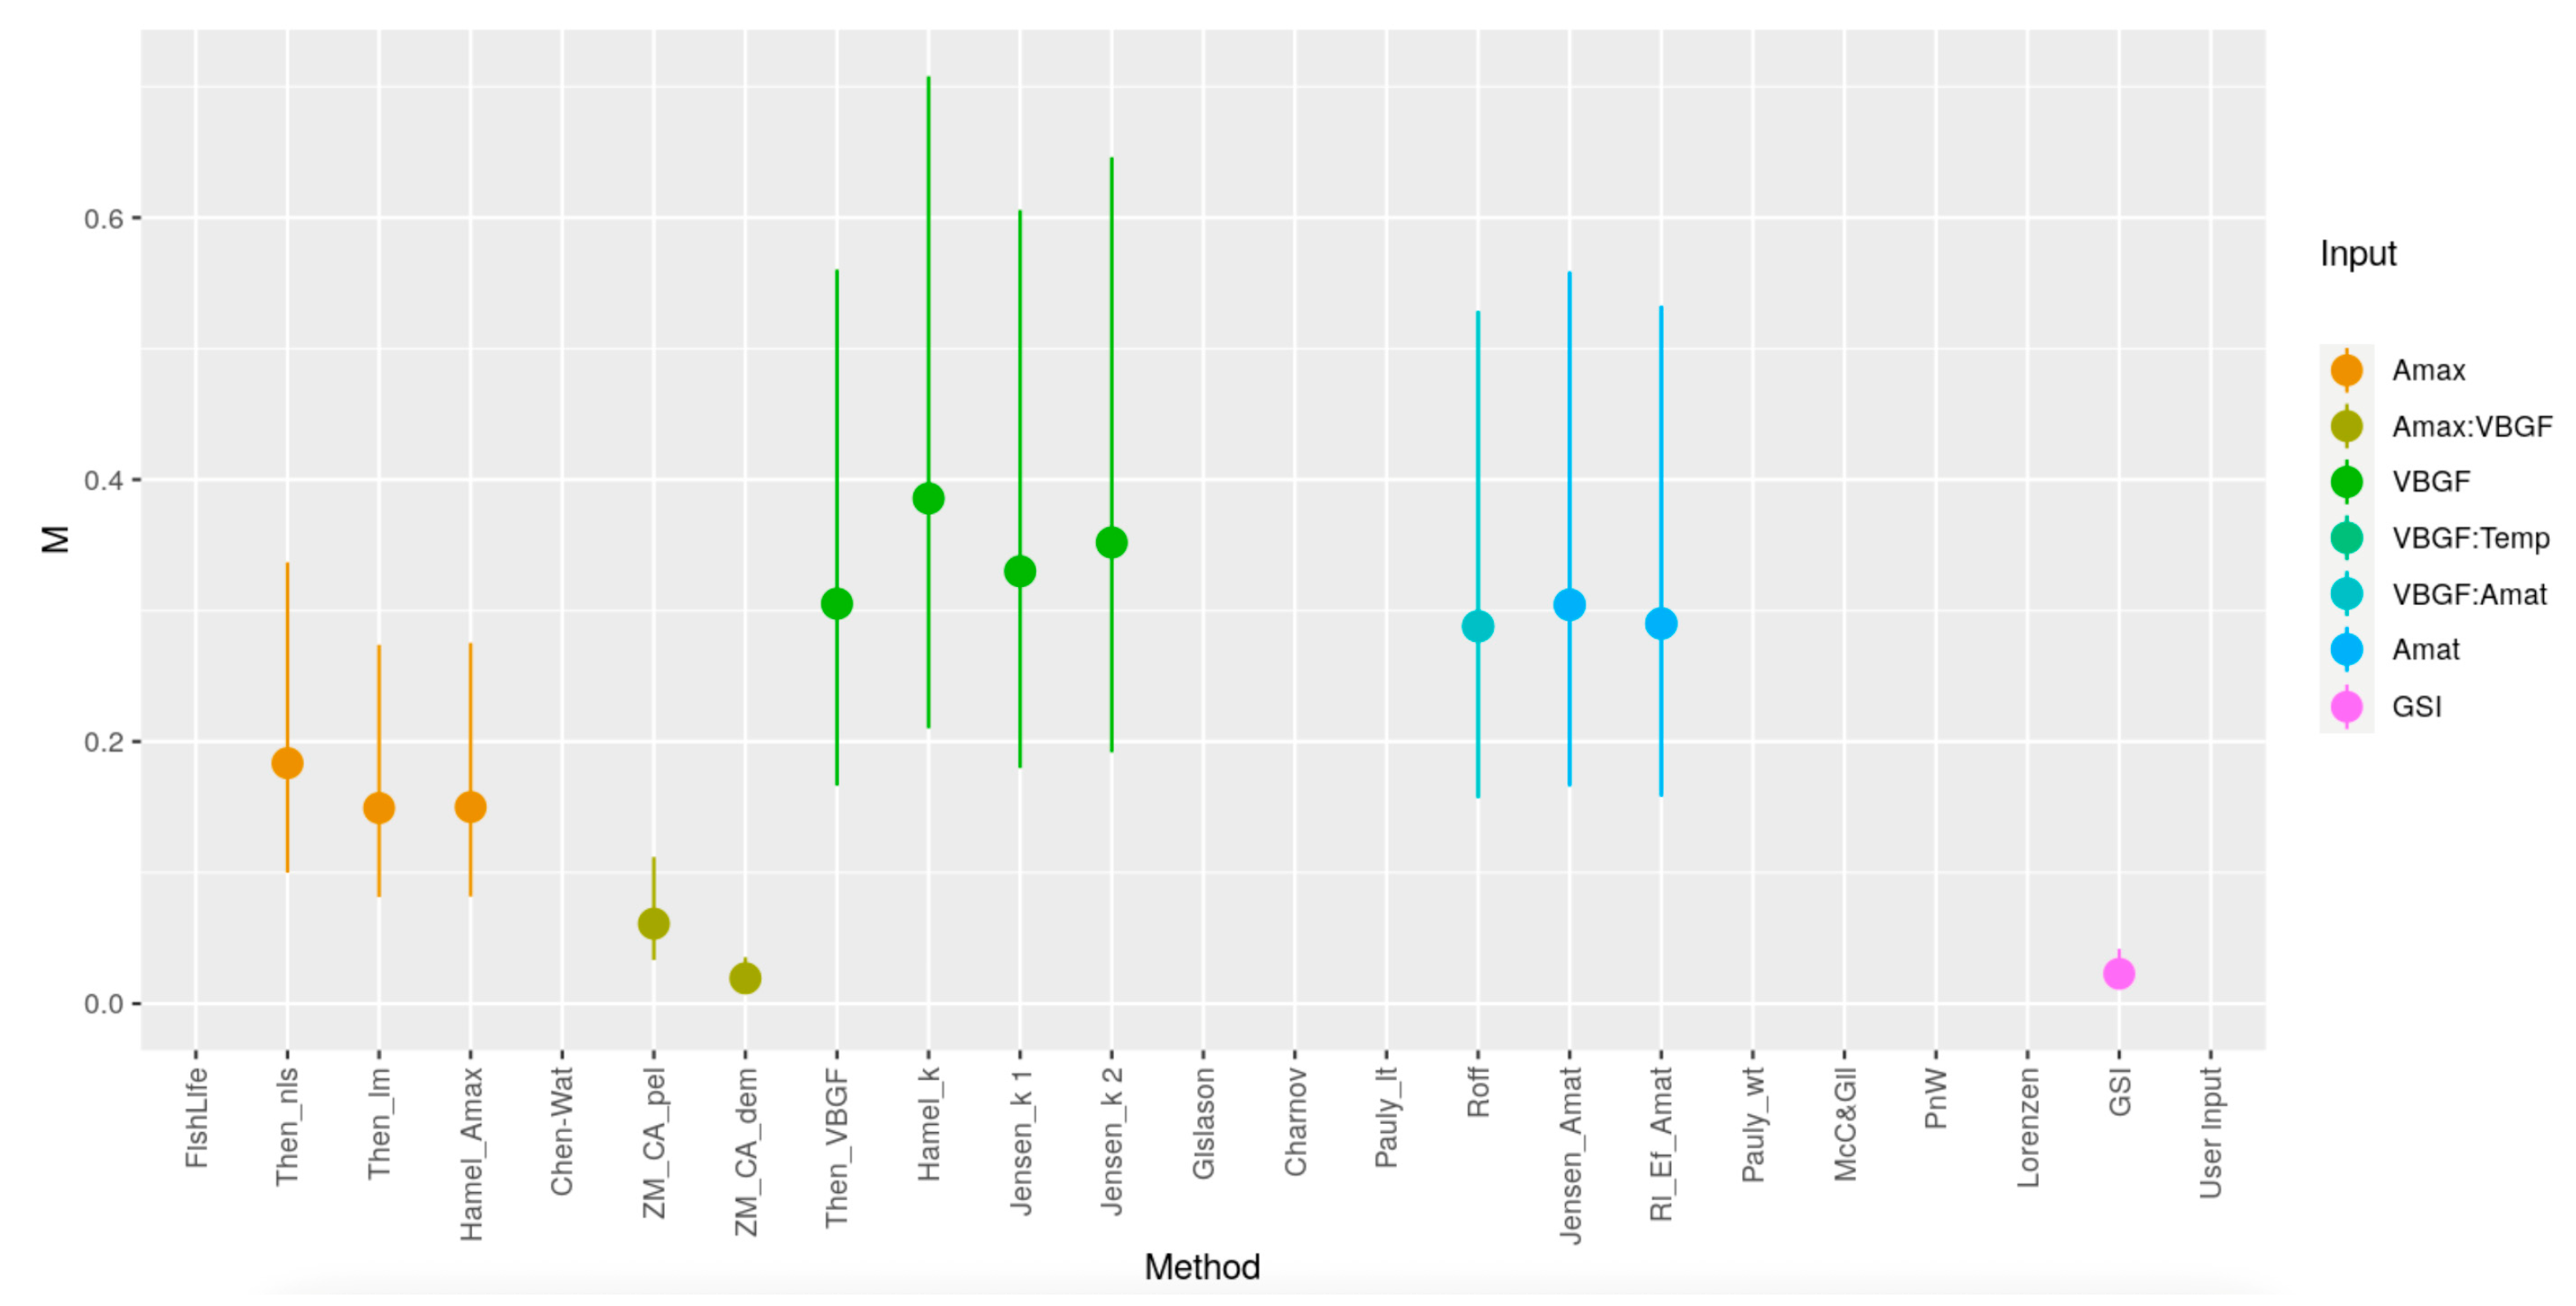
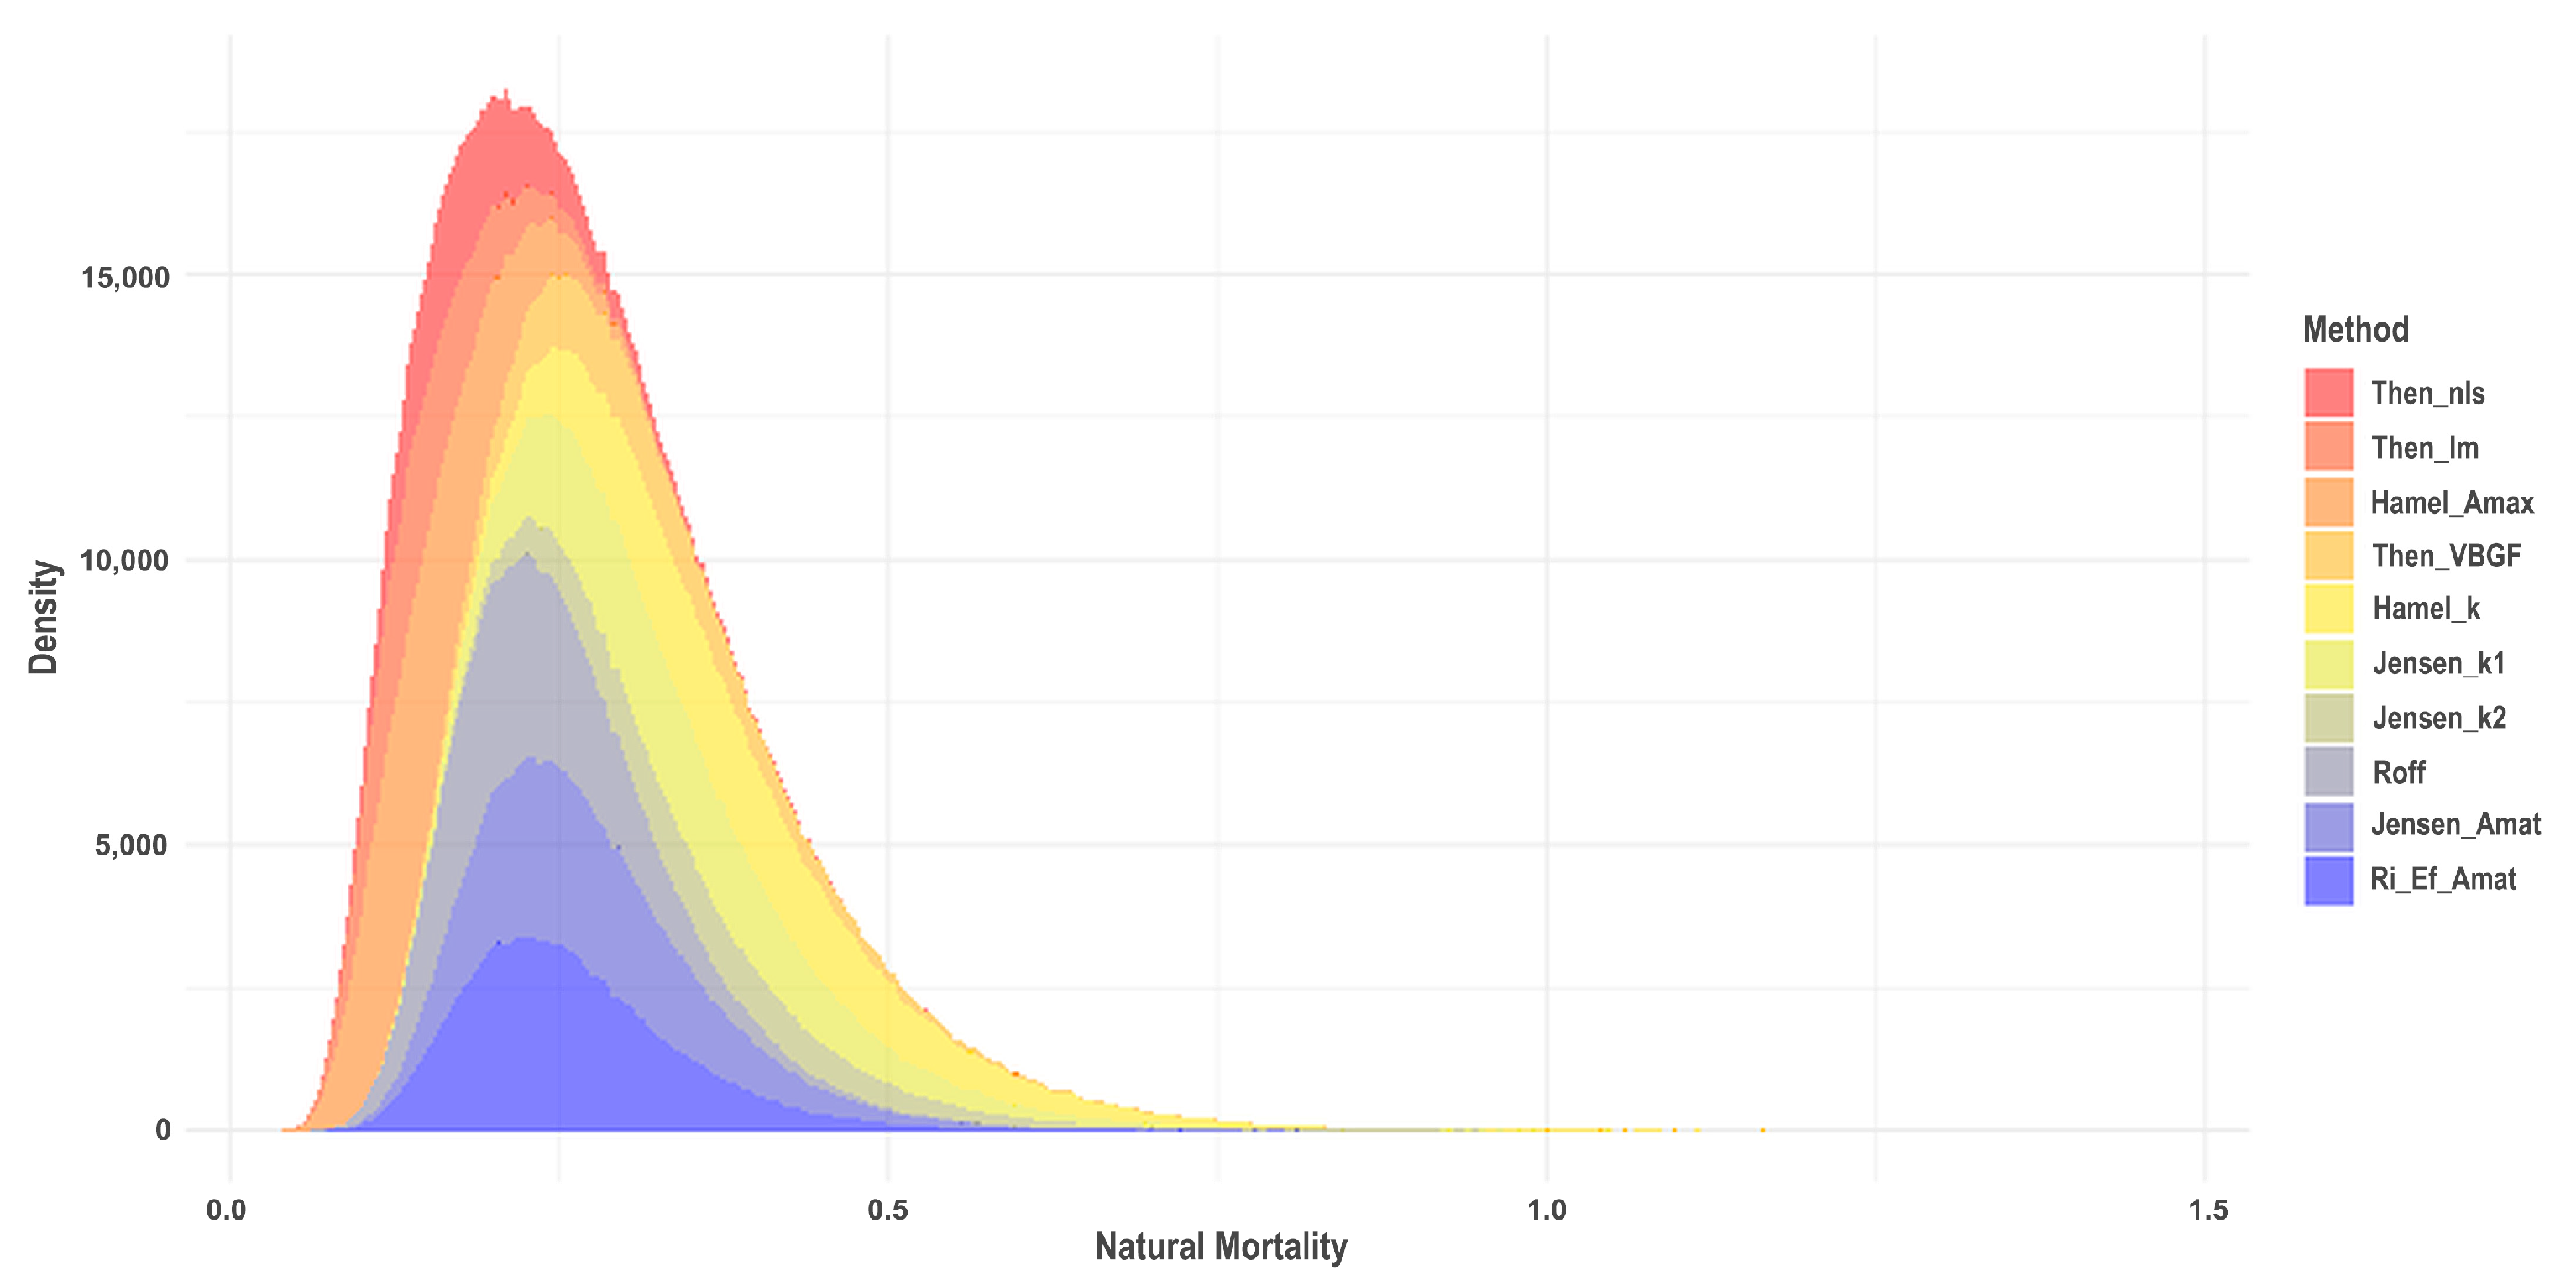
Using life history parameters in Table 2, the 13 methods employed to estimate the natural mortality (M) of E. fuscoguttatus yielded values ranging from 0.02 year−1 (ZA_CA_dem method) to 0.38 year−1 (Hamel_k method); (Figure 7). Age-based methods (Then_lm, Then_nls, and ZA_CA) showed a consistently lower estimate of M (ranging from 0.02 to 0.18) than the length and vBGF-based methods (Figure 7). Three methods (ZA_CA_dem, ZA_CA_pel, and GSI) had far lower estimates of M, ranging from 0.02 to 0.06 year−1, than the other 10 methods, which were all >0.16 year−1, and were excluded from the composite calculation of M. The weighted calculation method of 10 M estimates resulted in a mean and median M of 0.29 and 0.27 year−1, respectively.

3.2.4. Estimation of Size Distributions and Spawning Potential Ratio

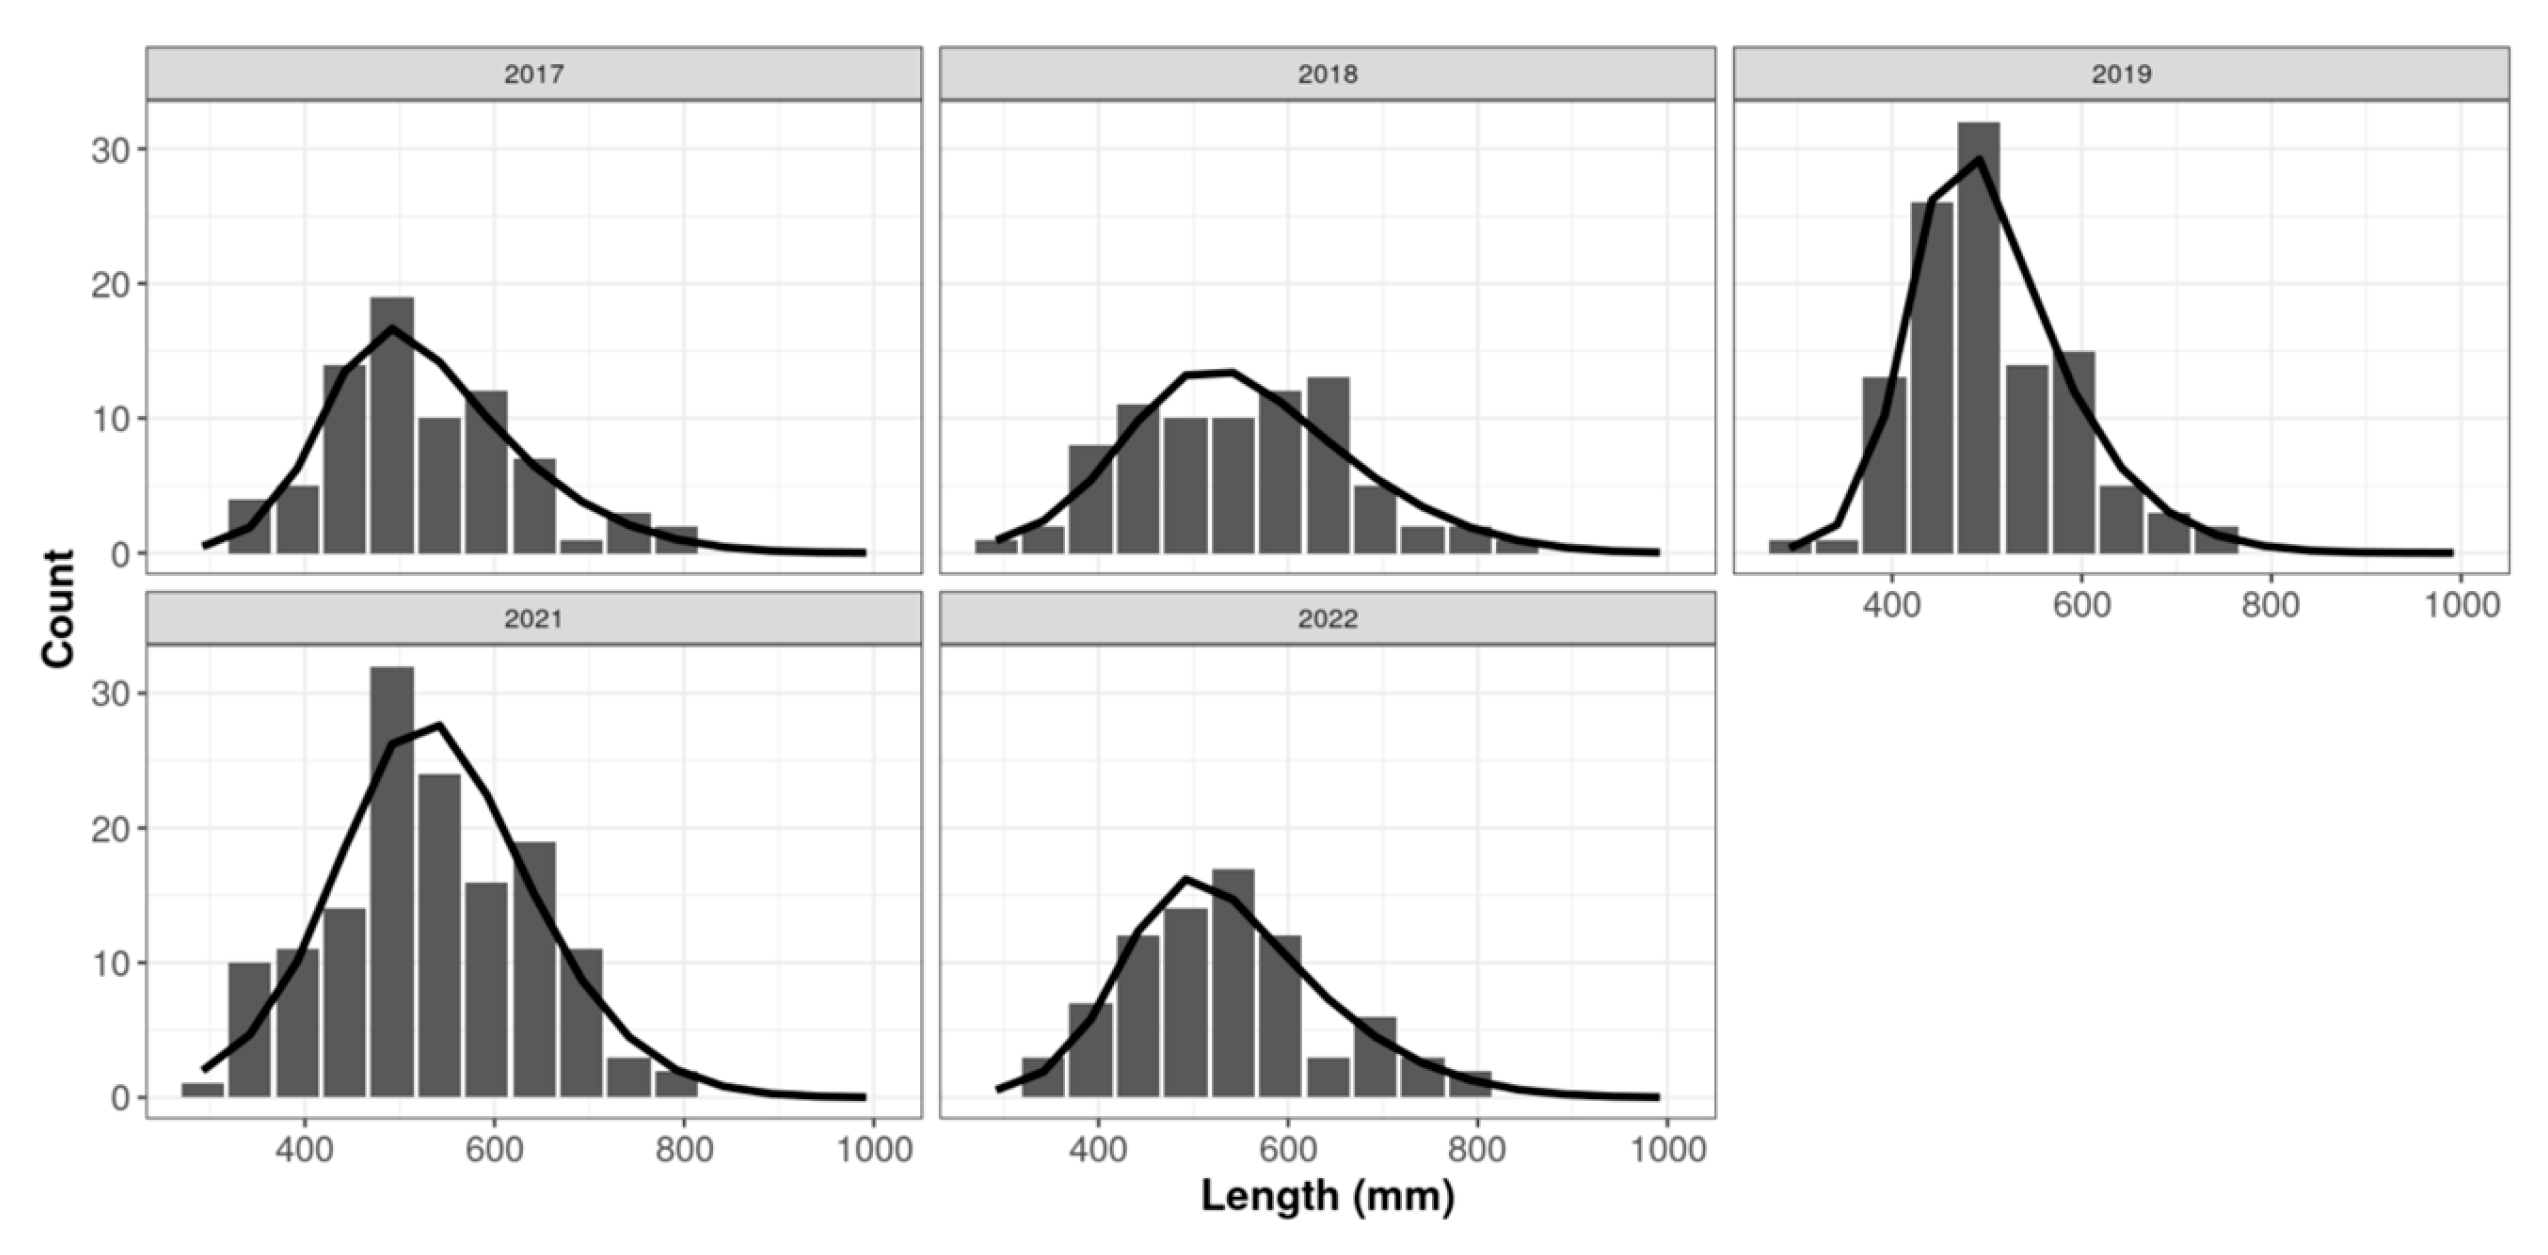
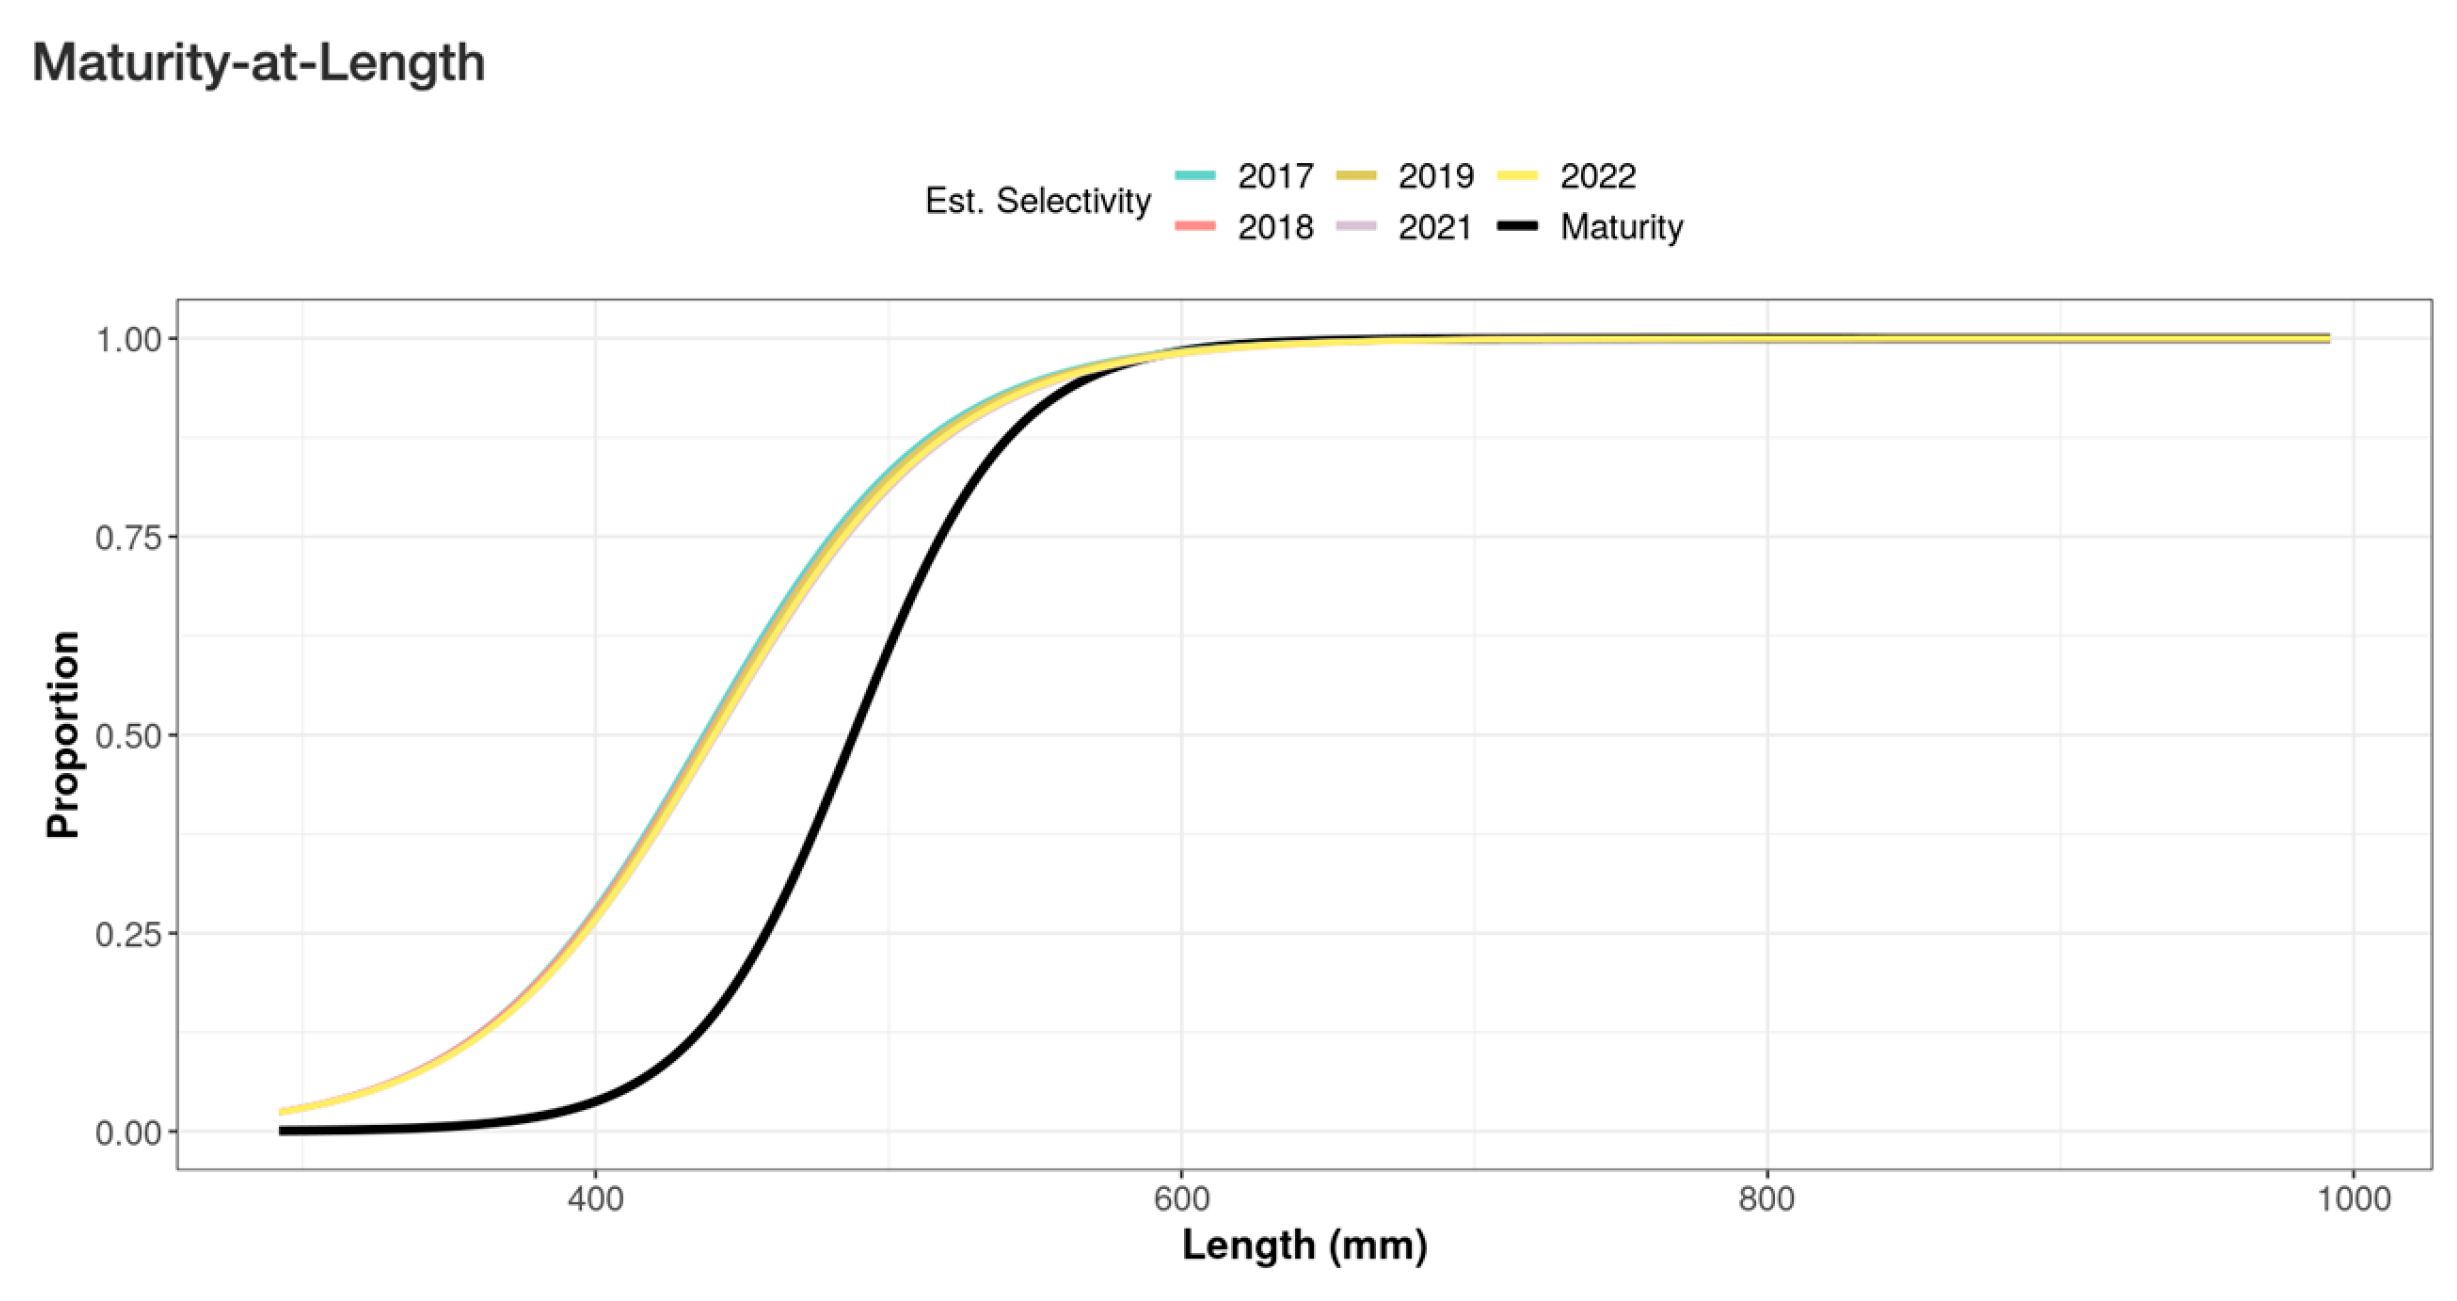
The length frequency distribution of annual E. fuscoguttatus catches, undifferentiated by sex, showed a unimodal distribution (Figure 8). Annual selectivity curves, developed using catch data from 2017 to 2022, reveal that the FLM fish are generally smaller than the length at maturity estimation curve derived from this study (Figure 9). The key life history parameters and input values used in the spawning potential ratio (SPR) analysis are summarized in Table 3. This is evident in the selectivity estimates and maturity curves, where the SL50 (50% selectivity) and SL95 (95% selectivity) values are smaller than the corresponding L50 and L95 values (see Figure 9). For example, the SL50 ranged from 423.9 mm in 2019 to 468.3 mm in 2021, with a mean of 440.1 ± 7.9 SE mm (Table 4).
The SPR estimates ranged from 0.13 in 2019 to 0.28 in 2018, with a mean (±1 SE) of 0.21 ± 0.02 (Table 4). The relative fishing mortality (F/M) estimated from the current study ranged from 1.36 year−1 in 2018 to 2.85 year−1 in 2019, with a mean of 1.99 ± 0.25 year−1 (Table 4).
To evaluate the influence of uncertainty in the maturity parameters, the SPR was also estimated under alternative maturity scenarios using sex-combined and male-based L95 values. These sensitivity analyses produced SPR values that were similar to the primary estimates based on the female maturity parameters, with mean SPR ranging from 22% to 23% and identical mean F/M values (1.98). The SPR values and F/M estimates were nearly identical across all maturity scenarios (Appendix C).
The mean size of E. fuscoguttatus from the FLM program ranged from 506 to 544 mm and did not differ significantly among years at the 0.05 probability level (F(4, 483) = 2.235, p = 0.064), nor did the length–frequency distribution differ significantly among years albeit the result was close to significant (KW = 9.46, p = 0.051). However, the mean and median TL of E. fuscoguttatus in 2019 (506 and 492 mm, respectively) were smaller than in other years (529–543 and 512–544 mm, respectively; Table 5).

4. Discussion

This study estimated several life history parameters of the brown-marbled grouper E. fuscoguttatus population in Saleh Bay, Indonesia using monthly catch data collected during a fisheries landing monitoring program (FLM) from January 2017 to December 2022 and biological samples collected from January 2020 to August 2021. The catch data was used to estimate von Bertalanffy growth parameters, which include the mean asymptotic length (L) and growth coefficient (k). The biological specimens were used to estimate the length at 50% and 95% maturity (L50 and L95), age at maturity, and gonadosomatic index (GSI). This study also used the maximum age of E. fuscoguttatus on the Great Barrier Reef, Australia calculated by Pears et al. (2006) [13], as one of the parameters for estimating natural mortality (M). The life history parameters were employed to estimate key parameters to re-evaluate stock health and the exploitation rate of the E. fuscoguttatus in Saleh Bay using the length-based spawning potential ratio (LB-SPR) method, providing essential input for its management. This study provides new life history estimation values for E. fuscoguttatus, offering valuable information for management and scientific authorities in Saleh Bay to evaluate the stock condition and refine management strategies for this species.

4.1. Estimation of Growth and Reproduction

Estimating the von Bertalanffy growth parameters from individual lengths at age yielded lower asymptotic length (L) and growth coefficient (k) values than those derived from FLM data using ELEFAN optimized method. This discrepancy is expected due to the smaller size range of the biological samples able to be obtained, with the maximum length of fish in the aged sample of only 730 mm TL, compared with 860 mm from the catch data. The estimated L from individual lengths at age (L = 855.9 mm) is higher than those reported in another study by Pears et al. (2006) [13] in the Great Barrier Reef, where the estimated L was 807 mm in fork length (FL). When converted to total length using the commonly applied multiplier (FL × 1.134), the Pears et al. estimate corresponds to approximately 915 mm TL, which is closer to, but still slightly higher, than the otolith-based L obtained in the present study. Comparisons with other regions also indicate broader size ranges than those represented in our biological samples. For example, in the Selayar Islands (Indonesia), the maximum observed lengths reached approximately 730 mm for females (n = 473) and 970 mm for males (n = 569) [29].
The comparatively smaller maximum size in our aged subsample (730 mm TL) likely contributed to the lower L estimate derived from otolith data. As a result, the growth parameter estimates derived from the FLM program catch data, which include a fuller representation of large individuals, are considered more representative of the population in Saleh Bay and were used in the estimation of natural mortality, stock condition, and fishing mortality.
The biological samples under-represented large individuals compared with the FLM data, which introduces uncertainty in the estimation of growth and reproductive parameters, particularly for males after sex change. Because the number of mature individuals was limited and unevenly distributed across size classes, it was not feasible to fit sex-specific logistic maturity ogives. Instead, the L50 was approximated by identifying the first length class in which more than half of females were mature. This approach produced an estimated female L50 of 488 mm TL.
Comparative estimates from other regions indicate that the maturity values obtained in this study fall within the expected biological range for E. fuscoguttatus across its distribution. Reported female L50 values include approximately 453 mm in the Selayar Islands [29], 482 mm in coastal Kenya [30] and 408 mm on the Great Barrier Reef [13]. These comparisons suggest that, despite sample size limitations, the maturity parameters derived for the Saleh Bay population are aligned with values documented in other regions. Although these comparisons indicate that the estimates fall within a biologically reasonable range for the species, larger and more balanced maturity samples are needed in future work to support fitting more robust, sex-specific maturity curves.
Despite the limitations of the estimates, this study suggests that E. fuscoguttatus in Saleh Bay may mature at a smaller size than previously reported and used for estimating the SPR [19]. The estimated L50 for E. fuscoguttatus in Saleh Bay from the current study was is 488 mm, ~91 mm smaller than the previous estimate of 577.8 mm [19], which was based on the empirical relationship of length at maturity with length frequency data of historical catch, a model proposed by Froese and Binohlan (2000) [31]. It is important to note that at 95% maturity, the fish has a higher proportion of male individuals (Figure 6) confirming the protogynous hermaphroditic characteristics of this species. We suggest that the L50 and the corresponding SPR estimated in the present study more closely reflect the actual conditions in Saleh Bay than previous estimates.
The interpretation of the maturity estimates also requires caution because E. fuscoguttatus is a protogynous hermaphrodite. Sex-specific L50 values were estimated, and both yielded similar results (L50 = 488 mm for females). However, the number of mature males and females was too limited to support the construction of reliable sex-specific maturity ogives or to apply a sex-specific maturity schedule in the SPR analysis. As a result, a single maturity threshold (i.e., that for females but also the one based on limited numbers of males) was used to represent the size at which approximately half of the population is reproductively mature. This should be considered a practical, population-level indicator rather than a precise maturity benchmark for either sex.
This reproductive biology also has implications for interpreting the SPR results. The LB-SPR model assumes that all mature individuals contribute equally to spawning, but this may not fully apply to protogynous groupers. Individuals undergoing sex transition are temporarily inactive reproductively, and heavy fishing on larger fish can reduce male abundance, causing potential sperm limitation even when female biomass is adequate [32,33,34]. These factors could lead to higher apparent SPR values than the true spawning potential. Although these processes could not be modelled with the available data, acknowledging them provides important context when interpreting SPR estimates for this species.
Differences between the growth parameters obtained from otolith aging and those estimated using the ELEFAN reoutine mainly reflect the broader size range present in the FLM dataset, which includes larger individuals than the aged subsample. Previous evaluations of the LB-SPR method show that SPR estimates are strongly influenced by maturity schedules (L50/L) and the M/k ratio, and are less sensitive to moderate variation in L and k within plausible biological ranges [17]. The approximately 90 mm difference in L50 with the previous estimates for E. fuscoguttatus in the study area is therefore expected to have a much larger effect on SPR than the differences between the growth parameter sets.
From a growth parameter perspective, the lower k associated with the otolith-derived estimates would reduce M and increase F/M, producing somewhat lower SPR values. However, this effect is likely modest relative to the influence of L50, and the general conclusion that the stock is below the SPR target would remain the same. Additional aging data covering a broader size range would help refine growth estimates and support further evaluation of alternative scenarios in future assessments.
Overall, these findings provide a coherent biological context for interpreting the status of E. fuscoguttatus in Saleh Bay. The combined patterns of lower length at maturity, limited representation of large individuals in the catch, and the reproductive characteristics associated with protogyny suggest that the population may have a reduced capacity to sustain fishing pressure compared with previous assumptions. While some uncertainty persists in the underlying life history parameters, the available growth and maturity information consistently points toward constrained reproductive output. This biological interpretation is central to understanding the subsequent SPR results and indicates the need for cautious evaluation of stock condition.

4.2. Estimation of Life History Parameters for Stock Assessment

One of the life history parameters employed in assessing stock conditions using the LB-SPR method is the ratio between natural mortality and growth (M/k). A commonly used M/k value for fish follows the Beverton–Holt Life History of M/k = 1.5. However, this study sought to estimate the M/k value derived by independently estimating the M (natural mortality) and k (von Bertalanffy’s growth coefficient) values. Given the challenges and significant uncertainty associated with estimating M, 10 estimation methods were employed to derive M values. These estimates of M were subsequently aggregated to calculate both the average and median values of M.
The instantaneous natural mortality (M) is very difficult to estimate [35]. However, this is one of the most important life history parameters in length-based stock assessments [27]. The estimation of the M value from 10 different methods yielded two key figures: a mean of 0.27 year−1 and a median of 0.25 year−1. The selection of the estimated M value in this study is important as it is used to determine the M/k value used in subsequent stock assessments employing the LB-SPR method. Given the considerable variation in estimated M values resulting from the 10 methods employed (see Appendix D), the reliability of deciding between utilizing mean and median values remains uncertain. The mean is greatly influenced by extreme values and high variance, whereas the median proves unreliable in cases where the data lacks a uniform and symmetrical distribution [36]. Nevertheless, the disparity in the M/k value between the mean and median M values is relatively small (1.23 vs. 1.13). Consequently, the M/k value chosen for SPR estimation was established at 1.23. Using the higher estimate of M/k in this case is also preferable, as the common M/k value used in the SPR model when the M/k information is not available is 1.5 [17,35].
Variation in M has direct implications for the SPR results because the LB-SPR framework expresses exploitation through the F/M ratio; a lower M increases F/M and reduces SPR, whereas a higher M has the opposite effect. The considerable spread in M estimates across the 10 methods therefore contributes meaningful uncertainty to the absolute SPR values. Much of this variation stems from the fact that many estimators rely on shared theoretical relationships with other life history parameters. Methods such as Then_VBGF and Hamel_k incorporate von Bertalanffy growth parameters, which themselves were derived from historical catch data, adding an additional layer of uncertainty and reducing the independence of the estimators. Although these sources of uncertainty influence the magnitude of SPR estimates, they do not alter the overall conclusion that the stock remains below the reference point. The approach used here clearly documents how M was estimated and acknowledges these limitations, allowing future assessments to refine and replicate the method.
The estimated SPR of E. fuscoguttatus from the current study (mean = 0.22, range = 0.13 to 0.28) yields higher estimates than those reported previously for the five years between 2017 and 2021 (mean = 0.06, range = 0.05 to 0.07) [19]. The notable disparity between the two estimates is mainly attributed to the values assigned to L50 in the SPR estimation. The much smaller L50 value (488 mm TL) used in the current study than that used previously (577.8 mm TL) resulted in higher estimated SPR values. This pattern is consistent with earlier findings showing that LB-SPR estimates are strongly influenced by the maturity schedule (e.g., L50 and L95) and the M/k ratio, while being comparatively less sensitive to moderate variation in L or k within biologically plausible range [28].
The consistency of SPR estimates across alternative maturity schedules further supports this interpretation. Sensitivity analyses using sex-combined and male-based maturity parameters produced SPR values that were nearly identical to those obtained under the primary female-based maturity schedule (21–22%). The corresponding F/M estimates were also the same across all scenarios. These results indicate that, within the range of plausible L50 and L95 values for this species, the relative assessment of stock status is stable and not strongly affected by uncertainty in the maturity parameters.
For protogynous species such as E. fuscoguttatus, it is important to recognize that the LB-SPR metric reflects the reproductive output of mature females and does not explicitly incorporate the availability of functional males. Male groupers tend to be larger and more vulnerable to size selective fishing, which can reduce male abundance and create the potential for sperm limitation, even when female biomass appears adequate [37,38]. In addition, the transition from female to male involves a period of reduced reproductive activity while the gonad restructures; experimental studies in epinephelid groupers indicate that this process typically takes approximately 3–7 weeks [39]. Although the estimated male and female L50 values in this study were identical (488 mm TL), the LB-SPR model assumes that individuals contribute fully to spawning immediately upon reaching maturity and does not account for this temporary period of inactivity as some individuals transition from females to males. As a result, SPR may be slightly overestimated for E. fuscoguttatus, and this biological context should be considered when interpreting stock status for protogynous species.
Another factor that may have contributed to the very low previous SPR estimates is some of the model assumptions. The LB-SPR model assumes asymptotic selectivity at length (see [17]). However, it is noteworthy that preliminary data exploration revealed that 96.1% of the catches originated from three fishing methods, i.e., spearguns, handlines, and bottom longlines, that are each likely to have dome-shaped selectivity. Estimating the SPR from catch data derived from dome-shaped selectivity fishing gears is expected to underestimate the SPR value because the asymptotic selectivity assumption posits that the absence of larger fish in catch data is attributed to fishing mortality [28]. However, in reality, larger fish are likely not captured by dome-shaped selectivity fishing gears, e.g., by smaller hook size or inaccessible deeper water by spearguns where larger fish are likely to occur ([17,40].
To address the selectivity incompatibility issue, Hommik et al. (2020) [41] introduced a modification to the LB-SPR model to accommodate dome-shaped selectivity. This modification was applied to catch data for brown trout (Salmo trutta) from gillnet fisheries in Ireland. However, the LB-SPR model tested for dome-shaped selectivity in hook and lines and spearguns is currently unavailable. In addition, further work is needed to develop a dome-shaped selectivity model for the three primary fishing methods in Saleh Bay. For instance, the construction of this model requires information on catch at length associated with various hook sizes employed by handlines and bottom longlines in Saleh Bay, which, unfortunately, is currently unavailable. In addition, further investigation is also required as there is no compelling evidence to confirm the true dome-shaped selectivity of these three fishing gears. The absence of large-sized fish caught may not be attributable to the selectivity of the fishing gear. Still, it could instead be influenced by pattern of fishing effort, such as avoiding catching larger fish due to price considerations or limitation of the fishing methods in accessing deeper waters where larger fish typically reside. Therefore, this study can only estimate the SPR value using the standard LB-SPR model, which assumes asymptotic selectivity.
The lowest SPR estimated during the current study (0.11) was in 2019, the year in which E. fuscoguttatus had the smallest size range, mean, and median total lengths. Hence, the disparities in sizes at selectivity (SL50 and SL95) compared to L, L50, and L95 are greater in 2019 than in the other years, resulting in the lowest SPR estimate. The comparatively smaller size of E. fuscoguttatus caught in 2019 may be attributed to at least two factors: (i) a decline in stock conditions due to fishing mortality, and/or (ii) limited sampling during the FLM program. Examining the decreasing trend in SPR from 2018 to 2019 suggests that fishing pressure is also a likely cause of the reduced SPR. This is substantiated by the higher SPR in 2021 and 2022 compared to 2019. Notably, the COVID-19 pandemic in 2020–2021 led to a significant decline in fishing activities in Saleh Bay when there was a 10% decrease in the market value of fish [42]. The pandemic also caused delayed product distribution, reduced fishing trips and catches, and lower demand for fisheries products, which led to a decline in fishers’ income [42]. The drastic reduction in fishing pressure during the pandemic likely provides an opportunity for stocks to recover in the short-term, and this impact might be reflected in the higher SPR values of 2021 and 2022. The significant decline in fishing pressures due to the COVID-19 pandemic has also been documented in other areas in Indonesia, for example, gillnet fisheries in Indramayu on the Northern coast of Java, small-scale fisheries in Southeast Sulawesi, and coastal fisheries in North Bali [43,44,45], as well as in other countries, including the northwestern coast of India and northwestern Mediterranean Sea, where a wide range of fisheries were affected [46,47]. This reduction is a consequence of implementing travel restrictions, social distancing measures, decreased demand from domestic and export markets due to trade route closures, and the shutdown of fishing industries (see [44,48,49]). In addition, E. fuscoguttatus is among the grouper species that are highly traded in the export market [10], making the COVID-19 pandemic likely to significantly reduce fishing and trade activities for this species in Saleh Bay.

4.3. Management Implications and Further Studies

Apart from the findings of this study, which demonstrate that the SPR value of E. fuscoguttatus in Saleh Bay is greater than previous estimates (Table 4), it is noteworthy that SPR of 0.11 was recorded for this species in 2019, which is considerably lower than the SPR limit reference point of 0.2. Furthermore, the SPR value of 0.21 in 2022 remains below the target reference point, in Saleh Bay of >0.3 [7]. Fishing pressure on this species is expected to increase as the global fishing industry resumes normal operations following the end of COVID-19 pandemic. Furthermore, this species is one of the main targets of speargun fishers who generally catch smaller fish compared to other fishing methods in Saleh Bay [7]. Although the mean and median sizes of fish caught by the three main fishing methods are greater than the approximation for L50, they are still smaller than the approximation for L95 (see Figure 3). Thus, the overall proportions of immature fish caught are still relatively high.
The maturity data indicates that most individuals below approximately 560 mm TL are female and that males occur predominantly in larger size classes. Given that the fishery removes many individuals below this threshold, the catch is effectively sex-selective by size; based on the observed length distribution, roughly three quarters of individuals caught prior to the size at sex change are likely to be female. The high proportion of smaller fish caught, particularly those smaller than their length at maturity, is likely to reduce the natural reproductive capacity of this species, leading to a substantial decline in its stock condition in the future.
Despite implementing minimum size limit regulations by regulating hook and mesh sizes since 2018 [7], the current study revealed that catches generally have substantial proportions of fish smaller than the length at maturity. This phenomenon is also identified in another study in Saleh Bay by Efendi et al. (2021) [16] and other regions, such as grouper and snapper fisheries in Eastern Indonesia (e.g., refs. [4,28]). This issue was also identified in previous studies in Saleh Bay [15]. Therefore, finding mechanisms to ensure effective compliance is essential. This may be achieved by prioritizing the enforcement of regulations, implementing effective monitoring, or other mechanisms to ensure compliance with minimum size limits in Saleh Bay. In addition to enhancing the enforcement of regulations and monitoring their effectiveness, management authorities should also consider exploring the possibility of implementing an incentive system for fishers and fish collectors who comply with the existing regulations [15].
Taken together, these findings highlight important implications for the management of E. fuscoguttatus in Saleh Bay. The combination of low SPR values (0.13–0.28), SL50 values that are consistently smaller than the estimated L50 for maturity, and the predominance of fish below 500 mm TL in the catch indicate that the stock is experiencing both growth overfishing and recruitment overfishing. Growth overfishing is reflected in the harvest of fish before they reach sizes that maximize biomass contribution, while recruitment overfishing is suggested by SPR values remaining below the 0.30 threshold. Together, these indicators imply that current fishing pressure is reducing both the size structure and reproductive capacity of the population.
Strengthening compliance with minimum size limits and reducing the harvest of immature fish are immediate priorities for improving stock condition. Effective implementation may include stronger enforcement, consideration of slot limits that protect both small individuals and larger males, and spatial or temporal closures during peak reproductive periods to support rebuilding of the spawning stock. In the medium term, adjustments to gear selectivity, particularly for spearguns and handlines, that reduce the vulnerability of fish below 500 mm TL would help shift fishing pressure toward sizes that contribute more to spawning output. Protecting larger males is especially important for this protogynous species, and area-based measures in locations where males aggregate may further enhance recovery. Continued biological sampling and refinement of maturity, selectivity, and male abundance information will improve the reliability of future assessments and guide more effective management interventions.
The analysis of reproductive patterns from the biological samples revealed that the approximation for L50 value of E. fuscoguttatus was lower than the value previously employed in estimating SPR. However, the relatively small sample size and the narrower length distribution of the samples relative to the catch data, contribute to the high uncertainty of the estimate. Additionally, the method used for estimating life history parameters and the SPR also entails model limitations, further contributing to uncertainty. Because SPR outcomes are influenced by maturity schedules, natural mortality, and gear selectivity, these uncertainties should be considered when interpreting the stock status results. To reduce the uncertainty of estimating the life history parameters and stock assessment, there are at least two priority areas for future studies: (i) continuing research on the growth and reproduction pattern of this species with better length distribution of samples, particularly for the larger and older E. fuscogutattus, and (ii) developing an LB-SPR model that incorporates dome-shaped selectivity for the main fishing methods in Saleh Bay. In addition, future research should refine the calculation of L50 and evaluate potential interannual variability, which could not be assessed in this study due to limited maturity samples.

5. Conclusions

The study presents updated estimates of key life history parameters for the brown-marbled grouper Epinephelus fuscoguttatus in Saleh Bay, Indonesia, based on monthly catch data (2017–2022) and biological samples (2020–2021). These include revised von Bertalanffy growth parameters and reproductive characteristics, which are essential inputs for evaluating stock condition using the length-based spawning potential ratio (LB-SPR) approach. Notably, the updated biological parameters revealed a substantially lower length at 50% maturity than previously assumed, which had a strong influence on the recalculated SPR values.
Using locally derived inputs, the updated annual SPR estimates ranged from 0.13 to 0.28 (mean = 0.21), higher than the earlier assessment (0.05–0.07). However, this increase reflects improved biological inputs rather than an actual improvement in stock condition, and SPR remains below the management target of 0.30. Model assumptions regarding selectivity, the limited representation of large individuals in biological samples, and the protogynous reproductive biology of this species introduce further uncertainties that should be considered when interpreting stock status.
These findings reinforce the need for strengthened monitoring and enforcement of minimum size limits, and continued biological research to refine growth and maturity estimates. Future improvements in selectivity modeling and expanded biological sampling will enhance the reliability of stock assessments and support more effective fisheries management in Saleh Bay.

Author Contributions

Conceptualization, B.W., J.R.T., S.H.W., N.R.L. and Y.H.; methodology, P.G.C., N.R.L. and Y.H.; formal analysis, P.G.C., N.R.L. and Y.H.; investigation, B.W., S.H.W., J.R.T., P.G.C., and N.R.L.; data curation, P.G.C., N.R.L., and Y.H.; writing—original draft preparation, Y.H.; writing—review and editing, B.W., S.H.W., J.R.T., P.G.C., N.R.L. and Y.H.; visualization, P.G.C., Y.H.; supervision, B.W., J.R.T., P.G.C., and N.R.L.; funding acquisition, N.R.L. and Y.H. All authors have read and agreed to the published version of the manuscript.

Funding

This study was supported by the Ocean Stewardship Fund and scholarship funding from Murdoch University and the Wildlife Conservation Society on behalf of the KfW Development Bank and the Clive Marsh Conservation Scholarship.

Institutional Review Board Statement

Not applicable.

Data Availability Statement

Data will be made available upon reasonable request.

Acknowledgments

We thank the Scientific Forum for Sustainable Fisheries Management of West Nusa Tenggara Province (FIP2B-NTB) for granting permission to use the fish landing monitoring data in this study. Our deepest gratitude goes to Ilham Syaputra, Ulul Azmi, and the WCS Sumbawa Office team for their assistance in sample collection and processing. We are also grateful to Siska Agustina for her valuable support in data analysis, and to Jessica Pingkan for preparing the map.

Conflicts of Interest

The authors declare no conflicts of interest. The data provider and scholarship funders had no role in the study design; in the collection, analysis, or interpretation of data; in the writing of the manuscript; or in the decision to publish the results.

Abbreviations

The following abbreviations are used in this manuscript:
ANOVAAnalysis of Variance
BIGIndonesian Geospatial Information Agency
CIConfidence Interval
FAOFood and Agriculture Organization
FLMFish Landing Monitoring
GSIGonadosomatic Index
IUCNInternational Union for Conservation of Nature
LB-SPRLength-Based Spawning Potential Ratio
SPRSpawning Potential Ratio
VBGFvon Bertalanffy Growth Function
WCSWildlife Conservation Society
WNTWest Nusa Tenggara

Appendix A

Appendix A.1. Description of the Gonad Maturity Stages of Epinephelus fuscoguttatus from Saleh Bay, Sumbawa, Indonesia. Macroscopic Features for Determining the Maturity Stages Follow Those of Rhodes and Sadovy (2002) [27]

Maturity StageMacroscopic Features
Ovary (Female)Testes (Male)
Immature (I)Small, strand-like tissue, compact, pink or cream; oocytes indiscernible; indistinguishable from malesIndistinguishable from females
Inactive (II)Relatively small but rounded, grayish with thickened gonad wall; oocytes indiscernible and small (<0.4 mm)
Mature (III)Large and grayish with transparent gonad wall; large vitellogenic oocytes becoming clearly visible and tightly packedGonad expanding and becoming rounded and large; grayish in appearance
Mature (IV)Ovary large, clear, hydrated oocytes visible through wall; typical of individuals just prior to spawning; egg release possible with application of light abdominal pressureTestes large and white with sperm visible in sinuses; milt release with light abdominal pressure
Post-spawn (V)Ovary flaccid with obvious capillaries; few stages three or four oocytes visibleTestes flaccid and bloody; sperm release still possible on application of abdominal pressure

Appendix A.2. The Available Methods in the Barefoot Ecologist’s Toolbox for Estimating Natural Mortality (M)

Available Estimation MethodsDescriptionReferencesWeighting
Then_lmThen’s model to estimate M based on maximum age (tmax) informationThen et al. (2015); [50]0.25
Then_nlsThen’s model to estimate M based on maximum age (tmax) information using updated Hoenig (1983) method with non-linear least square fittingHoenig et al. (1983); [51] Then et al. (2015); [50]0.25
Then_vbgfThen’s model to estimate M based on maximum age (tmax), von Bertalanffy’s growth constant (k), and mean asymptotic length (L) informationThen et al. (2015); [50]0.25
Hamel_AmaxHamel’s model to estimate M based on maximum age (Amax) informationHamel (2014); [52] 0.5
Hamel_kHamel’s model to estimate M based on von Bertalanffy’s growth constant (k) informationHamel (2014); [52]0.5
Jensen_k1, k2, and Jensen_AmatJensen’s model to estimate M based using age at maturity, von Bertalanffy’s growth constant (k), and mean asymptotic length (L) information based on the Beverton and Holt invariants modelJensen 1996 [53]; Jensen (1997) [54] 0.25 (k1), 0.25 (k2),
0.5 (Amat)
RoffA model to estimate M using age at maturity, von Bertalanffy’s growth constant (k), and mean asymptotic length (L)Roff (1984); [55]0.5
Ri_Ef_AmatRikhter and Evanov’s model to estimate M based using age at maturity informationRikhter and Evanov (1985); [56]
11/26/2025 2:57:00 PM
0.5
GSIA model to estimate M using Gonadosomatic Index (GSI) informationGunderson and Dygert (1988) [57], Hamel (2015) [51]0
ZA_CA_dem and ZM_CA_pelA revised Alverson and Carney (AC) model by Zhang and Megrey (ZM) for estimating natural mortality of demersal (ZM_CA_dem) and pelagic (ZM_CA_pel) fish, by incorporating b and t0 parameters.Zhang and Megrey (2006) [58]
11/26/2025 2:57:00 PM
0

Appendix B

Estimated Spawning Potential Ratio (SPR) Using Male-Only Maturity Parameters (L50 = 488 mm, L95 = 616 mm)

Figure A1. Combined-sex maturity ogive for Epinephelus fuscoguttatus. Grey points show the proportion of mature individuals in 20 mm length classes. The solid black line represents the fitted logistic maturity curve with 95% confidence limits (dashed blue lines). Green dashed lines mark the estimated lengths at 95% maturity (L95 = 600.9 mm), derived from pooled maturity data across both sexes.
Fishes 10 00611 g0a1

Appendix C

Appendix C.1. Estimated Spawning Potential Ratio (SPR) Using Male-Only Maturity Parameters (L50 = 488, L95 = 616 mm)

YearsEstimates (±95% CI)
SPRSL50 (mm)SL95 (mm)F/M
20170.2 (0.1–0.3)428.3 (385.8–470.9)529.6 (454.1–605.1)1.87 (0.88–2.86)
20180.28 (0.08–0.49)445.1 (337.7–552.6)587.0 (402.9–771.1)1.36 (0.09–2.63)
20190.13 (0.08–0.18)423.9 (396.4–451.4)503.7 (453.6–553.7)2.85 (1.73–3.97)
20210.21 (0.11–0.30)468.3 (406.8–529.8)624.5 (526.0–723.0)2.15 (0.97–3.33)
20220.22 (0.11–0.34)434.8 (382.0–487.6)544.0 (451.7–636.4)1.70 (0.69–2.71)
Mean0.21 ± 0.02 440.1 ± 7.9557.8 ± 21.51.99 ± 0.25

Appendix C.2. Estimated Spawning Potential Ratio (SPR) Using Combined Sex of 95% Maturity (L95 = 600.9 mm)

YearsEstimates (±95% CI)
SPRSL50 (mm)SL95 (mm)F/M
20170.2 (0.1–0.3)428.3 (385.8–470.9)529.6 (454.1–605.1)1.87 (0.88–2.86)
20180.28 (0.08–0.49)445.1 (337.7–552.6)587.0 (402.9–771.1)1.36 (0.09–2.63)
20190.13 (0.08–0.18)423.9 (396.4–451.4)502.3 (453.6–553.7)2.85 (1.73–3.97)
20210.21 (0.11–0.31)468.3 (406.8–529.8)624.5 (526.0–723.0)2.15 (0.97–3.33)
20220.23 (0.11–0.34)434.8 (382.0–487.6)544.0 (451.7–636.4)1.70 (0.69–2.71)
Mean0.21 ± 0.02 440.1 ± 7.9557.5 ± 21.61.99 ± 0.25

Appendix D

Natural Mortality (M) Estimates Using ‘Barefoot Ecologist Toolbox’

Table A1. Estimated natural mortality (M) values.
NoMethodsEstimate of MWeighting Assigned
1Then_nls0.1840.25
2Then_lm0.1490.25
3Hamel_Amax0.1500.5
4Then_VBGF0.3050.25
5Hamel_k0.3860.5
6Jensen_k10.3300.25
7Jensen_k20.3520.25
8Roff0.2270.5
9Jensen_Amat0.2660.5
10Ri_Ef_Amat0.2490.5
Figure A2. Weighted empirical M estimators, incorporating additional variance (CV = 0.31), are presented using default weightings in Table A1 for Epinephelus fuscoguttatus in Saleh Bay (see Cope and Hamel 2022 [27] for detailed procedures).
Fishes 10 00611 g0a2

References

  1. Amorim, P.; Sousa, P.; Jardim, E.; Menezes, G.M. Sustainability Status of Data-Limited Fisheries: Global Challenges for Snapper and Grouper. Front. Mar. Sci. 2019, 6, 654. [Google Scholar] [CrossRef]
  2. Sadovy de Mitcheson, Y.J.; Linardich, C.; Barreiros, J.P.; Ralph, G.M.; Aguilar-Perera, A.; Afonso, P.; Erisman, B.E.; Pollard, D.A.; Fennessy, S.T.; Bertoncini, A.A.; et al. Valuable but Vulnerable: Over-Fishing and under-Management Continue to Threaten Groupers so What Now? Mar. Pol. 2020, 116, 103909. [Google Scholar] [CrossRef]
  3. Rimmer, M.A.; Glamuzina, B. A Review of Grouper (Family Serranidae: Subfamily Epinephelinae) Aquaculture from a Sustainability Science Perspective. Rev. Aquac. 2019, 11, 58–87. [Google Scholar] [CrossRef]
  4. Halim, A.; Loneragan, N.R.; Wiryawan, B.; Hordyk, A.R.; Sondita, M.F.A.; Yulianto, I. Evaluating Data-Limited Fisheries for Grouper (Serranidae) and Snapper (Lutjanidae) in the Coral Triangle, Eastern Indonesia. Reg. Stud. Mar. Sci. 2020, 38, 101388. [Google Scholar] [CrossRef]
  5. Herdiana, Y.; Wiryawan, B.; Wisudo, S.H.; Tweedley, J.R.; Yulianto, I.; Natsir, M.; Agustina, S.; Hordyk, A.; Loneragan, N.R. Application of the Method Evaluation and Risk Assessment Tool for a Small-Scale Grouper Fishery in Indonesia. Fishes 2023, 8, 498. [Google Scholar] [CrossRef]
  6. Jaya, I.; Satria, F.; Wudianto; Nugroho, D.; Sadiyah, L.; Buchary, E.A.; White, A.T.; Franklin, E.C.; Courtney, C.A.; Green, G.; et al. Are the Working Principles of Fisheries Management at Work in Indonesia? Mar. Pol. 2022, 140, 105047. [Google Scholar] [CrossRef]
  7. Retnoningtyas, H.; Yulianto, I.; Soemodinoto, A.; Herdiana, Y.; Kartawijaya, T.; Natsir, M.; Haryanto, J.T. Stakeholder Participation in Management Planning for Grouper and Snapper Fisheries in West Nusa Tenggara Province, Indonesia. Mar. Pol. 2021, 128, 104452. [Google Scholar] [CrossRef]
  8. Craig, M.T.; de Mitcheson, Y.S.; Heemstra, P.C. Groupers of the World: A Field and Market Guide; NISC (Pty) Ltd. (National Inquiry Services Centre): Makhanda, South Africa, 2011; ISBN 978-1-920033-11-8. [Google Scholar]
  9. Efendi, D.S.; Adrianto, L.; Yonvitner; Wardiatno, Y. Spatial Bioeconomic Analysis of Grouper Fishing on the Fisheries Management Framework in Saleh Bay: Analisis Bioekonomi Spasial Perikanan Kerapu Dalam Kerangka Pengelolaan Perikanan Di Teluk Saleh. J. Pengelolaan Sumberd. Alam. Lingkung. 2020, 10, 338–351. [Google Scholar] [CrossRef]
  10. Khasanah, M.; Nurdin, N.; Sadovy de Mitcheson, Y.; Jompa, J. Management of the Grouper Export Trade in Indonesia. Rev. Fish. Sci. Aquac. 2020, 28, 1–15. [Google Scholar] [CrossRef]
  11. Palm, H.W.; Yulianto, I.; Theisen, S.; Rueckert, S.; Kleinertz, S. Epinephelus fuscoguttatus Mariculture in Indonesia: Implications from Fish Parasite Infections. Reg. Stud. Mar. Sci. 2015, 2, 54–70. [Google Scholar] [CrossRef]
  12. Novriadi, R. Mini Review: Production and Economics Analysis Of Backyard Production of Tiger Grouper Epinephelus fuscoguttatus Fingerlings in Situbondo, Indonesia. J. Fishtech 2019, 8, 58–71. [Google Scholar] [CrossRef]
  13. Pears, R.; Choat, J.; Mapstone, B.; Begg, G. Demography of a Large Grouper, Epinephelus fuscoguttatus, from Australias Great Barrier Reef: Implications for Fishery Management. Mar. Ecol. Prog. Ser. 2006, 307, 259–272. [Google Scholar] [CrossRef]
  14. Rhodes, K.L.; McIlwain, J.; Joseph, E.; Nemeth, R.S. Reproductive Movement, Residency and Fisheries Vulnerability of Brown-Marbled Grouper, Epinephelus fuscoguttatus (Forsskål, 1775). Coral Reefs 2012, 31, 443–453. [Google Scholar] [CrossRef]
  15. Herdiana, Y.; Wiryawan, B.; Wisudo, S.H.; Tweedley, J.R.; Yulianto, I.; Retnoningtyas, H.; Loneragan, N.R. Untangling the Complexity of Small-Scale Fisheries: Building an Understanding of Grouper-Snapper Fisheries Dynamics in Saleh Bay, West Nusa Tenggara, Indonesia. Fishes 2023, 9, 2. [Google Scholar] [CrossRef]
  16. Efendi, D.S.; Adrianto, L.; Yonvitner; Wardiatno, Y. An Evaluation of Grouper and Snapper Fisheries Management Policy in Saleh Bay, Indonesia. IOP Conf. Ser. Earth Environ. Sci. 2021, 744, 012013. [Google Scholar] [CrossRef]
  17. Hordyk, A.; Ono, K.; Valencia, S.; Loneragan, N.; Prince, J. A Novel Length-Based Empirical Estimation Method of Spawning Potential Ratio (SPR), and Tests of Its Performance, for Small-Scale, Data-Poor Fisheries. ICES J. Mar. Sci. 2015, 72, 217–231. [Google Scholar] [CrossRef]
  18. Prince, J.; Victor, S.; Kloulchad, V.; Hordyk, A. Length Based SPR Assessment of Eleven Indo-Pacific Coral Reef Fish Populations in Palau. Fish. Res. 2015, 171, 42–58. [Google Scholar] [CrossRef]
  19. Agustina, S.; Natsir, M.; Gigentika, S.; Marliana, I.; Anas, A.; Rafandi, M.T.; Hernawati; Kartawijaya, T.; Prasetia, R. Telaah Ilmiah Pengelolaan Perikanan Kerapu Dan Kakap Berkelanjutan Di Nusa Tenggara Barat 2023; Forum Ilmiah Pengelolaan Perikanan Berkelanjutan (FIP2B Provinsi Nusa Tenggara Barat): Mataram, Indonesia, 2023. [Google Scholar]
  20. De Robertis, A.; Williams, K. Weight-Length Relationships in Fisheries Studies: The Standard Allometric Model Should Be Applied with Caution. Trans. Am. Fish. Soc. 2008, 137, 707–719. [Google Scholar] [CrossRef]
  21. Froese, R.; Tsikliras, A.C.; Stergiou, K.I. Editorial Note on Weight–Length Relations of Fishes. Acta Icth Piscat. 2011, 41, 261–263. [Google Scholar] [CrossRef]
  22. Stevenson, D.K.; Campana, S.E. (Eds.) Otolith Microstructure Examination and Analysis; Canadian Special Publication of Fisheries and Aquatic Sciences; Department of Fisheries and Oceans: Ottawa, ON, Canada, 1992; ISBN 978-0-660-14747-5. [Google Scholar]
  23. Boddington, D.K.; Wakefield, C.B.; Fisher, E.A.; Fairclough, D.V.; Harvey, E.S.; Newman, S.J. Age, Growth and Reproductive Life--history Characteristics Infer a High Population Productivity for the Sustainably Fished Protogynous Hermaphroditic Yellowspotted Rockcod (Epinephelus areolatus) in North-western Australia. J. Fish. Biol. 2021, 99, 1869–1886. [Google Scholar] [CrossRef]
  24. Boddington, D.K.; Wakefield, C.B.; Harvey, E.S.; Fairclough, D.V.; Newman, S.J. Life-History Characteristics and Mortality of the Protogynous Hermaphroditic Frostback Rockcod (Epinephelus bilobatus) from the Eastern Indian Ocean. Estuar. Coast. Shelf Sci. 2023, 290, 108408. [Google Scholar] [CrossRef]
  25. Taylor, M.H.; Mildenberger, T.K. Extending Electronic Length Frequency Analysis in R. Fish. Manag. Ecol. 2017, 24, 330–338. [Google Scholar] [CrossRef]
  26. Rhodes, K.L.; Sadovy, Y. Temporal and Spatial Trends in Spawning Aggregations of Camouflage Grouper, Epinephelus polyphekadion, in Pohnpei, Micronesia. Environ. Biol. Fishes 2002, 63, 27–39. [Google Scholar] [CrossRef]
  27. Cope, J.M.; Hamel, O.S. Upgrading from M Version 0.2: An Application-Based Method for Practical Estimation, Evaluation and Uncertainty Characterization of Natural Mortality. Fish. Res. 2022, 256, 106493. [Google Scholar] [CrossRef]
  28. Hordyk, A.; Ono, K.; Sainsbury, K.; Loneragan, N.; Prince, J. Some Explorations of the Life History Ratios to Describe Length Composition, Spawning-per-Recruit, and the Spawning Potential Ratio. ICES J. Mar. Sci. 2015, 72, 204–216. [Google Scholar] [CrossRef]
  29. Fatma, F.; Mallawa, A.; Najamuddin, N.; Zainuddin, M.; Ayyub, F.R. Biological Aspects of Brown-Marbled Grouper (Epinephelus fuscoguttatus) from Taka Bonerate National Park, District of Selayar Islands, South Sulawesi, Indonesia. Biodiversitas 2022, 23. [Google Scholar] [CrossRef]
  30. Mrombo, N.L.; Orembo, B.O.; Obuya, J.A.; Nyamweya, C.S. Biology and Status of Epinephelus fuscoguttatus (Forsskål, 1775) Stocks on the Kenyan Coast. Fish Manage Ecol. 2023, 30, 437–445. [Google Scholar] [CrossRef]
  31. Froese, R.; Binohlan, C. Empirical Relationships to Estimate Asymptotic Length, Length at First Maturity and Length at Maximum Yield per Recruit in Fishes, with a Simple Method to Evaluate Length Frequency Data. J. Fish. Biol. 2000, 56, 758–773. [Google Scholar] [CrossRef]
  32. Hamilton, S.L.; Caselle, J.E.; Standish, J.D.; Schroeder, D.M.; Love, M.S.; Rosales-Casian, J.A.; Sosa-Nishizaki, O. Size-Selective Harvesting Alters Life Histories of A Temperate Sex-Changing Fish. Ecol. Appl. 2007, 17, 2268–2280. [Google Scholar] [CrossRef]
  33. Hixon, M.A.; Johnson, D.W.; Sogard, S.M. BOFFFFs: On the Importance of Conserving Old-Growth Age Structure in Fishery Populations. ICES J. Mar. Sci. 2014, 71, 2171–2185. [Google Scholar] [CrossRef]
  34. Lowerre-Barbieri, S.; Menendez, H.; Bickford, J.; Switzer, T.; Barbieri, L.; Koenig, C. Testing Assumptions about Sex Change and Spatial Management in the Protogynous Gag Grouper, Mycteroperca microlepis. Mar. Ecol. Prog. Ser. 2020, 639, 199–214. [Google Scholar] [CrossRef]
  35. Prince, J.; Hordyk, A.; Valencia, S.R.; Loneragan, N.; Sainsbury, K. Revisiting the Concept of Beverton-Holt Life-History Invariants with the Aim of Informing Data-Poor Fisheries Assessment. ICES J. Mar. Sci. 2015, 72, 194–203. [Google Scholar] [CrossRef]
  36. Cao, W. Discussion about the Mean, Median, Mode and Their Validity, and the Representative Number. J. Contemp. Educ. Res. 2021, 5, 71–74. [Google Scholar] [CrossRef]
  37. Robinson, O.J.; Jensen, O.P.; Provost, M.M.; Huang, S.; Fefferman, N.H.; Kebir, A.; Lockwood, J.L. Evaluating the Impacts of Fishing on Sex-Changing Fish: A Game-Theoretic Approach. ICES J. Mar. Sci. 2017, 74, 652–659. [Google Scholar] [CrossRef]
  38. Provost, M.M.; Jensen, O.P. The Impacts of Fishing on Hermaphoditic and Treatment of Sex Change in Stock Assessments. Fisheries 2015, 40, 536–545. [Google Scholar] [CrossRef]
  39. Kline, R.J.; Khan, I.A.; Holt, G.J. Behavior, Color Change and Time for Sexual Inversion in the Protogynous Grouper (Epinephelus adscensionis). PLoS ONE 2011, 6, e19576. [Google Scholar] [CrossRef]
  40. Shephard, S.; Edwards, K.; George, S.; Joseph, E.; James, S.; David, O.; Persaud, A.; Watson, L.C.; Van Vliet, N. Community-based Monitoring, Assessment and Management of Data-limited Inland Fish Stocks in North Rupununi, Guyana. Fish. Manag. Ecol. 2023, 30, 121–133. [Google Scholar] [CrossRef]
  41. Hommik, K.; Fitzgerald, C.J.; Kelly, F.; Shephard, S. Dome-Shaped Selectivity in LB-SPR: Length-Based Assessment of Data-Limited Inland Fish Stocks Sampled with Gillnets. Fish. Res. 2020, 229, 105574. [Google Scholar] [CrossRef]
  42. Mardhia, D.; Kautsari, N.; Syaputra, L.I.; Ramdhani, W.; Rasiardhi, O. Penerapan protokol kesehatan dan dampak COVID-19 terhadap harga komoditas perikanan dan aktivitas penangkapan. IJAST 2020, 1, 80–87. [Google Scholar]
  43. Sari, Y.D.; Mira; Suryawati, S.H.; Nababan, B.O.; Hikmayani, Y.; Putri, N.P.S. The Impact of the COVID-19 Pandemic on Fishers in the Indramayu District. IOP Conf. Ser. Earth Environ. Sci. 2021, 892, 012044. [Google Scholar] [CrossRef]
  44. Campbell, S.J.; Jakub, R.; Valdivia, A.; Setiawan, H.; Setiawan, A.; Cox, C.; Kiyo, A.; Darman; Djafar, L.F.; Rosa, E.D.L.; et al. Immediate Impact of COVID-19 across Tropical Small-Scale Fishing Communities. Ocean. Coast. Manag. 2021, 200, 105485. [Google Scholar] [CrossRef] [PubMed]
  45. Rosado, C.; Kurniati, E.; Peck, M. Resilience of Small-Scale Fisheries to COVID-19: A Case Study from North Bali, Indonesia. In Financial Crises, Poverty and Environmental Sustainability: Challenges in the Context of the SDGs and Covid-19 Recovery; Antoniades, A., Antonarakis, A.S., Kempf, I., Eds.; Sustainable Development Goals Series; Springer International Publishing: Cham, Switzerland, 2022; pp. 137–154. ISBN 978-3-030-87416-2. [Google Scholar]
  46. Avtar, R.; Singh, D.; Umarhadi, D.A.; Yunus, A.P.; Misra, P.; Desai, P.N.; Kouser, A.; Kurniawan, T.A.; Phanindra, K. Impact of COVID-19 Lockdown on the Fisheries Sector: A Case Study from Three Harbors in Western India. Remote Sens. 2021, 13, 183. [Google Scholar] [CrossRef]
  47. Coll, M.; Ortega-Cerdà, M.; Mascarell-Rocher, Y. Ecological and Economic Effects of COVID-19 in Marine Fisheries from the Northwestern Mediterranean Sea. Biol. Conserv. 2021, 255, 108997. [Google Scholar] [CrossRef]
  48. Bennett, N.J.; Finkbeiner, E.M.; Ban, N.C.; Belhabib, D.; Jupiter, S.D.; Kittinger, J.N.; Mangubhai, S.; Scholtens, J.; Gill, D.; Christie, P. The COVID-19 Pandemic, Small-Scale Fisheries and Coastal Fishing Communities. Coast. Manag. 2020, 48, 336–347. [Google Scholar] [CrossRef]
  49. White, E.R.; Froehlich, H.E.; Gephart, J.A.; Cottrell, R.S.; Branch, T.A.; Agrawal Bejarano, R.; Baum, J.K. Early Effects of COVID-19 on US Fisheries and Seafood Consumption. Fish. Fish. 2021, 22, 232–239. [Google Scholar] [CrossRef]
  50. Then, A.Y.; Hoenig, J.M.; Hall, N.G.; Hewitt, D.A. Handling editor: Ernesto Jardim. Evaluating the Predictive Performance of Empirical Estimators of Natural Mortality Rate Using Information on over 200 Fish Species. ICES J. Mar. Sci. 2015, 72, 82–92. [Google Scholar] [CrossRef]
  51. Hoenig, J. Empirical use of longevity data to estimate mortality rates. Fish. Bull. 1983, 81, 898–903. [Google Scholar]
  52. Hamel, O.S. A Method for Calculating a Meta-Analytical Prior for the Natural Mortality Rate Using Multiple Life History Correlates. ICES J. Mar. Sci. 2014, 72, 62–69. [Google Scholar] [CrossRef]
  53. Jensen, A.L. Beverton and Holt Life History Invariants Result from Optimal Trade-off of Reproduction and Survival. Can. J. Fish. Aquat. Sci. 1996, 530, 820–822. [Google Scholar] [CrossRef]
  54. Jensen, A.L. Origin of the Relation between K and Linf and Synthesis of Relations among Life History Parameters. Can. J. Fish. Aquat. Sci. 1997, 54, 987–989. [Google Scholar] [CrossRef]
  55. Roff, D.A. The Evolution of Life History Parameters in Teleosts. Can. J. Fish. Aquat. Sci. 1984, 41, 989–1000. [Google Scholar] [CrossRef]
  56. Rikhter, V.A.; Evanov, V.N. On One of the Approaches to Estimation of Natural Mortality of Fish Populations. ICNAF Res. Doc. 1976, 76/VI/8, 1–13. [Google Scholar]
  57. Gunderson, D.R.; Dygert, P.H. Reproductive Effort as a Predictor of Natural Mortality Rate. ICES J. Mar. Sci. 1988, 44, 200–209. [Google Scholar] [CrossRef]
  58. Zhang, C.; Megrey, B.A. A Revised Alverson and Carney Model for Estimating the Instantaneous Rate of Natural Mortality. Trans. Am. Fish. Soc. 2006, 135, 620–633. [Google Scholar] [CrossRef]
Figure 1. Map of Saleh Bay and the four main fish landing monitoring (FLM) sites (triangles) around the bay in Sumbawa, West Nusa Tenggara (WNT), Indonesia. Basemap source: Indonesian Geospatial Information Agency (BIG) and the Wildlife Conservation Society (WCS) Indonesia Program. Red boxes on the insets show location of Saleh Bay in Indonesia and WNT province.
Fishes 10 00611 g001
Figure 2. Length–frequency distributions of Epinephelus fuscoguttatus sampled in Saleh Bay, West Nusa Tenggara: (a) Comparison between fish landing monitoring data in Saleh Bay green; n = 488) and those purchased to estimate biological parameters (dark blue; n = 116), showing the relative frequency of individuals by total length (TL); (b) composition of females (white) and males (dark blue) from the biological samples, indicating that males occurred predominantly in the larger size classes, as expected for this protogynous species.
Fishes 10 00611 g002
Figure 3. Boxplots summarizing the total length (TL) of E. fuscoguttatus caught by spearguns (n = 247), handlines (n = 40), and bottom longlines (n = 140) and measured in the fisheries landing monitoring program in Saleh Bay. The central line within each box represents the median, the box edges represent the 25th and 75th percentiles, and the whiskers indicate the minimum and maximum values within 1.5 times the interquartile range. Extreme values outside this range are shown as hollow circles.
Fishes 10 00611 g003
Figure 4. Length–weight relationship of E. fuscoguttatus from Saleh Bay. Data points represent individual samples, with females shown in pink and males in blue-green. The dashed line indicates the fitted length–weight regression for all sexes combined.
Fishes 10 00611 g004
Figure 5. Otolith-based von Bertalanffy growth curve for E. fuscoguttatus (black line with 95% CI) fitted to 97 biological samples collected in 2020–2021 (circles = females, triangles = males). The blue curve shows the ELEFAN-optimized growth model derived from 488 FLM length–frequency records (2017–2022) and represents the growth model used in subsequent analyses.
Fishes 10 00611 g005
Figure 6. Length–frequency distribution and maturity composition of Epinephelus fuscoguttatus by sex. (a) Female and (b) male individuals are grouped into 16 mm TL length classes, showing the number of immature (white bars) and mature (hatched bars) individuals. The black dashed vertical lines indicates the approximate midpoint corresponding to the estimated length at 50% maturity (≈488 mm for both females and males), while the grey dashed vertical lines indicates the approximate midpoint corresponding to the estimated length at 95% maturity (≈568 mm for females and ≈616 mm for males).
Fishes 10 00611 g006
Figure 7. Natural mortality (M, year−1) values estimated using different methods through the ‘Barefoot Ecologist’s Toolbox. Error bars around M estimates indicate additional 0.31 coefficient of variation.
Fishes 10 00611 g007
Figure 8. Length frequency distribution of Epinephelus fuscoguttatus catches in the fisheries landing monitoring program from 2017 to 2022. Black lines are the LB-SPR model fitted to the data.
Fishes 10 00611 g008
Figure 9. Comparison of size selectivity and length at maturity curves from the catch data (colored lines) and length at maturity ogive curve (black line) of Epinephelus fuscoguttatus from 2017 to 2022 in Saleh Bay. The length at maturity curve uses the female L50 and L95 parameters estimated from this study.
Fishes 10 00611 g009
Table 1. The von Bertalanffy growth (vBGF) parameter estimates L, k and t0, and their upper and lower 95% confidence limits, for Epinephelus fuscoguttatus derived from the total lengths at age of all aged individuals collected caught in Saleh Bay and estimates of L, k, and t0 derived from ELEFAN using length frequency data from FLM.
Model TypeParameterEstimateLower BoundUpper Bound
vBGFL855.90770.80988.90
k0.120.080.16
t0−1.59−2.62−0.81
ELEFANL927n/an/a
k0.22n/an/a
t0−0.84n/an/a
Table 2. Summary of the life history parameters used in estimating natural mortality.
Life History ParametersValueSource
Maximum age (tmax; year ± SE)36 ± 0.5Pears et al. (2006) [13]
Mean asymptotic length (L; cm)92.7Estimated from 2017–2022 catch data using ELEFAN optimized method in TopFIshR
von Bertalanffy’s growth constant (k)0.22Estimated from 2017–2022 catch data using ELEFAN optimized method in TopFIshR
Age at maturity (year)5.42This study
Gonadosomatic Index (GSI) in %1.25%This study (both sexes combined)
Table 3. Summary of life history parameters used to estimate the spawning potential ratio (SPR) for Ephinephelus fuscoguttatus in Saleh Bay.
Life History ParametersEstimateSource
L (cm)92.7Estimated from 2017–2022 catch data using ELEFAN optimized method in TopFIshR
M/k1.32Calculated from M and k estimates in this study
L50 (mm); female and male488.0This study
L95 (mm); female568.0This study
L95 (mm); male616.0This study
L95 (mm); combined sex600.9This study
Table 4. Estimated means (± 1 SE) of spawning potential ratio (SPR), length at 50 and 95% selectivity (SL50 and SL50, respectively) and relative fishing mortality (F/M) for Epinephelus fuscoguttatus from 2017 to 2022 in Saleh Bay.
YearsEstimates (±95% CI)
SPRSL50 (mm)SL95 (mm)F/M
20170.2 (0.1–0.3)428.3 (385.8–470.9)529.6 (454.1–605.1)1.87 (0.88–2.86)
20180.28 (0.08–0.49)445.1 (337.7–552.6)587.0 (402.9–771.1)1.36 (0.09–2.63)
20190.13 (0.08–0.18)423.9 (396.4–451.4)502.3 (453.6–553.7)2.85 (1.73–3.97)
20210.21 (0.11–0.31)468.3 (406.8–529.8)624.5 (526.0–723.0)2.15 (0.97–3.33)
20220.23 (0.11–0.34)434.8 (382.0–487.6)544.0 (451.7–636.4)1.70 (0.69–2.71)
Mean0.21 ± 0.02 440.1 ± 7.9557.5 ± 21.61.99 ± 0.25
Table 5. Minimum (min), maximum (max), mean and median total lengths (mm) of Epinephalus fuscoguttatus measured during the fisheries monitoring program for each year between 2017 and 2022 from Saleh Bay. n = sample size.
Statistics20172018201920212022
Min345.2307.9297.2315.9361.4
Max807.0860.0733.6780.2788.0
Mean528.6543.5505.8531.0533.1
Median511.7543.7492.2526.8526.8
n777711214379
Disclaimer/Publisher’s Note: The statements, opinions and data contained in all publications are solely those of the individual author(s) and contributor(s) and not of MDPI and/or the editor(s). MDPI and/or the editor(s) disclaim responsibility for any injury to people or property resulting from any ideas, methods, instructions or products referred to in the content.