Article

The Differences in the Responses of Pelagic Fish Distribution in the Northern South China Sea to Environmental Factors: A Case Study of Round Scad and Jack Mackerel in the Hainan Island Offshore Area

1
Key Laboratory of Marine Ranching, Ministry of Agriculture and Rural Affairs, Guangzhou 510000, China
2
South China Sea Fisheries Research Institute, Chinese Academy of Fishery Sciences, Guangzhou 510000, China
3
Sanya Tropical Fisheries Research Institute, Sanya 572018, China
*
Author to whom correspondence should be addressed.
Fishes 2025, 10(11), 574; https://doi.org/10.3390/fishes10110574
Submission received: 12 September 2025 / Revised: 30 October 2025 / Accepted: 6 November 2025 / Published: 7 November 2025
(This article belongs to the Special Issue Sustainable Fisheries Dynamics)

Abstract

Round scad (Decapterus maruadsi) and jack mackerel (Trachurus japonicus) are economically significant pelagic species widely distributed in the northern South China Sea (SCS), with overlapping habitats and life history stages. To examine the distribution patterns of round scad and jack mackerel and their responses to environmental variables, we conducted a preliminary analysis using catch and environmental data from four seasonal surveys around Hainan Island. Three species distribution models—generalized linear models (GLM), generalized additive models (GAM), and random forests (RF)—were applied to quantify species–environment relationships. Explanatory variables included both biotic and abiotic factors: temperature, salinity, water depth, sea surface chlorophyll a concentration (SSC), phytoplankton abundance, and zooplankton abundance. The results revealed pronounced spatial heterogeneity in the high-density areas of both species. Among the models, GAM consistently explained a higher proportion of deviance in the observed distributions. Further analysis showed that round scad and jack mackerel responded differently to environmental gradients such as water depth and temperature, although their responses to varying plankton concentrations were largely consistent. Specifically, round scad are typically found in waters at depths ranging from 0 to 50 m, whereas jack mackerel tend to inhabit depths exceeding 100 m. In response to high plankton abundance, both species exhibit a notable increase in resource availability when plankton levels surpass 3. These findings indicate distinct spatial niches and suggest potential competition in feeding ecology between the two species. Overall, the study enhances understanding of the spatial dynamics of key commercial species in the northern SCS and provides valuable insights for sustainable fisheries management and conservation planning.
Key Contribution: This study employed three models (i.e., GLM, GAM and RF) to fit the relationships between round scad and jack mackerel with multiple environmental factors, and focused on investigating the differences in the distribution patterns of the two fish species and their similarities and differences in responses to environmental factors. This research holds significant importance for gaining a deeper understanding of the distribution patterns of ecologically similar pelagic species in the northern SCS. It provides foundational information for subsequent studies on resource fluctuations and interspecies interactions among key fish species under the context of climate change.

1. Introduction

Hainan Island, located between 108°37′ E–111°03′ E longitude and 18°10′ N–20°10′ N latitude, marks the southernmost point of China. Positioned at the boundary between subtropical and tropical climate zones, it experiences a typical tropical marine climate [1]. The surrounding waters lie on the northern continental shelf of the SCS, a region characterized by dynamic and complex environmental conditions [2,3]. To the north, the Qiongzhou Strait separates the island from Guangdong Province; to the west, it faces Vietnam across the Beibu Gulf. The eastern side opens to the continental shelf sea, while the southeastern and southern flanks comprise the entrance to the Beibu Gulf, connected to the broader waters of the SCS. The hydrographic conditions around Hainan Island are highly variable, influenced by multiple oceanographic processes, including upwellings in the eastern coastal waters of Hainan Island (Qiongdong upwelling), the Kuroshio Current, circulation within the Beibu Gulf, inflow of warm SCS waters, and substantial river discharge (Figure 1) [3,4]. These waters support rich marine biodiversity and abundant fishery resources, fostering several high-quality fishing grounds and making the region a strategic area for the development of China’s marine fisheries [5,6].
Round scad and jack mackerel are among the most economically important species in the northern SCS, serving as key components of the marine ecosystem and holding significant economic, social, and ecological value [7,8]. Round scad consistently ranks among the most abundant fish in the region, contributing approximately 10% of total marine fish production in recent years and substantially influencing the overall catch composition [9,10]. Historical surveys have identified a major spawning population of round scad in the Beibu Gulf, exhibiting distinct migratory behavior. From December to January, these fish migrate from the southern gulf toward the waters near Weizhou and Wusui Islands for feeding, with spawning occurring between January and March in nearshore areas 12–40 m deep over muddy-sandy seabeds [11]. Following the southwest monsoon’s onset, adult spawners migrate toward deeper waters [11]. Furthermore, the waters from eastern Hainan Island to western Guangdong are critical habitats and constitute a primary fishing ground for round scad, with substantial temporal and spatial variability in their distribution [7,12]. Jack mackerel are also widely distributed across the northern continental shelf of the SCS. As traditional demersal species have declined, these midwater and pelagic species have become increasingly important fishery targets [8]. Jack mackerel catches in the northern SCS have shown a marked upward trend, with annual yields reaching approximately 30,000 tons—accounting for 68% of national production of this species [13]. Recent studies further highlight the importance of Hainan’s surrounding waters, particularly the Beibu Gulf, as critical jack mackerel habitats with notably high stock densities [14].
Pelagic species such as round scad and jack mackerel are characterized by rapid growth, short life spans, high sensitivity to environmental variability, and large population fluctuations. These fluctuations are driven not only by fishing pressure but also by environmental and climatic variability [15,16]. Previous studies have revealed that the catch per unit effort (CPUE) of round scad in the northern SCS is significantly correlated with multiple environmental factors, including longitude, sea surface temperature, chlorophyll-a concentration, swell height, and wind wave conditions [12,17,18,19]. Zhang et al. [8] found considerable spatial overlap in the distributions of round scad and jack mackerel in the Beibu Gulf. Moreover, under the influence of climate change, populations of both species have exhibited pronounced variability. Notably, during four La Niña events (2007/2008, 2010/2011, 2011/2012, and 2020/2021), total stock densities of both species in the Beibu Gulf experienced unusually rapid growth [8]. Li et al. [9] reported that round scad and jack mackerel in the northern SCS occupy similar trophic levels and exhibit substantial ecological niche overlap, indicating potential interspecific competition for food resources. Building on this, Wang et al. [12] found that spatial variations in round scad stock density around Hainan Island are closely correlated with the distribution patterns of jack mackerel. Moreover, recent observations have revealed divergent catch trends between the two species in the northern SCS. In many marine ecosystems, pelagic species often share similar habitats and ecological roles. However, under the influence of climate and environmental variability, their population dynamics can exhibit contrasting patterns—a phenomenon known as out-of-phase dynamics. Such dynamics have been documented in other pelagic fish pairs, including sardines and Japanese anchovies [20,21,22]. Despite the ecological similarities between round scad and jack mackerel, research remains limited on how their spatial distributions respond differentially to environmental changes.
To address this gap, the present study employs three species distribution models to analyze the spatial patterns of round scad and jack mackerel in the offshore waters surrounding Hainan Island. We further integrate a suite of biotic and abiotic variables to evaluate interspecific similarities and differences in their responses to environmental variability. This research advances our understanding of pelagic fish dynamics on the continental shelf of the northern SCS and provides a critical reference for examining species-specific responses to climate and environmental shifts.

2. Materials and Methods

2.1. Data Collection

2.1.1. Fishery Data

Field data were obtained from bottom trawl surveys conducted by the South China Sea Fisheries Research Institute, Chinese Academy of Fisheries Sciences, in the offshore waters of Hainan Island during four seasonal expeditions: spring (March 2021), autumn (September 2021), winter (December 2021), and summer (June 2022). The survey area extended from 107°15′ E to 112°15′ E longitude and from 16°45′ N to 20°15′ N latitude, encompassing 54 fixed stations (Figure 1). The same station layout was maintained across all seasons. Surveys were conducted using the Guibeiyu 69068, a steel-hulled trawler with a gross tonnage of 590 tons, an overall length of 53.8 m, beam of 8.2 m, depth of 4.6 m, and main engine power of 436 kW. The trawl net measured 60.5 m in length with a mouth perimeter of 80.4 m, a width of 37.7 m, and a 40 mm mesh size at the cod end. Based on bottom conditions and hydrographic features, each station was trawled once for one hour at an average speed of 3 nautical miles per hour. The total catch of round scad and jack mackerel per station was recorded, standardized by trawling duration (kg/h), and used to estimate catch rate.

2.1.2. Environmental Factors

Environmental parameters—sea surface temperature (SST), sea surface salinity (SSS), sea bottom temperature (BotT), sea bottom salinity (BotS), and water depth—were simultaneously measured at each station using conductivity–temperature–depth (CTD) sensors. Sea surface chlorophyll a concentration (SSC) were determined by filtering 1 L of seawater through pre-combusted Whatman GF/F filters (47 mm diameter) produced in the UK. Filters were stored in the dark at −20 °C for 24 h before pigment extraction in 90% acetone. SSC were then quantified fluorometrically following the protocol of Yentsch and Menzel [23], using a Turner Designs 10-AU fluorometer.
Biotic variables included phytoplankton and zooplankton abundance. Phytoplankton samples were collected using a shallow-water Type III plankton net (77 μm mesh, 37 cm mouth diameter, 270 cm length), and zooplankton samples were obtained with a Type I net (0.505 mm mesh, 50 cm mouth diameter, 145 cm length). Both sample types were collected via vertical tows from the bottom to the surface. The samples were preserved in 5% formalin and transported to the laboratory for taxonomic identification and abundance analysis.

2.2. Data Analyses

2.2.1. Fish Stock Density

Fish stock density of round scad and jack mackerel was estimated at each station using the following formula (Equation (1)), adapted from Sparre and Venema [24] and further employed by Wang et al. [12,25]:
P   =   C q × A
where P denotes stock density (kg/km2), C is the catch per hour (kg), q is the gear catchability coefficient (set at 0.5), and A is the area swept per hour (km2). This metric served as a proxy for species abundance in subsequent analyses.

2.2.2. Species Distribution Models

To assess multicollinearity among explanatory variables, variance inflation factors (VIFs) were calculated. Variables with VIF values exceeding 3 were considered to exhibit multicollinearity, following the threshold proposed by Sagarese et al. [26]. Variable selection was further guided by biological relevance to round scad and jack mackerel.
Generalized additive models (GAM) and generalized linear models (GLM) were constructed using the “mgcv” and “glm” packages, respectively [27]. Their functional forms are expressed as follows:
g Y = α + i = 1 n F i X i + ε
g Y = α + i = 1 n β X i + ε
where g() is the link function, Y is the response variable (fish stock density), X1…Xₙ are predictor variables (SST, SSS, BotT, BotS, SSC, water depth, phytoplankton abundance, and zooplankton abundance), Fᵢ denotes the smoothing function in GAMs, βᵢ are regression coefficients in GLMs, α is the intercept, and ε is the random error.
Random Forest (RF), an ensemble learning algorithm, was also employed to model species abundance [28]. Following Liaw and Wiener [29], the RF model was built by generating 1000 bootstrapped decision trees from the original dataset. At each node, a random subset of features was evaluated to identify the optimal split, and trees were allowed to grow fully without pruning. Predictions were aggregated by averaging outputs across all trees. RF implementation was conducted using the “RandomForest” package.
GLM, GAM, and RF models were constructed using data collected during four seasonal surveys around Hainan Island between 2021 and 2022. These models were used to analyze spatial and seasonal patterns in round scad and jack mackerel abundance and their associations with environmental variables. The inclusion of additional environmental predictors affected model performance, as reflected by changes in deviance explained and Akaike information criterion (AIC) values for GAMs and GLMs, and by deviance explained in RF models. Following the model selection criteria of Johnson and Omland [30], the best-fitting models were those with the highest deviance explained and lowest AIC values.

3. Results

3.1. Model Selection

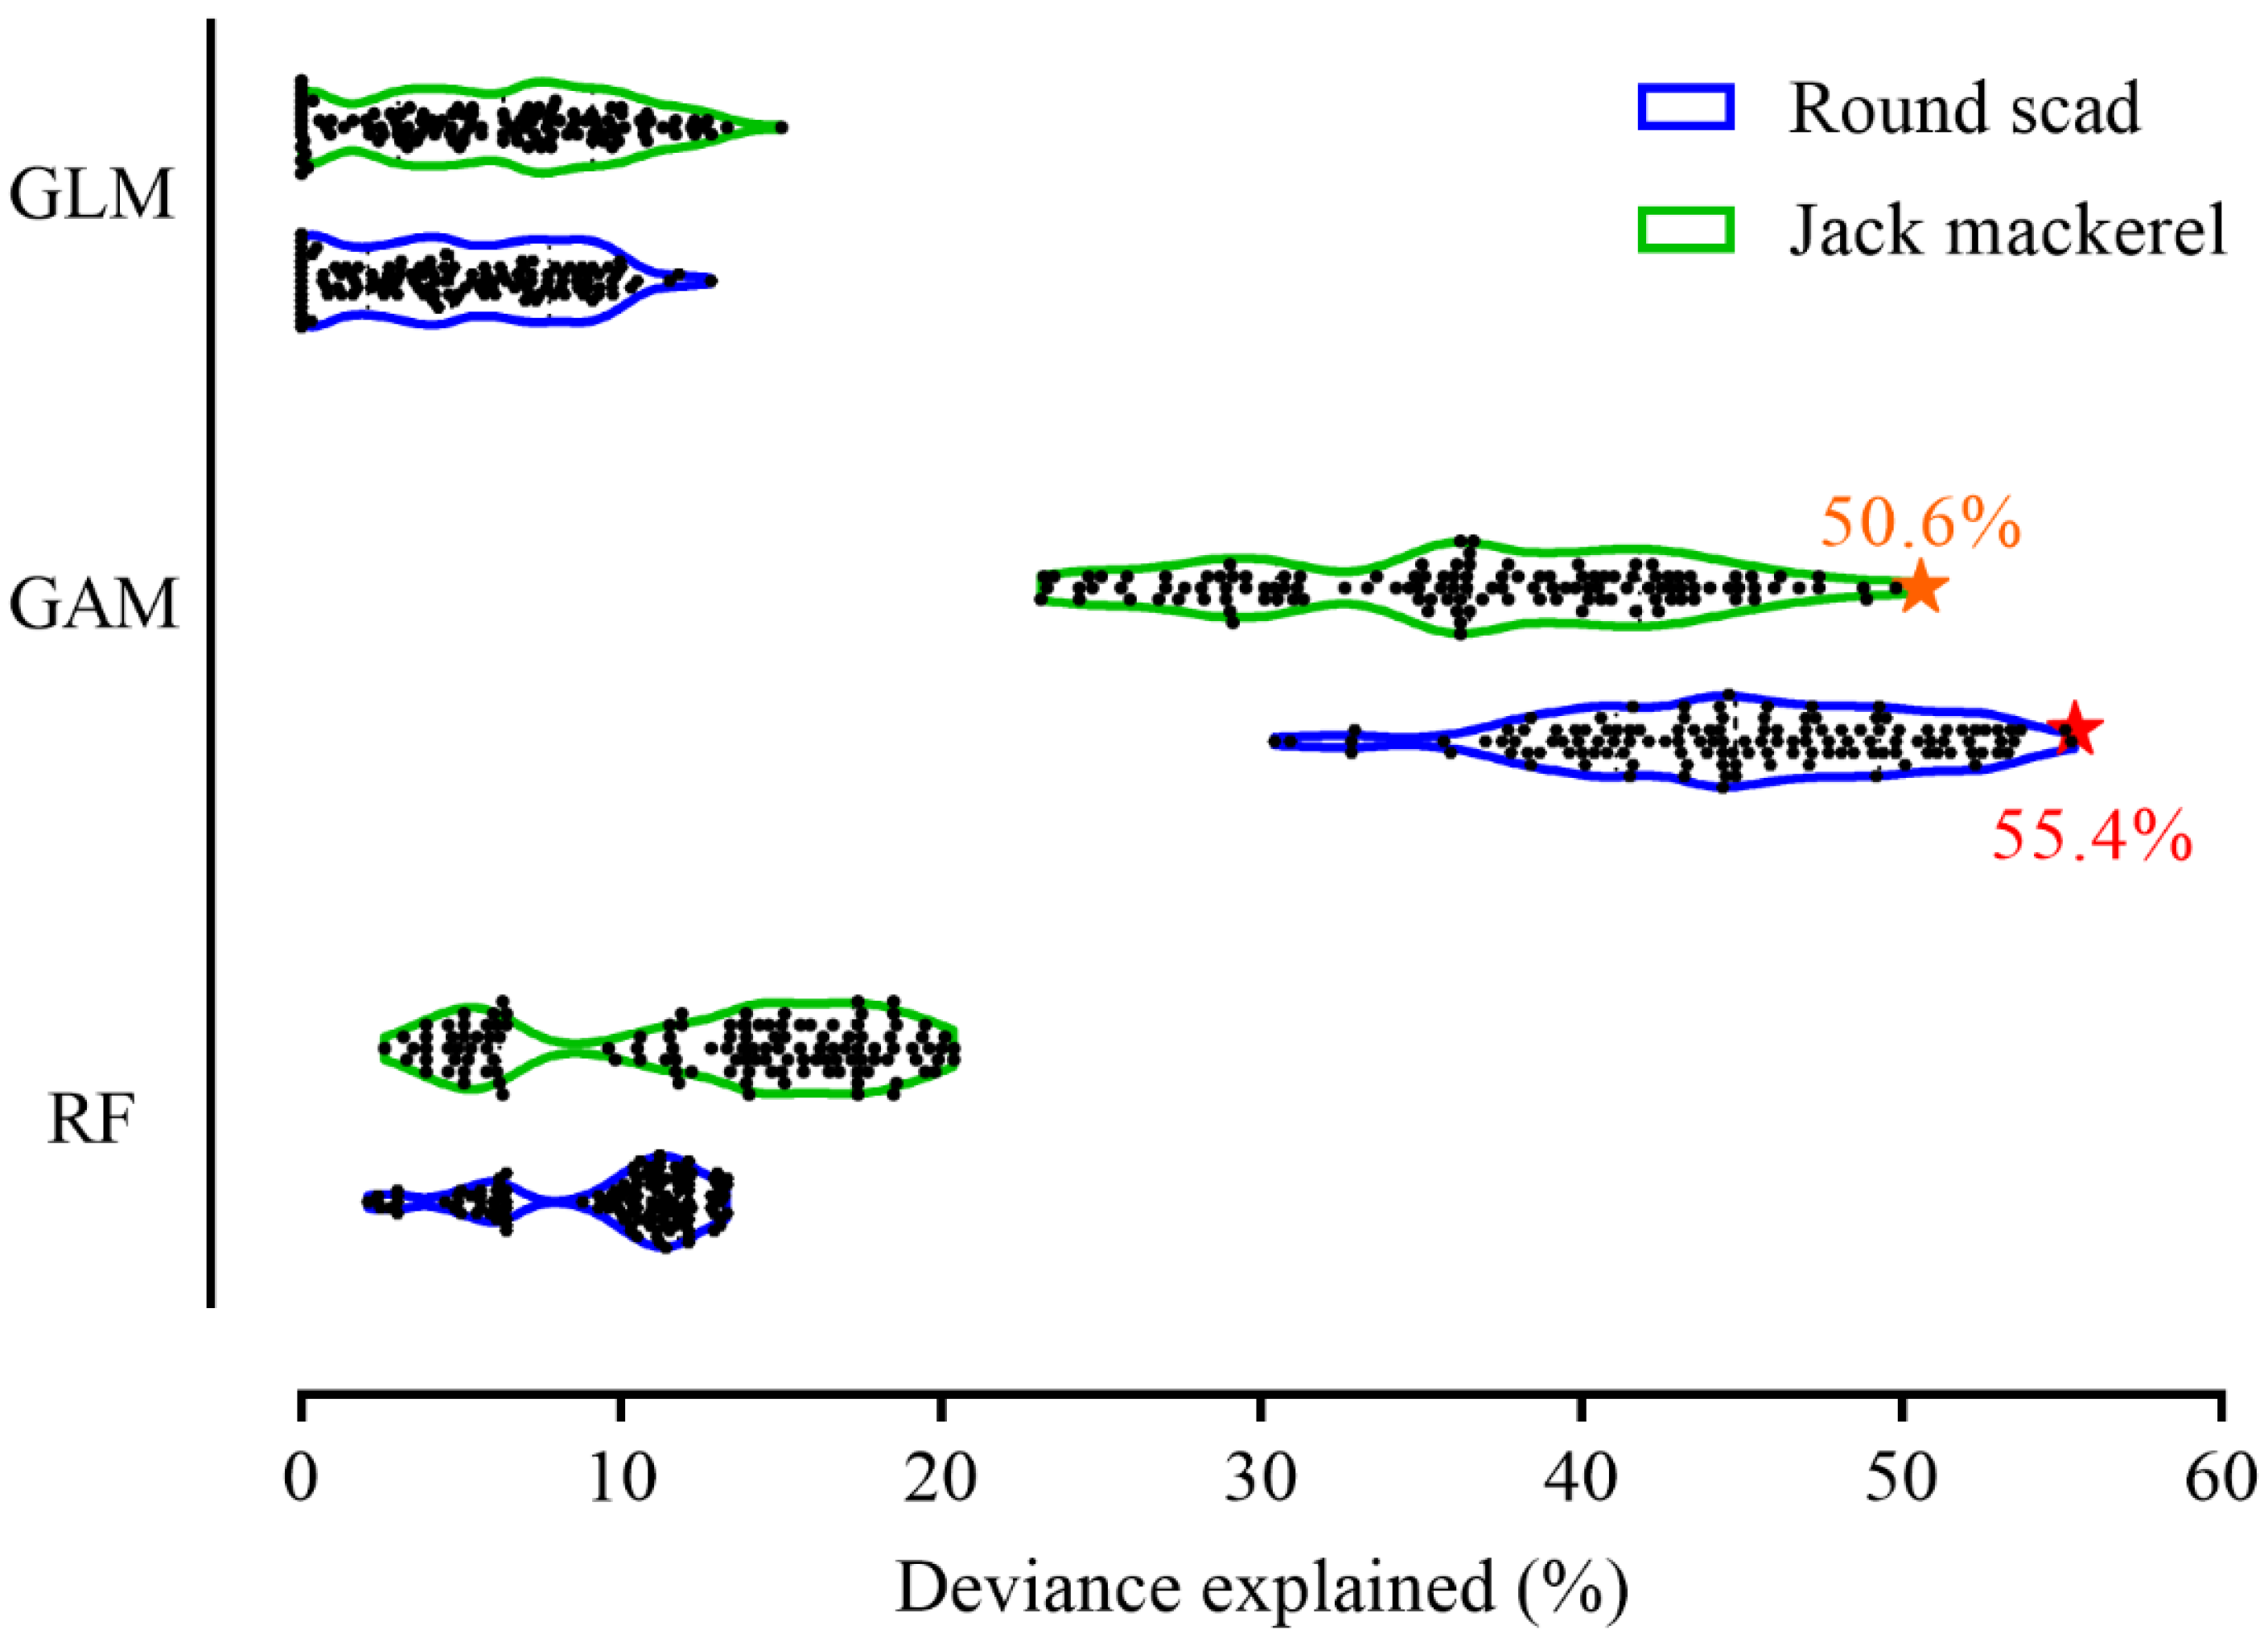
Variance inflation factor (VIF) analysis identified only BotS as exceeding the critical threshold, with a value of 5.07. Therefore, variables including longitude, latitude, SST, BotT, SSS, SSC, water depth, and phytoplankton and zooplankton abundance were retained in model construction. To examine the relationship between species distribution and environmental factors, three models—GLM, GAM, and RF—were applied. The GAM model exhibited the highest explanatory power, accounting for 55.4% and 50.6% of the deviance for round scad and jack mackerel, respectively. In contrast, both GLM and RF explained less than 20% of the deviance, significantly lower than that of the GAM model (Figure 2).

3.2. Characteristics of Stock Density Distribution of Round Scad and Jack Mackerel

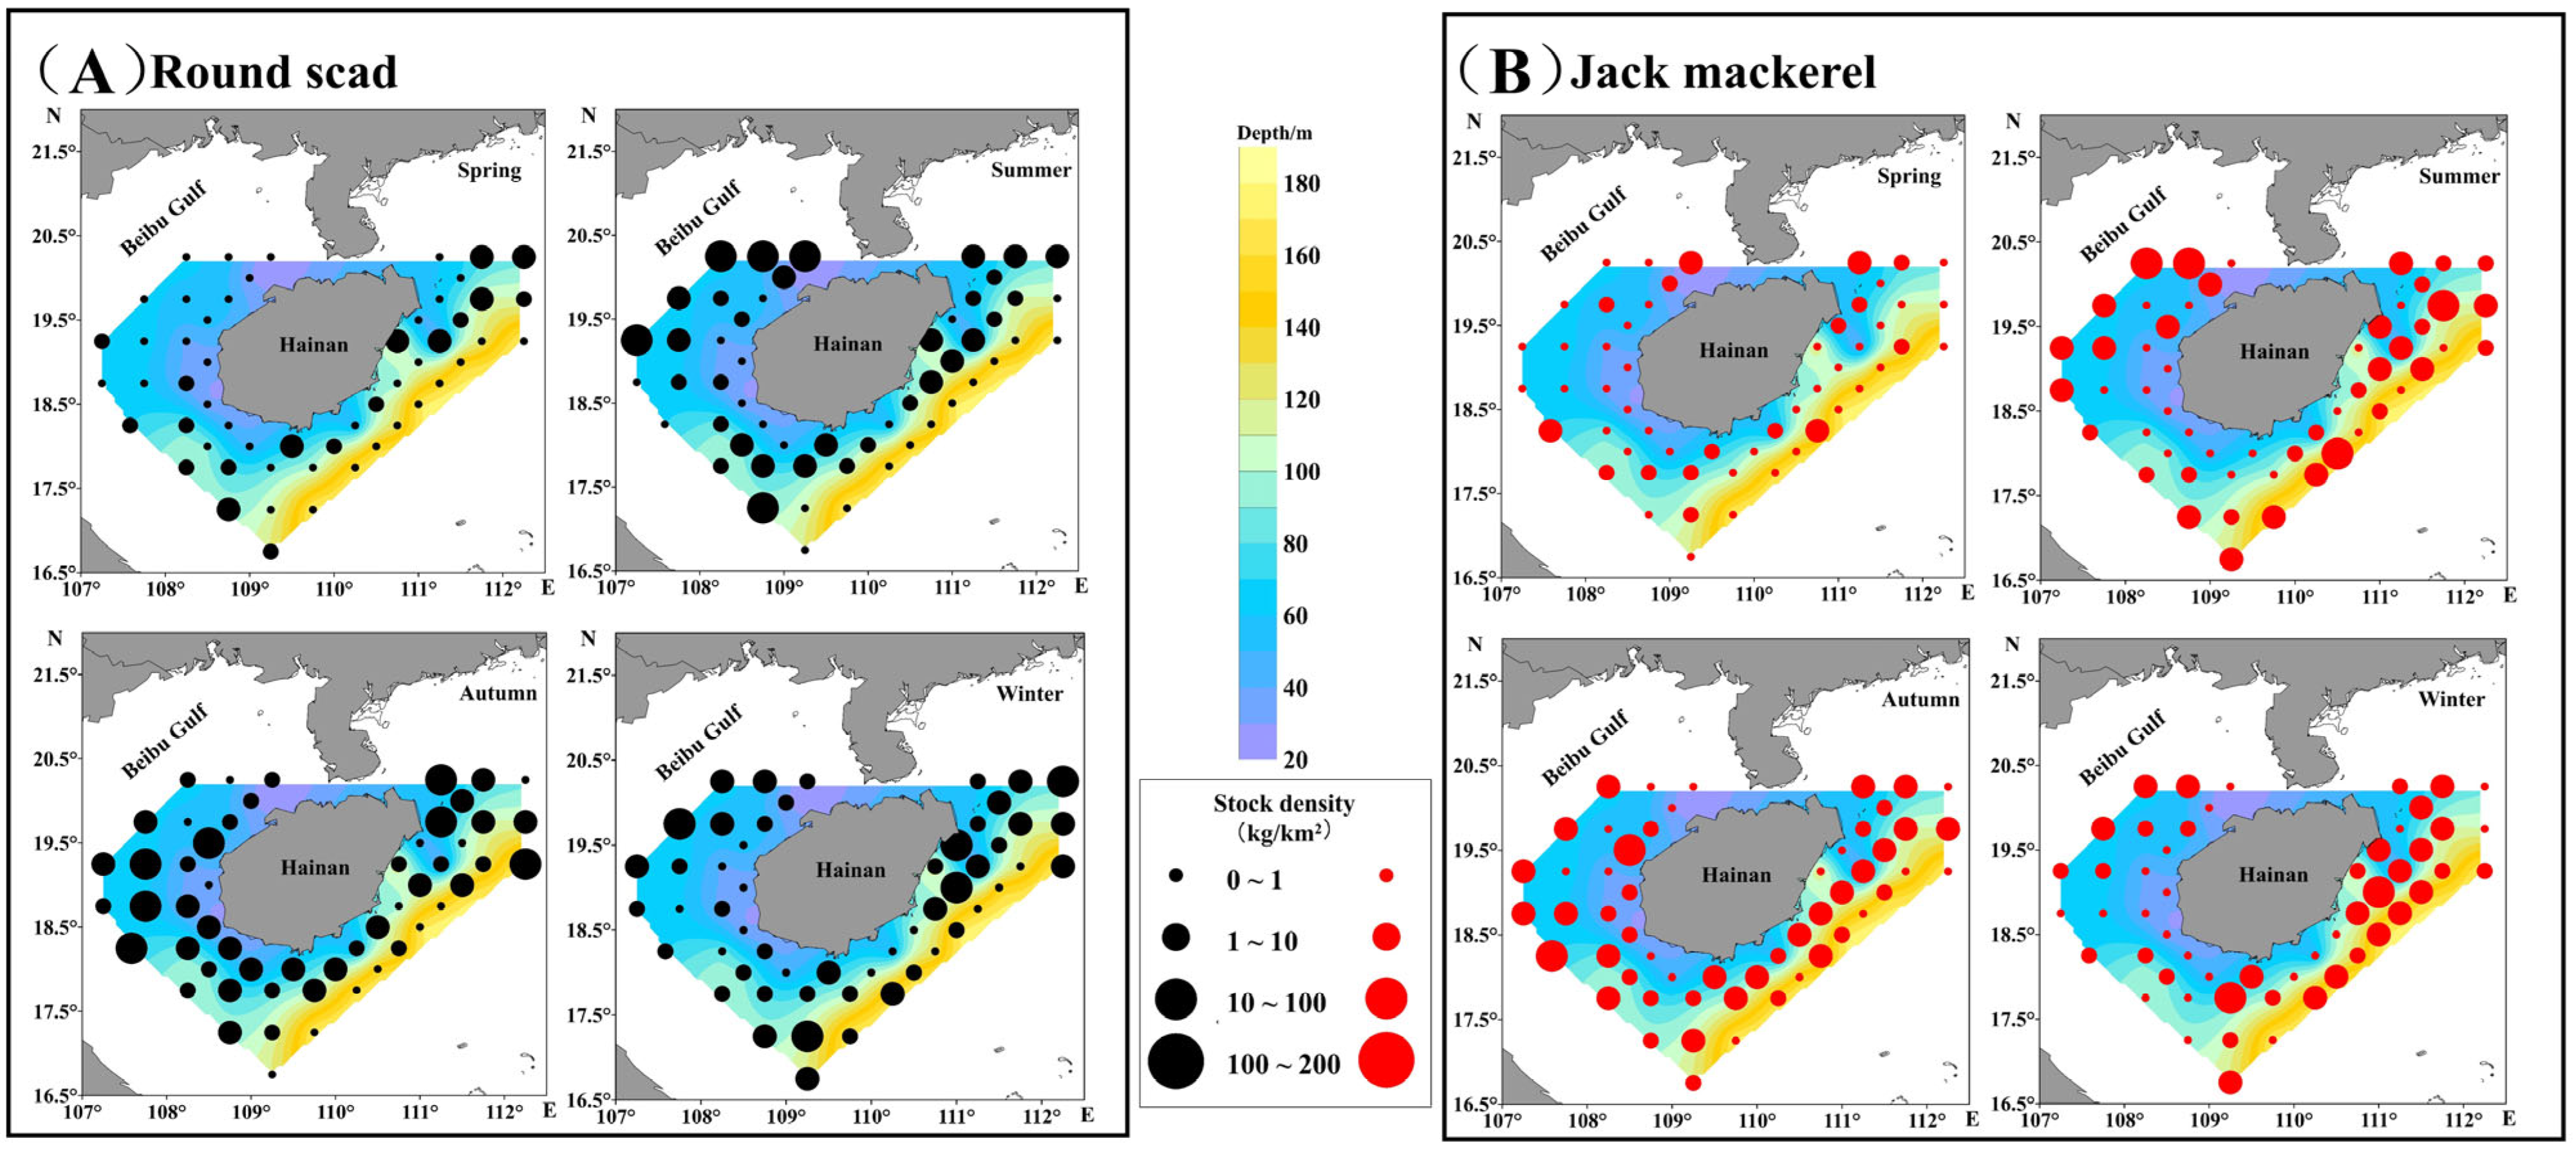
Stock densities of round scad and jack mackerel exhibited pronounced spatial and temporal variability. No significant difference was observed between the species during spring; however, in the other three seasons, round scad density was markedly higher. Both species reached peak densities in summer, followed by autumn, with the lowest densities in winter and spring. In spring, their distributions were concentrated from the Beibu Gulf estuary to the western coast of Hainan Island, with scattered presence in the eastern waters of Hainan Island and central Beibu Gulf. During summer, both species expanded across the offshore waters surrounding Hainan Island, with round scad favoring coastal zones, while jack mackerel occupied deeper waters. In autumn, their ranges broadened considerably, with substantial spatial overlap. High-density regions extended from the central Beibu Gulf to its estuary and into the eastern waters of Hainan Island. In winter, distributions shifted to deeper areas of the central and estuarine Beibu Gulf, as well as the eastern Hainan waters. While high-density zones overlapped, jack mackerel exhibited notably higher densities in waters exceeding 100 m in depth east of Hainan Island (Figure 3).
Additionally, we calculated the number of stations where the density of each species exceeded 10 kg/km2 across the four seasons. For round scad, the corresponding values were 7 stations (12.96%), 19 stations (35.18%), 26 stations (48.15%), and 20 stations (37.04%). For jack mackerel, the numbers were 4 stations (7.41%), 20 stations (37.04%), 23 stations (42.59%), and 19 stations (35.16%). Further analysis was performed to examine the overlap of stations where the stock density of both species exceeded 10 kg/km2 across each season. The number of overlapping stations by season was 0 in spring, 10 in summer, 15 in autumn, and 13 in winter. Excluding spring, the proportion of overlapping high-density stations relative to the total number of high-density stations for each species surpassed 50% in all other seasons. It can be inferred from the aforementioned content that overlapping stations with high stock density are predominantly concentrated in the Beibu Gulf area to the west of Hainan Island, whereas minimal overlap is observed in the eastern region of the Hainan island.

3.3. The Effect of Main Factors on the Stock Density Distribution of Round Scad and Jack Mackerel

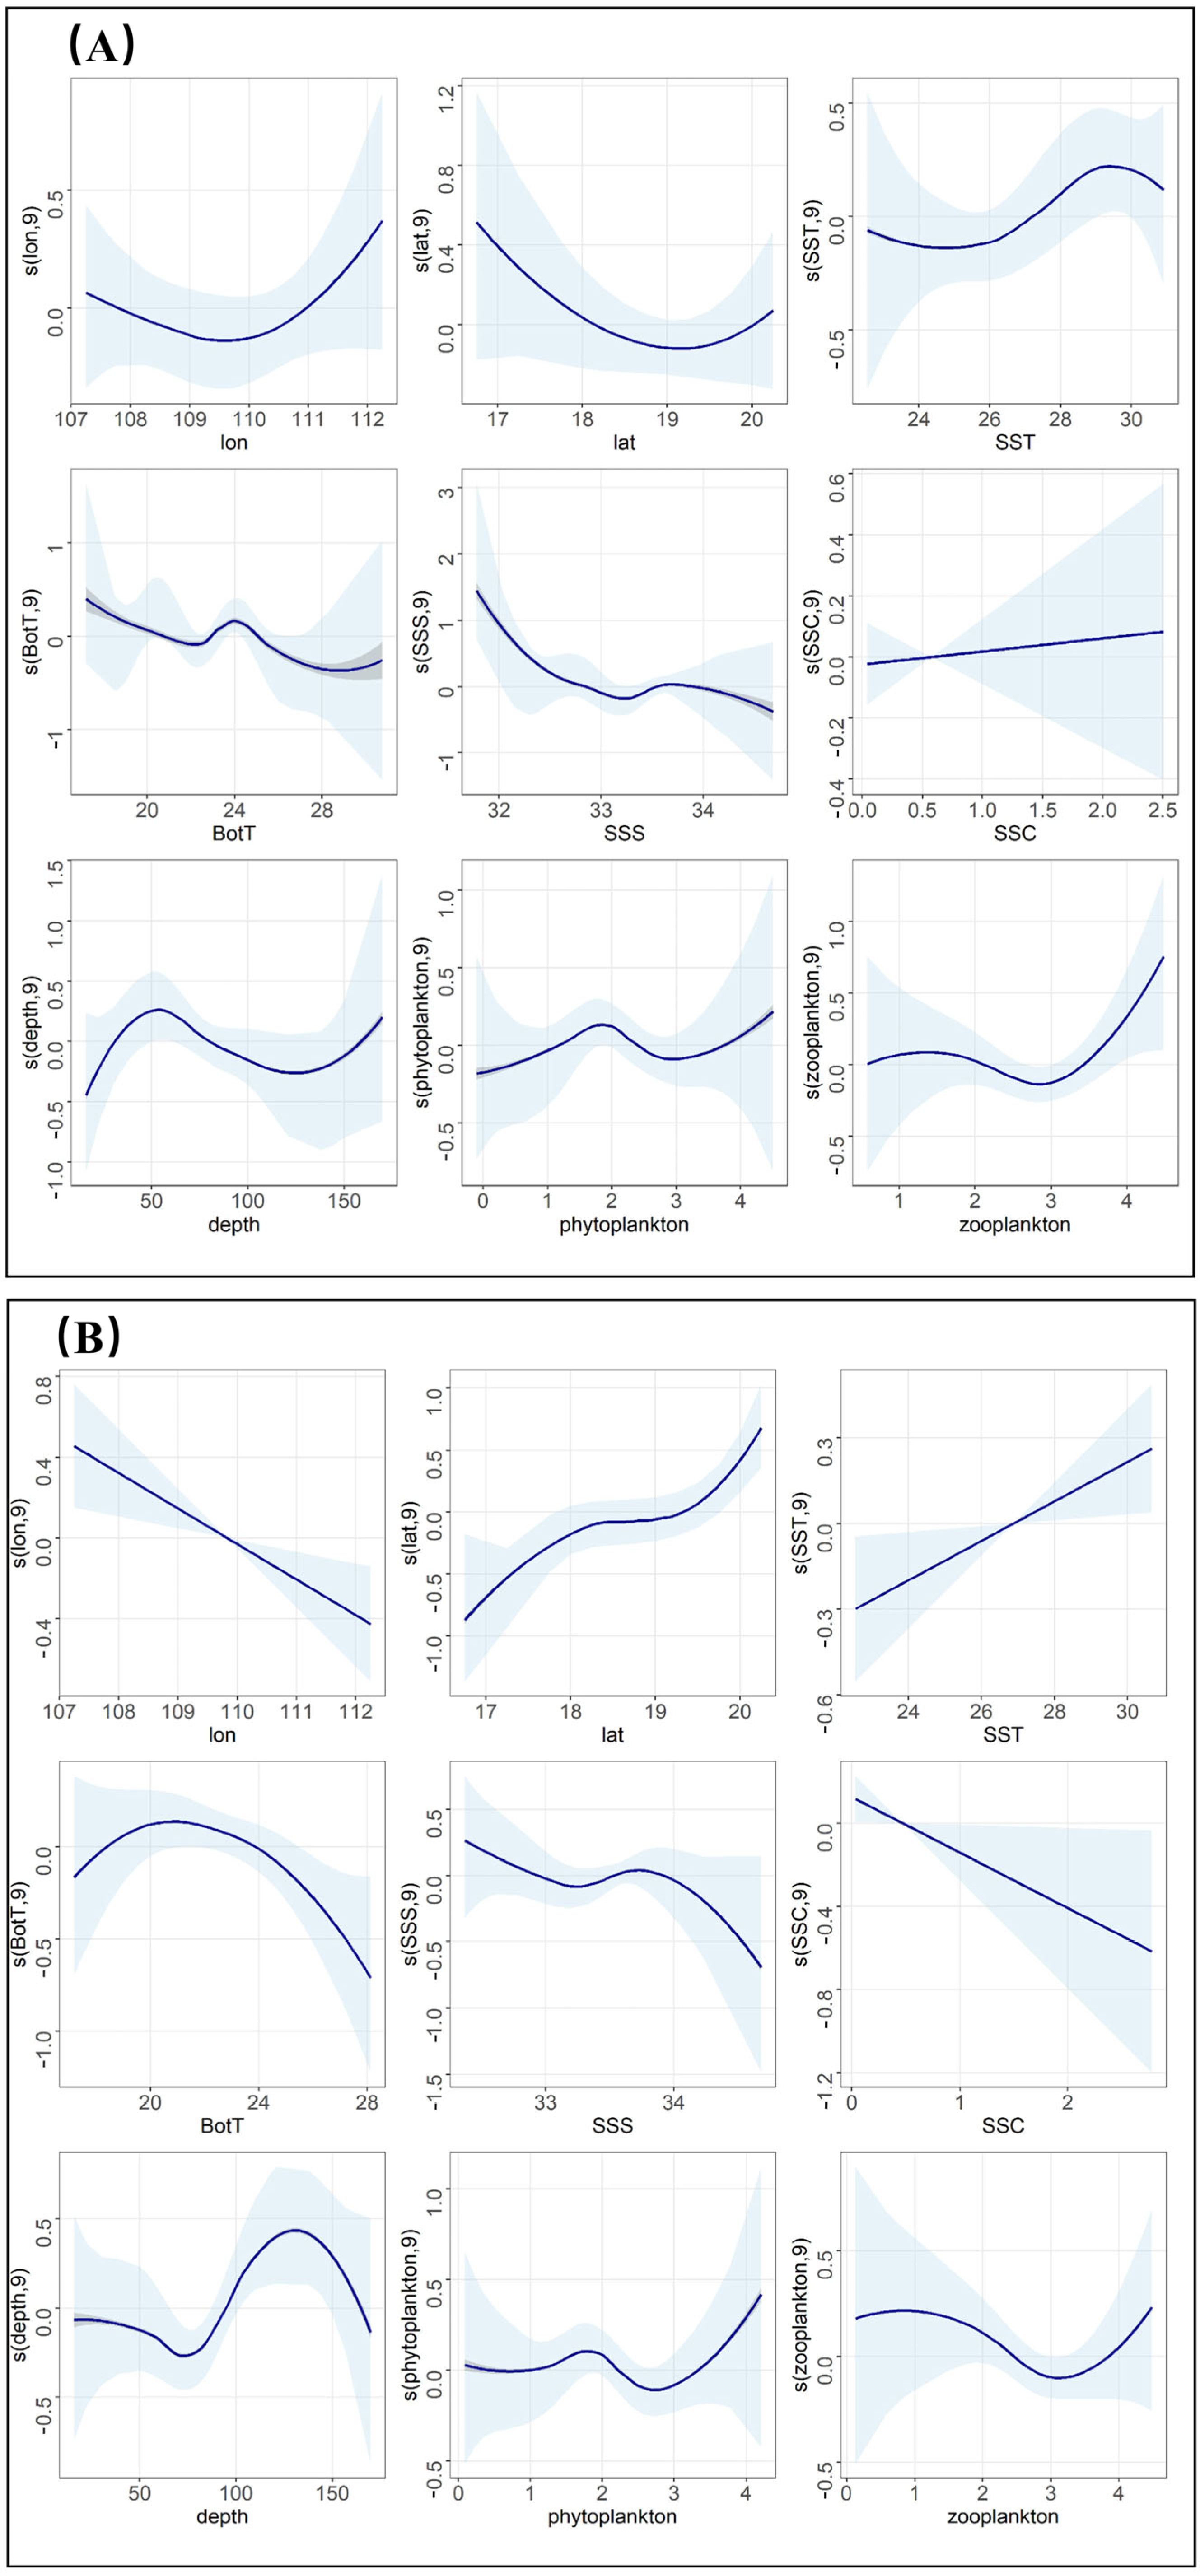
The effects of key environmental variables on the distribution of round scad and jack mackerel, as derived from the optimal GAM model, are presented in Table 1 and Figure 4. The two species demonstrated contrasting responses to longitude, latitude, and water depth, indicating differences in habitat preference and vertical distribution. However, they exhibited similar response trends to SSS, phytoplankton, and zooplankton abundance, implying overlapping dietary niches. Notable differences emerged in response to SST and BotT. Round scad densities peaked sharply when SST ranged between 28 °C and 30 °C, while jack mackerel densities increased steadily with rising SST. Round scad abundance was negatively correlated with BotT, showing a decline with increasing temperature but peaking at 24 °C. In contrast, jack mackerel abundance followed a dome-shaped pattern relative to BotT, peaking between 20 °C and 21 °C.

4. Discussion

4.1. Comparison of Distribution Patterns Between Round Scad and Jack Mackerel

Round scad and jack mackerel are warm-water pelagic migratory species predominantly distributed in the northern SCS, ranging from eastern Guangdong to the Beibu Gulf. They form large schools and are major targets of light falling and trawl net fisheries [13,17,18]. Among the most abundant species in the region, round scad typically inhabit muddy and sandy seabeds at depths less than 200 m [12]. They undertake seasonal migrations from the Taiwanese Shoals to the Beibu Gulf, moving to nearshore waters during winter and spring to feed and spawn. With the onset of the southwest monsoon—characterized by increased rainfall, wind, and wave activity—post-spawning individuals gradually migrate offshore [31]. In late winter and early spring, weakening coastal currents and intensifying offshore flows prompt general inshore migration among pelagic species in the northern SCS, including round scad, jack mackerel, and sardinella [31,32]. Jack mackerel have a broad distribution in the northwestern Pacific, including the Bohai Sea, Yellow Sea, East China Sea, and SCS. Their highest catches occur in the East China Sea, followed by the SCS, where annual landings reach tens of thousands of tons [33]. In the SCS, spawning populations are mainly concentrated off the western coast of Guangdong, the outer Pearl River Estuary, the eastern Guangdong coast, and the Beibu Gulf [34]. The spawning season extends from October to April, with peak spawning between December and January [34]. These findings indicate clear spatial and temporal differences in the distribution of round scad and jack mackerel—patterns consistent with those observed in our study (Figure 3). Seasonally, both species exhibit peak stock densities in summer, followed by autumn, with the lowest densities in spring. This trend aligns with their pronounced migratory behaviors. Spatially, their distributions overlap more extensively in the Beibu Gulf, while jack mackerel show higher densities in deeper waters off eastern Hainan Island. These patterns reflect distinct regional habitat preferences between the two species. Previous studies have shown that spatial distribution patterns of marine species result from the interplay between biological traits and environmental factors [35]. For pelagic fish such as round scad and jack mackerel, key life-history traits—including spawning, foraging, schooling, and migration—are tightly linked to seasonal variability in the marine environment [36].

4.2. Similarities and Differences in Response to Environmental Changes Between Round Scad and Jack Mackerel

Temperature, salinity, and water depth are key environmental factors influencing fish migration patterns and spatial distribution [12,37]. For round scad and jack mackerel, their spatio-temporal distribution in the Beibu Gulf is significantly shaped by variations in these parameters. Previous research has highlighted the critical roles of temperature, salinity, sea level height, and water depth in determining their distribution patterns. Specifically, temperature and salinity affect not only the reproduction, survival, and growth of these species but also directly influence their spatial distribution [12,38]. In the northern fishing grounds of the SCS, round scad distribution has been closely linked to SST and SSC. Seasonal differences have also been observed in the environmental drivers of fishing ground distribution, with SSC emerging as a particularly decisive factor during spring [18]. This association is likely due to the influence of SSC on the distribution of large zooplankton, small fish, and crustaceans—key prey items for round scad [18]. Wang et al. [12] further demonstrated that the offshore distribution of round scad near Hainan Island is significantly influenced by temperature, salinity, plankton abundance, and jack mackerel stock density. Similarly, Feng et al. [39], using a GAM, analyzed the relationship between jack mackerel distribution and environmental variables—temperature, salinity, sea level anomaly (SLA), SSC, and water depth—and identified SLA and water depth as dominant factors. Additional studies have underscored the importance of SST and sea surface height (SSH) as critical indicators for delineating suitable jack mackerel habitats in the northern continental shelf of the SCS. Zhang et al. [8] reported that during four La Niña events (2007/2008, 2010/2011, 2011/2012, and 2020/2021), the biomass of round scad and jack mackerel in the Beibu Gulf exhibited abnormal and rapid increases. Collectively, these findings suggest that under climate change, the resource fluctuations of round scad and jack mackerel may exhibit certain distinct differences., yet differently, to environmental variability—particularly with respect to temperature, salinity, and SSH.
In the present study, a comparative evaluation of three species distribution models—GLM, GAM, and RF—revealed that the GAM provided the best fit. When variables such as longitude, latitude, SST, BotT, SSS, SSC, water depth, and phytoplankton and zooplankton abundance were included, the GAM explained the highest proportion of deviance and achieved the most accurate model performance. However, the fitted relationships between environmental variables and species distributions differed significantly between round scad and jack mackerel, indicating distinct ecological responses and environmental suitability under projected climate scenarios. Long-term catch data analyzed by Wang et al. [12] show marked interannual fluctuations in round scad and jack mackerel populations in the northern SCS, with notably divergent trends. Correlation analyses in this study also reveal distinct spatial distribution patterns. In waters shallower than 50 m, round scad stock density tends to increase, while jack mackerel density shows a relatively steady decline. Conversely, in depths of 50–200 m, round scad density generally decreases, whereas jack mackerel density increases. Previous studies have shown that round scad spawning predominantly occurs in waters shallower than 50 m in the Beibu Gulf and off eastern Hainan Island [19,40], consistent with the higher stock densities observed in shallower waters in this study. In contrast, jack mackerel are primarily distributed in deeper waters. Feng et al. [39] reported higher jack mackerel stock densities in the central to outer Beibu Gulf during summer, while Yan et al. [17,35] found high-density zones primarily in waters deeper than 50 m, including in the eastern waters of Hainan Island. These findings align closely with the optimal depth range identified in the model for jack mackerel distribution. Moreover, Xiong et al. [14] found that jack mackerel habitats are particularly suitable in regions extending from the Beibu Gulf to the northern SCS shelf. However, under future climate change scenarios, suitable jack mackerel habitats in the 40–100 m depth range may contract, potentially reducing the extent of optimal habitat availability.
The GAM results revealed that round scad and jack mackerel exhibited similar response curves to both zooplankton and phytoplankton abundance, indicating that fluctuations in plankton populations may exert comparable influences on the stock abundance of both species. Previous studies have shown that juvenile round scad primarily consume copepods and other planktonic animals, gradually incorporating small fish into their diets as they mature. Similarly, juvenile jack mackerel feed on copepods, cladocerans, and other small planktonic organisms, expanding their diet to include small fish in later life stages [9,33,40]. The feeding intensity and prey composition of both species vary across temporal and spatial scales, with notable dietary shifts associated with life history stages [9,33]. A study on their feeding ecology and interspecific competition in the Beibu Gulf reported trophic levels of 3.63 for round scad and 3.40 for jack mackerel, and trophic niche widths of 1.70 and 1.24, respectively. A niche overlap coefficient of 0.56 suggests moderate food competition [9]. Although both species share similar zooplankton prey preferences, each exhibits distinct selectivity for certain plankton types or small fish. Overall, food competition between them in the Beibu Gulf remains relatively low, supporting their coexistence within the same habitat and the potential for either species to become dominant [9]. In recent years, round scad and jack mackerel have emerged as the primary economic fish species in the northern SCS. Further research is warranted to explore whether more complex interspecific competition mechanisms, particularly those involving distributional and feeding dynamics across life stages, are at play.

4.3. Future Work

In this study, we examined two ecologically and economically important pelagic species in the waters surrounding Hainan Island. These species are key commercial resources in the SCS and are commonly targeted by light fishing vessels and various trawling methods, including bottom trawling and midwater trawling. However, due to methodological constraints in data collection, all samples analyzed in this study were obtained exclusively from bottom trawl surveys. A consistent sampling protocol was applied across all seasons and sampling locations. Although bottom trawling may exert a repulsive effect on pelagic and midwater species, potentially affecting the accuracy of absolute density estimates, the relative abundance trends derived from the data remain reliable. This limitation in capturing true absolute densities is acknowledged as a constraint of the present study. Furthermore, resource density was assessed using biomass rather than numerical abundance. In cases where significant size or weight variation exists within populations, this approach may introduce certain biases into the results—highlighting a need for more comprehensive analyses in future research. Therefore, acquiring more representative, high-resolution data through improved sampling strategies will be essential for advancing the understanding of these fish populations.
We selected a range of environmental factors—including temperature, salinity, and plankton abundance—to examine the similarities and differences in resource distribution responses between the two fish species. However, in the context of the SCS, variables such as primary productivity and nutrient availability may exert a more direct influence on resource dynamics [2,12]. Furthermore, under ongoing climate change, various environmental factors exhibit distinct response patterns. Continuous monitoring of recurrent extreme weather events—such as the El Niño-Southern Oscillation (ENSO)—is therefore essential. Incorporating these considerations could enable a more comprehensive understanding of the distribution patterns of pelagic species in the SCS, thereby supporting scientifically informed management strategies.

5. Conclusions

In this study, we simultaneously employed GLM, GAM and RF to fit the relationship between the stock density distribution of round scad and jack mackerel and environmental factors. The results show that both fish species have a higher deviance explained in the GAM, that is, they have better fitting effects. The spatiotemporal distribution of round scad and jack mackerel exhibits notable differences, as do their responses to various environmental factors. Both species show distinct reactions to environmental variables such as water depth and temperature across different ranges, whereas their response patterns in varying plankton abundance intervals are comparatively similar. In addition, there may be a certain degree of overlap in their dietary habits at different stages of their life history. In recent years, under the dual impact of intense fishing pressure and climate change, the resources of such pelagic fish have shown relatively obvious interannual variations. At the same time, understanding the similarities and differences in the responses of these species with high ecological niche overlap to environmental factors is of great significance for the subsequent formulation and management of fishery resource policies.

Author Contributions

Conceptualization, L.W. and D.S.; data curation, L.W. and C.Y.; formal analysis, L.W., C.Y. and B.S.; funding acquisition, D.S.; investigation, C.Y., Y.L. and B.S.; methodology, L.W.; project administration, D.S.; resources, C.Y. and B.S.; software, L.W. and B.S.; supervision, C.Y. and D.S.; validation, L.W.; visualization, D.S.; writing—original draft preparation, L.W.; writing—review and editing, L.W. All authors have read and agreed to the published version of the manuscript.

Funding

This work was partially supported by the Hainan Provincial Natural Science Foundation of China under contract No. 324QN367, Guangzhou Basic and Applied Basic Research Project (2023A04J1511), Central Public-interest Scientific Institution Basal Research Fund, CAFS (No. 2023RC03), National Natural Science Foundation of China (42206109), biodiversity, germplasm resources bank and information database construction of the South China Sea Project (No. HNDW2020-112), Science & Technology Fundamental Resources Investigation Program (Grant No. 2023FY100803).

Institutional Review Board Statement

Not applicable.

Data Availability Statement

The original contributions presented in this study are included in the article. Further inquiries can be directed to the corresponding author.

Acknowledgments

We are grateful to the entire crew of the Guibeiyu 69068 for their invaluable assistance in facilitating data collection.

Conflicts of Interest

The authors declare no conflicts of interest. The funders had no role in the design of the study; in the collection, analysis, or interpretation of the data; in the writing of the manuscript; or in the decision to publish the results.

References

  1. Yang, J.Q.; Ouyang, L.L.; Tang, F.H.; Shi, Y.R.; Chao, M.; Wang, Y.L. Relationship between the zooplankton community structure and environmental factors offshore of northwest Hainan Island, China. J. Fish. Sci. China 2020, 27, 236–249. [Google Scholar]
  2. Qiu, Y.S.; Zeng, X.G.; Chen, T.; Yuan, W.W. Fishery Resources and Fisheries Management in the South China Sea; China Ocean Press: Beijing, China, 2008. [Google Scholar]
  3. Gao, J.S. The Research on the Eddy in the Northern South China Sea and Circulation in the Beibu Gulf; Ocean University of China: Qingdao, China, 2013. [Google Scholar]
  4. Zhu, J.Y.; Zhou, Q.Y.; Zhou, Q.Q.; Geng, X.X.; Shi, J.; Guo, X.Y.; Yu, Y.; Yang, Z.W.; Fan, R.F. Interannual variation of coastal upwelling around Hainan Island. Front. Mar. Sci. 2023, 10, 1054669. [Google Scholar] [CrossRef]
  5. Sun, D.R.; Li, Y.; Wang, X.H. Seasonal changes of species composition and diversity of fishes in coastal waters of Hainan Island, China. South China Fish. Sci. 2012, 8, 1–7. [Google Scholar]
  6. Zhang, Y.X.; Liu, W.; Zhao, H.L.; Wu, C.H.; Chen, M. Diversity analysis of nekton in the offshore waters of Hainan Island in spring and autumn. J. Fish. Res. 2021, 43, 133–142. [Google Scholar]
  7. Yu, J.; Lin, Z.N.; Chen, P.M.; Yao, L.J. Environmental factors affecting the spatiotemporal distribution of Decapterus maruadsi in the western Guangdong waters, China. Appl. Ecol. Environ. Res. 2019, 17, 8485–8499. [Google Scholar] [CrossRef]
  8. Zhang, K.; Li, M.; Li, J.J.; Sun, M.S.; Xu, Y.W.; Cai, Y.C.; Chen, Z.Z.; Qiu, Y.S. Climate-induced small pelagic fish blooms in an overexploited marine ecosystem of the South China Sea. Ecol. Indic. 2022, 145, 109598. [Google Scholar] [CrossRef]
  9. Li, Z.L.; Zhang, W.X.; He, X.B.; Yan, Y.R. Feeding ecology and feeding competition between Decapterus maruadsi and Trachurus japonicus in autumn in the Beibu Gulf, South China Sea. J. Guangdong Ocean Univ. 2019, 39, 79–86. [Google Scholar]
  10. Wang, K.L.; Gong, Y.Y.; Chen, Z.Z.; Xu, Y.W.; Sun, M.S.; Cai, Y.C.; Li, J.J.; Xu, S.N. Trophic niche of Decapterus maruadsi in the northern South China Sea as revealed by stable isotope techniques. Chin. J. Ecol. 2022, 41, 724–731. [Google Scholar]
  11. Zhai, Y. Study on the Population Genetics of Decapterus maruadsi from the Northern South China Sea; Guangdong Ocean University: Zhanjiang, China, 2020. [Google Scholar]
  12. Wang, L.M.; Yang, C.P.; Liu, Y.; Shan, B.B.; Ma, S.W.; Sun, D.R. Effects of biotic and abiotic factors on the spatiotemporal distribution of round scad (Decapterus maruadsi) in the Hainan Island offshore area. Diversity 2023, 15, 659. [Google Scholar] [CrossRef]
  13. Yan, R.; Fan, J.T.; Xu, S.N.; Xu, Y.W.; Sun, M.S.; Chen, Z.Z. Spatial distribution of jack mackerel (Trachurus japonicus) in the northern South China Sea based on geostatistics. J. Trop. Oceanogr. 2018, 37, 133–139. [Google Scholar]
  14. Xiong, P.L.; Cai, Y.C.; Jiang, P.W.; Xu, Y.W.; Sun, M.S.; Fan, J.T.; Chen, Z.Z. Impact of climate change on the distribution of Trachurus japonicus in the Northern South China Sea. Ecol. Indic. 2024, 60, 111758. [Google Scholar] [CrossRef]
  15. Chavez, F.P.; Ryan, J.; Lluch-Cota, S.E.; Miguel, N.C. From anchovies to sardines and back: Multidecadal change in the Pacific Ocean. Science 2003, 299, 217–221. [Google Scholar] [CrossRef] [PubMed]
  16. Ma, S.Y.; Cheng, J.J.; Li, J.C.; Liu, Y.; Wan, R.; Tian, Y.J. Interannual to decadal variability in the catches of small pelagic fishes from China seas and its responses to climatic regime shifts. Deep Sea Res. Part II Top. Stud. Oceanogr. 2019, 159, 112–129. [Google Scholar] [CrossRef]
  17. Yan, R.; Fan, J.T.; Xu, S.N.; Xu, Y.W.; Sun, M.S.; Chen, Z.Z. Distribution characteristics of jack mackerel (Trachurus japonicus) habitat in the offshore waters of northern South China Sea. Chin. J. Ecol. 2018, 37, 2430–2435. [Google Scholar]
  18. Fan, J.T.; Huang, Z.R.; Xu, Y.W.; Sun, M.S.; Chen, G.B.; Chen, Z.Z. Habitat model analysis for Decapterus Maruadsi in Northern South China Sea based on remote sensing data. Trans. Oceanol. Limnol. 2018, 3, 142–147. [Google Scholar]
  19. He, L.X.; Fu, D.Y.; Li, Z.L.; Wang, H.; Sun, Y.; Liu, B.; Yu, G. Spatio-temporal distribution of Decapterus maruadsi and its relationship with environmental factors in the northwestern South China Sea. Prog. Fish. Sci. 2022, 43, 1–12. [Google Scholar]
  20. Takasuka, A.; Oozeki, Y.; Aoki, I. Optimal growth temperature hypothesis: Why do anchovy flourish and sardine collapse or vice versa under the same ocean regime. Can. J. Fish. Aquat. Sci. 2007, 64, 768–776. [Google Scholar] [CrossRef]
  21. Takasuka, A.; Oozeki, Y.; Kubota, H.; Lluch-Cota, S.E. Contrasting spawning temperature optima: Why are anchovy and sardine regime shifts synchronous across the North Pacific? Prog. Oceanogr. 2008, 77, 2253232. [Google Scholar] [CrossRef]
  22. Oozeki, Y.; Carranza, M.N.; Takasuka, A.; Dejo, P.A.; Kuroda, H.; Malagas, J.T.; Okunishi, T.; Espinoza, L.V.; Aguilar, D.G.; Okamura, H.; et al. Synchronous multi-species alternations between the northern Humboldt and Kuroshio Current systems. Deep Sea Res. Part II Top. Stud. Oceanogr. 2019, 159, 11–21. [Google Scholar] [CrossRef]
  23. Yentsch, C.S.; Menzel, D.W. A method for the determination of phytoplankton chlorophyll and phaeophytin by fluorescence. Deep. Sea Res. Oceanogr. Abstr. 1963, 10, 221–231. [Google Scholar] [CrossRef]
  24. Sparre, P.; Venema, S.C. Introduction to Tropical Fish Stock Assessment Part I. Manual; FAO Fisheries Technical Paper 2ed; FAO: Rome, Italy, 1998. [Google Scholar]
  25. Wang, X.; Qiu, Y.; Du, F.; Liu, W.; Sun, D.; Chen, X.; Yuan, W.; Chen, Y. Roles of fishing and climate change in long-term fish species succession and population dynamics in the outer Beibu Gulf, South China Sea. Acta Oceanol. Sin. 2019, 38, 1–8. [Google Scholar] [CrossRef]
  26. Sagarese, S.R.; Frisk, M.G.; Cerrat, R.M.; Sosebee, K.A.; Musick, J.A.; Rago, P.J. Application of generalized additive models to examine ontogenetic and seasonal distributions of spiny dogfish (Squalus acanthias) in the northeast (US) shelf large marine ecosystem. Can. J. Fish. Aquat. Sci. 2014, 71, 847–877. [Google Scholar] [CrossRef]
  27. Wood, S.N. Generalized Additive Models: An Introduction with R; Chapman and Hall/CRC Press: Boca Raton, FL, USA, 2006. [Google Scholar]
  28. Breiman, L. Random forests. Mach. Learn. 2001, 45, 5–32. [Google Scholar] [CrossRef]
  29. Liaw, A.; Wiener, M. Classification and regression by randomForest. R News 2002, 2, 18–22. [Google Scholar]
  30. Johnson, J.B.; Omland, K.S. Model selection in ecology and evolution. Trends Ecol. Evol. 2004, 19, 101–108. [Google Scholar] [CrossRef]
  31. Deng, J.Y.; Zhao, C.Y. Marine Fisheries Biology; China Agriculture Press: Beijing, China, 1991. [Google Scholar]
  32. Chen, Z.C.; Liu, J.X. Economic Fish in South China Sea; Guangdong Science and Technology Press: Guangzhou, China, 1982. [Google Scholar]
  33. Li, J.S.; Zhang, Q.Y.; Zheng, Y.J. Review and prospect of biological study on common marine pelagic commercial fishes in China. Mar. Fish. 2014, 36, 565–575. [Google Scholar]
  34. Zhao, C.Y.; Lin, J.Q. Marine Fishery Resource of China; Zhejiang Science & Technology Press: Hangzhou, China, 1990. [Google Scholar]
  35. Dong, Y.W.; Bao, M.H.; Cheng, J.; Chen, Y.Y.; Du, J.G.; Gao, Y.C.; Hu, L.S.; Li, X.C.; Liu, C.L.; Qin, G.; et al. Advances of marine biogeography in China: Species distribution model and its applications. Biodivers. Sci. 2004, 32, 1–31. [Google Scholar] [CrossRef]
  36. Yan, R.; Fan, J.T.; Chen, Z.Z.; Cai, Y.C.; Zhang, K.; Xu, Y.W.; Xu, S.N. The probability distribution of the jack mackerel (Trachurus japonicus) density in the offshore of the northern South China Sea. J. Fish. Sci. China 2019, 26, 91–98. [Google Scholar] [CrossRef]
  37. Odum, E.P. Fundamentals of Ecology; Saunders: Philadelphia, PA, USA, 1971. [Google Scholar]
  38. Sassa, C.; Konishi, Y. Vertical distribution of jack mackerel Trachurus japonicas in the southern part of the East China Sea. Fish. Sci. 2010, 72, 612–619. [Google Scholar]
  39. Feng, Y.T.; Shi, H.Y.; Hou, G.; Zhao, H.; Dong, C.M. Relationships between environmental variables and spatial and temporal distribution of jack mackerel (Trachurus japonicus) in the Beibu Gulf, South China Sea. PeerJ 2021, 9, e12337. [Google Scholar] [CrossRef] [PubMed]
  40. Zheng, Y.J.; Li, J.S.; Zhang, Q.Y.; Hong, W.S. Research progresses of resource biology of important marine pelagic food fishes in China. J. Fish. China 2014, 38, 149–160. [Google Scholar]
Figure 1. Location of survey stations. The shaded colors represent bathymetry according to the colored bar.
Fishes 10 00574 g001
Figure 2. Comparison of deviance explained by different models. (GLM: generalized linear models; GAM: Generalized additive models; RF: Random Forest).
Fishes 10 00574 g002
Figure 3. Spatial distribution of round scad (A) and jack mackerel (B). The black and red circles represent the stock density of round scad and jack mackerel, respectively.
Fishes 10 00574 g003
Figure 4. Relationship between the stock densities of round scad (A) and jack mackerel (B) in the optimal model and their associations with various environmental factors. The blue and gray shaded areas represent the 95% and 99% confidence intervals, respectively.
Fishes 10 00574 g004
Table 1. Parameter analysis of factors in the optimal GAM model (* represents p < 0.05; ** represents p < 0.01).
Explanatory VariablesRound ScadJack Mackerel
Fp-ValueFp-Value
s(lon)0.9920.46099.6710.00242 **
s(lat)1.8270.14723.3180.00301 **
s(SST)1.2490.33796.0330.01572 *
s(BotT)1.4780.13652.5940.05018
s(SSS)2.2850.0202 *1.2570.33499
s(SSC)0.0020.96454.2820.04104 *
s(depth)1.6150.13663.0010.00947 **
s(phytoplankton)0.8090.49851.0450.40522
s(zooplankton)1.8240.15551.3120.27416
Disclaimer/Publisher’s Note: The statements, opinions and data contained in all publications are solely those of the individual author(s) and contributor(s) and not of MDPI and/or the editor(s). MDPI and/or the editor(s) disclaim responsibility for any injury to people or property resulting from any ideas, methods, instructions or products referred to in the content.