Article

Spatial Ecology of the Population of Reef Manta Rays (Mobula alfredi) in New Caledonia Using Satellite Telemetry 2—Vertical Behaviour

by
Hugo Lassauce
1,2,3,4,5,*,†,
Olivier Chateau
5,* and
Laurent Wantiez
2
1
School of Science, Technology & Engineering, University of the Sunshine Coast, Sippy Downs, QLD 4556, Australia
2
Institut de Sciences Exactes et Appliquées, University of New Caledonia, Noumea 98800, New Caledonia
3
Conservation International, Arlington County, VA 22202, USA
4
The Manta Trust, Corscombe, Dorchester DT2 0NT, UK
5
Laboratory of Marine Biology and Ecology, Aquarium des Lagons, Noumea 98800, New Caledonia
*
Authors to whom correspondence should be addressed.
This work was part of the Ph.D. thesis of the first author Hugo Lassauce.
Fishes 2025, 10(11), 545; https://doi.org/10.3390/fishes10110545
Submission received: 24 September 2025 / Revised: 17 October 2025 / Accepted: 20 October 2025 / Published: 27 October 2025
(This article belongs to the Special Issue Sustainable Fisheries Dynamics)

Abstract

In the dynamic and increasingly threatened marine environment, understanding the full spatial ecology of species like the reef manta ray (Mobula alfredi) is crucial for effective conservation. While typically considered a shallow-water species, reef manta rays in New Caledonia were investigated to explore their vertical habitat use. This study utilized satellite telemetry data from 19 tagged individuals, with three tags providing sufficiently high-resolution information on dive behaviour, to describe and quantify three-dimensional movements. We found that New Caledonian reef manta rays exhibit outstanding deep-diving capabilities, with all individuals diving below 300 m and one reaching 672 m. These deep dives occurred regularly, averaging one every 4.8 days, which is notably more frequent than in other studied populations. Dive profile analysis revealed a mixture of foraging and exploratory behaviors, supporting the hypothesis that these deep excursions are driven by the search for demersal or mesopelagic food resources. Our findings highlight the ecological plasticity of M. alfredi and demonstrate that their habitat use extends far beyond the coastal, shallow waters previously assumed, a critical consideration for developing comprehensive and effective marine protected areas.
Key Contribution: Provide the first detailed assessment of vertical movements and associated behaviour of reef manta rays in New Caledonia, highlighting how behavior is structured across time and environmental conditions. Demonstrate the value of archival tag retrieval, which enabled full-depth datasets with high temporal resolution, allowing precise characterization of dive profiles and behavioral patterns. Contribute novel information to the ecology of a threatened species, filling key knowledge gaps that are directly relevant to conservation management and to understanding broader elasmobranch behavioral ecology. Provide a methodological framework (combining long-term tagging, depth analysis, and cyclic modeling) that can be applied to other large marine species to detect hidden ecological rhythms.

1. Introduction

The vast marine environment is structured not only horizontally by coastlines, currents, and ocean basins but also vertically by distinct zones defined by light, temperature, and pressure gradients. The movement of marine organisms across these vertical habitats is a fundamental aspect of their ecology, influencing everything from foraging and predator avoidance to energy conservation [1,2,3]. Diel Vertical Migration (DVM), the synchronized daily movement of marine life from deep to shallow waters at night to feed and back to depth during the day, is the largest animal migration on Earth [1,4,5]. This phenomenon is crucial for the functioning of deep-sea food webs and plays a significant role in the biological carbon pump, transporting vast amounts of organic carbon from surface waters to the deep ocean [3,5,6]. The use of deep habitats (mesopelagic: 200–1000 m; bathypelagic: >1000 m) is now recognized as a widespread and critical component of the life cycles of many pelagic predators, including sharks, tunas, and billfish, although the functional roles of these deep excursions are not yet fully understood [5]. Investigating these vertical movements is therefore essential for defining critical habitats, understanding ecological connectivity, and evaluating species’ susceptibility to human threats [7,8].
Reef manta rays inhabit tropical waters; populations are commonly observed near coastal reefs in the Indo-Pacific region. As filter-feeders, the spatial ecology of this species is predominantly influenced by the availability of food resources. Their horizontal movements have previously been investigated, revealing both large scale migrations (e.g., Maldives [9]; Indonesia [10], east Australia [11,12,13]), as well as high site fidelity and strong residency patterns (e.g., Hawaii [14,15], Indonesia [16], New Caledonia [17,18], Mayotte [19]) driven by environmental conditions and associated variations in resource availability.
This evidence indicates that predicting the spatial ecology of reef manta rays is challenging and that detailed, site-specific studies may be required to gain a thorough understanding of their movements. This is a crucial task due to the species’ precarious conservation status. Classified as “Vulnerable to extinction” on the IUCN Red List of Threatened Species, the species has faced significant population declines driven by growing anthropogenic pressures over the past two decades [20]. This vulnerability is amplified by the species’ conservative life history traits, which include late sexual maturity, a long lifespan, and exceptionally low fecundity, producing only one pup every few years [21]. Consequently, even low rates of human-induced mortality can have a devastating impact on local populations. Primary threats to M. alfredi include targeted fisheries and bycatch in gillnets, purse seines, and longlines, largely driven by the unregulated global demand for their gill plates [22]. Furthermore, their strong affinity for shallow coastal waters, where they are often found at cleaning stations and in feeding aggregations, exposes them to additional threats such as unregulated tourism [23,24], habitat degradation [25,26,27,28] and boat strikes [29]. A comprehensive understanding of their full three-dimensional habitat use is therefore paramount for designing effective, spatially relevant conservation strategies.
Biotelemetry has revolutionized the field of movement ecology by allowing researchers to track the behaviour of marine megafauna in three dimensions [30]. Among the most common tools are pop-up satellite archival transmitting (PSAT) tags, a methodology with distinct strengths and limitations that must be considered when designing a study to answer specific ecological questions. PSAT tags are particularly valuable for documenting the broad-scale horizontal and vertical movements of pelagic animals over long time periods without requiring physical tag retrieval. Several studies over the last decades demonstrated their effective use on terrestrial species, marine birds, sea turtles, marine mammals, and elasmobranchs [31,32,33,34,35,36,37,38,39]. In the marine environment, these tags record and archive high-resolution data on position, depth, temperature, and light levels, which are then transmitted to satellites when the tag releases from the animal and floats to the surface [40].
Insights into the vertical movements of the reef manta ray have previously been gained through the use of biotelemetry, including PSAT tags. These technologies have revealed a remarkable array of behaviours, extending the known habitat use of this species far beyond the shallow coastal reefs with which it is typically associated. Early studies provided a foundational understanding, but a clear pattern of regional variability in diving behaviour has since emerged, suggesting that the drivers of vertical movement are context-dependent. For instance, a key study in the Red Sea was among the first to extend the known depth range of M. alfredi, documenting a maximum dive depth of 432 m [41]. This research noted a pattern of reverse DVM, where individuals moved to deeper water at night, leading to the hypothesis that they were exploiting layers of mesopelagic or demersal plankton that rise from the benthos after dark—an observation echoed in subsequent research on Mobula spp. [19,42]. However, a study conducted on M. alfredi in Eastern Australia did not record these types of deep dives, indicating a significant regional difference in behaviour [11]. Similarly, a study conducted in New Caledonia recorded a maximum dive depth of 672 m, with every one of the nine tagged individuals exceeding 300 m—suggesting that deep diving may be more prevalent in this population than elsewhere [43]. The functional role of these deep dives remains unresolved, indicating a requirement for a more detailed investigation. Competing hypotheses suggest that they may be related to foraging, predator avoidance, or navigation. Some fine-scale data from the larger Mobula spp., the oceanic manta ray (Mobula birostris), reveal that extreme dives (>500 m) were characterized by rapid descents with no substantial “bottom phase” or vertical oscillations indicative of active foraging [42]. This suggests that for some manta rays, these dives may serve a navigational purpose, allowing the rays to survey the water column for environmental cues to guide their long-distance movements [44]. Conversely, other studies have observed individuals spending considerable time at their maximum depth, providing support for the foraging hypothesis [43]. This apparent contradiction in dive purpose underscores the need for high-resolution, site-specific data to fully understand the drivers of this behaviour.
The New Caledonian population of reef manta rays offers a unique opportunity to address these critical knowledge gaps. The observed frequent and profound deep-diving behaviour in these previously studied individuals is an outstanding feature that provides a powerful natural laboratory for investigating the ecological drivers and functional significance of this phenomenon [43]. Unlike in other populations where deep dives may be infrequent or exceptional events, the high frequency of this behaviour in New Caledonia provides the statistical power to analyse patterns in a way that is not possible elsewhere. The New Caledonian data not only documents a new world-record maximum depth of 672 m for the species but also reveals that all nine tagged individuals dived deeper than 300 m and did so more frequently than in any other population studied to date [43]. The high frequency of deep diving in these previous findings, which occurred more often at night, lends credence to the hypothesis that the animals are foraging on deep-sea food resources and may indicate that surface-level prey abundance is insufficient to sustain these animals.
The present study aimed to provide a more nuanced understanding of the vertical habitat use of this threatened species. First, we quantified the vertical habitat use of the sampled M. alfredi in this region by characterizing typical depth ranges, diel patterns, and the frequency and specific features of deep dives. Second, the study aimed to explore the functional significance of such deep-diving behaviour by closely analysing fine-scale dive profiles to evaluate competing behavioural hypotheses. This information is essential for designing effective conservation and management strategies that account for their entire habitat, including the mesopelagic zone, which is often outside the scope of coastal marine protected areas. A failure to protect these deep-water habitats could render traditional coastal-based conservation measures largely ineffective for the long-term survival of the species.

2. Materials and Methods

2.1. Study Sites

Satellite tagging was conducted at three established aggregation sites within New Caledonia, South Pacific: Noumea, Ouvea, and Touho. New Caledonia is composed of a Main Island encircled by a 1660 km-long barrier reef, which encloses a shallow lagoon covering approximately 16,874 km2 [45]. This barrier reef delineates the edge of the continental shelf, beyond which the seafloor depth rapidly descends to over 2000 m. Off the east coast of the Main Island lie the smaller Loyalty Islands, characterized by a relatively narrow continental shelf and separated from the Main Island by a deep channel reaching 2000 m in depth (Figure 1).
Tagging of reef manta rays was conducted at two sites along the Main Island: Noumea on the southern section of the west coast, and Touho on the northern part of the east coast. The third tagging location was on Ouvea, part of the northern Loyalty Islands. This geographical spread was intended to maximize geographical representation across New Caledonia’s diverse geomorphology and capture a broad range of individual behaviors across these varied oceanographic contexts within the archipelago. In Noumea, operations targeted two aggregation areas situated 24 km apart on the barrier reef: the Boulari Channel (22°29′ S, 166°26′ E) and the Dumbea Channel (22°21′ S, 166°15′ E). The Boulari Channel serves as a cleaning station located on a 15 m deep reef flat at the northern tip, while the Dumbea Channel is a feeding site within the upper 30 m of the water column adjacent to the reef crest at the southern tip. At Touho (exact location withheld), manta rays aggregate at a cleaning station positioned on a 15 to 20 m deep reef shelf less than 5 km from the coastline, near the northern tip of the Great Channel. On Ouvea, tags were deployed at two cleaning stations: the Northern Pleiades (20°45′ S, 166°44′ E) and the Southern Pleiades (20°43′ S, 166°23′ E), both located on the reef slope at depths of 10 to 15 m along the continental shelf off the island’s northern and southern tips, respectively (see Figure 1).

2.2. Tagging

A total of 21 SPLASH10-F-321A PSAT tags and two MiniPAT tags (Wildlife Computers Inc., Redmond, Washington, DC, USA) were deployed, each coated with PropspeedTM silicone to minimize biofouling throughout the deployment. Tagging efforts were aligned with peak manta ray sighting periods across all sites during December to February over four consecutive years from 2015 to 2020. Two tags were deployed opportunistically outside of this peak period in Touho in November 2018. In Noumea and Touho, tagging was conducted during scuba dives, whereas in Ouvea, manta rays were tagged while free diving alongside free-swimming individuals. The tags were attached via a 30 cm stainless steel tether connected to a titanium dart tip, inserted into the dorsal musculature using a modified pole spear. Each tag was programmed to remain attached for up to 180 days, with an automatic release triggered if the tag recorded a constant depth for more than 24 h, indicative of mortality. Prior to deployment, individual manta rays were identified through photo-identification, their sex and maturity stage assessed, and disc width visually estimated to the nearest 10 cm. The SPLASH10 tags (n = 21) and MiniPAT tags (n = 2) operate with comparable temperature, ambient light and depth sensor technology, both providing a depth resolution of 0.5–1 m and an accuracy of ±1% of the reading across a range up to 1700 m or more. Both tag types employ similar protocols to collect, summarize, and compress depth data into standardized formats for transmission to the ARGOS satellite system (www.argos-system.org, access on 21 June 2021) in 12 h batches. As the data were decoded and treated using the unified Wildlife Computers platform, the data derived from both tag types were standardized into consistent formats for analysis, ensuring direct comparability. Furthermore, the fine-scale Dive Profile Analysis (Section 2.3.2) was based exclusively on the complete, high-resolution archived data from the three physically recovered tags (SPLASH10 and MiniPAT), which, prior to transmission processing, guarantees maximal resolution and consistency across all three specific units used for behavioral classification.

2.3. Data Analysis

2.3.1. Data Treatment and Analysis of the Overall Dive Activity

Data transmitted through the ARGOS system were decoded using Wildlife Computers’ platform (Wildlife Computers Inc., Redmond, Washington, DC, USA) and extracted into R version 4.4.2 (R Core Team, 2024, R Foundation for Statistical Computing, Vienna, Austria). Decoding success rates were calculated as the proportion of successfully reconstructed records relative to the total transmitted dataset. Physically recovered tags were considered to have 100% data recovery. Diel differences were assessed by classifying records as “daytime” (06:00–18:00) or “nighttime” (18:00–06:00). Depth records were used to quantify overall diving behaviour. For each individual, the deepest daily dive and the maximum dive over the entire deployment were identified. Deep dives were defined as dives > 300 m. While statistical methods (e.g., Change-Point Analysis and Gaussian Mixture Models) identified a major shift in the distribution of daily maximum depths closer to 120–130 m (Figure S1), which is consistent with the initiation of regular offshore exploration, we selected the 300 m threshold. This choice is functionally and empirically driven: 300 m lies just below the minimum recorded overall maximum depth among all 19 tagged individuals (320 ± 4 m), confirming it as the shallowest boundary of the sustained, extreme deep-water habitat utilized by every manta ray in the study. This threshold, representing 10.1% of all daily maximum dives, isolates the rarest and deepest movements, which penetrate well into the mesopelagic zone, allowing us to specifically characterize this novel and extensive use of the deep-sea water column. Their frequency was calculated as both the proportion of daily deepest dives exceeding this threshold and as the mean number of days between successive deep dives. Vertical distribution was quantified as the proportion of time spent within predefined depth ranges (0–50 m, 50–100 m, 100–200 m, 200–300 m, and below 300 m). Bottom time at maximum depth was estimated as the duration spent within ~5 m of the deepest point of a dive. Temperature data were extracted from corresponding depth records, and the mean, minimum, and distribution of temperatures experienced were calculated for each individual. The relationship between sea-surface temperature (SST) and daily maximum dive depth was assessed using correlation analysis.

2.3.2. Dive Profile Analysis

Dive extraction and classification were performed on data from three manta rays, as only the tags from these individuals were successfully retrieved, providing complete datasets with full-depth records necessary for high-precision analysis. A dive was defined as a vertical movement with an amplitude of at least 10 m, and only dives deeper than 25 m were included in the analysis. Each dive was then categorized into one of five behavioural shapes (U, V, V-left skewed, V-right skewed, and W) based on three key parameters: descent speed, ascent speed, and time spent at maximum depth. These parameters allowed us to assign a shape to each dive: U-shaped dives were characterized by a longer duration at the bottom than the combined time spent descending and ascending, whereas V-shaped dives had minimal time at the bottom relative to descent and ascent. Skewed V-shaped dives were classified according to asymmetry between descent and ascent times: a left-skewed V had a descent at least 25% longer than the ascent, and a right-skewed V was the inverse. Finally, W-shaped dives were U-shaped dives in which the bottom phase was interrupted by a brief ascent at mid-depth and subsequent descent back to the bottom.

2.4. Statistical Analysis

All analyses were performed in R version 4.4.2. To compare means across different groups, analysis of variance (ANOVA) was performed using the R packages stats and car, followed by Tukey’s post hoc tests for multiple comparisons (R package multcomp). When variances were unequal, Welch’s F tests were applied instead (R package stats and car). Pairwise mean differences were assessed using Student’s t-tests from stats in R. Model assumptions for parametric tests (ANOVA, t-tests, Pearson’s correlation) were verified using Shapiro–Wilk tests for normality, Levene’s test for homogeneity of variances, and assessment of data collection methods (individual tags, discrete daily observations) for independence (R package stats and car). Proportions were compared using Z-tests from R packages stats and DescTools. Additionally, Kolmogorov–Smirnov tests were conducted to assess differences in distributions, and Pearson’s correlation coefficient was calculated to examine linear associations between variables (R package stats).

3. Results

3.1. Tagging

Out of the 23 tags deployed on reef manta rays, 19 successfully transmitted data, whereas four tags failed for unknown reasons (see Table S1). Data from 16 of these tags were accessed via the ARGOS system, achieving an average decoding success rate of 83.9 ± 13.9% (mean ± SD). Additionally, three tags were physically retrieved, enabling complete data recovery (100% decoding). Following quality control and filtering, one dataset was excluded from further analysis due to poor data accuracy. The average duration that tags remained attached was 76.7 ± 50.3 days, with deployment periods ranging from as short as 3 days up to 180 days. Notably, only the MiniPAT tag completed the full programmed 180-day deployment, while the remaining tags (95.7%) detached prematurely for unknown causes. The majority of the tagged individuals were females (57.9%), including one confirmed pregnant female, and two juveniles were also tagged (one male and one female). Throughout the tracking period, location fixes were recorded at relatively low frequencies, averaging one position every 1.5 days. This frequency varied by site, with the lowest resolution observed in Ouvea (one location approximately every 5.5 days), intermediate in Touho (one every 2.7 days), and highest in Noumea, where locations were obtained roughly every 0.9 days.

3.2. Overall Dive Activity (From Transmitted Data, n = 19)

Reef manta rays of New Caledonia revealed frequent deep dive behaviour (Figure S2, Table S2). All 19 tracked individuals recorded a dive below 300 m. Over the deployment period, individuals reached an average maximum depth of 490.6 ± 105.5 m, ranging from 320 ± 4 to 672 ± 4 m (Table S2). These deep dives occurred relatively regularly during the deployment duration, with an average of one dive below 300 m every 4.8 days (ranging from more than one a day to one every 49 days). Among all deepest dives recorded each day, the proportion of dives below 300 m reached 10.1% (n = 3012 daily maximum dives). On average, a manta ray recorded a deep dive at 109.4 ± 110 m each day.

3.2.1. Depth Distribution

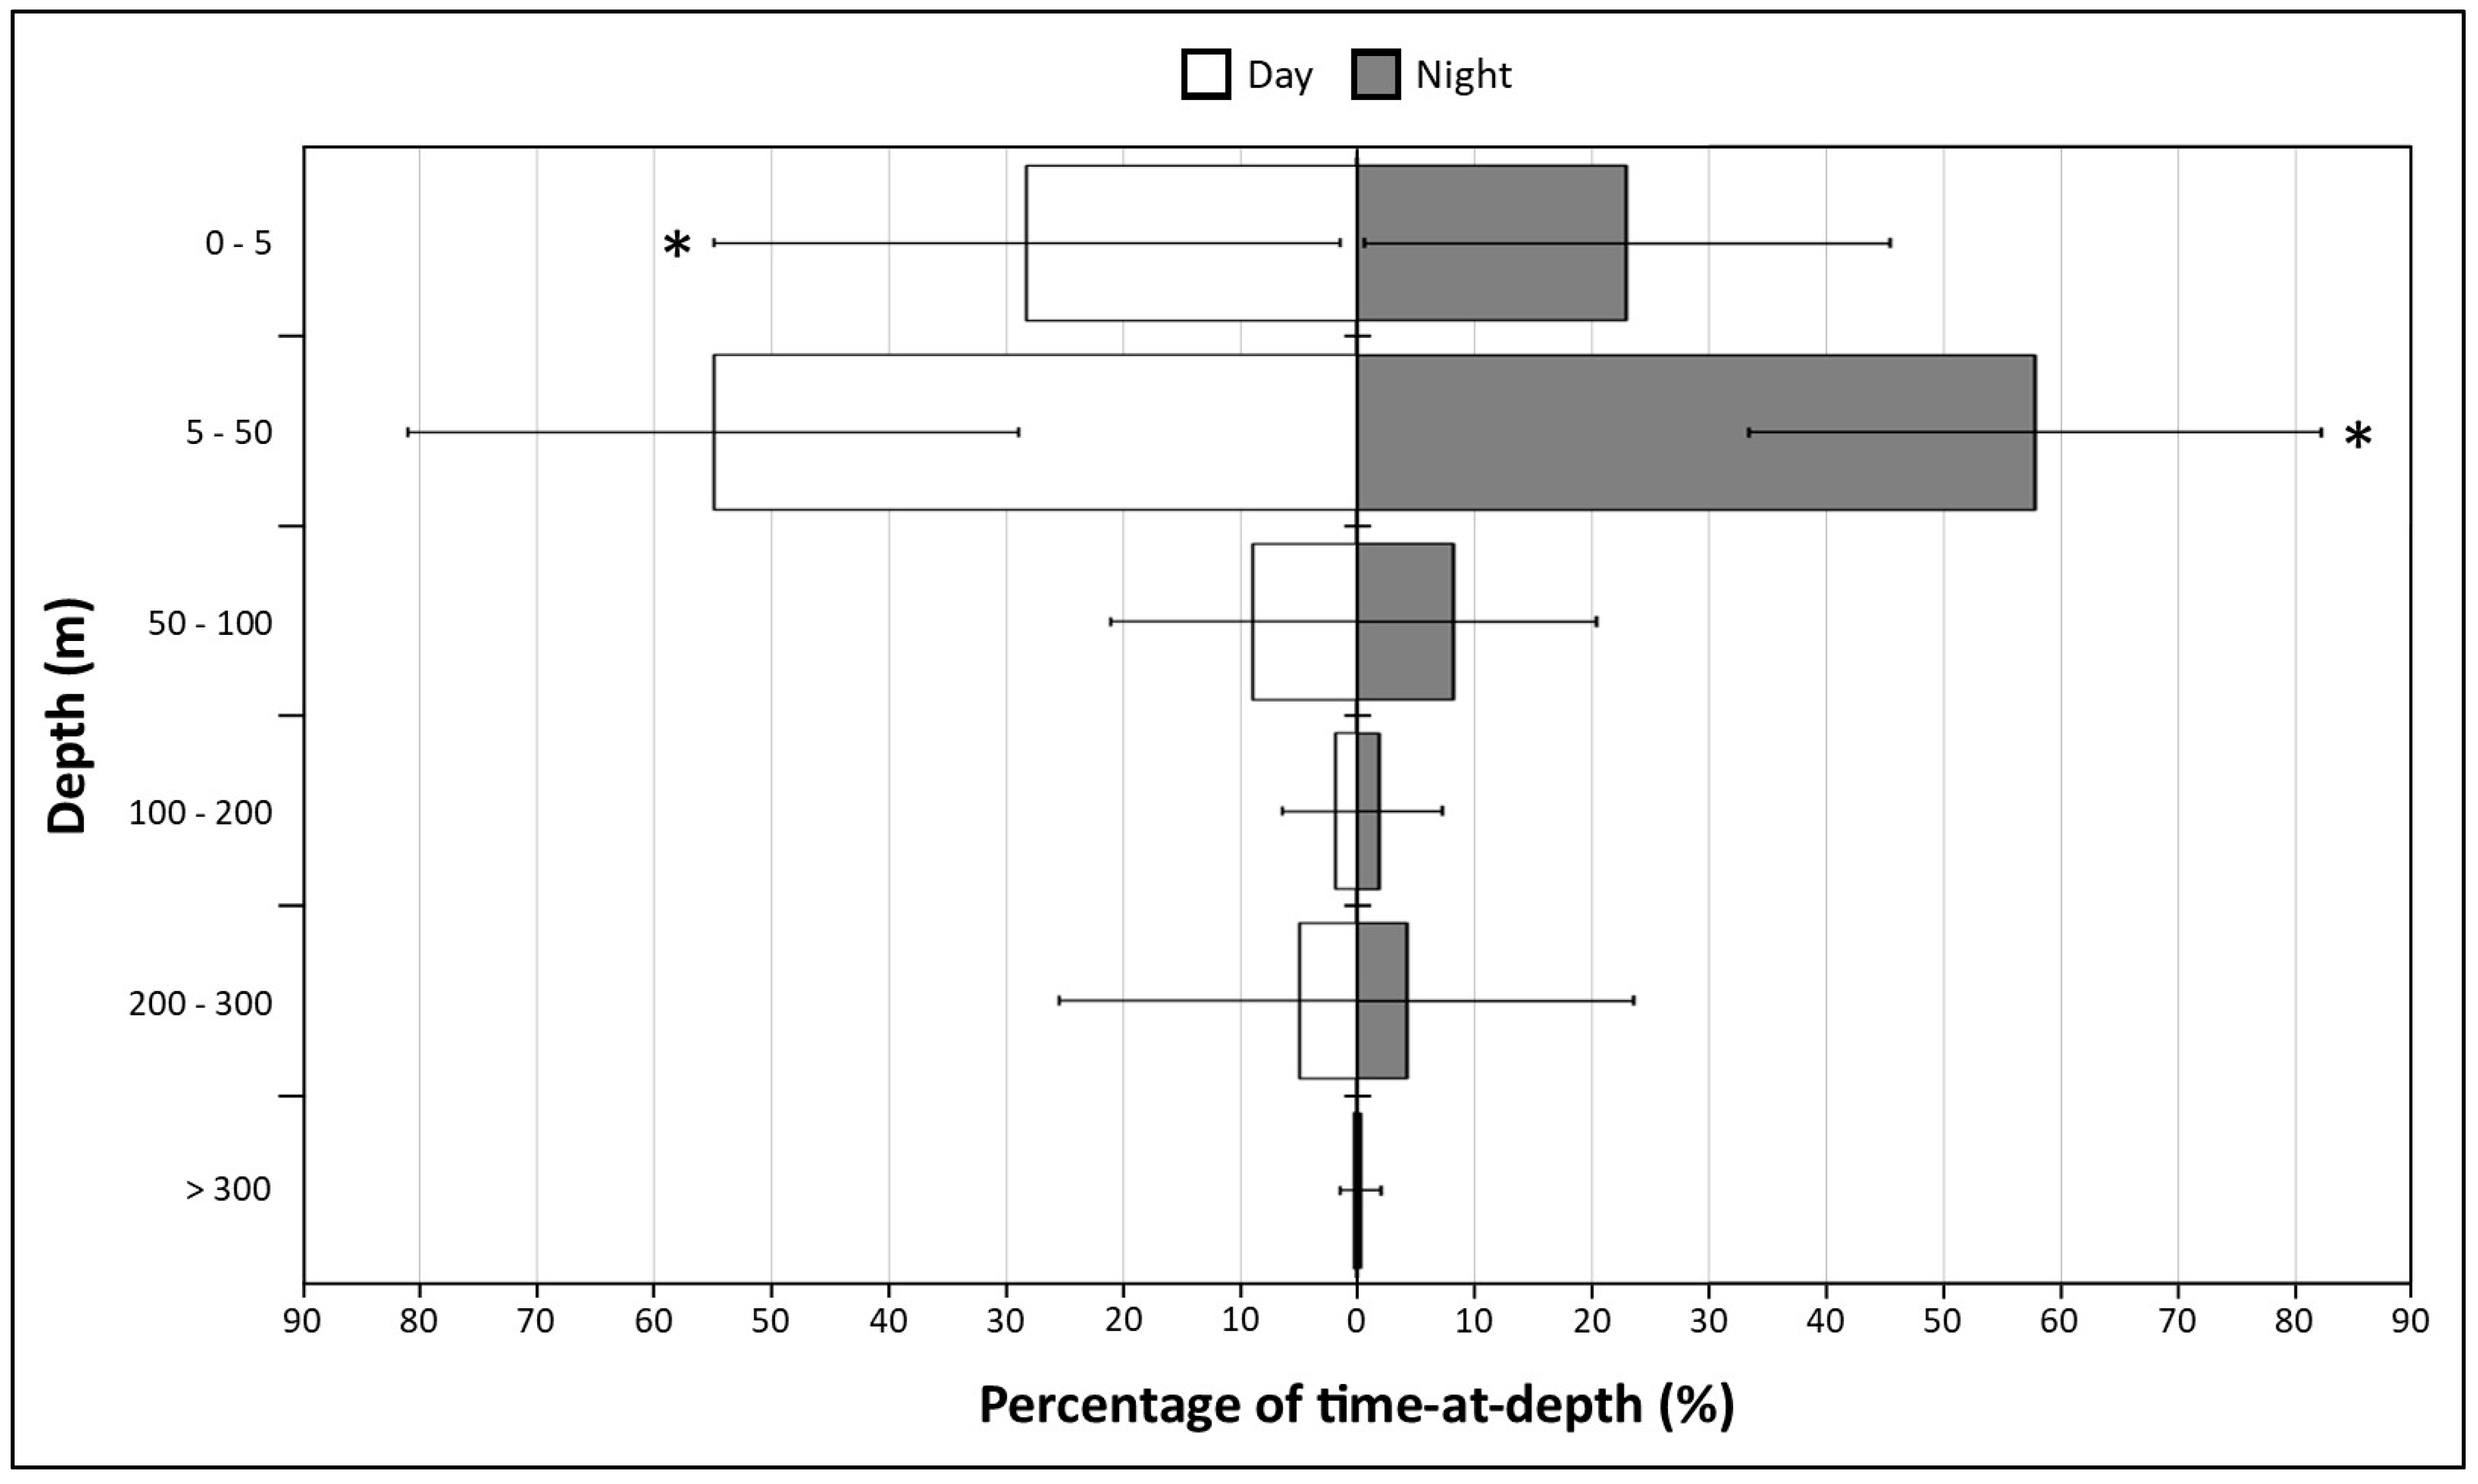
The vertical distribution shows a significantly greater use of the first 50 m of the water column, with on average 82.9 ± 24.3% of their time spent within the 0–50 m depth range (Figure 2). In contrast, only 0.3 ± 1.2% of the time was spent at depths below 300 m. Time at depth was significantly different between all depth ranges: 0 to 50 m, 50 to 100 m, 100 to 200 m, 200 to 300 m and >300 m (F(4, 14,688) = 3816, p = 0). At maximum depth for each individual, the bottom time varied from 2.2 min at 672 and 416 m to 26.6 min at 376 m with an average of 9.1 ± 5.9 min. There was no significant negative correlation between maximum depth and time spent at depth (r(21) = −0.27, p > 0.05).

3.2.2. Temperature

Manta rays were found in water temperatures averaging 25.7 ± 2.1 °C with a minimum of 7.6 °C recorded at 672 m deep. Individuals spent most of their time (55.9%) at temperatures between 27 and 29 °C. The maximum depth reached per day was not correlated with the sea-surface temperature (r(2150) = 0.24, p > 0.05).

3.2.3. Sex Comparison

Maximum depths reached during the whole deployment were no different between sexes (t(17) = 0.99, p > 0.05). However, when looking at daily maximum depths, males tended to dive significantly deeper than females (t(2794) = 15.1, p < 0.001), with on average 140.4 ± 126.3 m against 81.4 ± 83.5 m below the surface, respectively. The proportion of dives below 300 m was significantly higher for males than females, with 12.8% and 3.7%, respectively (z = 8.3, p < 0.001).

3.2.4. Diel Comparison

Comparison of maximum depths showed no significant difference between day and night hours (t(3010) = 0.3, p > 0.05). Similarly, no significant difference was observed between proportion of dives below 300 m (z = 0.5, p > 0.05). Regarding occupation of the different depth ranges (Figure 2), reef manta rays spent significantly more time within the first five meters during day hours (t(2281) = 4.9, p < 0.001), and inversely, occupied depths between five and 50 m, during slightly longer periods at nighttime (t(2447) = 3.4, p < 0.001). No significant diel differences were found when comparing time spent at other depth ranges. The distributions of occupation among different depth ranges were not different between day and night hours (K-S: D(6) = 0.17, p > 0.05).

3.3. Dive Profile Analysis (From Archived Data, n = 3 Recovered Tags)

3.3.1. Overall Dive Profiles

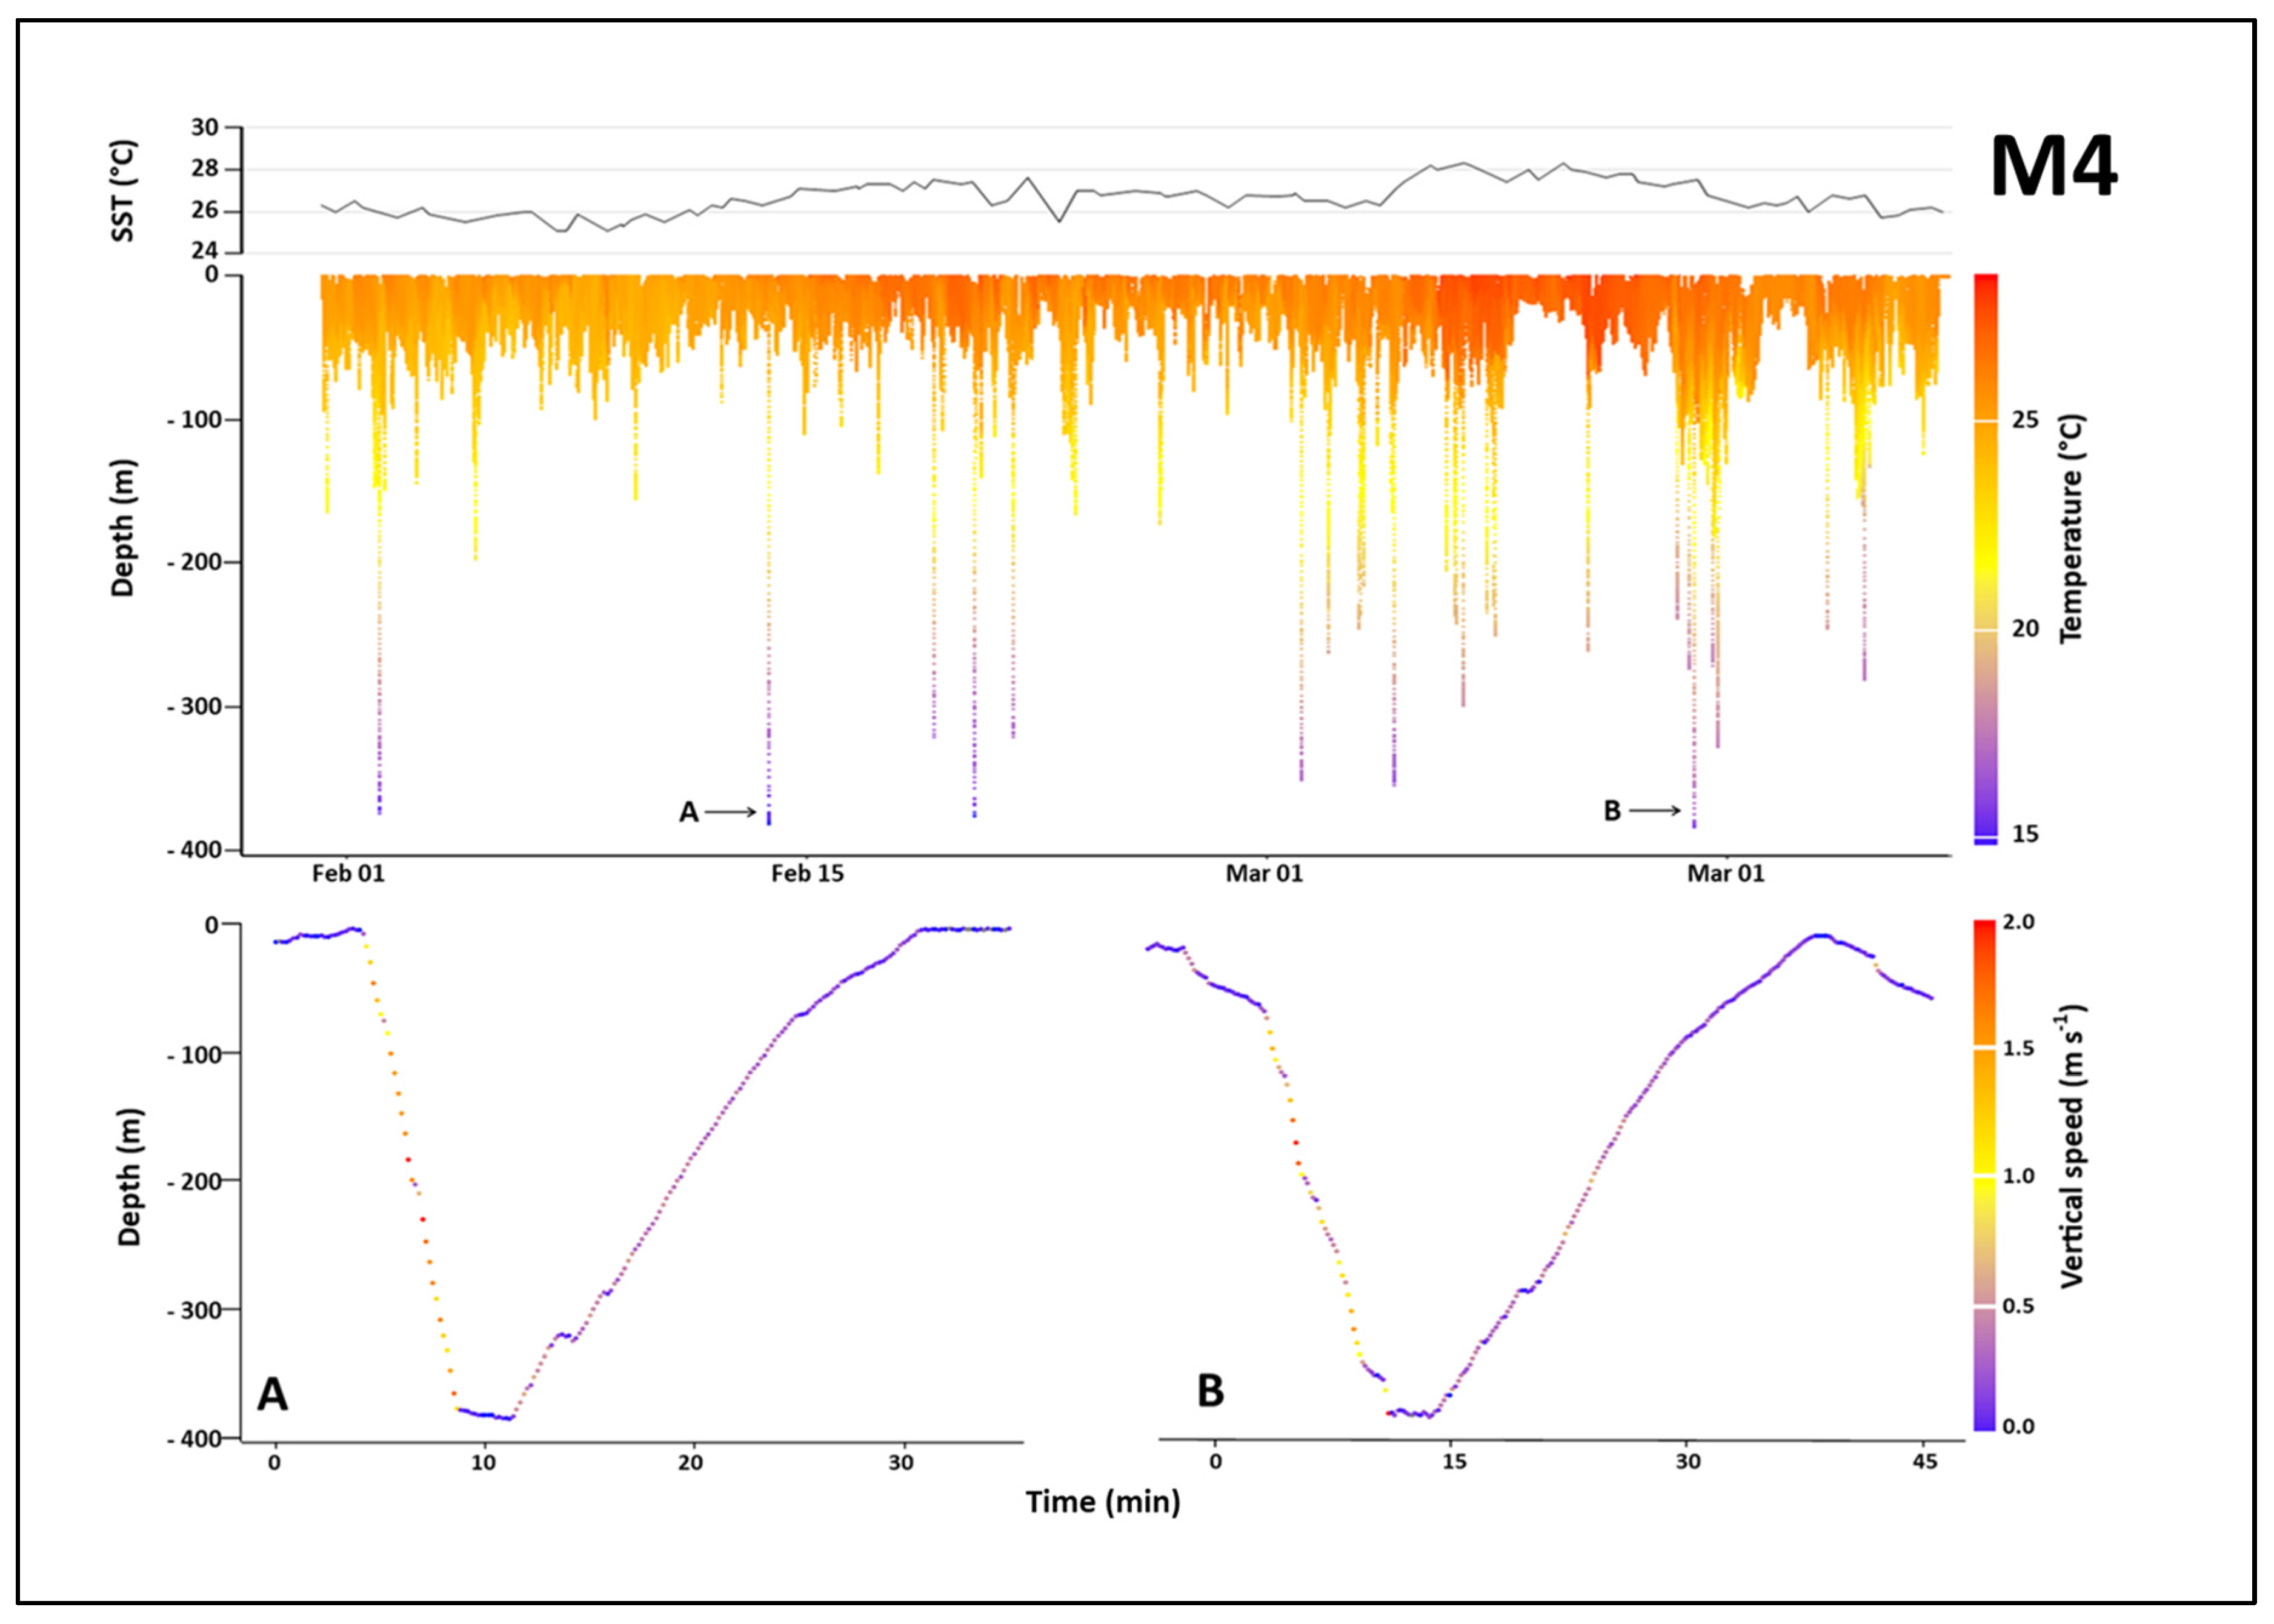
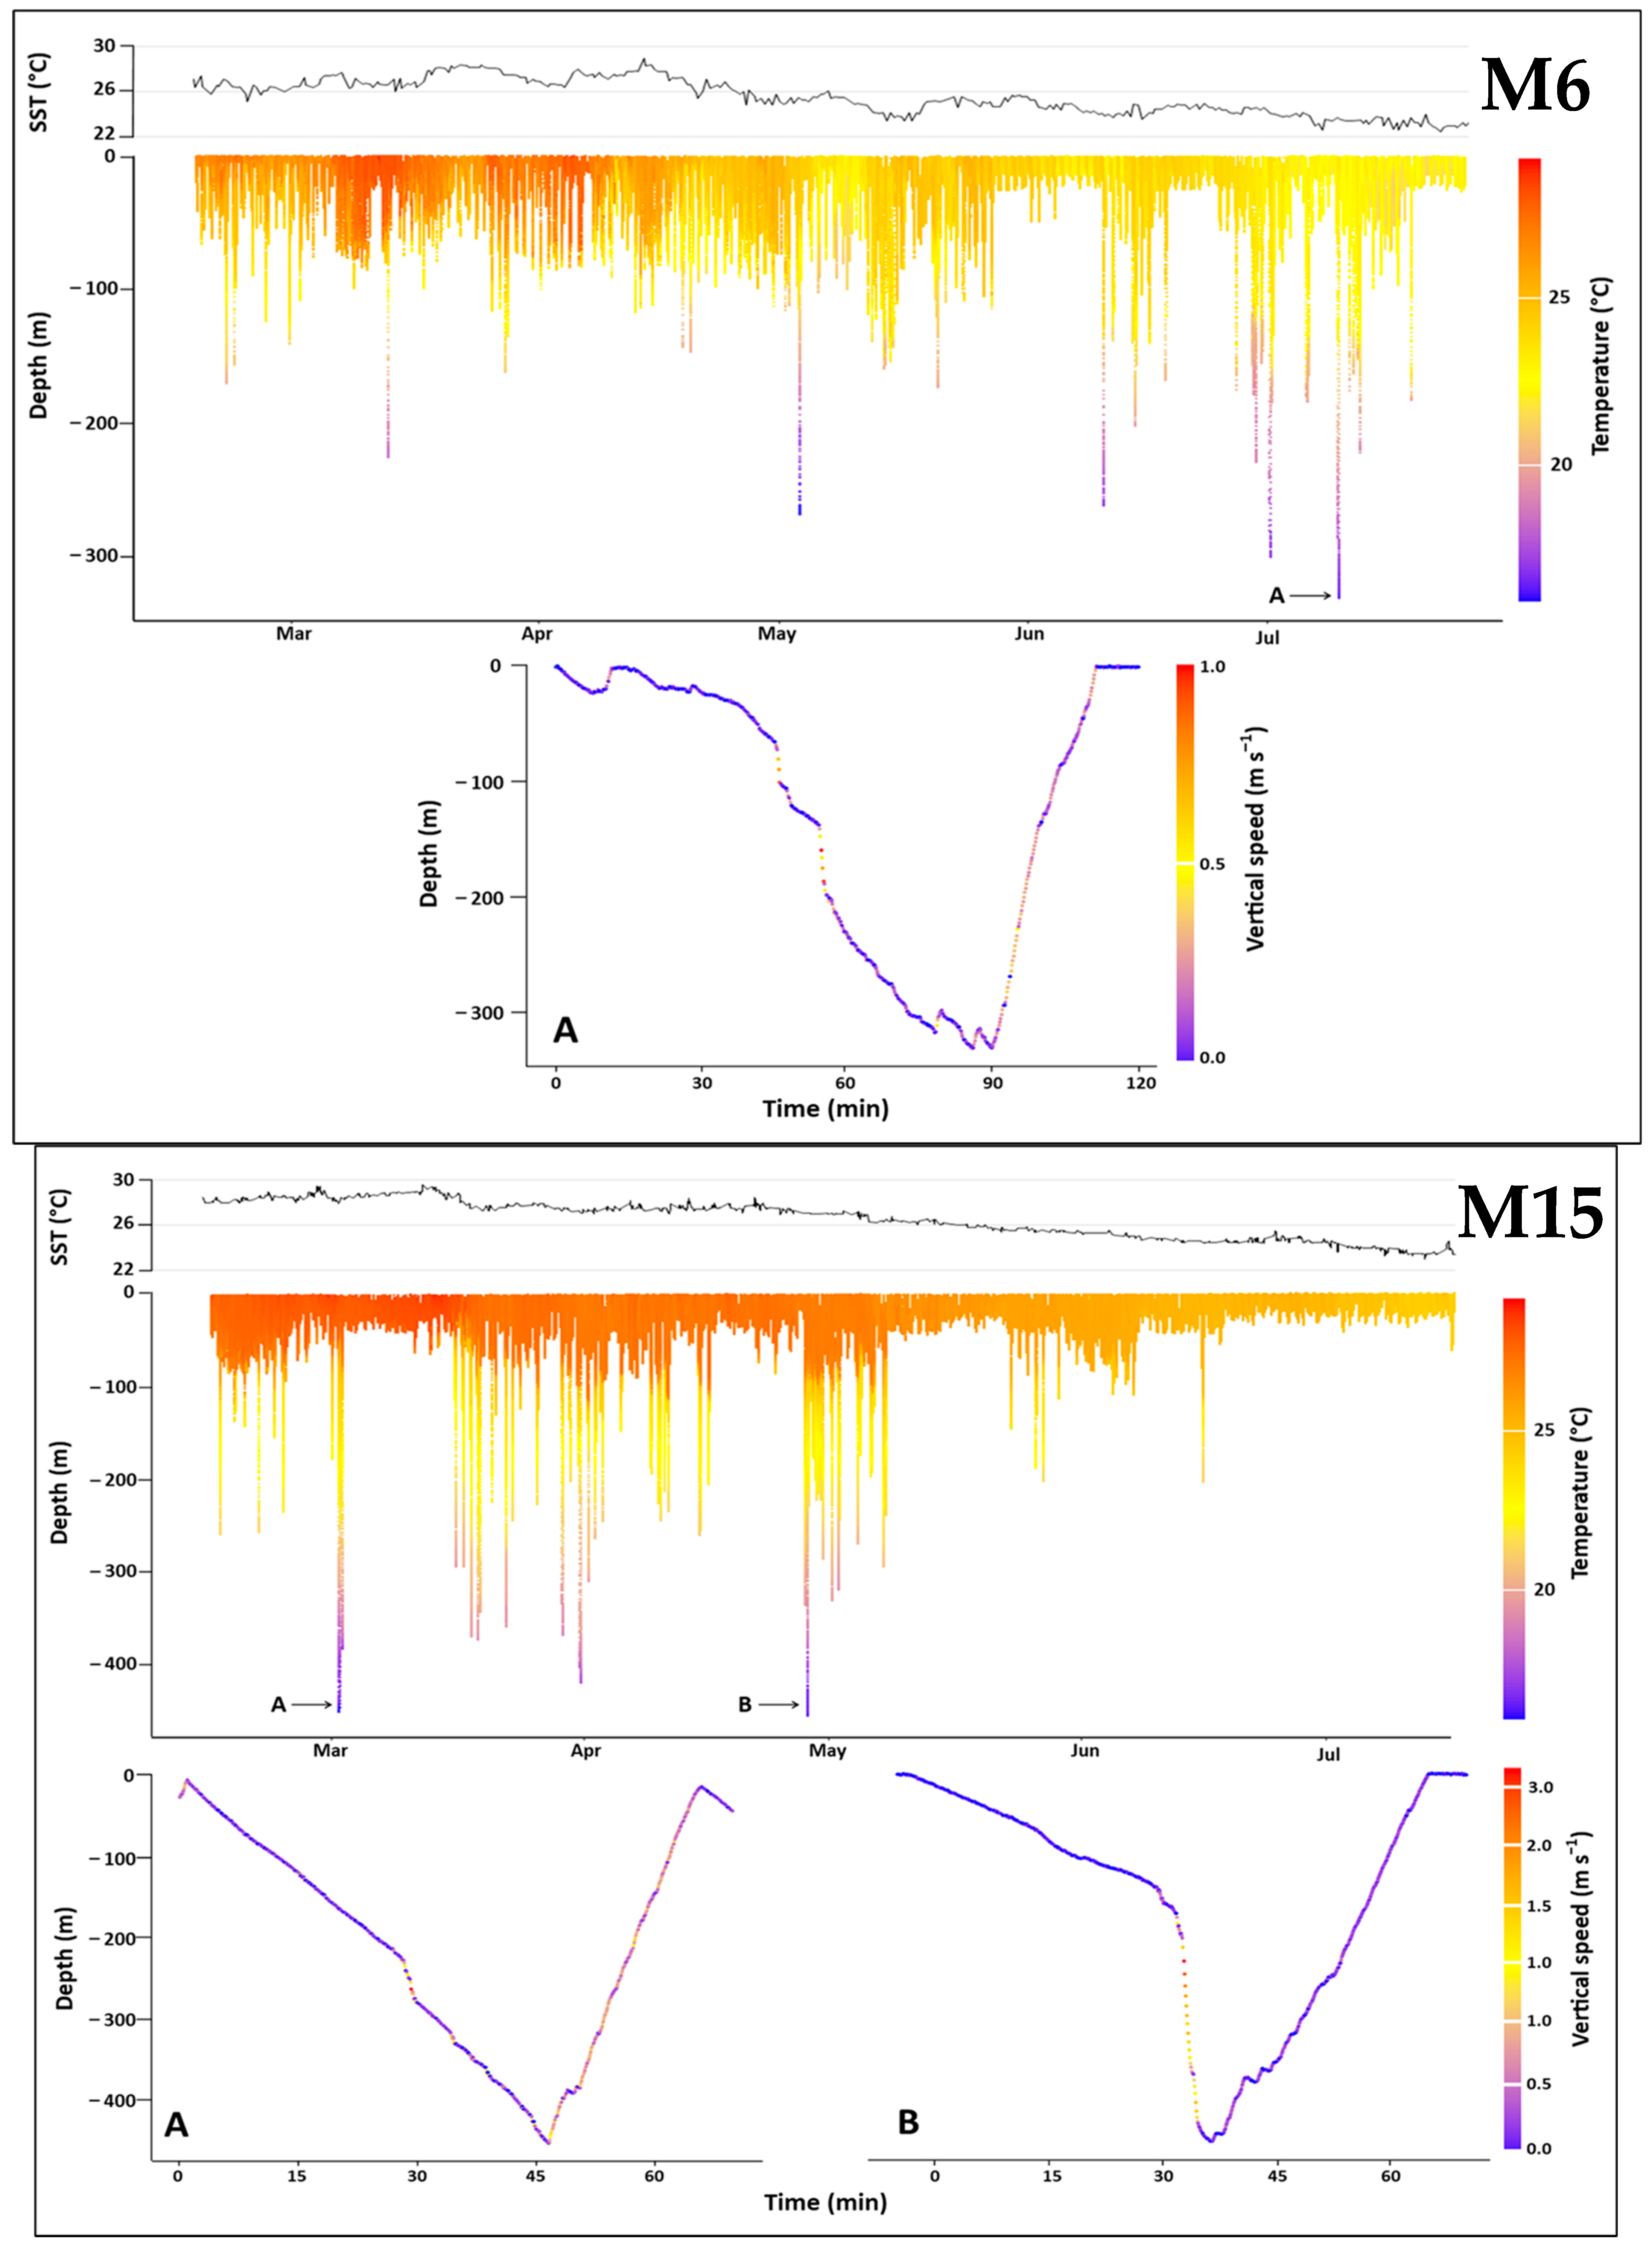
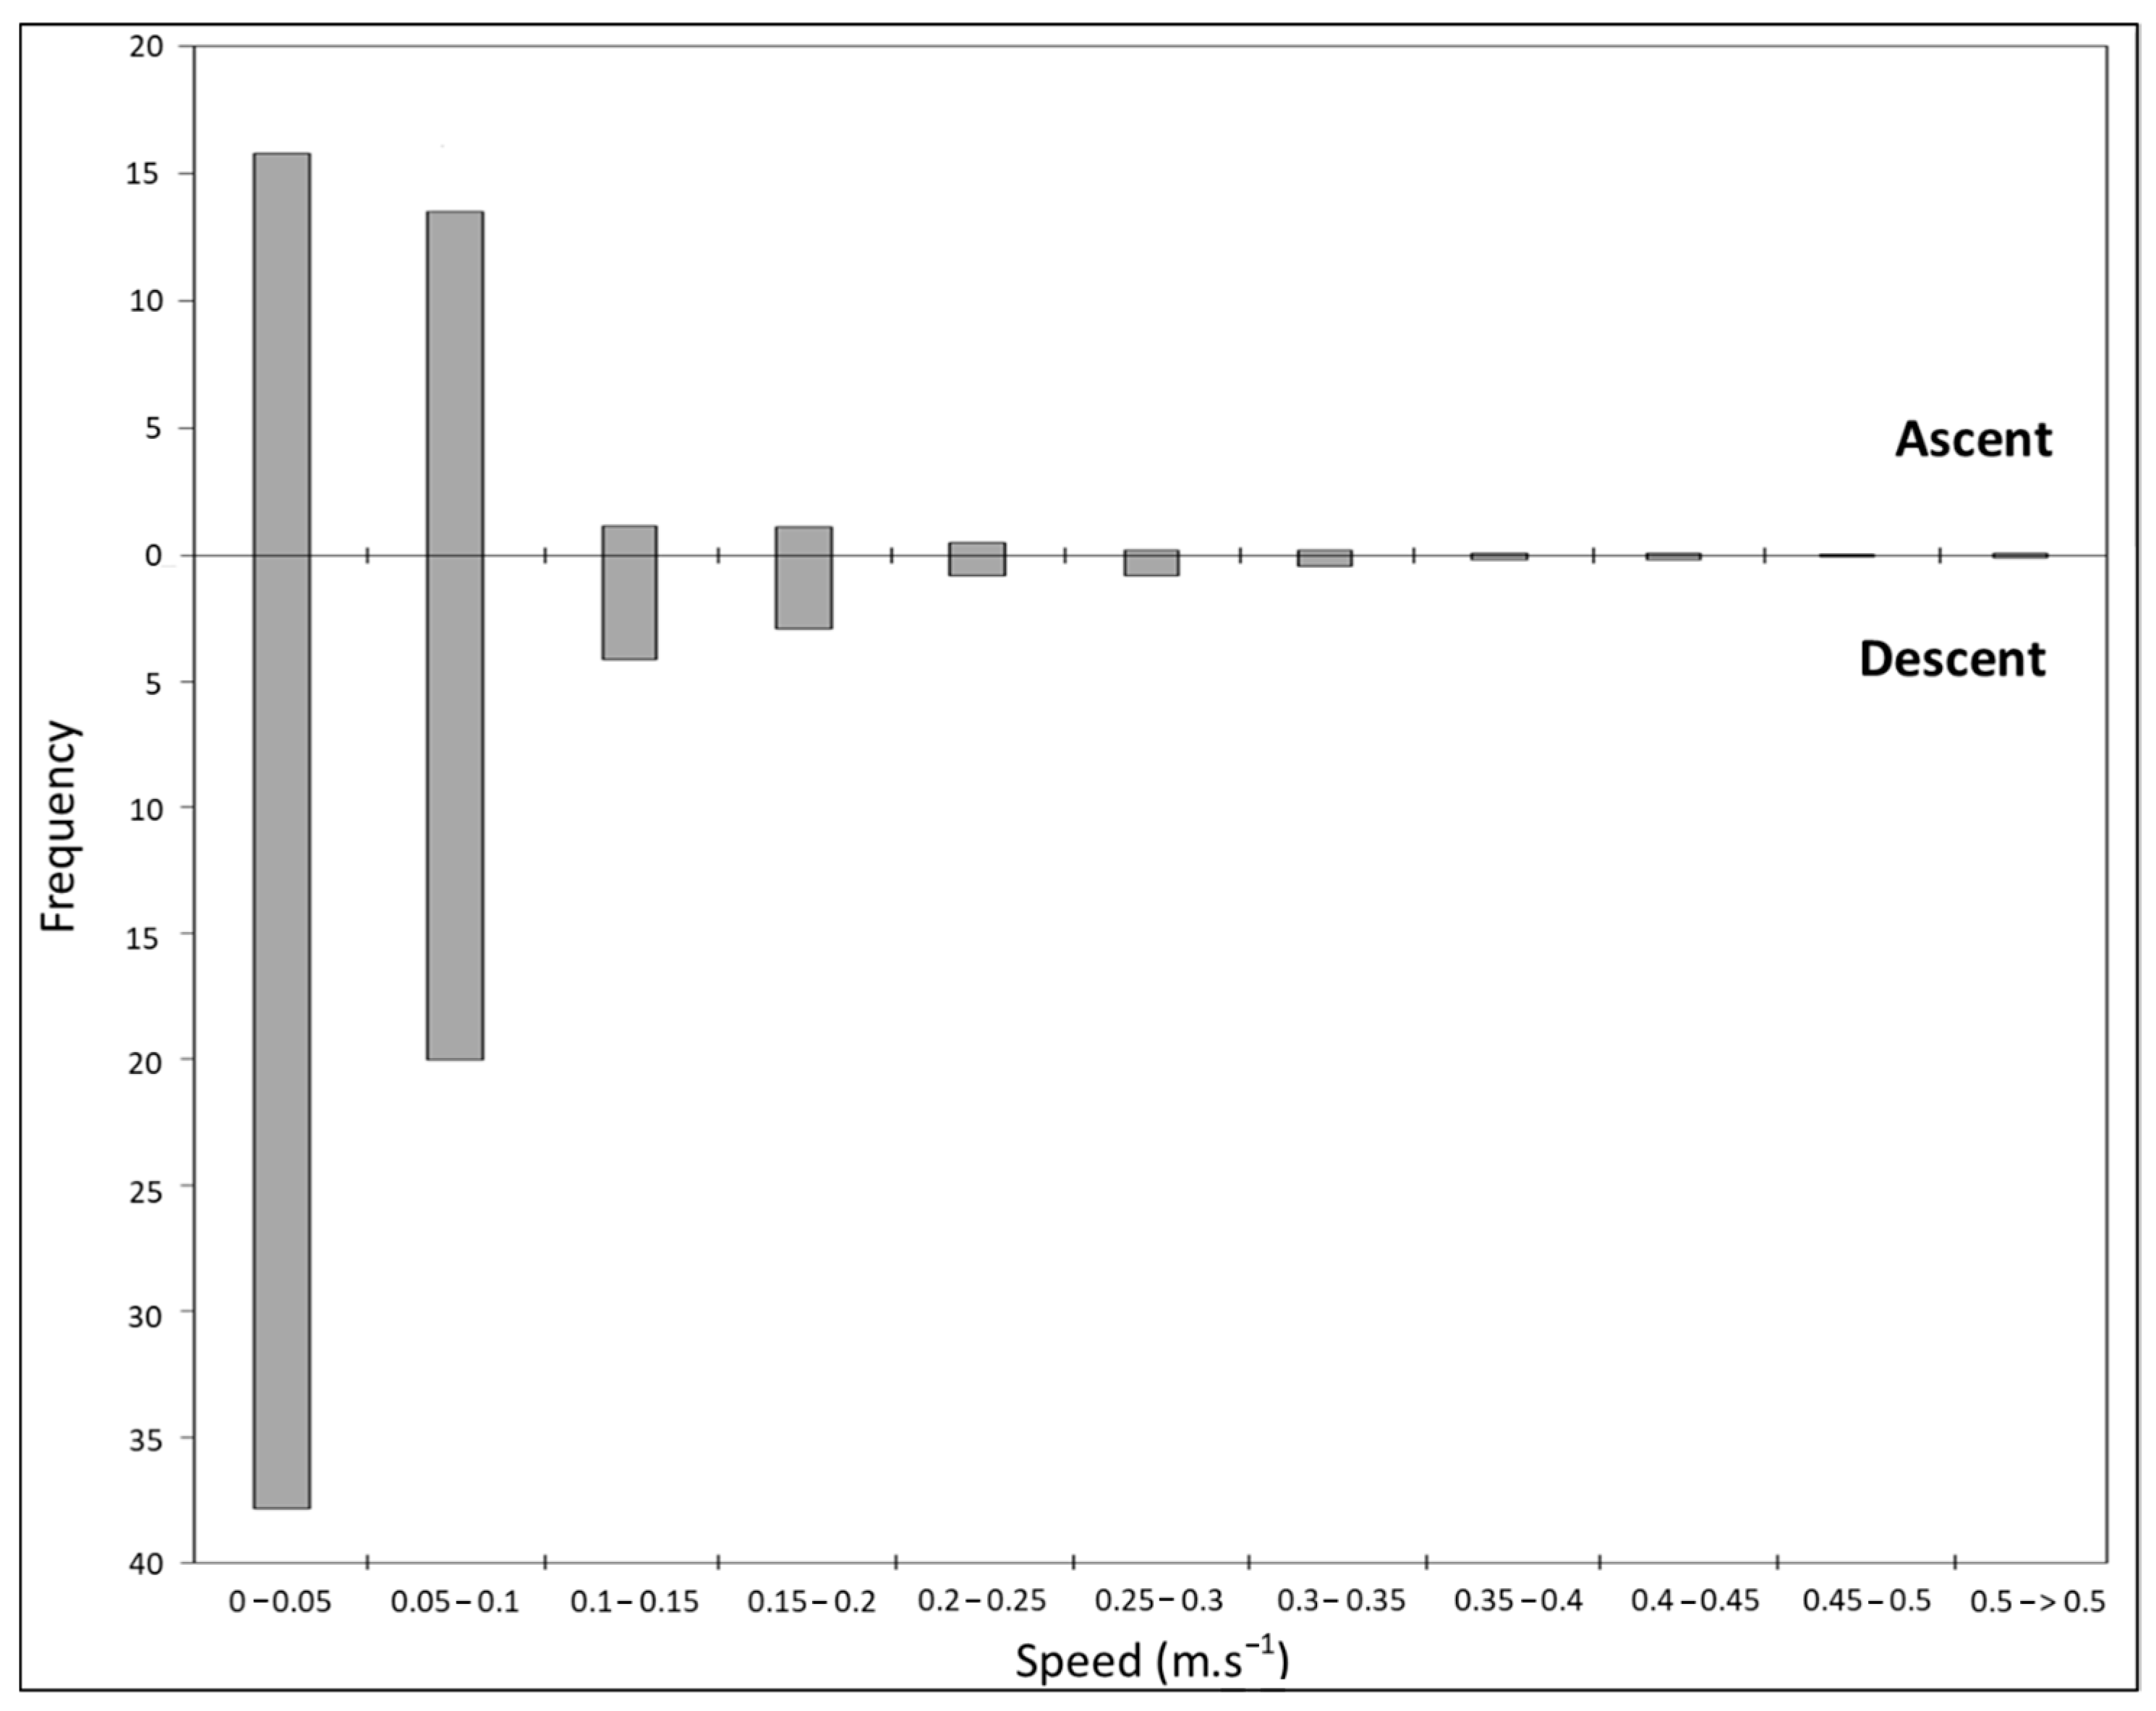
Three recovered tags (M4, M6 and M15) allowed the analysis of the diving behaviour in more detail (Figure 3, Table S3). Overall, vertical movements were slow with descent and ascent peaking at 1.79 and 2.9 ms−1 and averaging 0.08 ± 0.08 and 0.14 ± 0.15 m·s−1, respectively. Descents were significantly slower than ascents (t(5,682,692) = 128.96, p < 0.001) (Figure 4). Although vertical movements were slow, the average daily distance varied widely from 5313 ± 1275 to 8768 ± 3483 m for M6 and M15, respectively. All three manta rays travelled significantly different distances up and down the water column (F(2127.5) = 90.4, p < 0.001). The analysis of daily maximum depths revealed that the tagged individuals reached depths ranging from 18.5 to 457.5 m, with a mean maximum depth of 112.9 ± 95.3 m. The temperature recorded at these maximum depths varied from 11.8 °C to 28.6 °C, with an average of 23.6 ± 2.9 °C. For dives exceeding 300 m, the average temperature at daily maximum depth was 17.1 ± 2.8 °C.

3.3.2. Dive Shape Dynamics

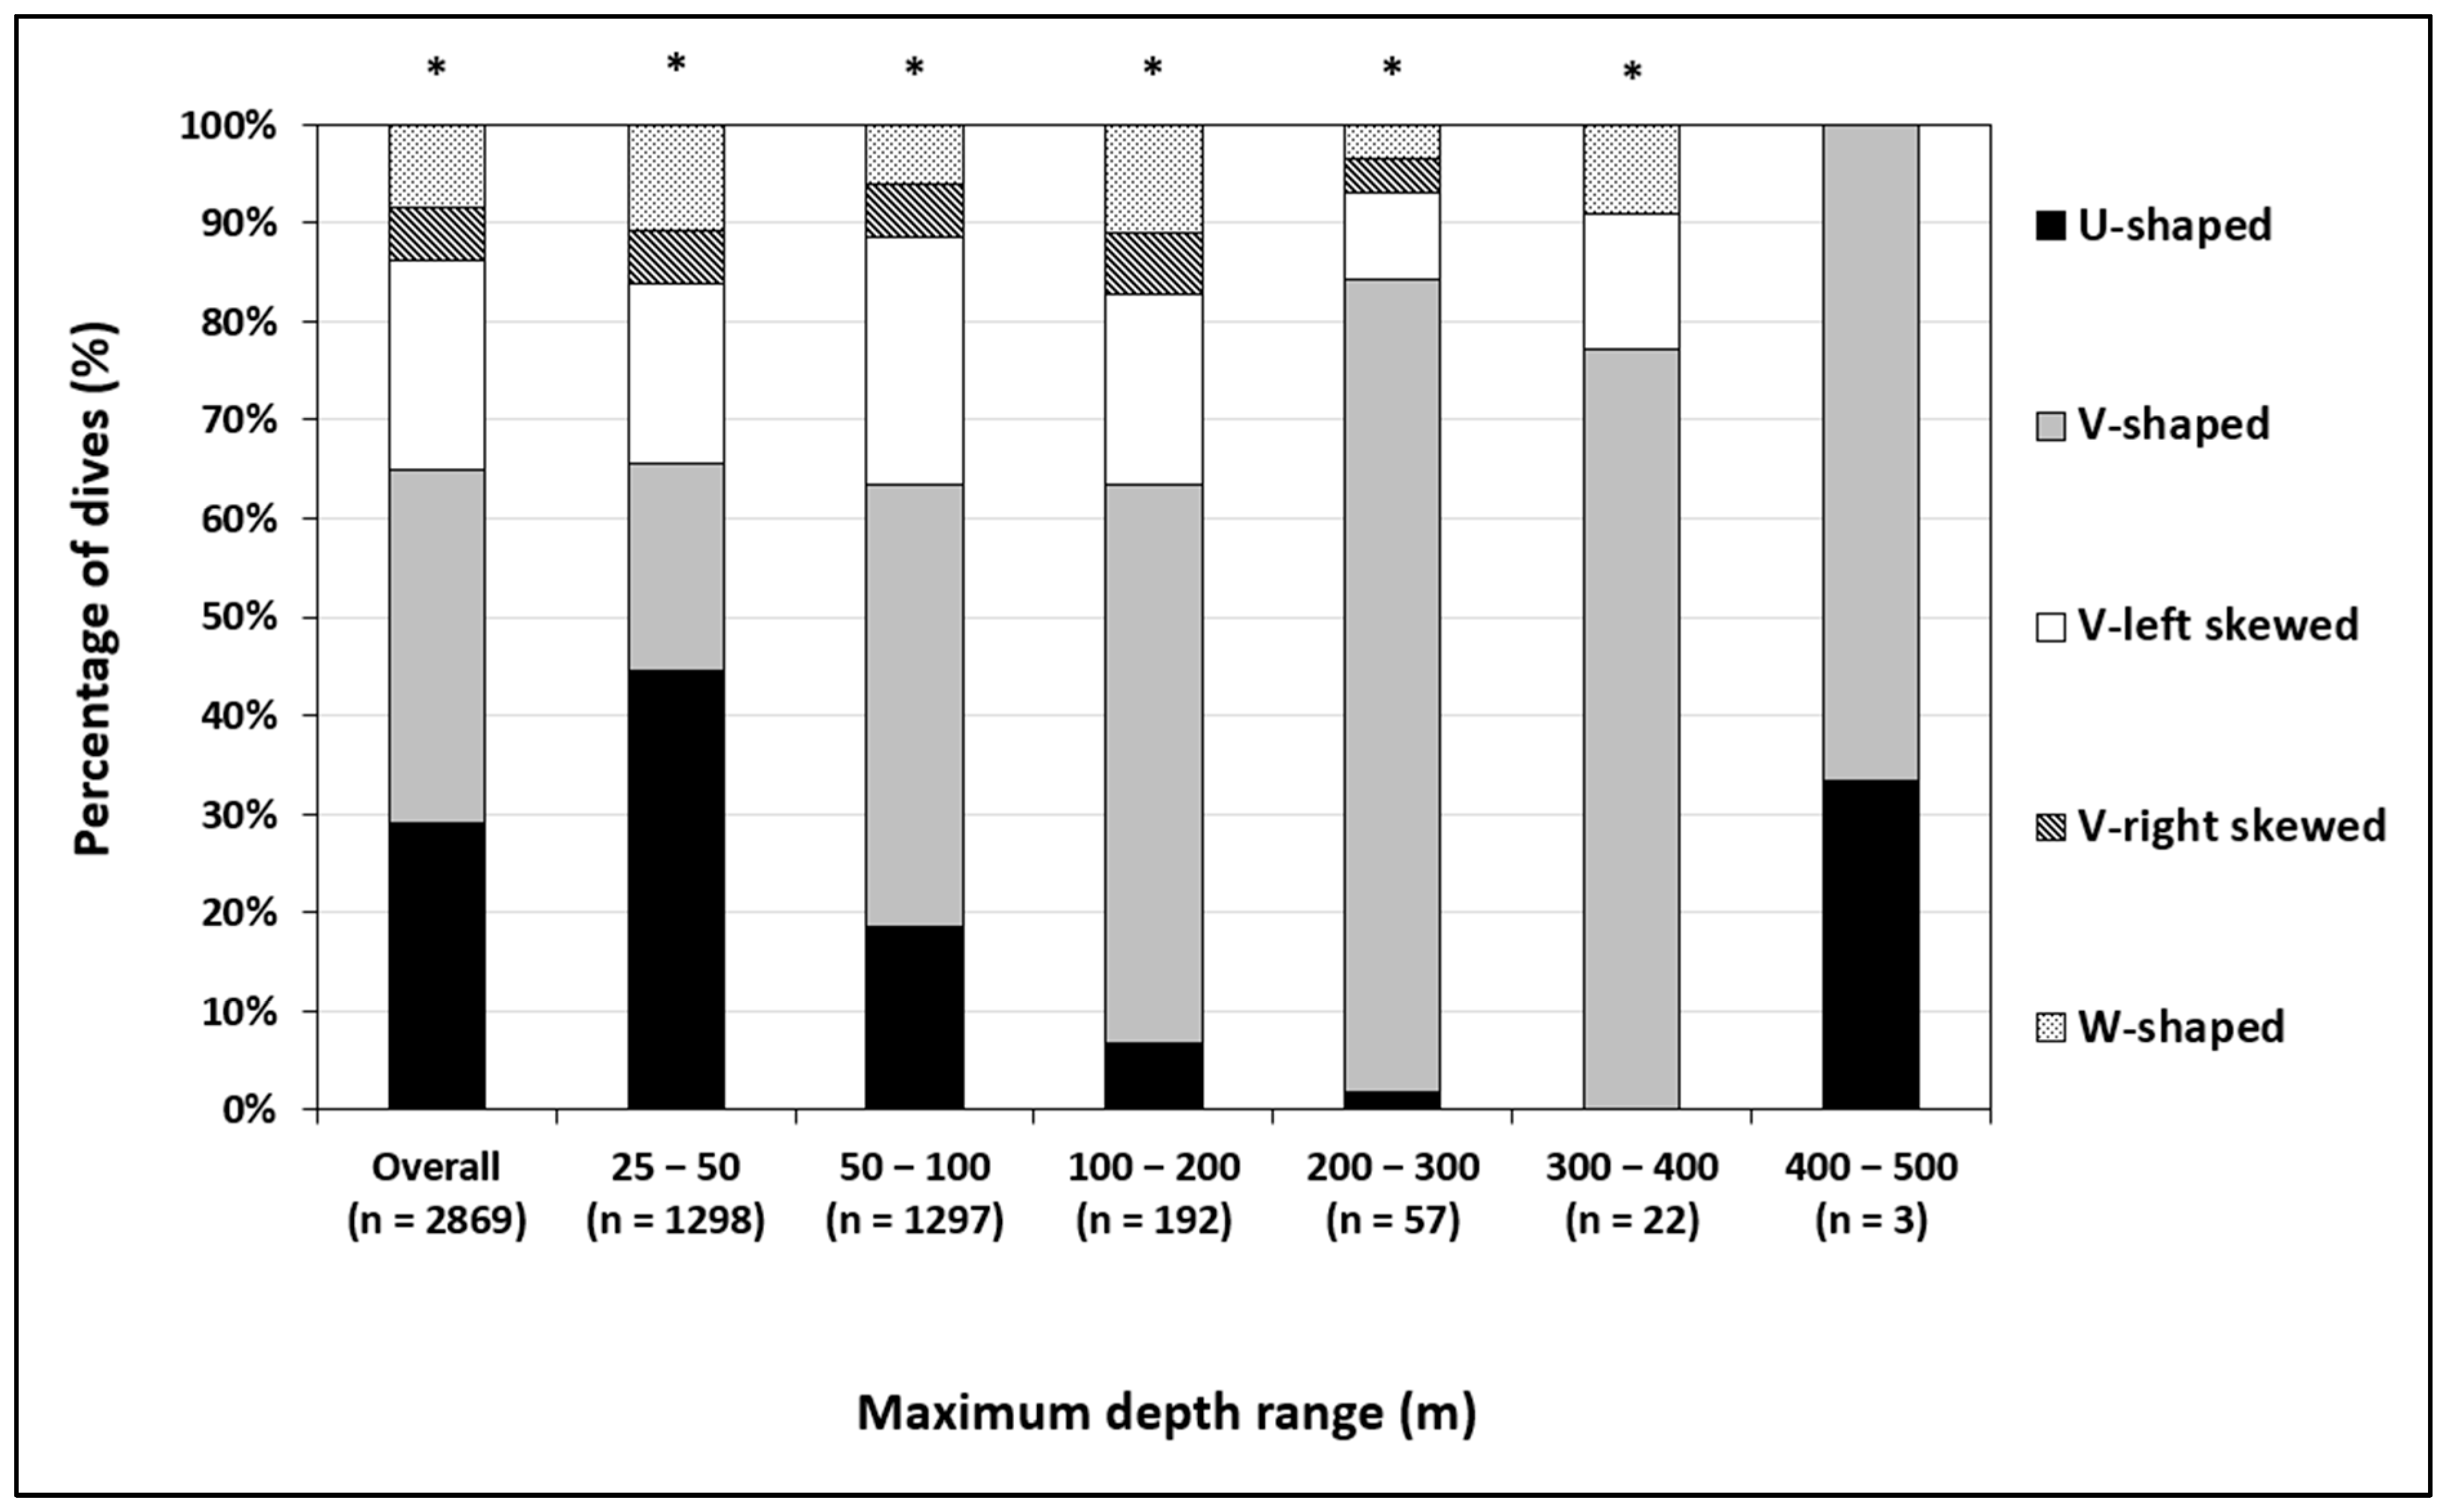
We extracted and categorized each dive (n = 2869 extracted dives) of three individuals into behavioural shapes and quantified their occurrence across depth ranges to explore patterns of vertical behaviour. Dive-shape distributions varied with depth (Figure 5). Overall, V-shaped dives were significantly the most observed behaviour (36%, n = 1032), followed by U-shaped (29%, n = 832) and V-left skewed dives (21.3%, n = 610), while W-shaped dives (9%, n = 243) and V-right skewed (5%, n = 152) were relatively rare (χ2 = 985.1, df = 4, p < 0.001). Residual analysis revealed that in shallow waters (25–50 m), U-shaped dives (45%, n = 577) were significantly the most observed behaviour, and W-shaped dives (10.7%, n = 139) occurred more frequently than expected, while V-shaped dives were slightly underrepresented (χ2 = 200.1, df = 4, p < 0.001). At intermediate depths (50–400 m), V-shaped dives were consistently the most observed behavioural shape. V-left skewed dives were the second most observed shape at these depths, whereas V-right skewed dives remained rare across all depths, contributing little to the overall pattern. At the deepest range (400–500 m), counts were low, and no shapes deviated strongly from expectation (Table S4).
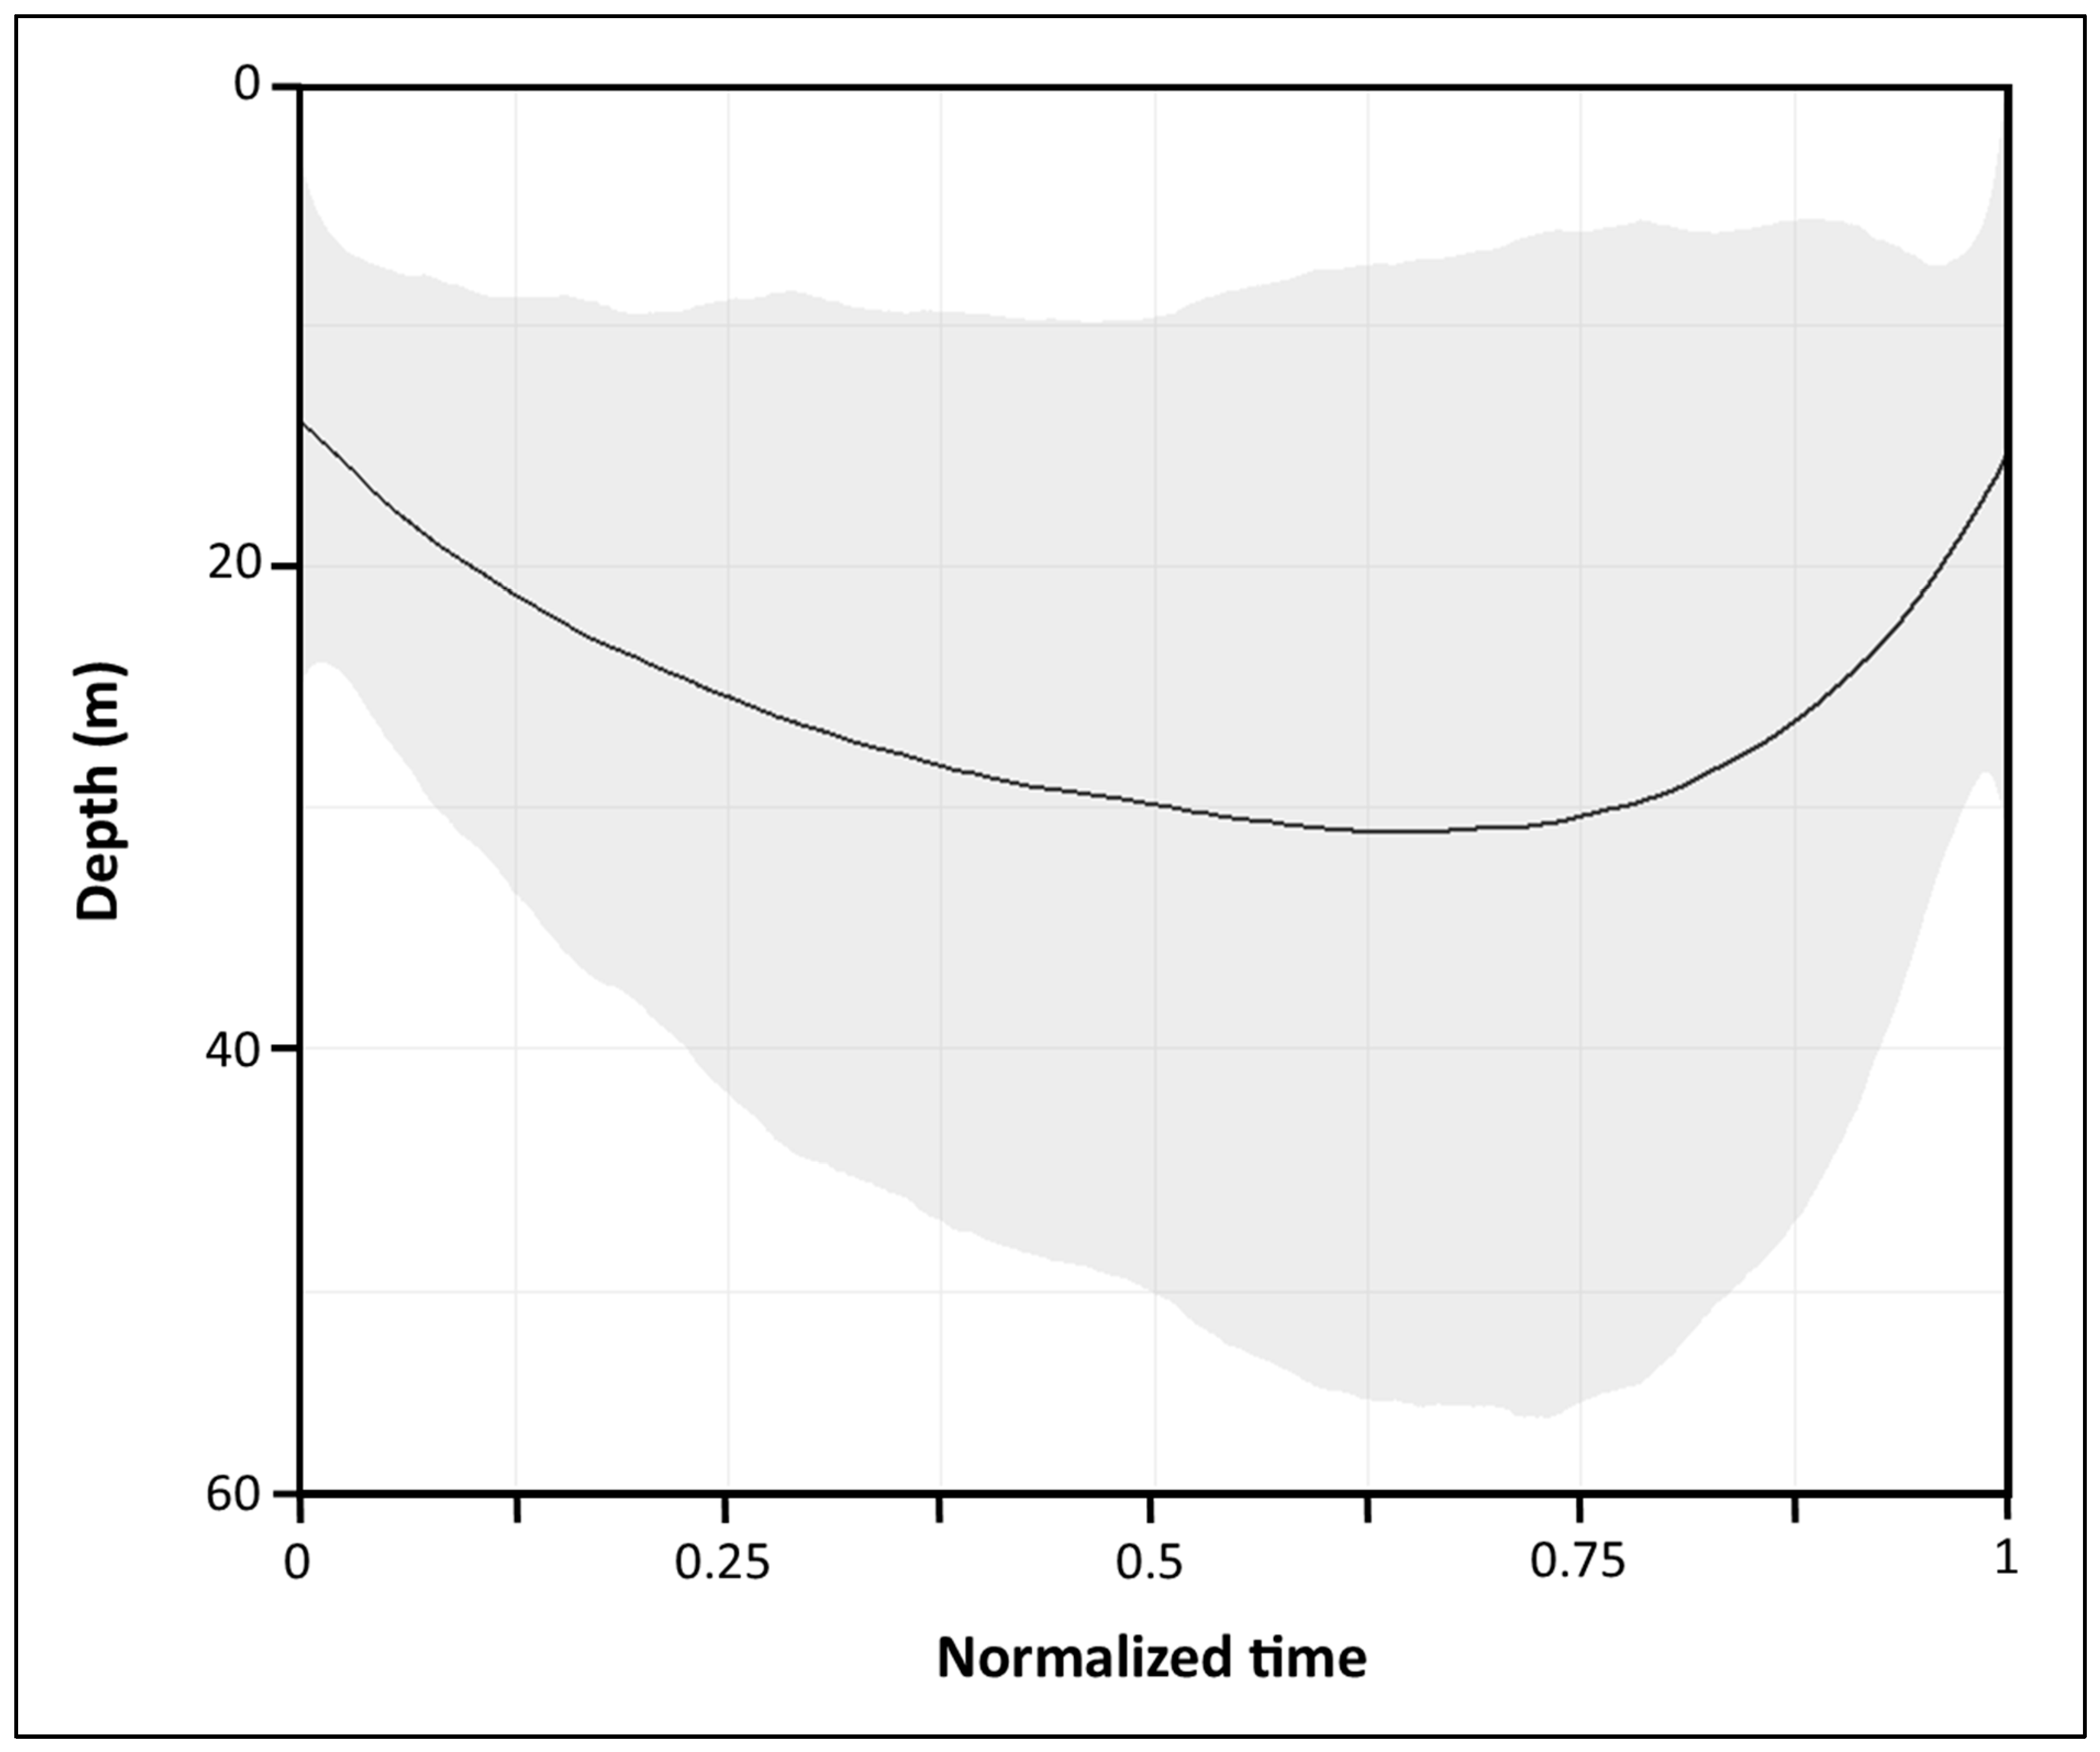
The mean dive profile of all dives combined, expressed over normalized time, remained shallow in average at approximately 30–35 m, and showed a characteristic U-shaped pattern (Figure 6). Yet, variation among dives was considerable, with deeper dives tending to follow a more V-shaped profile, while shallower dives were more distinctly U-shaped. In addition, as depth increased, dives tended to be slightly skewed to the right, indicating a slower descent phase followed by more rapid ascents.

3.3.3. Deepest Dives

The analysis of the deepest dives performed by the three individuals revealed similar V-shaped dive profiles (Figure 3, Table S5). M4 reached maximum dive depths of 383 m and 385 m within a 28-day interval, with both exhibiting V-shaped profiles slightly skewed to the left, with a faster descent and slower ascent. In contrast, M6 reached a maximum depth of 332 m, performing a slower descent to maximum depth followed by a faster ascent. M15 exhibited a V-shaped dive profile for both of its deepest dives at 453 m and 458 m. For these dives, one was slightly right-skewed, and the other exhibited an initial slow descent to 200 m followed by a steeper descent to the maximum depth (458 m) before ascending back to the surface.

3.3.4. Diel Comparison

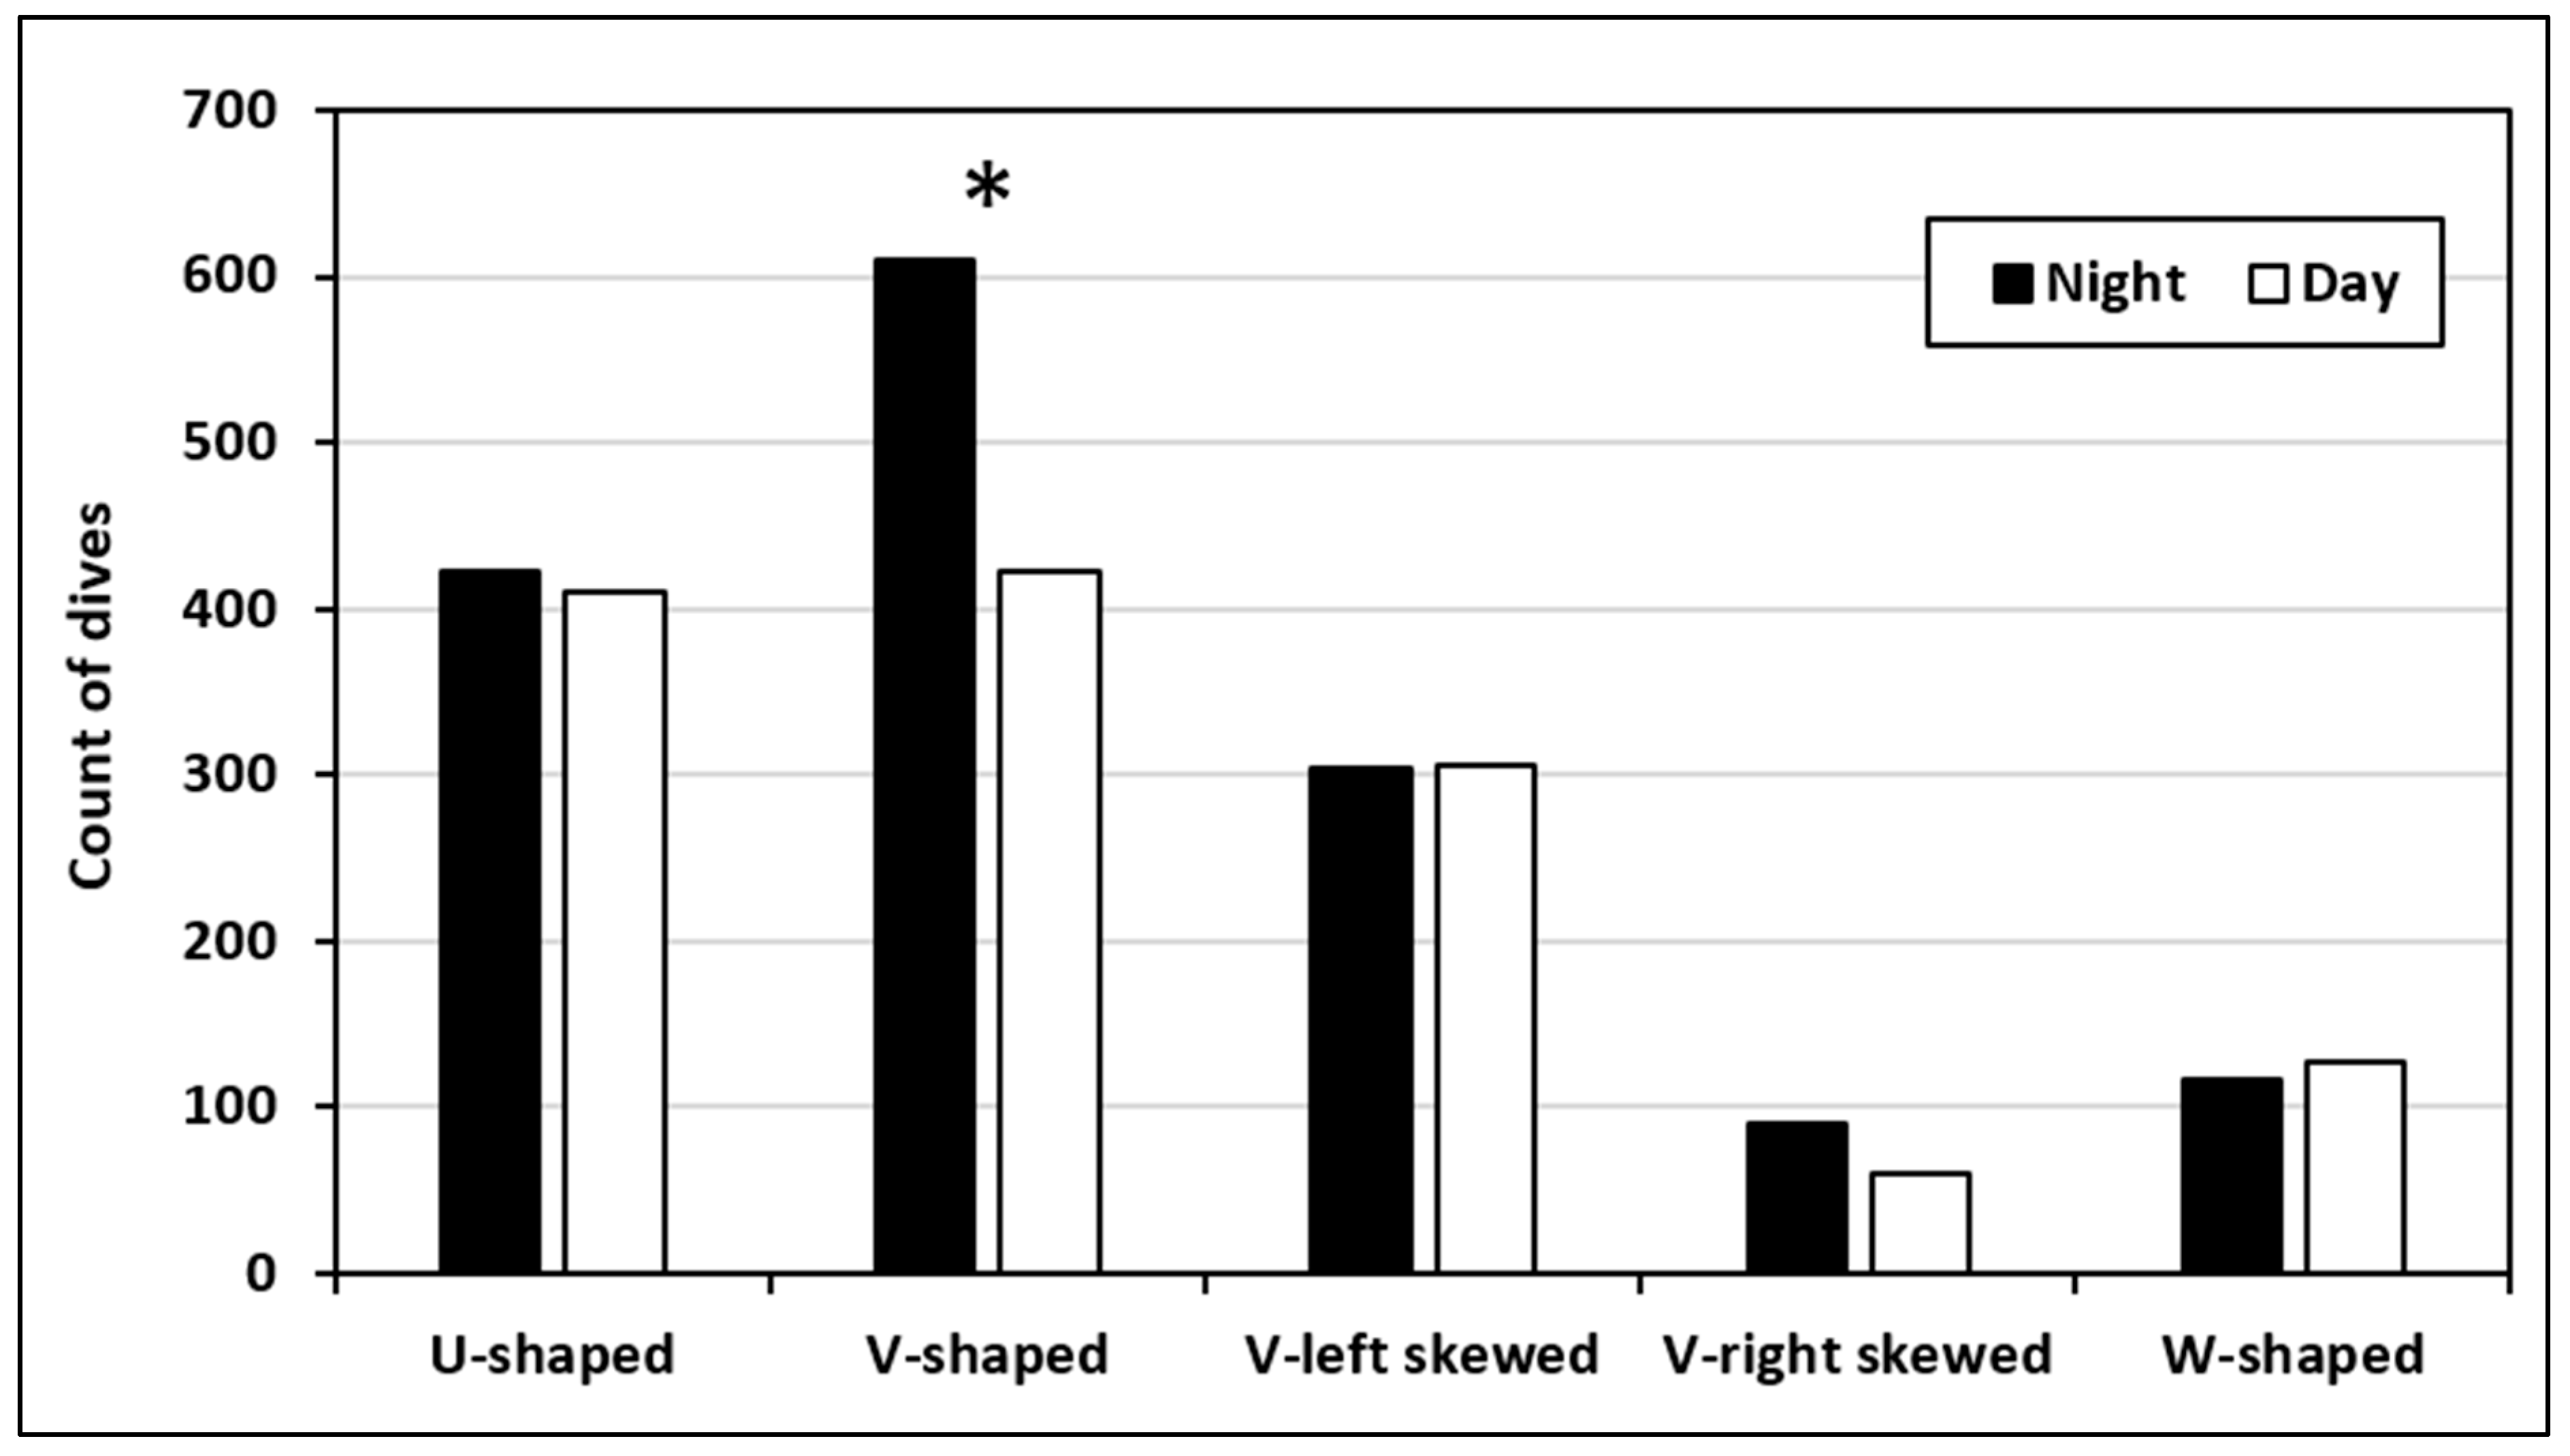
Diel variations in vertical distances were also compared using the data collected from the three retrieved tags. Individually, all three individuals showed different trends in the diel partitioning of their vertical movements. M15 recorded greater vertical movements during day hours (t(235.8) = 7.0, p < 0.001), M4 exhibited greater vertical movements during night hours (t(80.4) = 3.7, p < 0.001) and M6 demonstrated no significant differences in vertical movements at night or during the day (t(332.1) = 0.1, p > 0.05). All of the deepest dives for individuals M4 and M6 occurred at night, whereas one of the two deepest dives for M15 took place during the day. The overall distribution of dive shapes differed significantly between night and day (χ2 = 23.8, df = 4, p < 0.001). Standardized residuals and per-category chi-square tests indicated that this difference was driven primarily by V-shaped dives, which occurred more frequently at night (χ2 = 10.1, df = 1, p < 0.01), while the other dive shapes did not show significant diel variation (Figure 7, Table S6).
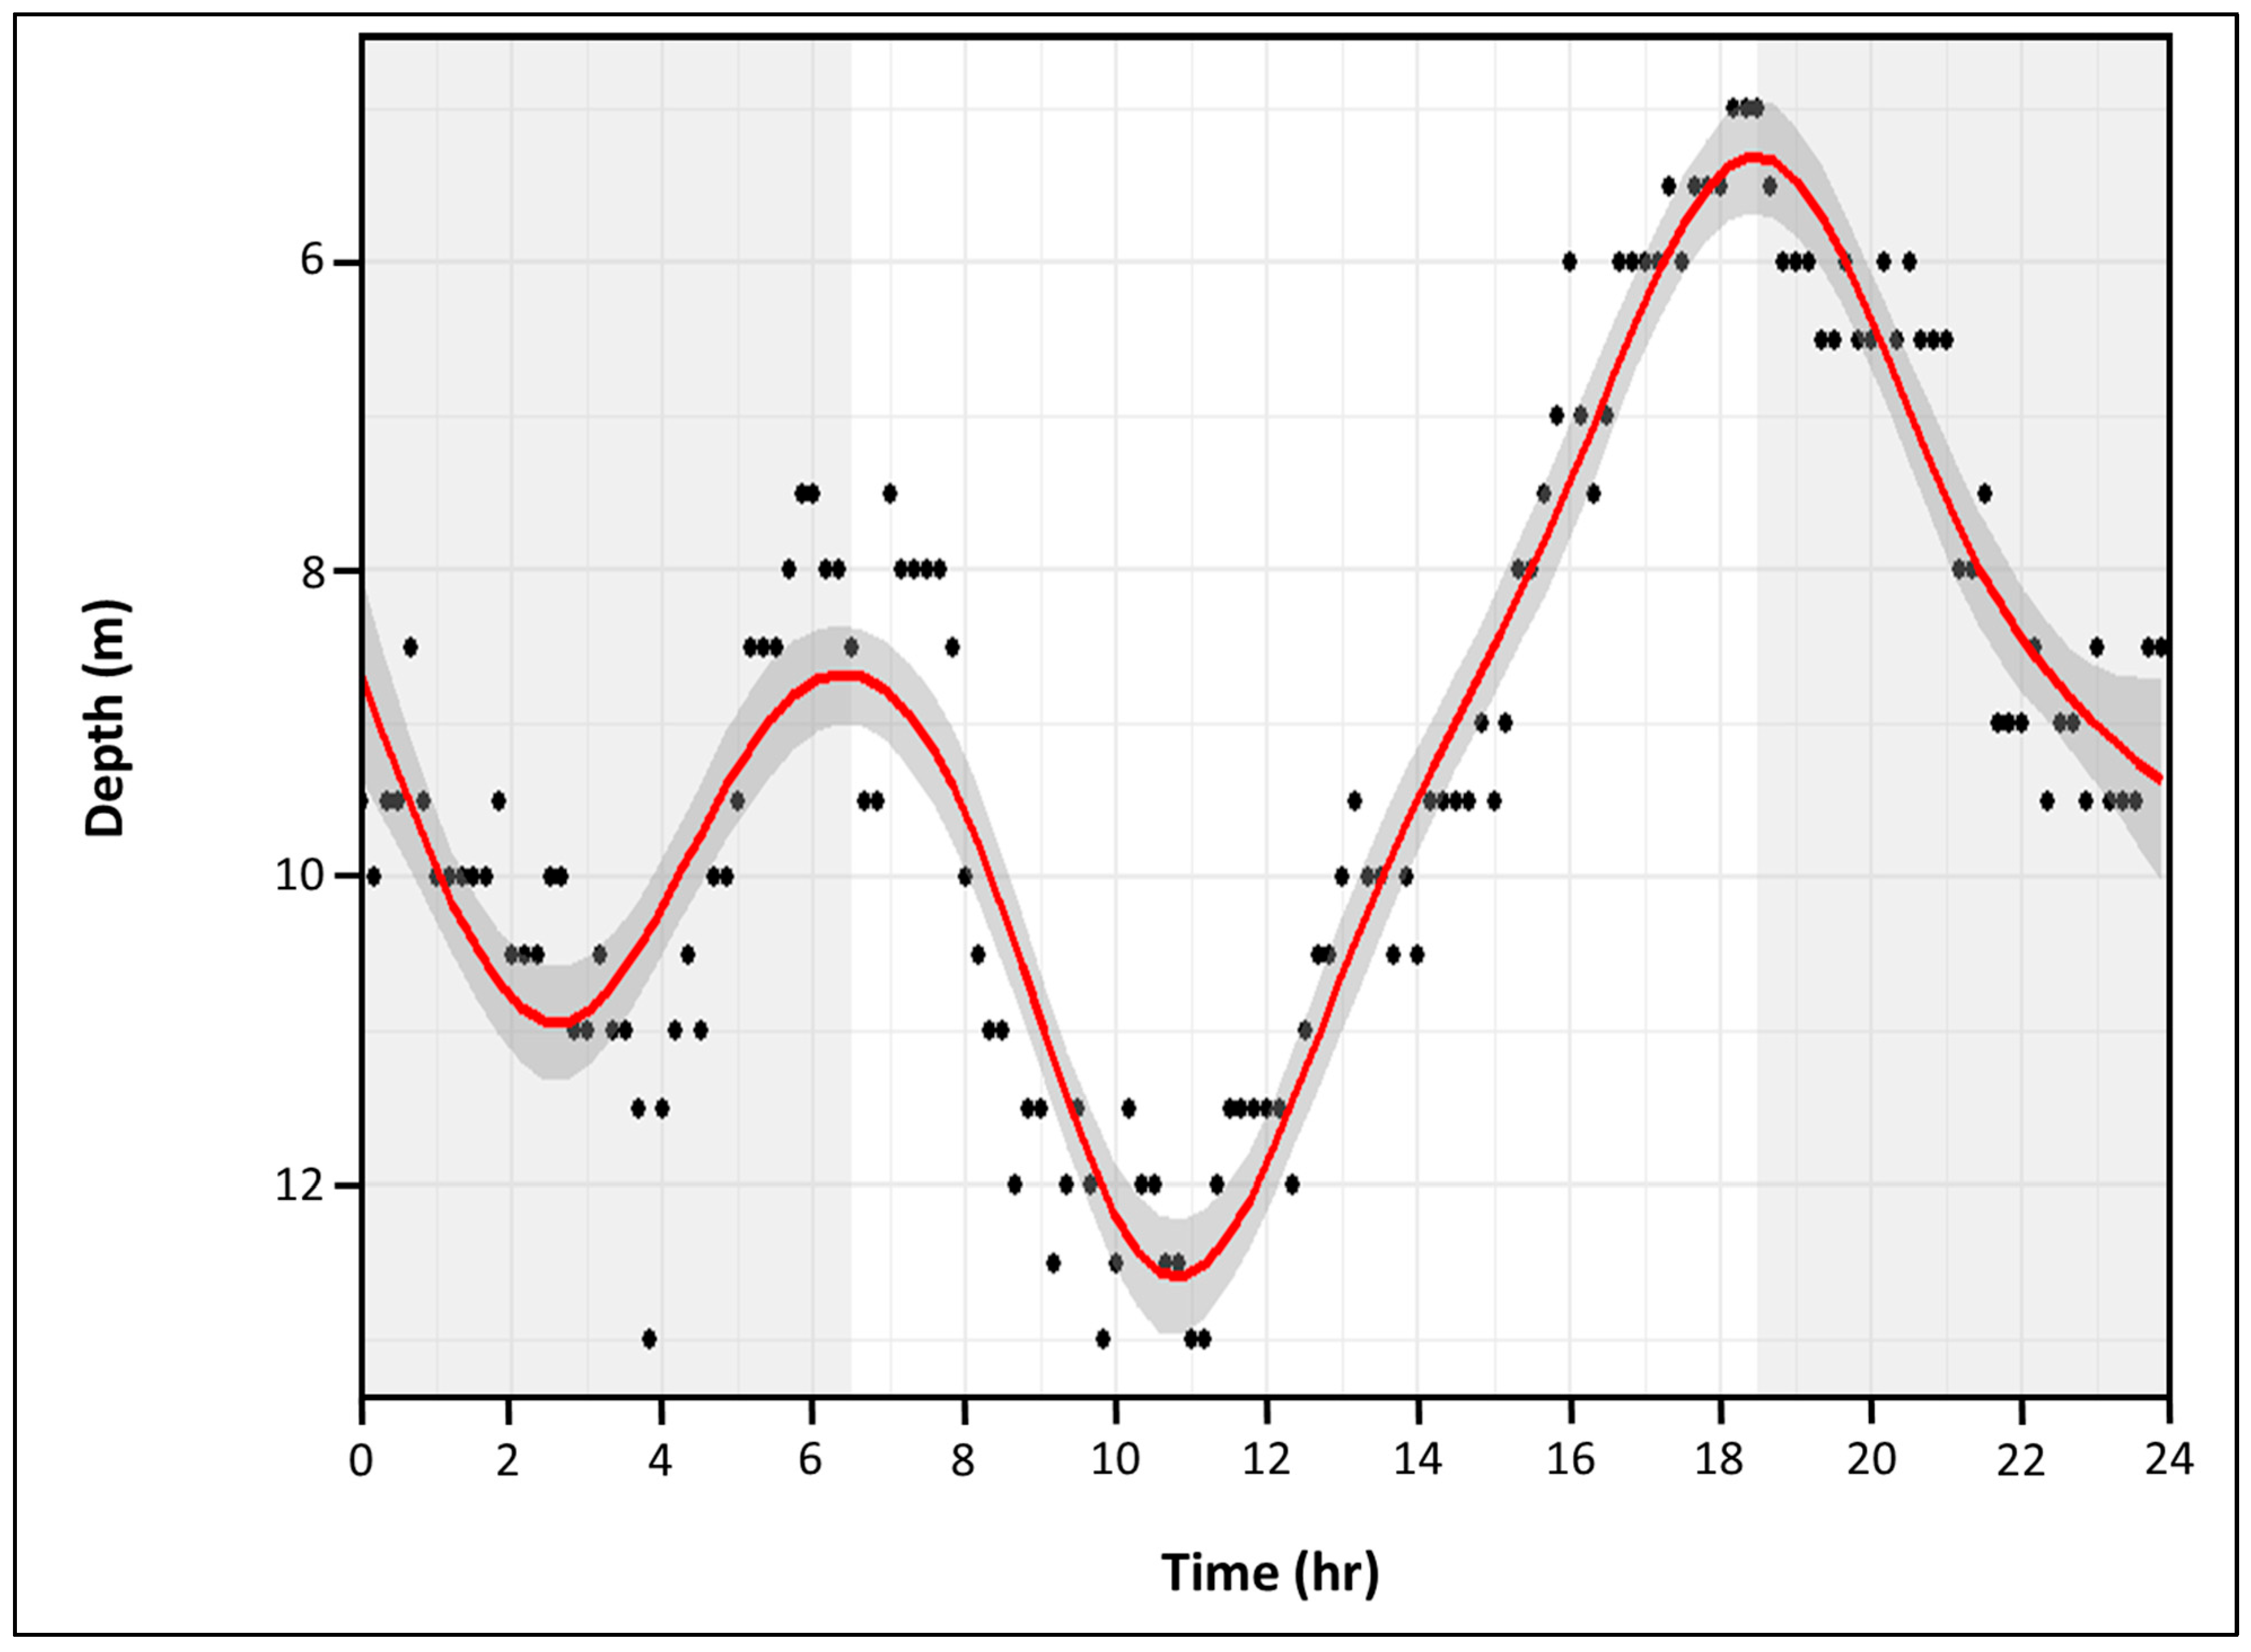
When data from all individuals were combined, depth use was not uniform but showed cyclic fluctuations aligned with time of day (Figure 8). Over a 24 h period, median swimming depths ranged from approximately 5 to 13 m and revealed a clear diel pattern. Manta rays occupied shallower depths around dawn and dusk (6–8 m), and deeper depths around midday (up to ~13 m).

4. Discussion

The use of satellite telemetry in New Caledonia has provided an unprecedented look into the vertical behaviour of the reef manta ray (Mobula alfredi), revealing consistent behavioral capacity for exceptionally deep and frequent diving within our sampled individuals compared to those studied elsewhere in the world. Lassauce et al. (2020) revealed part of these vertical behaviours [43], extending the previous known depth range of the species by more than 200 m [41] with a maximum depth at 672 m. New data incorporated in this study (with the addition of 10 more tags) support this trend, with all manta rays diving below 300 m deep and more than 10% of the daily maximum depth exceeding this threshold. These findings underscore a distinct behavioral repertoire accessible to the species in this region, with a different and more extensive use of the deeper water column than previously documented in other regions. Importantly, the consistency and frequency of these deep dives provided an opportunity to conduct detailed dive profile analyses, enabling us to infer potential behaviours associated with the use of mesopelagic and bathypelagic habitats.
The present study successfully retrieved data from 19 of the 23 deployed tags, providing one of the most extensive datasets on M. alfredi vertical movements to date. We acknowledge the modest final sample size (n = 19), a limitation driven primarily by the high cost of advanced biotelemetry equipment (SPLASH10 and MiniPAT tags). As sophisticated tracking tools, these tags require substantial financial investment, meaning the deployment of n = 23 units represented the maximum feasible research effort attainable within the project’s financial constraints. Despite this constraint, the resulting n = 19 successful tracks offer a robust and successful data yield compared to published studies on Mobulid species, where effective sample sizes often range from n = 5 to n = 22 tracks [46,47]. These data provide indispensable depth information, which is inaccessible through alternative tracking methods. However, we also acknowledge that only three of these tags were physically recovered, enabling access to full high-resolution archival data. While these three records offered exceptional insight into fine-scale dive profiles and shape characterization, they may not fully capture the behavioral variability across the entire sample. As such, interpretations of dive types, shape frequencies, and extreme depth events should be considered indicative rather than comprehensive representations of M. alfredi behavior. Nevertheless, the consistency between the overall patterns derived from the 19 summarized depth time-series and the detailed profiles from the three recovered tags supports the broader ecological relevance of the findings. Furthermore, the high rate of premature detachment—with only one tag completing the full 180-day programmed duration (mean retention 76.7 ± 50.3 days)—is a well-documented technical limitation of PSAT technology when deployed on highly mobile pelagic elasmobranchs [48]. The observed mean retention is typical for successful deployments on Mobulid species, reflecting the difficulty of maintaining the external attachment under the high mechanical and hydrostatic stress associated with the species’ rapid movements across the water column [47]. Global analysis shows that species undertaking large vertical excursions, such as the deep dives documented here, are known to have statistically lower tag retention rates [47]. The observed high loss rate may therefore be interpreted as an empirical proxy for the dynamic, deep-diving behavior of these New Caledonian reef manta rays. The resultant short-term retention introduces a temporal limitation that necessitates careful interpretation of the results. Temporal truncation means that long-term migratory patterns and seasonal habitat shifts occurring beyond the observed mean deployment period are systematically missed, potentially leading to a conservative underestimation of the species’ full seasonal habitat utilization. Despite this constraint, the resulting n = 19 dataset provides essential, non-redundant insights into the short- to mid-term vertical ecology of M. alfredi in a region where this behavior is exceptionally prevalent. Finally, the detailed analysis of dive shapes and speeds was necessarily restricted to the three individuals whose tags were physically retrieved, providing complete, high-resolution archival data. This small subsample (n = 3) limits the generalizability of the specific dive shape conclusions to a broader scale. However, these high-resolution profiles serve as crucial fine-scale case studies that provide mechanistic evidence for interpretation of the associated behavioral traits that support the broader patterns of extreme deep diving observed across the full tagged cohort.
Our present results describe frequent deep dives with one dive below 300 m every 4.8 days of deployment, also reinforcing our previous finding in Lassauce et al. 2020 [43]. Deep dives recorded in other studies, relatively to the deepest ones, were not as frequent, with only one dive below 150 m every 16.6 days in the Red Sea (n = 1030 days, [49]) and 34.8 days in the Seychelles (n = 696 days, [50]). Several studies on elasmobranch species documented repetitive diving as a common behaviour [19,50,51,52,53]. This high frequency of deep excursions supports the hypothesis that they are not random occurrences but rather a critical component of the species’ behaviour in this region. This behaviour was often associated with functions such as foraging, horizontal movements (through gliding) and thermoregulation [5,54]. Hypotheses on the function associated with a certain diving behaviour are rendered possible through the analysis of the different shapes of dive, and many studies used this method (e.g., [53,55,56,57]). The time spent at the deepest depth is one of the determining factors for describing shape classes. U-shaped dives, with a distinct bottom phase, and V-shaped dives, with little or no bottom phase, are the most commonly reported [53,58]. In addition, the speed of the animals during ascents and descents is another indicator of their behaviour and makes up the slope of the dive shape. These factors are also shaped by physiological constraints, such as the need to regulate body temperature for ectotherms, and the investigation on the balance between gains and costs may help determine behavioural patterns [52,53,56,57,58].
In our study, detailed analysis of the dive profiles provided strong evidence of a complex, depth-dependent foraging strategy for reef manta rays in New Caledonia. However, the functional interpretation of deep-diving behaviour in reef manta rays requires caution, particularly given the diversity of dive profiles observed across our dataset. From the three recovered tags, a total of 2869 individual dives were analysed and categorized into five main dive shapes (U, V, V-left skewed, V-right skewed, and W). While all forms occurred to some extent, their relative frequencies varied systematically with depth. U-shaped dives dominated in shallow waters (25–50 m), suggesting localised foraging in prey-rich surface layers, whereas V-shaped dives became progressively more common at greater depths (50–400 m), representing 36% of all dives overall and the large majority of dives below 300 m. This depth-dependent shift in dive profile indicates that multiple functions likely coexist, but that V-shaped dives represent the dominant behavioural mode during deep excursions, and thus warrant focused interpretation.
The fine-scale analysis of the deepest dives provides crucial insights into the behavioural functions of vertical habitat use of these tagged individuals. The prevalence of V-shaped profiles among the deepest dives recorded by the three retrieved tags is consistent with an exploratory diving strategy, where the animals swim across the different depth layers of the water column to collect cues that propagate horizontally [42,53,55,58,59,60]. A key finding across most of the profiles (M6 and M15) was the tendency for a slower descent followed by a faster ascent. This specific dive morphology has been thought to represent slow exploration during descent following the sea floor [42,58]. Another hypothesis for left-skewed V-shaped dives strongly supports the “gliding” hypothesis, a bioenergetically efficient strategy previously suggested for M. alfredi and other large filter-feeders, including whale sharks and oceanic manta rays. By using negative buoyancy to descend passively, manta rays can minimize energy expenditure while accessing the deep, potentially prey-rich, mesopelagic zone, before actively swimming back to the surface [41,43]. The notable variation in descent patterns, such as M15’s multi-phase descent, suggests a nuanced approach to exploration, possibly involving a slow, methodical search through a particular depth layer before committing to the deepest part of the dive. While some profiles, like M4’s, exhibited a less common leftward skew, the overall pattern aligns with the understanding that these deep dives are not random but serve a specific purpose, such as foraging on mesopelagic or emergent demersal zooplankton. Studies used stable isotope and signature fatty acid analysis to demonstrate that demersal zooplankton may be an important part of the diet of reef manta rays [61]. Similar results were also in the oceanic manta ray [62,63] and other filter-feeding elasmobranchs such as basking sharks [64,65] and whale sharks [50,66]. These detailed, high-resolution dive data reinforce the ecological significance of this species as a vital link between shallow coastal ecosystems and the deeper, offshore habitats. Further investigations on the nature of the diet of reef manta rays in New Caledonia would help confirm these hypotheses. Non-lethal sampling and biochemical methods, such as stable isotope or fatty acid analyses, could assist in understanding the composition of the animals’ diet and help determine whether demersal zooplankton is part of it and in what proportion [61].
While our findings strongly support an exploratory function for deep-diving behaviour, it remains important to consider other, non-exclusive hypotheses that may also explain a portion of the observed dives. Deep-diving in large marine predators has been linked to alternative functions such as foraging, thermoregulation, predator avoidance, and environmental exploration [58]. In our case, the quantitative and qualitative characteristics of the dives collectively support exploration as the most plausible main function, while acknowledging that other purposes may occur less frequently. For instance, if these deep dives were associated with successful foraging events, one would expect extended bottom phases (U-shaped profiles) and diel periodicity consistent with prey vertical migration at the deep scattering layer. In contrast, our data revealed mostly short, symmetrical V-shaped dives with minimal bottom time (average 9.1 ± 5.9 min) and no significant diel variation in depth use or frequency of dives below 300 m. Although such depths (~300–450 m) overlap with mesopelagic layers, the brevity and shape of the dives do not indicate sustained foraging activity. In addition, the short duration spent in the deepest parts of the water column likely reflects thermal constraints that restrict the ability of reef manta rays to remain in cold, deep environments [58]. The daily maximum depths corresponded to an average temperature of 23.6 °C. For dives exceeding 300 m, the mean temperature dropped to 17.1 °C, substantially cooler than the typical epipelagic range (~25–29 °C). Given that mantas typically occupy warm epipelagic waters (~25–29 °C), such rapid transitions to cold environments are likely physiologically demanding and energetically costly to maintain [66]. Finally, predator avoidance could, in principle, explain sudden descents into deep water; however, this hypothesis only appears consistent with a small proportion of the deep dive profiles observed. Escape dives are typically rare, highly asymmetrical, and erratic, reflecting reactive rather than deliberate movements, and correspond to right-skewed V-shaped dives characterized by faster descents and slower ascents.
Foraging and the search for food resources are important drivers of most behaviour of manta rays. The fact that reef manta rays dive deeper and more frequently may be triggered by the need to find alternative energy sources due to limited or insufficient food within the upper layer of the water column in New Caledonia. One indication to corroborate limited use of near-surface water to feed would be the fact that very few manta rays showed regular surface occupation during deployment [17]. The number of satellite localizations reflects the number of times the animal is surfacing, and high surface occupation within an area may be an indicator of surface feeding in reef manta rays [11,17,67]. Another indicator would be a diel partition in depth occupation since surface feeding is triggered by conditions occurring during daytime [49]. Unlike our previous findings [43], the addition of 10 supplementary tags in this study revealed complex and individual-specific patterns in the diel variations in the vertical movement, yet still provided insights into the species’ overall foraging strategy. While the median swimming depth showed a general diel pattern—with individuals occupying shallower depths around dawn and dusk and deeper depths around midday—there was considerable individual variation in the vertical distances covered, with M4 showing greater movement at night, M15 during the day, and M6 showing no significant difference. This finding contrasts with some studies that have reported a more consistent Diel Vertical Migration (DVM) where manta rays move to deeper waters at night to forage [41,49] but aligns with other research that has also noted individual variability in these patterns [5,19]. The nocturnal occurrence of the deepest dives for individuals M4 and M6 supports the hypothesis that manta rays descend to exploit rising layers of mesopelagic zooplankton that move into the photic zone at night. Furthermore, the significant nocturnal increase in V-shaped dives, which are linked to exploratory behaviour, suggests that vertical exploration is a key component of their nighttime foraging strategy. The fact that the deepest dives for one individual occurred during the day, combined with the midday increase in overall median depth, highlights that foraging is not exclusively a nocturnal activity and may be influenced by other factors beyond a classic diel pattern. This type of behavioural plasticity in DVM has also been observed in other filter-feeding species, such as whale sharks, which also exhibit variable vertical movements depending on the environmental conditions and prey availability.

5. Conclusions

This work used satellite telemetry to gather additional evidence that the spatial ecology of the reef manta ray seems highly driven by the availability of food resources. In New Caledonia, these resources might be scarce within the upper layers of the water column, pushing the species to dive deeper to possibly feed on demersal food. This finding brings additional supports that highlight the use of mesopelagic depths as an important part of the habitat of the reef manta ray. In New Caledonia, concerns regarding the species conservation are limited since reef manta rays are not targeted by fisheries, and human impacts remain relatively low. Globally, such a favourable context is scarce, which makes the population of New Caledonia a reference to be preserved [22]. Therefore, preventive precautions should be taken at a local level where coastal development is rapidly expanding and might threaten critical habitats. Given the high frequency and specific vertical extent of these dives, this study necessitates a re-evaluation of current Marine Protected Area (MPA) design to incorporate this vertical dimension, ensuring the protection of this species adopts a three-dimensional perspective. For instance, management plans should prioritize the protection of oceanic corridors or transition zones connecting key coastal sites to deep pelagic habitats and consider restricting commercial activities that impact the water column in deep habitats adjacent to critical reef manta ray areas. This study shows the efficiency of the use of satellite telemetry to detect vertical movements and behavioural patterns of reef manta rays. More significant sampling effort and long-term monitoring might reveal the existence of seasonal patterns and new key habitats, and extending sampling to remote areas of the archipelago, such as isolated reefs, may offer further insight into the species’ vertical diving behaviour. Despite these advances, significant gaps remain in our understanding of manta ray ecology. Future research should prioritize clarifying the specific biophysical and oceanographic drivers that govern both their foraging and migratory movements. A deeper investigation into the sensory ecology of these animals is also needed to understand how they navigate and locate prey in the light-limited mesopelagic zone. The continued application of a multi-methodological approach—combining high-resolution satellite telemetry, long-term photographic identification, and biochemical analyses—will be essential to fill these gaps. Such comprehensive research will not only advance our fundamental understanding of this charismatic megafauna but also provide the robust data necessary to inform and strengthen conservation policies and management efforts worldwide.

Supplementary Materials

The following supporting information can be downloaded at https://www.mdpi.com/article/10.3390/fishes10110545/s1. Figure S1: Statistical major shift in the distribution of daily maximum depths inferred through Change-Point Analysis (CPA) and Gaussian Mixture Models (GMM) for reef manta rays (n = 19) during deployment of pop-up satellite tags (SPLASH10) in New Caledonia; Figure S2: Daily maximum depth (m) for reef manta rays (Mobula alfredi) (n = 14) during deployment of pop-up satellite tags (SPLASH10) in New Caledonia. Days indicate the total duration of deployment for each individual (M); Table S1: Summary of satellite tag deployments on reef manta rays (Mobula alfredi) in New Caledonia; Table S2: Vertical movement metrics for reef manta rays (Mobula alfredi) tracked using satellite tags in New Caledonia; Table S3: Dive metrics for reef manta rays (Mobula alfredi) using satellite tags in New Caledonia. ± indicate SD values and numbers in brackets indicate min and max values; Table S4: Distribution of dive shapes per depth range for reef manta rays (Mobula alfredi) (n = 3) recorded using pop-up satellite tags (SPLASH10 and MiniPAT) in New Caledonia; Table S5: Kolmogorov–Smirnov (K-S) test statistics of differences in dive profiles of deepest dives of reef manta rays (Mobula alfredi) in New Caledonia. p-values are above the diagonals and D statistics are below the diagonals; Table S6: Chi-square (χ2) test statistics of differences in the shapes of dives (n = 2869) performed by reef manta rays (Mobula alfredi) (n = 3) recorded using pop-up satellite tags (SPLASH10 and MiniPAT) in New Caledonia.

Author Contributions

Conceptualization, H.L., L.W. and O.C.; methodology, H.L. and L.W.; validation, H.L., L.W. and O.C.; formal analysis, H.L. and L.W.; investigation, H.L.; resources, H.L., L.W. and O.C.; data curation, H.L.; writing—original draft preparation, H.L.; writing—review and editing, H.L., L.W. and O.C.; visualization, H.L., L.W. and O.C.; supervision, L.W. and O.C.; project administration, H.L. and L.W.; funding acquisition, H.L., L.W. and O.C. All authors have read and agreed to the published version of the manuscript.

Funding

We express particular thanks to the Keidanren Nature Conservation Fund (KNCF), which funded the study through the SATO YAMA UMI Project and Conservation International. We thank the Southern Province of New Caledonia for its financial support in the form of a scholarship to HL. We also gratefully acknowledge the financial support of MAC3 Impact Philanthropies, William Brooks, Pam Rorke Levy, Audrey and Shannon Wong, Daniel Roozen and Kris Norvig in sponsoring satellite tags, and we thank OceanMax for supplying the Propspeed antifouling coating for our tags. Conservation International played a role in the study design and the data collection but had no role in analysis, decision to publish, or preparation of the manuscript. The remaining funders had no role in study design, data collection and analysis, decision to publish, or preparation of the manuscript.

Institutional Review Board Statement

This study was conducted with authorizations from the Southern Province (permit no: 34584 and approval date: 12 December 2016) and the Northern Province (permit no: 609011–33 and approval date: 17 May 2018) of New Caledonia. In the Loyalty Islands Province, no permit was required by the competent authorities, though permission of the local customary representatives was granted.

Informed Consent Statement

Not applicable.

Data Availability Statement

We have presented extensive data generated by this study in the tables and Supplementary Materials. Contact the corresponding authors for further requests.

Acknowledgments

We thank Conservation International, the Aquarium des Lagons, MAC3 Impact Philanthropies and The Manta Trust for their overall support for the study. We especially thank Franck Bouilleret, Mael Imirizaldu and Thomas Auger for their priceless assistance in field operations, as well as Jean-Christophe Lefeuvre and François Tron for their support. We also thank the Hô-üt Association and its members, as well as all those involved in the field operations, for their valuable help (Pierre Kaouma, Marino Tiaou, Jean-Baptiste Badiou, Ludovic Mazens, Abyss Plongée, Sarah Lewis, Schannel van Dijken, Minori Matsuoka). We finally gratefully acknowledge the customary representatives of Ouvéa and Touho, and the three Provinces for allowing such operations.

Conflicts of Interest

Author Hugo Lassauce was employed by the Manta Trust and Conservation International. The authors declare that this study received funding from the Keidanren Nature Conservation Fund (KNCF) through the SATO YAMA UMI Project and Conservation International, along with additional support detailed in the Funding section. Conservation International played a role in the study design and data collection but had no role in analysis, decision to publish, or preparation of the manuscript. The Manta Trust was not involved in the study. The remaining authors declare that the research was conducted in the absence of any commercial or financial relationships that could be construed as a potential conflict of interest.

References

  1. Chatzievangelou, D.; Bahamon, N.; Martini, S.; Del Rio, J.; Riccobene, G.; Tangherlini, M.; Danovaro, R.; De Leo, F.C.; Pirenne, B.; Aguzzi, J. Integrating diel vertical migrations of bioluminescent deep scattering layers into monitoring programs. Front. Mar. Sci. 2021, 8, 661809. [Google Scholar] [CrossRef]
  2. Shipley, O.N.; Matich, P.; Hussey, N.E.; Brooks, A.M.; Chapman, D.; Frisk, M.G.; Guttridge, A.E.; Guttridge, T.L.; Howey, L.A.; Kattan, S.; et al. Energetic connectivity of diverse elasmobranch populations—Implications for ecological resilience. Proc. R. Soc. B. 2023, 290, 20230262. [Google Scholar] [CrossRef]
  3. Williams, J.J.; Papastamatiou, Y.P.; Caselle, J.E.; Bradley, D.; Jacoby, D.M.P. Mobile marine predators: An understudied source of nutrients to coral reefs in an unfished atoll. Proc. Biol. Sci. 2018, 285, 20172456. [Google Scholar] [CrossRef]
  4. Bandara, K.; Varpe, Ø.; Wijewardene, L.; Tverberg, V.; Eiane, K. Two hundred years of zooplankton vertical migration research. Biol. Rev. 2021, 96, 1547–1589. [Google Scholar] [CrossRef]
  5. Andrzejaczek, S.; Gleiss, A.C.; Pattiaratchi, C.B.; Meekan, M.G. Patterns and drivers of vertical movements of the large fishes of the epipelagic. Rev. Fish Biol. Fish. 2019, 29, 335–354. [Google Scholar] [CrossRef]
  6. Klinard, N.V.; Mull, C.G.; Heithaus, M.R.; MacNeil, M.A. Defining ecological roles of sharks on coral reefs. Biol. Rev. 2025. [Google Scholar] [CrossRef]
  7. Tixier, P.; Lea, M.A.; Hindell, M.A.; Welsford, D.; Mazé, C.; Gourguet, S.; Arnould, J.P.Y. When large marine predators feed on fisheries catches: Global patterns of the depredation conflict and directions for coexistence. Fish Fish. 2021, 22, 31–53. [Google Scholar] [CrossRef]
  8. Hughes, B.B.; Beheshti, K.M.; Tinker, M.T.; Angelini, C.; Endris, C.; Murai, L.; Anderson, S.C.; Espinosa, S.; Staedler, M.; Tomoleoni, J.A.; et al. Top-predator recovery abates geomorphic decline of a coastal ecosystem. Nature 2024, 626, 111–118. [Google Scholar] [CrossRef]
  9. Anderson, R.C.; Adam, M.S.; Goes, J.I. From monsoons to mantas: Seasonal distribution of Manta alfredi in the Maldives. Fish. Oceanogr. 2011, 20, 104–113. [Google Scholar] [CrossRef]
  10. Germanov, E.S.; Marshall, A.D. Running the gauntlet: Regional movement patterns of Manta alfredi through a complex of parks and fisheries. PLoS ONE 2014, 9, e110071. [Google Scholar] [CrossRef] [PubMed]
  11. Jaine, F.R.A.; Rohner, C.A.; Weeks, S.J.; Couturier, L.I.E.; Bennett, M.B.; Townsend, K.A.; Richardson, A.J. Movements and habitat use of reef manta rays off eastern Australia: Offshore excursions, deep diving and eddy affinity revealed by satellite telemetry. Mar. Ecol. Prog. Ser. 2014, 510, 73–86. [Google Scholar] [CrossRef]
  12. Jaine, F.R.; Couturier, L.I.; Weeks, S.J.; Townsend, K.A.; Bennett, M.B.; Fiora, K.; Richardson, A.J. When giants turn up: Sighting trends, environmental influences and habitat use of the manta ray Manta alfredi at a coral reef. PLoS ONE 2012, 7, e46170. [Google Scholar] [CrossRef]
  13. Couturier, L.I.; Dudgeon, C.L.; Pollock, K.H.; Jaine, F.R.A.; Bennett, M.B.; Townsend, K.A.; Weeks, S.J.; Richardson, A.J. Population dynamics of the reef manta ray Manta alfredi in eastern Australia. Coral Reefs 2014, 33, 329–342. [Google Scholar] [CrossRef]
  14. Deakos, M.H.; Baker, J.D.; Bejder, L. Characteristics of a manta ray Manta alfredi population off Maui, Hawaii, and implications for management. Mar. Ecol. Prog. Ser. 2011, 429, 245–260. [Google Scholar] [CrossRef]
  15. Whitney, J.L.; Coleman, R.R.; Deakos, M.H. Genomic evidence indicates small island-resident populations and sex-biased behaviors of Hawaiian reef Manta Rays. BMC Ecol. Evol. 2023, 23, 31. [Google Scholar] [CrossRef] [PubMed]
  16. Setyawan, E.; Sianipar, A.B.; Erdmann, M.; Fischer, A.M.; Haddy, J.A.; Beale, C.S.; Sarah, A.L.; Mambrasar, R. Site fidelity and movement patterns of reef manta rays (Mobula alfredi: Mobulidae) using passive acoustic telemetry in northern Raja Ampat, Indonesia. Nat. Conserv. Res. 2018, 3, 17–31. [Google Scholar] [CrossRef]
  17. Lassauce, H.; Chateau, O.; Wantiez, L. Spatial ecology of the population of reef manta rays, Mobula alfredi (Krefft, 1868), in New Caledonia using satellite telemetry 1- Horizontal behaviour. Fishes 2023, 8, 328. [Google Scholar] [CrossRef]
  18. Lassauce, H.; Dudgeon, C.L.; Armstrong, A.J.; Wantiez, L.; Carroll, E.L. Evidence of fine-scale genetic structure for reef manta rays Mobula alfredi in New Caledonia. Endang. Species Res. 2022, 47, 249–264. [Google Scholar] [CrossRef]
  19. Rohner, C.A.; Venables, S.K.; Knochel, A.M.; Rambahiniarison, J.M.; Marillac, V.; Cardon, C.; Scholten, N.; Pierce, S.J.; Kiszka, J.J. Movements and habitat use of reef manta rays around the Mozambique Channel Island of Mayotte, Southwestern Indian Ocean. Environ. Biol. Fishes 2025, 108, 937–955. [Google Scholar] [CrossRef]
  20. Marshall, A.; Barreto, R.; Carlson, J.; Fernando, D.; Fordham, S.; Francis, M.P.; Herman, K.; Jabado, R.W.; Liu, K.M.; Pacoureau, N.; et al. Mobula alfredi (amended version of 2019 assessment). The IUCN Red List of Threatened Species. 2022; e.T195459A214395983. Available online: https://www.iucnredlist.org/species/195459/214395983 (accessed on 9 September 2025).
  21. Marshall, A.D.; Bennett, M.B. Reproductive ecology of the reef manta ray Manta alfredi in southern Mozambique. J. Fish Biol. 2010, 77, 169–190. [Google Scholar] [CrossRef]
  22. O’Malley, M.P.; Townsend, K.A.; Hilton, P.; Heinrichs, S.; Stewart, J.D. Characterization of the trade in manta and devil ray gill plates in China and Southeast Asia through trader surveys. Aquat. Conserv. Mar. Freshw. Ecosyst. 2017, 27, 394–413. [Google Scholar] [CrossRef]
  23. O’Malley, M.P.; Lee-Brooks, K.; Medd, H.B. The global economic impact of manta ray watching tourism. PLoS ONE 2013, 8, e65051. [Google Scholar] [CrossRef]
  24. Venables, S.; McGregor, F.; Brain, L.; van Keulen, M. Manta ray tourism management, precautionary strategies for a growing industry: A case study from the Ningaloo Marine Park, Western Australia. Pac. Conserv. Biol. 2016, 22, 295–300. [Google Scholar] [CrossRef]
  25. Ward-Paige, C.A.; Davis, B.; Worm, B. Global population trends and human use patterns of Manta and Mobula rays. PLoS ONE 2013, 8, e74835. [Google Scholar] [CrossRef]
  26. Rohner, C.A.; Pierce, S.J.; Marshall, A.D.; Weeks, S.J.; Bennett, M.B.; Richardson, A.J. Trends in sightings and environmental influences on a coastal aggregation of manta rays and whale sharks. Mar. Ecol. Prog. Ser. 2013, 482, 153–168. [Google Scholar] [CrossRef]
  27. Croll, D.A.; Dewar, H.; Dulvy, N.K.; Fernando, D.; Francis, M.P.; Galván-Magaña, F.; Hall, M.; Heinrichs, S.; Marshall, A.; Mccauley, D.; et al. Vulnerabilities and fisheries impacts: The uncertain future of manta and devil rays. Aquat. Conserv. Mar. Freshw. Ecosyst. 2016, 26, 562–575. [Google Scholar] [CrossRef]
  28. Lawson, J.M.; Fordham, S.V.; O’Malley, M.P.; Davidson, L.N.; Walls, R.H.; Heupel, M.R.; Stevens, G.; Fernando, D.; Budziak, A.; Simpfendorfer, C.A.; et al. Sympathy for the devil: A conservation strategy for devil and manta rays. PeerJ 2017, 5, e3027. [Google Scholar] [CrossRef] [PubMed]
  29. McGregor, F.; Richardson, A.J.; Armstrong, A.J.; Armstrong, A.O.; Dudgeon, C.L. Rapid wound healing in a reef manta ray masks the extent of vessel strike. PLoS ONE 2019, 14, e0225681. [Google Scholar] [CrossRef]
  30. Andrzejaczek, S.; Lucas, T.C.; Goodman, M.C.; Hussey, N.E.; Armstrong, A.J.; Carlisle, A.; Coffey, D.M.; Gleiss, A.C.; Huveneers, C.; Jacoby, D.M.; et al. Diving into the vertical dimension of elasmobranch movement ecology. Sci. Adv. 2022, 8, eabo1754. [Google Scholar] [CrossRef]
  31. Graham, R.T.; Witt, M.J.; Castellanos, D.W.; Remolina, F.; Maxwell, S.; Godley, B.J.; Hawkes, L.A. Satellite tracking of manta rays highlights challenges to their conservation. PLoS ONE 2012, 7, e36834. [Google Scholar] [CrossRef] [PubMed]
  32. Lefort, K.J.; Hussey, N.E.; Jones, J.M.; Johnson, K.F.; Ferguson, S.H. Satellite-tracked sperm whale migrates from the Canadian Arctic to the subtropical western North Atlantic. Mar. Mamm. Sci. 2022, 38, 1242–1248. [Google Scholar] [CrossRef]
  33. Braun, C.D.; Della Penna, A.; Arostegui, M.C.; Afonso, P.; Berumen, M.L.; Block, B.A.; Brown, C.A.; Fontes, J.; Furtado, M.; Gallagher, A.J.; et al. Linking vertical movements of large pelagic predators with distribution patterns of biomass in the open ocean. Proc. Natl. Acad. Sci. USA 2023, 120, e2306357120. [Google Scholar] [CrossRef]
  34. Robichaud, J.A.; Haley, A.L.; LaRochelle, L.; Dello Russo, J.; Zhang, J.; Cunningham, K.E.; Lawson, L.; Bergman, J.N.; Jolin, E.; Madden, J.C.; et al. Global trends in aquatic animal satellite telemetry studies. Environ. Rev. 2025, 33, 1–19. [Google Scholar] [CrossRef]
  35. Nichols, R.C.; Cade, D.E.; Kahane-Rapport, S.; Goldbogen, J.; Stimpert, A.; Nowacek, D.; Read, A.J.; Johnston, D.W.; Friedlaender, A.S. Intra-seasonal variation in feeding rates and diel foraging behaviour in a seasonally fasting mammal, the humpback whale. R. Soc. Open Sci. 2022, 9, 211674. [Google Scholar] [CrossRef] [PubMed]
  36. Gould, L.A.; Manning, A.D.; McGinness, H.M.; Hansen, B.D. A review of electronic devices for tracking small and medium migratory shorebirds. Anim. Biotelemetry 2024, 12, 11. [Google Scholar] [CrossRef]
  37. Renshaw, S.; Hammerschlag, N.; Gallagher, A.J.; Lubitz, N.; Sims, D.W. Global tracking of shark movements, behaviour and ecology: A review of the renaissance years of satellite tagging studies, 2010–2020. J. Exp. Mar. Biol. Ecol. 2023, 560, 151841. [Google Scholar] [CrossRef]
  38. Haywood, J.C.; Fuller, W.J.; Godley, B.J.; Margaritoulis, D.; Shutler, J.D.; Snape, R.T.; Widdicombe, S.; Zbinden, J.A.; Broderick, A.C. Spatial ecology of loggerhead turtles: Insights from stable isotope markers and satellite telemetry. Divers. Distrib. 2020, 26, 368–381. [Google Scholar] [CrossRef]
  39. Meyers, M.M.; Francis, M.P.; Erdmann, M.; Constantine, R.; Sianipar, A. Movement patterns of whale sharks in Cenderawasih Bay, Indonesia, revealed through long-term satellite tagging. Pac. Conserv. Biol. 2020, 26, 353–364. [Google Scholar] [CrossRef]
  40. Watanabe, Y.Y.; Papastamatiou, Y.P. Biologging and biotelemetry: Tools for understanding the lives and environments of marine animals. Annu. Rev. Anim. Biosci. 2023, 11, 247–267. [Google Scholar] [CrossRef]
  41. Braun, C.D.; Skomal, G.B.; Thorrold, S.R.; Berumen, M.L. Diving behavior of the reef manta ray links coral reefs with adjacent deep pelagic habitats. PLoS ONE 2014, 9, e88170. [Google Scholar] [CrossRef]
  42. Andrzejaczek, S.; Schallert, R.J.; Forsberg, K.; Arnoldi, N.S.; Cabanillas-Torpoco, M.; Purizaca, W.; Block, B.A. Reverse diel vertical movements of oceanic manta rays off the northern coast of Peru and implications for conservation. Ecol. Solut. Evid. 2021, 2, e12051. [Google Scholar] [CrossRef]
  43. Lassauce, H.; Chateau, O.; Erdmann, M.V.; Wantiez, L. Diving behavior of the reef manta ray (Mobula alfredi) in New Caledonia: More frequent and deeper nighttime diving to 672 meters. PLoS ONE 2020, 15, e0228815. [Google Scholar] [CrossRef]
  44. Beale, C.S.; Runtuboy, F.; Sianipar, A.; Beer, A.J.; Erdmann, M.; Setyawan, E.; Green, L.; Duffy, C.A.; Andrzejaczek, S.; Block, B.A.; et al. Deep diving behaviour in oceanic manta rays and its potential function. Front. Mar. Sci. 2025, 12, 1630451. [Google Scholar] [CrossRef]
  45. Andréfouët, S.; Cabioch, G.; Flamand, B.; Pelletier, B. A reappraisal of the diversity of geomorphological and genetic processes of New Caledonian coral reefs: A synthesis from optical remote sensing, coring and acoustic multibeam observations. Coral Reefs 2009, 28, 691–707. [Google Scholar] [CrossRef]
  46. Armstrong, A.J.; Armstrong, A.O.; McGregor, F.; Richardson, A.J.; Bennett, M.B.; Townsend, K.A. Satellite tagging and photographic identification reveal connectivity between two UNESCO world heritage areas for reef manta rays. Front. Mar. Sci. 2020, 7, 725. [Google Scholar] [CrossRef]
  47. Musyl, M.K.; Domeier, M.L.; Nasby-Lucas, N.; Brill, R.W.; McNaughton, L.M.; Swimmer, J.Y.; Lutcavage, M.S.; Wilson, S.G.; Galuardi, B.; Liddle, J.B. Performance of pop-up satellite archival tags. Mar. Ecol. Prog. Ser. 2011, 433, 1–28. [Google Scholar] [CrossRef]
  48. D’Antonio, B.; Ferreira, L.C.; Meekan, M.; Thomson, P.G.; Lieber, L.; Virtue, P.; Power, C.; Pattiaratchi, C.B.; Brierley, A.S.; Sequeira, A.M.M.; et al. Links between the three-dimensional movements of whale sharks (Rhincodon typus) and the bio-physical environment off a coral reef. Mov. Ecol. 2024, 12, 10. [Google Scholar] [CrossRef] [PubMed]
  49. Braun, C.D.; Skomal, G.B.; Thorrold, S.R.; Berumen, M.L. Movements of the reef manta ray (Manta alfredi) in the Red Sea using satellite and acoustic telemetry. Mar. Biol. 2015, 162, 2351–2362. [Google Scholar] [CrossRef]
  50. Peel, L.R.; Stevens, G.M.; Daly, R.; Keating Daly, C.A.; Collin, S.P.; Nogués, J.; Meekan, M.G. Regional movements of reef manta rays (Mobula alfredi) in Seychelles waters. Front. Mar. Sci. 2020, 7, 558. [Google Scholar] [CrossRef]
  51. Jewell, O.J.D.; Chapple, T.K.; Jorgensen, S.J.; Kanive, P.; Moxley, J.H.; Tweedley, J.R.; Anderson, S.; Block, B.A.; Gleiss, A.C. Diverse habitats shape the movement ecology of a top marine predator, the white shark Carcharodon carcharias. Ecosphere 2024, 15, e4825. [Google Scholar] [CrossRef]
  52. Watanabe, Y.Y.; Nakamura, I.; Chiang, W.-C. Behavioural thermoregulation linked to foraging in blue sharks. Mar. Biol. 2021, 168, 161. [Google Scholar] [CrossRef]
  53. Queiroz, N.; Vila-Pouca, C.; Couto, A.; Southall, E.J.; Mucientes, G.; Humphries, N.E.; Sims, D.W. Convergent foraging tactics of marine predators with different feeding strategies across heterogeneous ocean environments. Front. Mar. Sci. 2017, 4, 239. [Google Scholar] [CrossRef]
  54. Schaber, M.; Gastauer, S.; Cisewski, B.; Hielscher, N.; Janke, M.; Peña, M.; Sakinan, S.; Thorburn, J. Extensive oceanic mesopelagic habitat use of a migratory continental shark species. Sci. Rep. 2022, 12, 2047. [Google Scholar] [CrossRef] [PubMed]
  55. Fonseca, C.T.; Pérez-Jorge, S.; Prieto, R.; Oliveira, C.; Tobeña, M.; Scheffer, A.; Silva, M.A. Dive behavior and activity patterns of fin whales in a migratory habitat. Front. Mar. Sci. 2022, 9, 875731. [Google Scholar] [CrossRef]
  56. Schwarz, J.F.L.; Mews, S.; DeRango, E.; Langrock, R.; Piedrahita, P.; Páez-Rosas, D.; Krüger, O. Individuality counts: A new comprehensive approach to foraging strategies of a tropical marine predator. Oecologia 2021, 195, 313–325. [Google Scholar] [CrossRef]
  57. Florko, K.R.N.; Shuert, C.R.; Cheung, W.W.L.; Ferguson, S.H.; Jonsen, I.D.; Rosen, D.A.S.; Sumaila, U.R.; Tai, T.C.; Yurkowski, D.J.; Auger-Méthé, M. Linking movement and dive data to prey distribution models: New insights in foraging behaviour and potential pitfalls of movement analyses. Mov. Ecol. 2023, 11, 17. [Google Scholar] [CrossRef] [PubMed]
  58. Braun, C.D.; Arostegui, M.C.; Thorrold, S.R.; Papastamatiou, Y.P.; Gaube, P.; Fontes, J.; Afonso, P. The functional and ecological significance of deep diving by large marine predators. Annu. Rev. Mar. Sci. 2022, 14, 129–159. [Google Scholar] [CrossRef] [PubMed]
  59. Vedor, M.; Mucientes, G.; Hernández-Chan, S.; Rosa, R.; Humphries, N.; Sims, D.W.; Queiroz, N. Oceanic diel vertical movement patterns of blue sharks vary with water temperature and productivity to change vulnerability to fishing. Front. Mar. Sci. 2021, 8, 688076. [Google Scholar] [CrossRef]
  60. Hounslow, J.L.; Fossette, S.; Byrnes, E.E.; Whiting, S.D.; Lambourne, R.N.; Armstrong, N.J.; Tucker, A.D.; Richardson, A.R.; Gleiss, A.C. Multivariate analysis of biologging data reveals the environmental determinants of diving behaviour in a marine reptile. R. Soc. Open Sci. 2022, 9, 211860. [Google Scholar] [CrossRef]
  61. Couturier, L.I.; Rohner, C.A.; Richardson, A.J.; Marshall, A.D.; Jaine, F.R.; Bennett, M.B.; Townsend, K.A.; Weeks, S.J.; Nichols, P.D. Stable isotope and signature fatty acid analyses suggest reef manta rays feed on demersal zooplankton. PLoS ONE 2013, 8, e77152. [Google Scholar] [CrossRef]
  62. Burgess, K.B.; Couturier, L.I.; Marshall, A.D.; Richardson, A.J.; Weeks, S.J.; Bennett, M.B. Manta birostris, predator of the deep? Insight into the diet of the giant manta ray through stable isotope analysis. R. Soc. Open Sci. 2016, 3, e160717. [Google Scholar] [CrossRef]
  63. Stewart, J.D.; Hoyos-Padilla, E.M.; Kumli, K.R.; Rubin, R.D. Deep-water feeding and behavioral plasticity in Manta birostris revealed by archival tags and submersible observations. Zoology 2016, 119, 406–413. [Google Scholar] [CrossRef]
  64. Klöcker, C.A.; Bjelland, O.; Ferter, K.; Arostegui, M.C.; Braun, C.D.; da Costa, I.; Cidade, T.; Queiroz, N.; Sims, D.W.; Junge, C. Basking sharks of the Arctic Circle: Year-long, high-resolution tracking data reveal wide thermal range and prey-driven vertical movements across habitats. Anim. Biotelemetry 2025, 13, 15. [Google Scholar] [CrossRef]
  65. Siders, Z.A.; Westgate, A.J.; Bell, K.R.; Koopman, H.N. Highly variable basking shark (Cetorhinus maximus) diving behavior in the lower Bay of Fundy, Canada. Front. Mar. Sci. 2022, 9, 976857. [Google Scholar] [CrossRef]
  66. Arrowsmith, L.M.; Sequeira, A.M.M.; Pattiaratchi, C.B.; Meekan, M.G. Water temperature is a key driver of horizontal and vertical movements of an ocean giant, the whale shark Rhincodon typus. Mar. Ecol. Prog. Ser. 2021, 679, 101–114. [Google Scholar] [CrossRef]
  67. Armstrong, A.O.; Armstrong, A.J.; Jaine, F.R.; Couturier, L.I.; Fiora, K.; Uribe-Palomino, J.; Weeks, S.J.; Townsend, K.A.; Bennett, M.B.; Richardson, A.J. Prey density threshold and tidal influence on reef manta ray foraging at an aggregation site on the Great Barrier Reef. PLoS ONE 2016, 11, e0153393. [Google Scholar] [CrossRef] [PubMed]
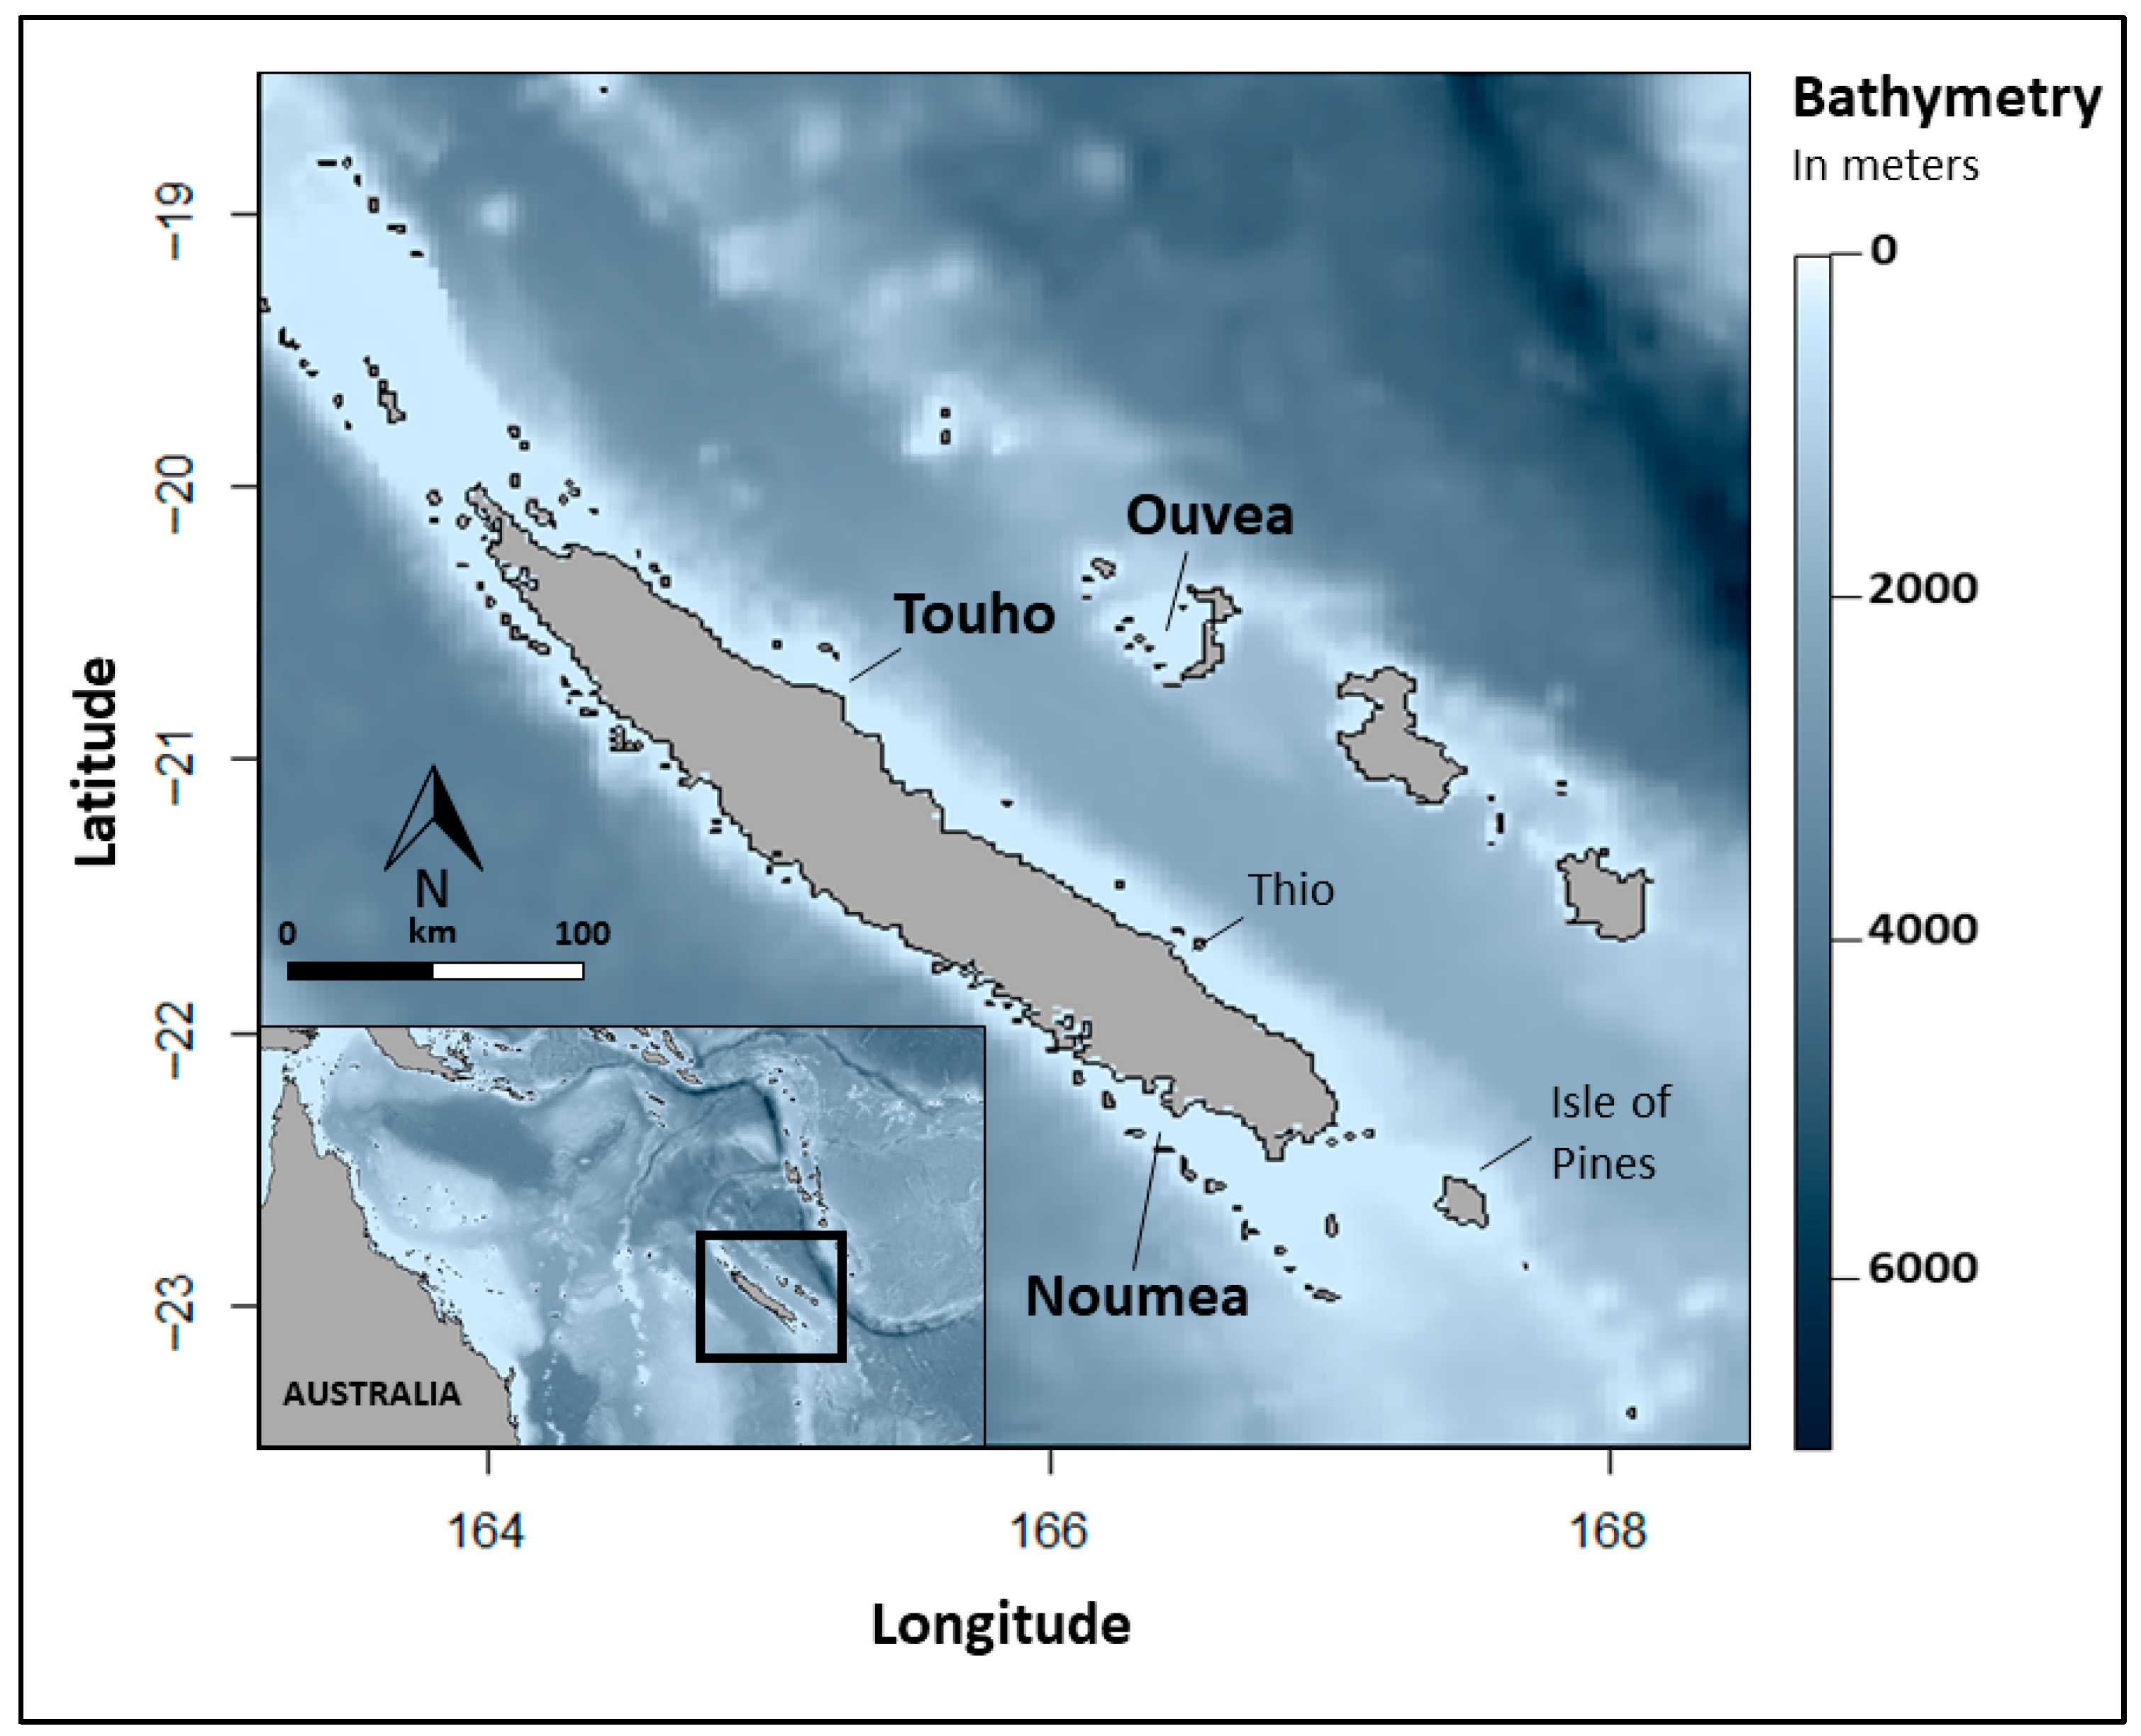
Figure 1. Locations of the deployment of pop-up satellite tags (SPLASH10 and MiniPAT) on reef manta rays (Mobula alfredi) in New Caledonia, South Pacific. Study sites (in bold): Noumea (n = 6), Ouvea (n = 5) and Touho (n = 8).
Fishes 10 00545 g001
Figure 2. Diel distribution of the time spent at maximum depth, among depth ranges, by reef manta rays (Mobula alfredi) (n = 19) recorded using pop-up satellite tags (SPLASH10 and MiniPAT) in New Caledonia. * indicates significantly higher average.
Fishes 10 00545 g002
Figure 3. Dive profile of reef manta rays (Mobula alfredi) recorded using pop-up satellite tags (SPLASH10 and MiniPAT) in New Caledonia. SST indicates Sea Surface Temperature. A and B are the deepest dives.
Fishes 10 00545 g003aFishes 10 00545 g003b
Figure 4. Frequency distribution of vertical speed during ascent and descent of reef manta rays (Mobula alfredi) (n = 3) recorded using pop-up satellite tags (SPLASH10 and MiniPAT) in New Caledonia.
Fishes 10 00545 g004
Figure 5. Distribution of the dive shapes per depth range, recorded for reef manta rays (Mobula alfredi) (n = 3) using pop-up satellite tags (SPLASH10 and MiniPAT) in New Caledonia. * indicates significative difference between shape categories.
Fishes 10 00545 g005
Figure 6. Average dive profile (n = 2869) performed by reef manta rays (Mobula alfredi) (n = 3) recorded from pop-up satellite tags (SPLASH10 and MiniPAT) in New Caledonia. Grey area indicates standard deviation.
Fishes 10 00545 g006
Figure 7. Diel distribution of shapes of dives (n = 2869) performed by reef manta rays (Mobula alfredi) (n = 3) recorded from pop-up satellite tags (SPLASH10 and MiniPAT) in New Caledonia. * indicates significant difference between day and night (p < 0.01).
Fishes 10 00545 g007
Figure 8. Median swimming depth across the 24 h period (10 min average), for all reef manta rays (Mobula alfredi) combined (n = 3), recorded from pop-up satellite tags (SPLASH10 and MiniPAT) in New Caledonia. Dark grey background indicates nighttime.
Fishes 10 00545 g008
Disclaimer/Publisher’s Note: The statements, opinions and data contained in all publications are solely those of the individual author(s) and contributor(s) and not of MDPI and/or the editor(s). MDPI and/or the editor(s) disclaim responsibility for any injury to people or property resulting from any ideas, methods, instructions or products referred to in the content.