Article

Metabolic Responses and Oxidative Stress Adaptation Mechanisms of the Pituitary Gland in the Tiger Puffer Under Low-Temperature Stress

1
Key Laboratory of Applied Biology and Aquaculture of Northern Fishes in Liaoning Province, Dalian Ocean University, Dalian 116023, China
2
College of Fisheries and Life Science, Dalian Ocean University, Dalian 116023, China
3
Faculty of Animal Science and Technology, Yunnan Agricultural University, Kunming 650000, China
*
Author to whom correspondence should be addressed.
Fishes 2025, 10(11), 572; https://doi.org/10.3390/fishes10110572
Submission received: 26 September 2025 / Revised: 3 November 2025 / Accepted: 4 November 2025 / Published: 7 November 2025
(This article belongs to the Special Issue Environmental Physiology of Aquatic Animals)

Abstract

To explore the induction of low temperature the Tiger Puffer (Takifugu rubripes) In this study, the influence of temperature on the pituitary gland during masculinization was investigated through chronic hypothermia stress experiments. Metabolomics was used to analyze the metabolic regulatory network of the pituitary gland under hypothermia stress. ELISA technology was employed to determine the activity content of oxidative stress-related enzymes in the pituitary gland. Further, TUNEL fluorescence labeling and qPCR were used to detect the apoptosis level of pituitary cells. Finally, to assess the impact of low-temperature stress on muscle tissue, HE staining and qPCR techniques were employed. The results showed that after 45 days of low-temperature stress, the differential metabolites of the pituitary gland were mainly enriched in the amino acid metabolic signaling pathway, and the contents of amino acids such as GSH and its synthetic precursors in the pituitary tissue changed significantly. The contents of oxidative stress indicators such as ROS and MDA all showed a trend of first increasing and then decreasing. The qPCR results of TUNEL fluorescence labeling and apoptosis-related genes were consistent, indicating that the apoptotic level of pituitary cells first increased and then decreased with the stress process. Histological analysis revealed that low temperature led to muscle cell atrophy and increased interstitial space in muscle tissue. The expression changes in genes related to muscle development further confirmed that low temperature significantly inhibited muscle growth and development. Therefore, this study speculates that after being subjected to chronic low-temperature stress, the pituitary gland of the red-finned Oriental pufferfish can alleviate the oxidative stress response of the body by strengthening the amino acid metabolic pathway, and the fish body has shown a physiological trend of gradually adapting to low-temperature stress, but the growth and development of muscles are still significantly inhibited. The results of this study can provide theoretical support for understanding the physiological adaptation mechanism of the red-finned Oriental pufferfish to low-temperature stress and lay a foundation for subsequent in-depth exploration of the pituitary response mechanism to low temperatures.
Key Contribution: This study represents the first instance of identifying trends and enrichment patterns of differential metabolites in the pituitary gland through metabolomic analysis. It also marks the inaugural revelation of the dynamic defense mechanisms employed by the pituitary gland of the Tiger Puffer when confronting oxidative damage and apoptosis during chronic cold stress. Furthermore, it uncovers the dynamic equilibrium mechanism between oxidative stress and antioxidant responses within the pituitary gland, which sustains the fish’s survival. It further establishes the association between pituitary damage under cold stress and subsequent morphological alterations in downstream target organ muscle tissues, alongside impaired growth and development.

1. Introduction

As ectothermic animals, fish exhibit geographical distribution and survival adaptability determined by water temperature [1,2,3,4]. Low temperatures exert multifaceted adverse effects on fish by impacting enzyme activity [5,6], metabolic rates [7,8,9], and signal transduction pathways [10,11,12]. Against the backdrop of global climate change, frequent extreme cold events pose a severe threat to aquaculture.
Research indicates that low temperatures can induce oxidative stress in organisms [13], whereby reactive oxygen species (ROS) production exceeds antioxidant scavenging capacity [14], leading to oxidative damage of lipids [15], proteins, and nucleic acids [16]. This phenomenon has been documented in numerous fish species. Both the liver of the spotted seabass (Lateolabrax maculatus) [17] and the gills of the tiger barb (Puntius tetrazona) [18] exhibited oxidative stress responses under acute cold stress. Persistent ROS accumulation also activates the apoptosis pathway. In juvenile hybrid sturgeon (Acipenser baerii ♀ × A. schrenkii ♂) [19] and Nile tilapia (Oreochromis niloticus) [20], acute cold exposure induces alterations in mitochondrial membrane permeability and the expression of apoptotic genes such as Bax and Caspase-3 [21], thereby leading to programmed cell death [22]. Although numerous studies have elucidated the effects of acute thermal stress on fish immune organs, the potential link between endocrine dysfunction in the pituitary gland under chronic cold stress and immune system abnormalities in fish remains understudied.
In the endocrine regulation of fish, the GH-IGF-1 axis constitutes the core growth regulatory pathway [23,24,25]. Muscle tissue, as the key target organ regulated by this axis [26], directly influences fish growth and aquaculture productivity. Environmental temperature fluctuations exert a significant impact on muscle development: High temperatures can cause muscle atrophy in black cusk-eel (Genypterus maculatus) [27], whilst cold stress induces apoptosis in the muscle tissue of silver pomfret (Pampus argenteus) [28]. However, the molecular mechanisms by which the GH-IGF-1 axis regulates muscle growth under thermal stress remain unclear and warrant further investigation.
Tiger Puffer (Takifugu rubripes) as a significant marine commercial fish species in China’s Yellow Sea, Bohai Sea, and East China Sea [29,30], exhibits little difference in growth rates between males and females. However, mature male specimens possess superior flesh quality and command higher prices for their testes, rendering all-male farming operations more economically advantageous [31]. Based on the aforementioned characteristics, our research group previously discovered that cold treatment can induce sex reversal in female Tiger Puffer [32], thereby enhancing the economic efficiency of aquaculture. However, the chronic cold stress accompanying this process may suppress pituitary hormone secretion, restrict fish growth and development, and cause persistent damage to fish health. This severely constrains the development of the all-male Tiger Puffer aquaculture industry. Therefore, this study employs metabolomics to decipher the metabolic regulatory network within the pituitary gland of the Tiger Puffer under cold stress. By identifying key metabolites and enriched pathways, it delves into the interplay mechanisms between oxidative stress, apoptosis, and metabolic dysregulation. It analyses the potential effects of cold stress on the pituitary gland of the Tiger Puffer, providing a theoretical foundation for studying the cold response mechanisms of this species’ pituitary gland. Furthermore, it offers theoretical guidance for optimizing cold-induced masculinization techniques in the Tiger Puffer.

2. Materials and Methods

2.1. Management and Cultivation of Experimental Fish

We selected healthy tiger pufferfish (5.57 ± 0.41 g) with robust swimming ability and intact, undamaged skin as experimental subjects, procured from the Tian Zheng Fisheries Base in Tangshan, Hebei, China. They were temporarily housed in six cold-water recirculation systems at the key laboratory of applied biology and aquaculture of fish (Dalian, China) at Dalian Ocean University. Each recirculation system comprised three tanks, each holding 200 L, with 30 experimental fish per tank. Feeding occurred five times daily, with water temperature maintained at 23 ± 0.5 °C. Half of the aquaculture water volume was replaced daily.

2.2. Experimental Design and Sample Collection

Following the methodology employed in previous studies [32], a recirculating water-cooling system was utilized to induce low-temperature stress. The experimental group underwent uniform cooling at a rate of 2 °C per day, reaching 13 °C after five days to commence the low-temperature stress protocol. The control group maintained a constant temperature of 23 °C, with water temperature measurements taken daily following feeding. On days 0, 15, 30, and 45 post-stress initiation, 30 fish were randomly selected from each treatment group. Following anesthesia with MS-222 (0.1 g/L), rapid dissection yielded pituitary and muscle tissues. During experimental sampling, four fish were randomly selected from each tank for metabolomics analysis (n = 12). Concurrently, pituitary and muscle tissues were collected from three randomly selected fish per tank for enzyme activity assays and qPCR experiments (n = 9). Additionally, muscle and pituitary tissues from three randomly selected fish per tank were immersed in 4% paraformaldehyde solution, followed by hematoxylin and eosin (H&E) staining and TUNEL apoptosis staining of pituitary tissues, respectively (n = 3).

2.3. Metabolite Extraction

Take 100 mg of pituitary tissue and grind thoroughly using liquid nitrogen. After vortex homogenization, place the homogenized material in a pre-chilled solution comprising 80% methanol and 0.1% formic acid. Incubate on ice for 5 min, then centrifuge at 15,000× g for 20 min at 4 °C. Dilute the supernatant with LC-MS grade water to a final concentration of 53% methanol. Transfer the sample to a clean Eppendorf tube and centrifuge at 15,000× g for 20 min at 4 °C. Finally, inject the supernatant into the LC-MS/MS system for analysis. The peak area of all metabolites in each sample was divided by its total peak area to correct for overall response variations between samples. Subsequent analyses were conducted on the normalized data.

2.4. Metabolomics Data Analysis

These metabolites were annotated (https://www.genome.jp/kegg/pathway.html, accessed on 10 May 2025) using the HMDB database (https://hmdb.ca/metabolites, accessed on 10 May 2025) and LIPID Maps database (http://www.lipidmaps.org/, accessed on 10 May 2025). Principal components analysis and least squares discriminant analysis (PLS the KEGG database (PCA) and Partial DA) were performed at metaX 6.0 (a flexible and comprehensive software for processing metabolomics data). We applied univariate analysis (t-test) to calculate the statistical significance (p-value). The metabolites with VIP > 1 and p-value < 0.05 and fold change ≥ 2 or FC ≤ 0.5 were considered to be differential metabolites. Volcano plots were used to filter metabolites of interest, which were based on log2 (Fold Change) and log10 (p-value) of metabolites by ggplot2 in R language. The logarithmic of fold change was greater than 2 and the false discovery rate (FDR) should be less than 0.05. For clustering heat maps, the data were normalized using z-scores of the intensity areas of differential metabolites and were plotted by Pheatmap package in R language. The correlation between differential metabolites were analyzed by cor () in R language 4.1.3.(method = pearson). Statistically significant of correlation between differential metabolites were calculated by cor.mtest() in R language. p-value < 0.05 was considered as statistically significant and correlation plots were plotted by the corrplot package in R language. The functions of these metabolites and metabolic pathways were studied using the KEGG database. The metabolic pathways enrichment of differential metabolites was performed; when ratios were satisfied by x/n > y/N, the metabolic pathway was considered as enrichment, when the p-value of the metabolic pathway was <0.05, the metabolic pathway was considered as a statistically significant enrichment. Gene Ontology (GO) and Kyoto Encyclopedia of Genes and Genomes (KEGG) pathway enrichment analyses were carried out using the Shanghai Lingen Cloud Platform (http://delivery.biozeron.com/).

2.5. Detection of Apoptosis by the TUNEL Assay

Pituitary tissue from Tiger Puffers was fixed in 4% paraformaldehyde, dehydrated three times with anhydrous ethanol for 2 h each, followed by paraffin embedding and sectioning. The resulting tissue sections were stained using a TUNEL apoptosis detection kit and DAPI staining solution. Stained samples were examined under a Leica DM2000 fluorescence microscope (Shanghai Shanhan Optoelectronics Technology Co., Ltd., Shanghai, China): normal nuclei exhibited blue fluorescence, whilst apoptotic nuclei displayed red fluorescence. The apoptosis index was calculated using ImageJ 1.1.4 software according to the formula: Apoptosis Index (%) = (Number of apoptotic cells/Total number of cells) × 100%. (n = 3, Microscope magnification: 40×, scale = 100 μm).

2.6. Assay of Oxidative Stress-Related Enzyme Activity

A total of 50 mg of pituitary tissue from Tiger Puffer was homogenized in 450 μL of ice-cold physiological saline (0.9% NaCl). The homogenate was centrifuged, and the supernatant was collected. The protein concentration of the sample was determined using the Coomassie Brilliant Blue method (No. A045-2-2, Nanjing Jian Cheng Bioengineering Institute Nanjing China). All enzyme activity measurements were normalized using tissue protein concentration. The relevant commercial kits and their respective catalogue numbers are listed in the table below (Table 1).

2.7. Muscle Histology Observations

Muscle tissue was dehydrated and fixed in ethanol, embedded in paraffin, and sectioned consecutively at a thickness of 5–7 µm. Tissues were stained with hematoxylin and eosin and mounted with neutral resin. Images were subsequently acquired and examined under a Leica DM 2000 microscope (Leica Microsystems, Shanghai Shanhan Optoelectronics Technology Co., Ltd., Shanghai, China). The relative area of muscle fiber was calculated using ImageJ software according to the following formula: Percentage of Myofiber Area (%) = (Area of muscle fiber/Total field of view area) × 100%. (n = 3, Microscope magnification: 10×, scale = 200 μm).

2.8. Real-Time Quantitative PCR (RT-qPCR) Validation

Diluted Tiger Puffers pituitary RNA to 100 ng/μL and synthesized pituitary cDNA using the Mighty Script First-strand cDNA synthesis Master Mix (BBI, B639252-0100). Primer design was completed using Primer Premier software (version 5.0) for standardization of cycle quantification (C q) values. In each well of a 96-well plate, add 10 μL of 2 × SG Fast qPCR (BBI, B639271-0005), 100 ng cDNA, 0.6 μL each of positive and negative primers (10 μmol), and 7.8 μL double-distilled water without RNA rase to each well of a 96-well plate. Perform 40 cycles of amplification on the cDNA, followed by melting curve analysis.
Quantitative PCR data were processed and analyzed as follows: the Ct values from technical replicates for each biological replicate were averaged and normalized to the β-actin reference gene (ΔCt = Ct target − Ct reference). Relative gene expression was calculated using the 2−ΔΔCt method, with the control group set as the calibrator. All statistical analyses were performed on ΔCt values using one-way ANOVA for group comparisons. Data are presented as mean ± SD/SEM. The experiment was conducted in accordance with the MIQE guidelines to ensure reproducibility. The primer sequences required for the experiment are as follows (Table 2).

2.9. Statistical Analysis

All experimental data in this study are presented as mean ± standard deviation (Mean ± SD). Comparisons between multiple groups were performed using one-way analysis of variance (ANOVA). All statistical analyses were performed using the SPSS 29.0 statistical analysis platform, with experimental figures generated using GraphPad Prism 8.0 software. In the figures, * denotes a significant difference between the low-temperature group and the concurrent control group (p < 0.01); *** indicates an extremely significant difference (p < 0.001).

3. Results

3.1. Metabolomic Analysis of the Effects of Low-Temperature Stress on the Pituitary Gland of the Tiger Puffers

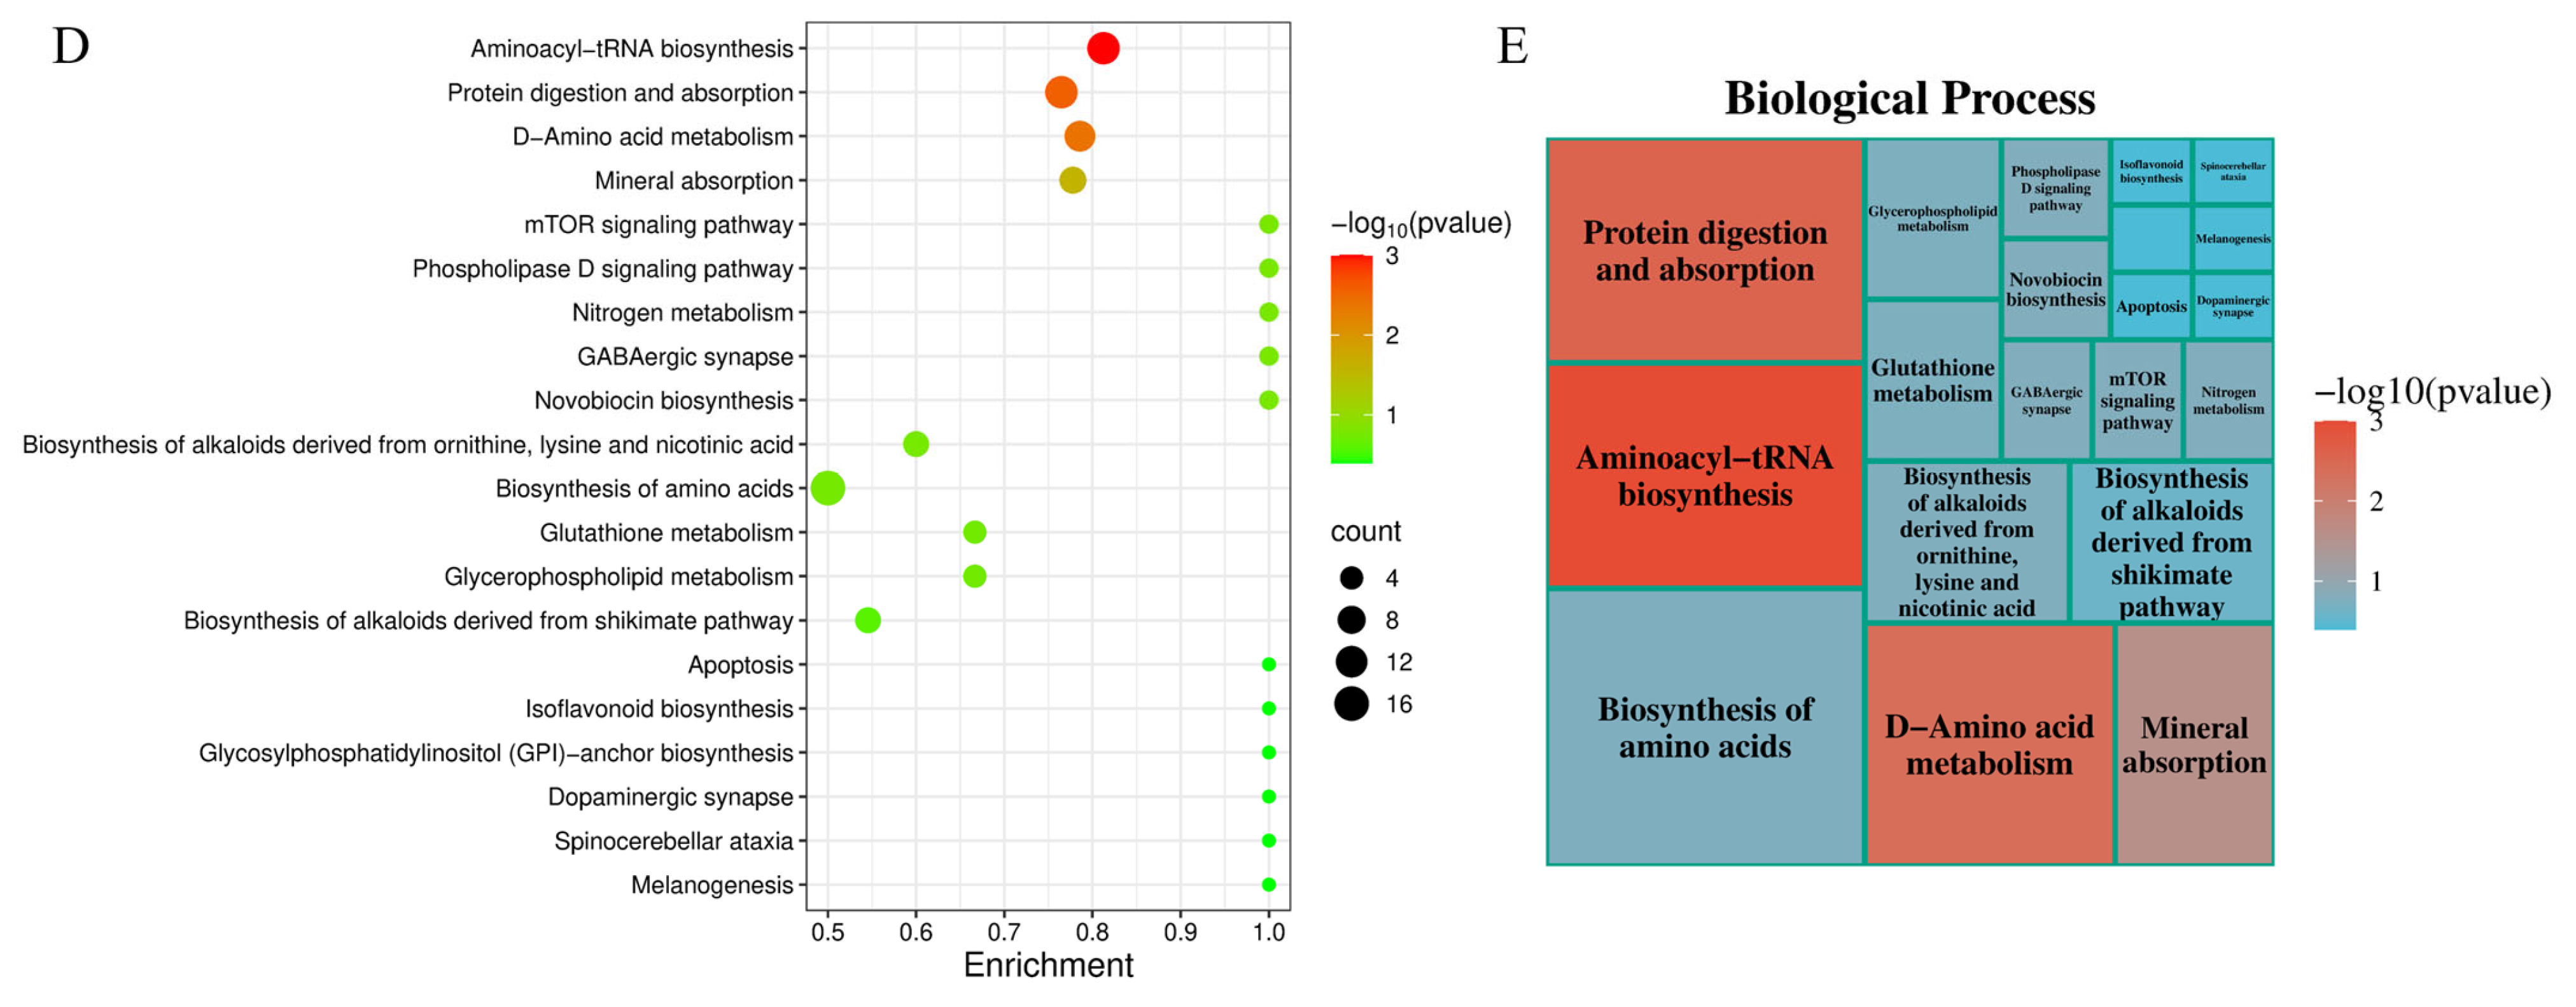
This study employed non-targeted metabolomics to analyze the metabolic expression profiles of eight pituitary samples under low-temperature stress. Three-dimensional principal component analysis (PCA) revealed a distinct separation trend between the low-temperature group and the control group in their metabolic profiles. Principal Component 1 (PC1), Principal Component 2 (PC2), and Principal Component 3 (PC3) explained 30.91%, 21.89%, and 14.07% of the total variance, respectively (Figure 1A). A total of 598 significantly differentially expressed metabolites were identified, comprising 290 upregulated and 308 downregulated metabolites (Figure 1B). Cluster analysis revealed a clear separation between the two groups, indicating significant differences in their metabolites (Figure 1C). KEGG pathway enrichment analysis further revealed that these differential metabolites were predominantly enriched in signaling pathways including amino acid metabolism, GABAergic synapse, glutathione metabolism, and apoptosis (Figure 1D). Subsequent comprehensive analysis of the pathways involving differential metabolites identified 20 key metabolic pathways most strongly correlated with metabolite differences. Among these key pathways, aminoacyl-tRNA exhibited substantial influence and was most significantly enriched (Figure 1E).

3.2. Low-Temperature Stress Induces Oxidative Stress Damage to the Pituitary Gland

As illustrated, low-temperature stress significantly elevated oxidative stress levels in the pituitary glands of red-finned oriental pufferfish. Over the course of stress exposure, ROS content exhibited an overall pattern of initial increase followed by decline. Compared to the 0-day control, ROS levels in the pituitary glands at 15 days, 30 days, and 45 days increased by 1.97-fold, 1.61-fold, and 1.37-fold, respectively (* p < 0.05). The MDA content in the pituitary gland at 15 days was 1.96 times that at 0 days (* p < 0.05) (Figure 2B), subsequently exhibiting a decreasing trend. Following low-temperature stress, the pituitary activated antioxidant mechanisms to counter oxidative stress: GSH content and GSH-PX activity also exhibited an initial increase followed by a decrease over time. At 15 days, GSH content and GSH-PX activity reached their peak levels, being 1.35-fold and 1.85-fold higher than at 0 days, respectively (* p < 0.05) (Figure 2C, D). Total antioxidant capacity, SOD activity, and catalase activity exhibited similar patterns. At 15 days, pituitary CAT activity, SOD activity, and T-AOC levels were 1.58, 1.16, and 1.94-fold higher than at 0 days (* p < 0.05), respectively, before subsequently declining (Figure 2E–D).

3.3. Chronic Hypothermic Stress Induces Apoptosis in Pituitary Cells

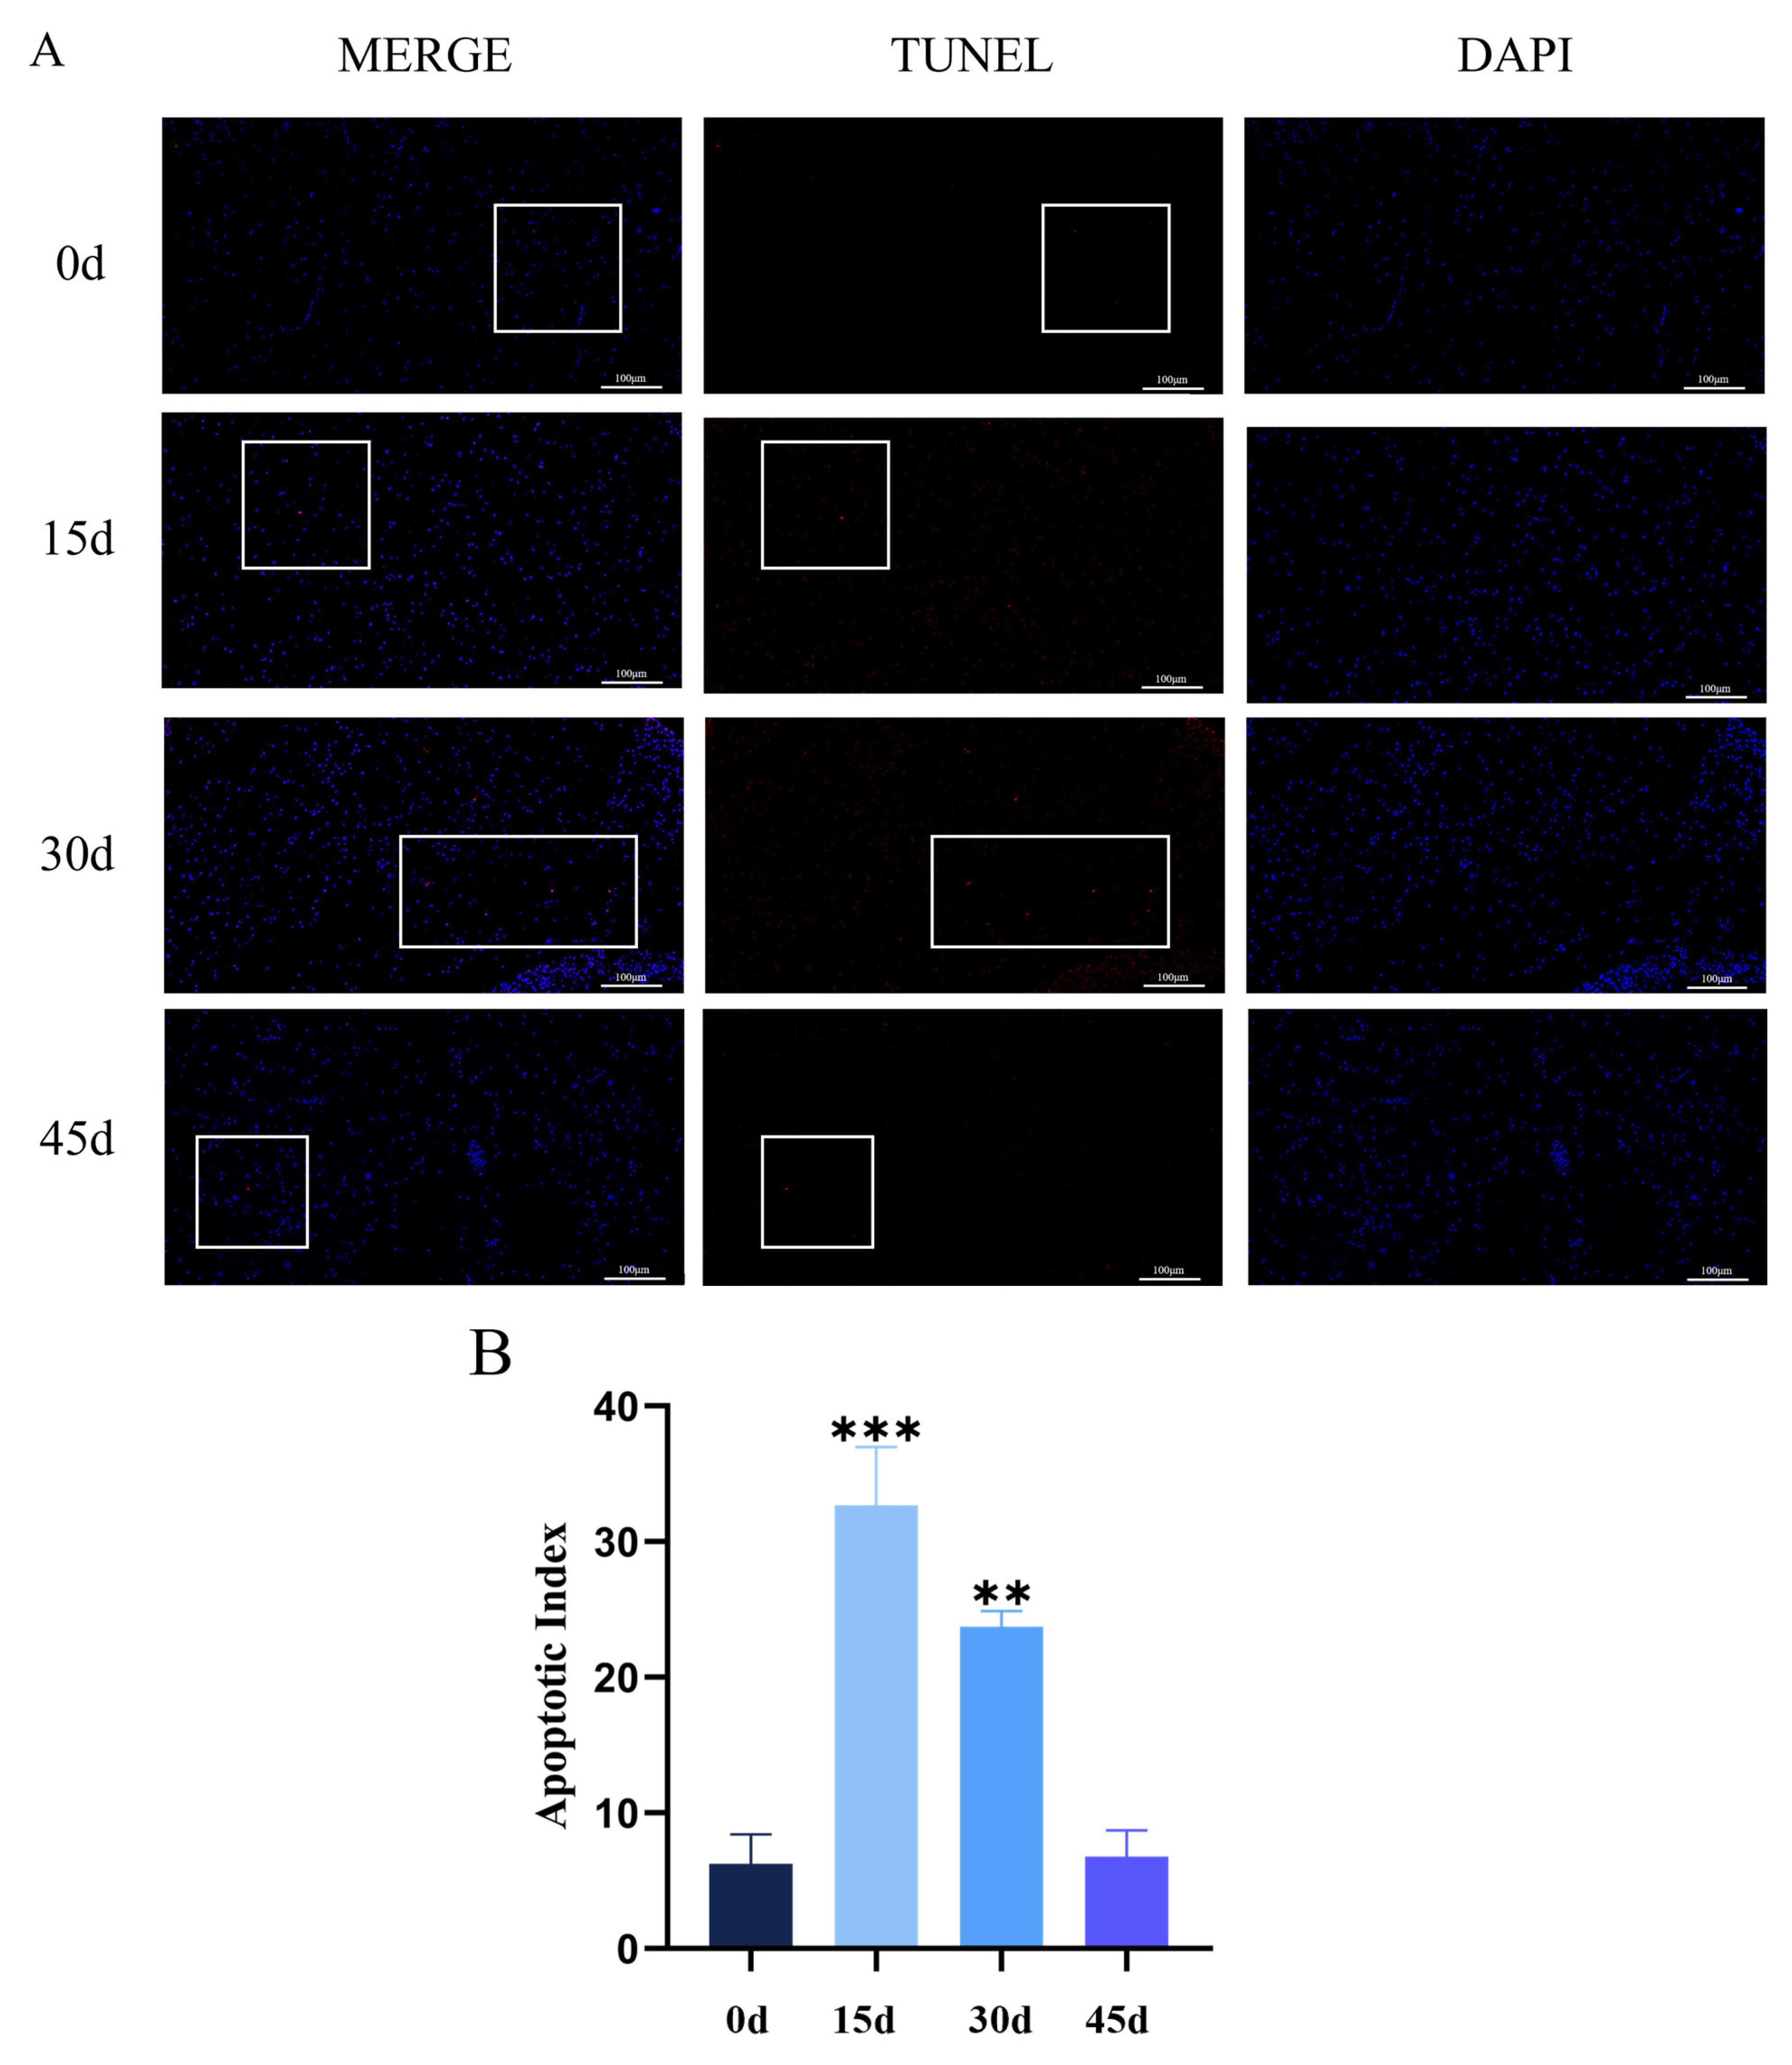
The TUNEL staining results show that: In group 0d, there was only a small amount of red fluorescence. At 15 days, the amount of red fluorescence increased significantly. At 30 days, the amount of red fluorescence decreased somewhat. At 45 days, the amount of red fluorescence continued to decline (Figure 3A). Quantitative analysis indicated that the apoptotic index significantly increased at 15 days and then showed a downward trend (* p < 0.05) (Figure 3B).
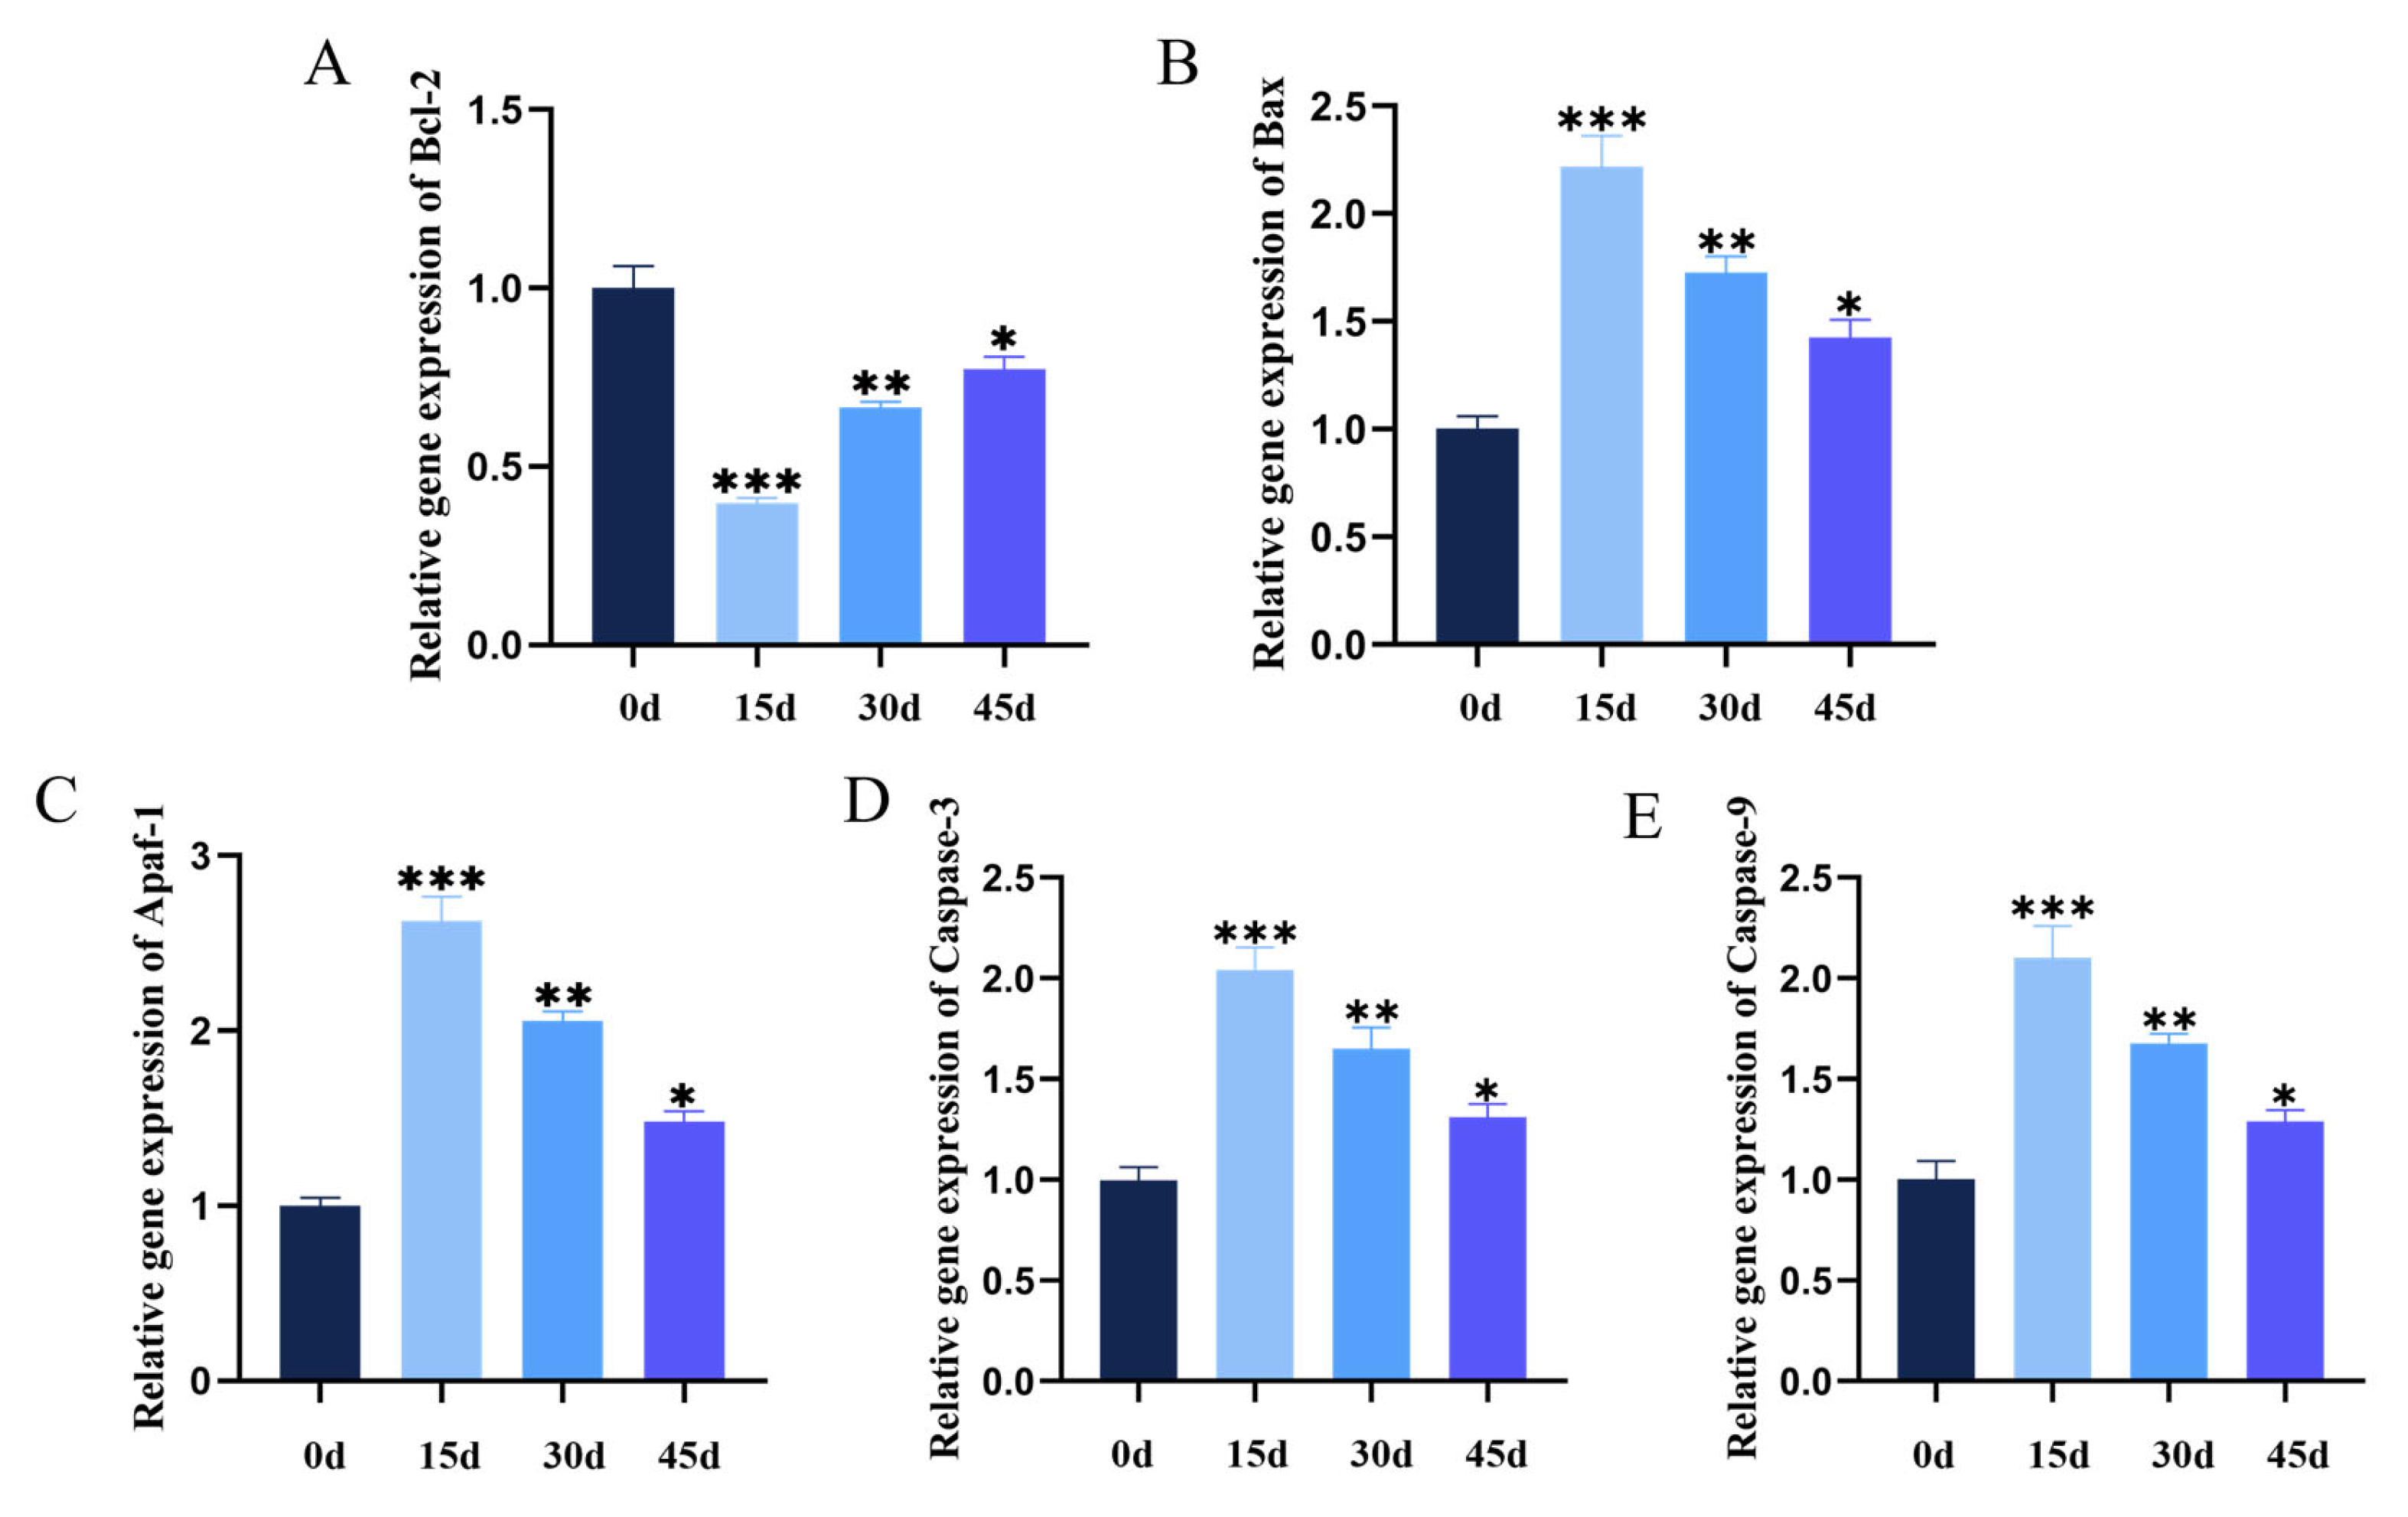
Chronic cold stress significantly activated key genes involved in pituitary cell apoptosis. The expression level of the anti-apoptotic gene Bcl-2 exhibited a trend of initial decrease followed by increase. Compared with day 0, Bcl-2 expression levels in the pituitary at days 15, 30, and 45 decreased by 0.39-fold, 0.67-fold, and 0.77-fold, respectively (* p < 0.05) (Figure 4A). The expression levels of pro-apoptotic genes Bax, Apaf-1, Caspase-3, and Caspase-9 generally exhibited an initial increase followed by a decrease. Compared with day 0, the expression levels of these pro-apoptotic genes at day 15 were up-regulated by 2.22, 2.63, 2.04, and 2.10-fold, respectively (* p < 0.05). Their expression levels subsequently declined progressively over time. By day 45, the expression levels of these pro-apoptotic genes were only 1.43-fold, 1.48-fold, 1.31-fold, and 1.29-fold higher than at day 0 (* p < 0.05) (Figure 4B–E).

3.4. Low Temperatures Significantly Inhibit the Growth and Development of Muscle Tissue

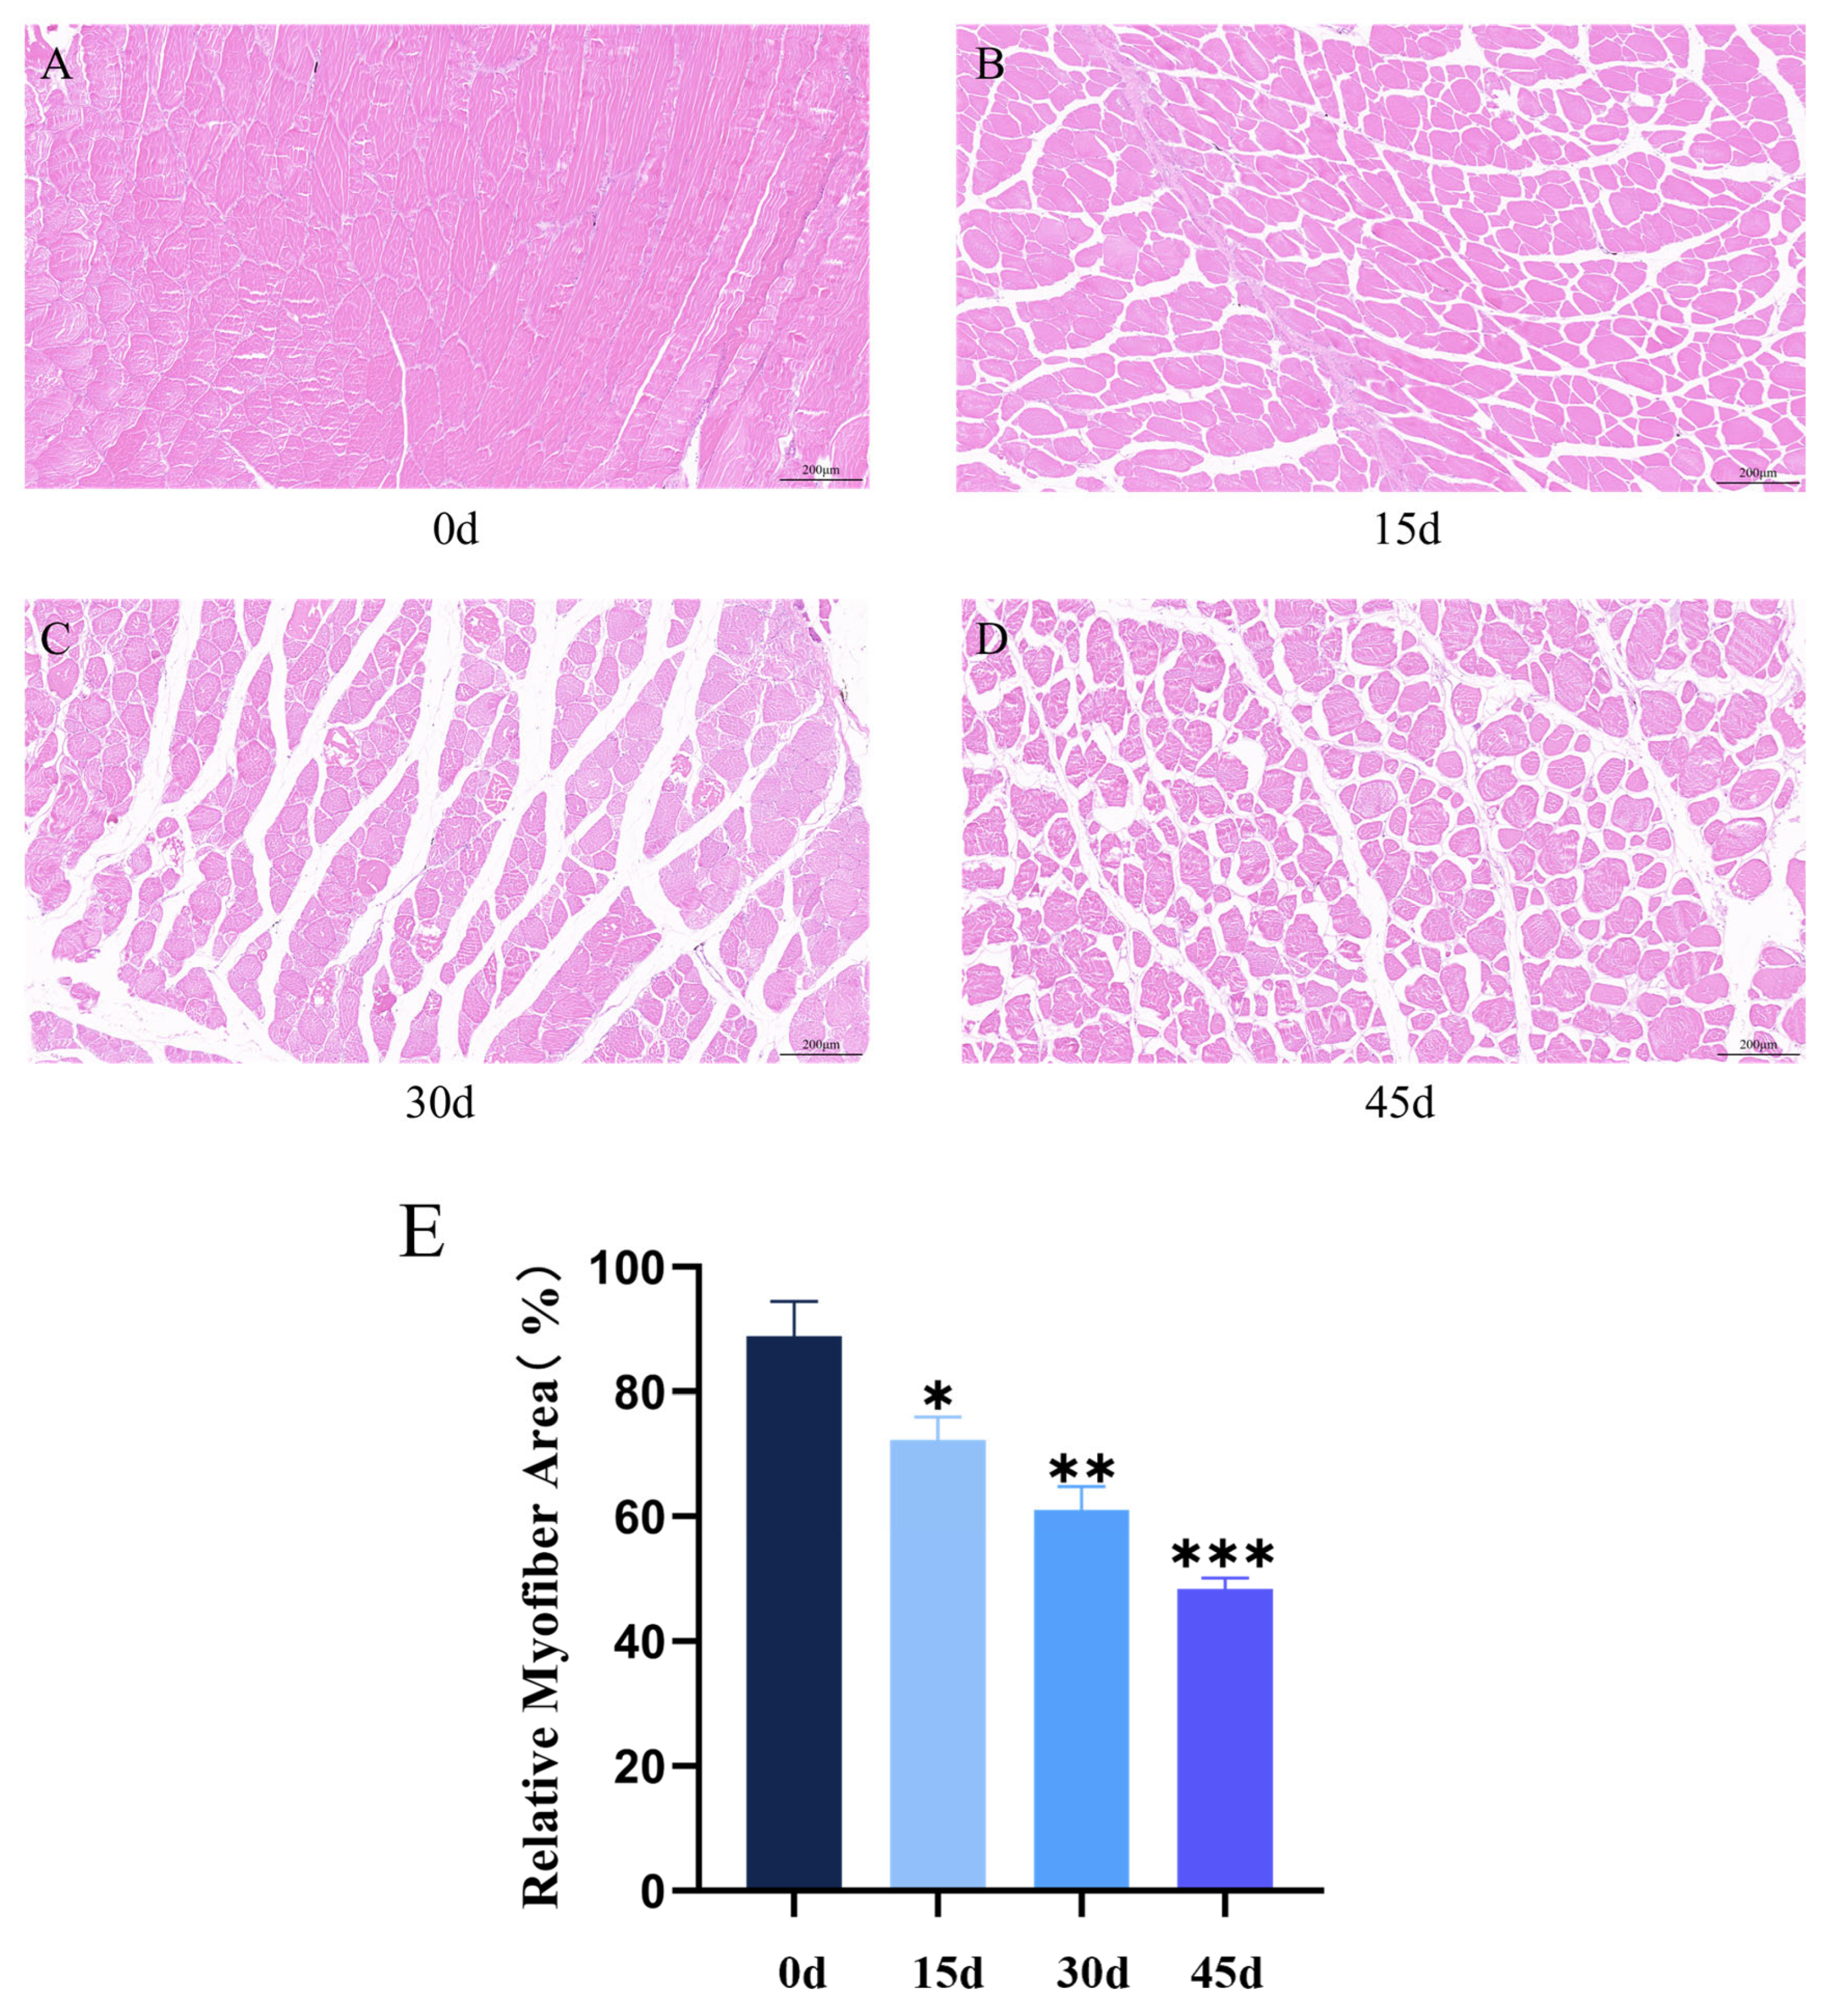
The results of HE staining showed that continuous low-temperature stress led to atrophy of muscle cells, reduction in muscle cell volume, and enlargement of muscle tissue Spaces, significantly affecting the growth of fish bodies (Figure 5A–D). The quantitative results show that the relative area of muscle fibers gradually decreases with the extension of stress time, and after 45 days of stress, it is only 0.54 times that of 0 days (* p < 0.05) (Figure 5E).
Hypothermia-induced pituitary damage markedly reduced the expression levels of genes associated with the GH-IGF-1 axis. As the duration of cold stress prolonged, the expression of Gh1 in the pituitary gland of the Tiger Puffers decreased by 0.80, 0.73, and 0.65-fold at 15d, 30d, and 45d, respectively (* p < 0.05) (Figure 6A). Meanwhile, the expression levels of Ghra, Jak2a, Stat5a, and Igf1 genes in muscle tissue exhibited an overall downward trend, reaching their lowest expression levels at 45 days. At this time point, the expression levels of these muscle growth and development genes were only 0.57, 0.54, 0.49, and 0.62 times (* p < 0.05) those observed at the onset of stress (Figure 6B–E).

4. Discussion

In recent years, market demand has propelled the cultivation of all-male Tiger Puffers broodstock into a research priority [33]. Whilst cold-induced masculinization proves safe and effective, it results in sluggish growth rates that constrain aquaculture development. Consequently, elucidating the endocrine regulatory mechanisms within the pituitary gland under chronic cold stress holds significant theoretical and practical value for understanding fish cold adaptation strategies and optimizing all-male broodstock production.
This study, based on metabolomic analysis, revealed that chronic cold stress induces significant alterations in glutathione and its synthetic precursor gamma-glutamylcysteine, alongside other amino acids, within the pituitary gland of the Tiger Puffers. As a key antioxidant, GSH plays a central regulatory role in maintaining intracellular redox balance through its unique tripeptide structure (glutamic acid–cysteine–glycine) [34]. During the initial 15 days of stress exposure, GSH levels in the pituitary glands of Tiger Puffers increased markedly. This trend aligns with the GSH response patterns observed in the Antarctic fish (Notothenia rossii) [35] and Burbot (Lota Lota) [36] following acute hyperthermic stress, suggesting that chronic hypothermic stress may enhance defense against oxidative damage by activating related amino acid metabolism to promote GSH biosynthesis [37]. However, by day 30 of the stress period, pituitary GSH levels gradually declined, potentially reflecting the fish’s adaptive metabolic adjustments to the cold environment. The above results indicate that GSH and its related amino acids play a key protective role in the oxidative stress process triggered by temperature stress in Tiger Puffers, especially by dynamically regulating antioxidant metabolic capacity in the first 15 days of stress to maintain homeostasis of the body.
This study analyzed the antioxidant response capacity of pituitary tissue in Tiger Puffers subjected to low-temperature stress. Fifteen days prior to stress initiation, malondialdehyde levels in the pituitary gland of Tiger Puffers increased significantly. Concurrently, the activity of antioxidant enzymes such as superoxide dismutase and catalase, along with total antioxidant capacity, markedly enhanced. This indicates the organism activated its antioxidant system to counteract oxidative damage [38,39]. As stress duration extended to 30 days, SOD, CAT activity, and T-AOC all decreased but remained above baseline levels. MDA levels persisted at elevated levels, suggesting a gradual loss of compensatory capacity within the antioxidant system. The continuous accumulation of reactive oxygen species prevented complete resolution of lipid peroxidation damage. After 30 days of stress, MDA levels began to decline, reflecting reduced oxidative stress, though they did not return to normal levels, indicating incomplete adaptation by the organism. Similarly, MDA content increased in the intestines and liver of Dark barbel Catfish (Pelteobagrus vachelli) [40] under acute cold stress, while gill tissues of yellowfin tuna (Thunnus albacares) [41] exhibited comparable trends during cold stress. These findings collectively demonstrate that cold-induced ROS surges universally trigger lipid peroxidation [42,43]. However, the antioxidant enzyme activity in the Tiger Puffers exhibited a dynamic pattern of initial increase followed by decrease under prolonged cold stress, suggesting that the timing of antioxidant regulation and adaptive capacity may exhibit species-specific characteristics. In summary, the antioxidant system of the Tiger Puffers exhibits a characteristic dynamic pattern of compensation-decompensation-partial recovery during cold stress, revealing the complexity and adaptability of its oxidative balance regulation in response to prolonged low-temperature stress.
Excessive ROS produced by low-temperature stress directly damages mitochondrial membrane lipids [44], leading to membrane potential disintegration and opening of permeability transition pores [45,46], and thereby triggering the apoptotic program [47,48,49]. TUNEL staining showed that the apoptotic index of the pituitary gland of the Tiger Puffers significantly increased 15 days before stress. Over time, although the apoptotic index decreased significantly, the abnormal expression of mitochondrial dynamics-related genes revealed the persistence of cell damage. Low-temperature stress significantly upregulated the expression of Bax in the pituitary gland and inhibited the expression of Bcl-2. With the persistence of stress time, although the expression levels of pro-apoptotic genes such as caspase-9, caspase-3, and Bax gradually decreased, they were still higher than the normal level. The above-mentioned molecular responses have also been reported similarly in the stress responses of other fish species. For example, the changing trend of apoptotic gene expression in the blood of the river pufferfish (Takifugu obscurus) [50] under cold stress is consistent with the change in Bax/Bcl-2 ratio in this study. Significant upregulation of apoptotic executive genes such as caspase-3 was also detected in the liver tissue of Pikeperch (Sander lucioperca) [51] under acute heat stress. These consistencies indicate that mitochondrial pathway apoptosis is a common mechanism by which various fish species respond to temperature stress [52,53]. However, compared with the above-mentioned acute stress studies, the Tiger Puffers in this study experienced chronic low-temperature stress. The expression of apoptosis-related genes decreased more slowly, and the apoptotic index remained at a relatively high level in the middle of the stress, reflecting the long-term nature of the injury repair and adaptation process under chronic stress.
The pituitary gland serves as the core of endocrine regulation [54,55], with its structural and functional integrity being paramount for hormone synthesis and secretion [56,57]. This study reveals that chronic cold stress significantly suppresses GH secretion in the pituitary gland of the Tiger Puffers, impeding the binding of GH to its receptor. This disruption hinders the activation of JAK2 kinase in muscle tissue [58,59], subsequently inhibiting downstream processes including STAT5 phosphorylation [60], dimerization, and nuclear translocation. This observation is corroborated by histological examination revealing muscle cell atrophy and enlarged intercellular spaces. Such morphological changes in muscle cells have previously been documented in the Cat-fish (Clarias fuscus) [61] and Atlantic salmon (Salmo salar) [62] under hyperthermic stress. However, unlike previous high-temperature stress studies, this research systematically reveals for the first time in the Tiger Puffers the complete regulatory pathway inhibited under low-temperature conditions. This pathway spans from the initiation of pituitary GH secretion, through JAK2-STAT5 signal transduction [63], to IGF1 synthesis within muscle tissue.

5. Conclusions

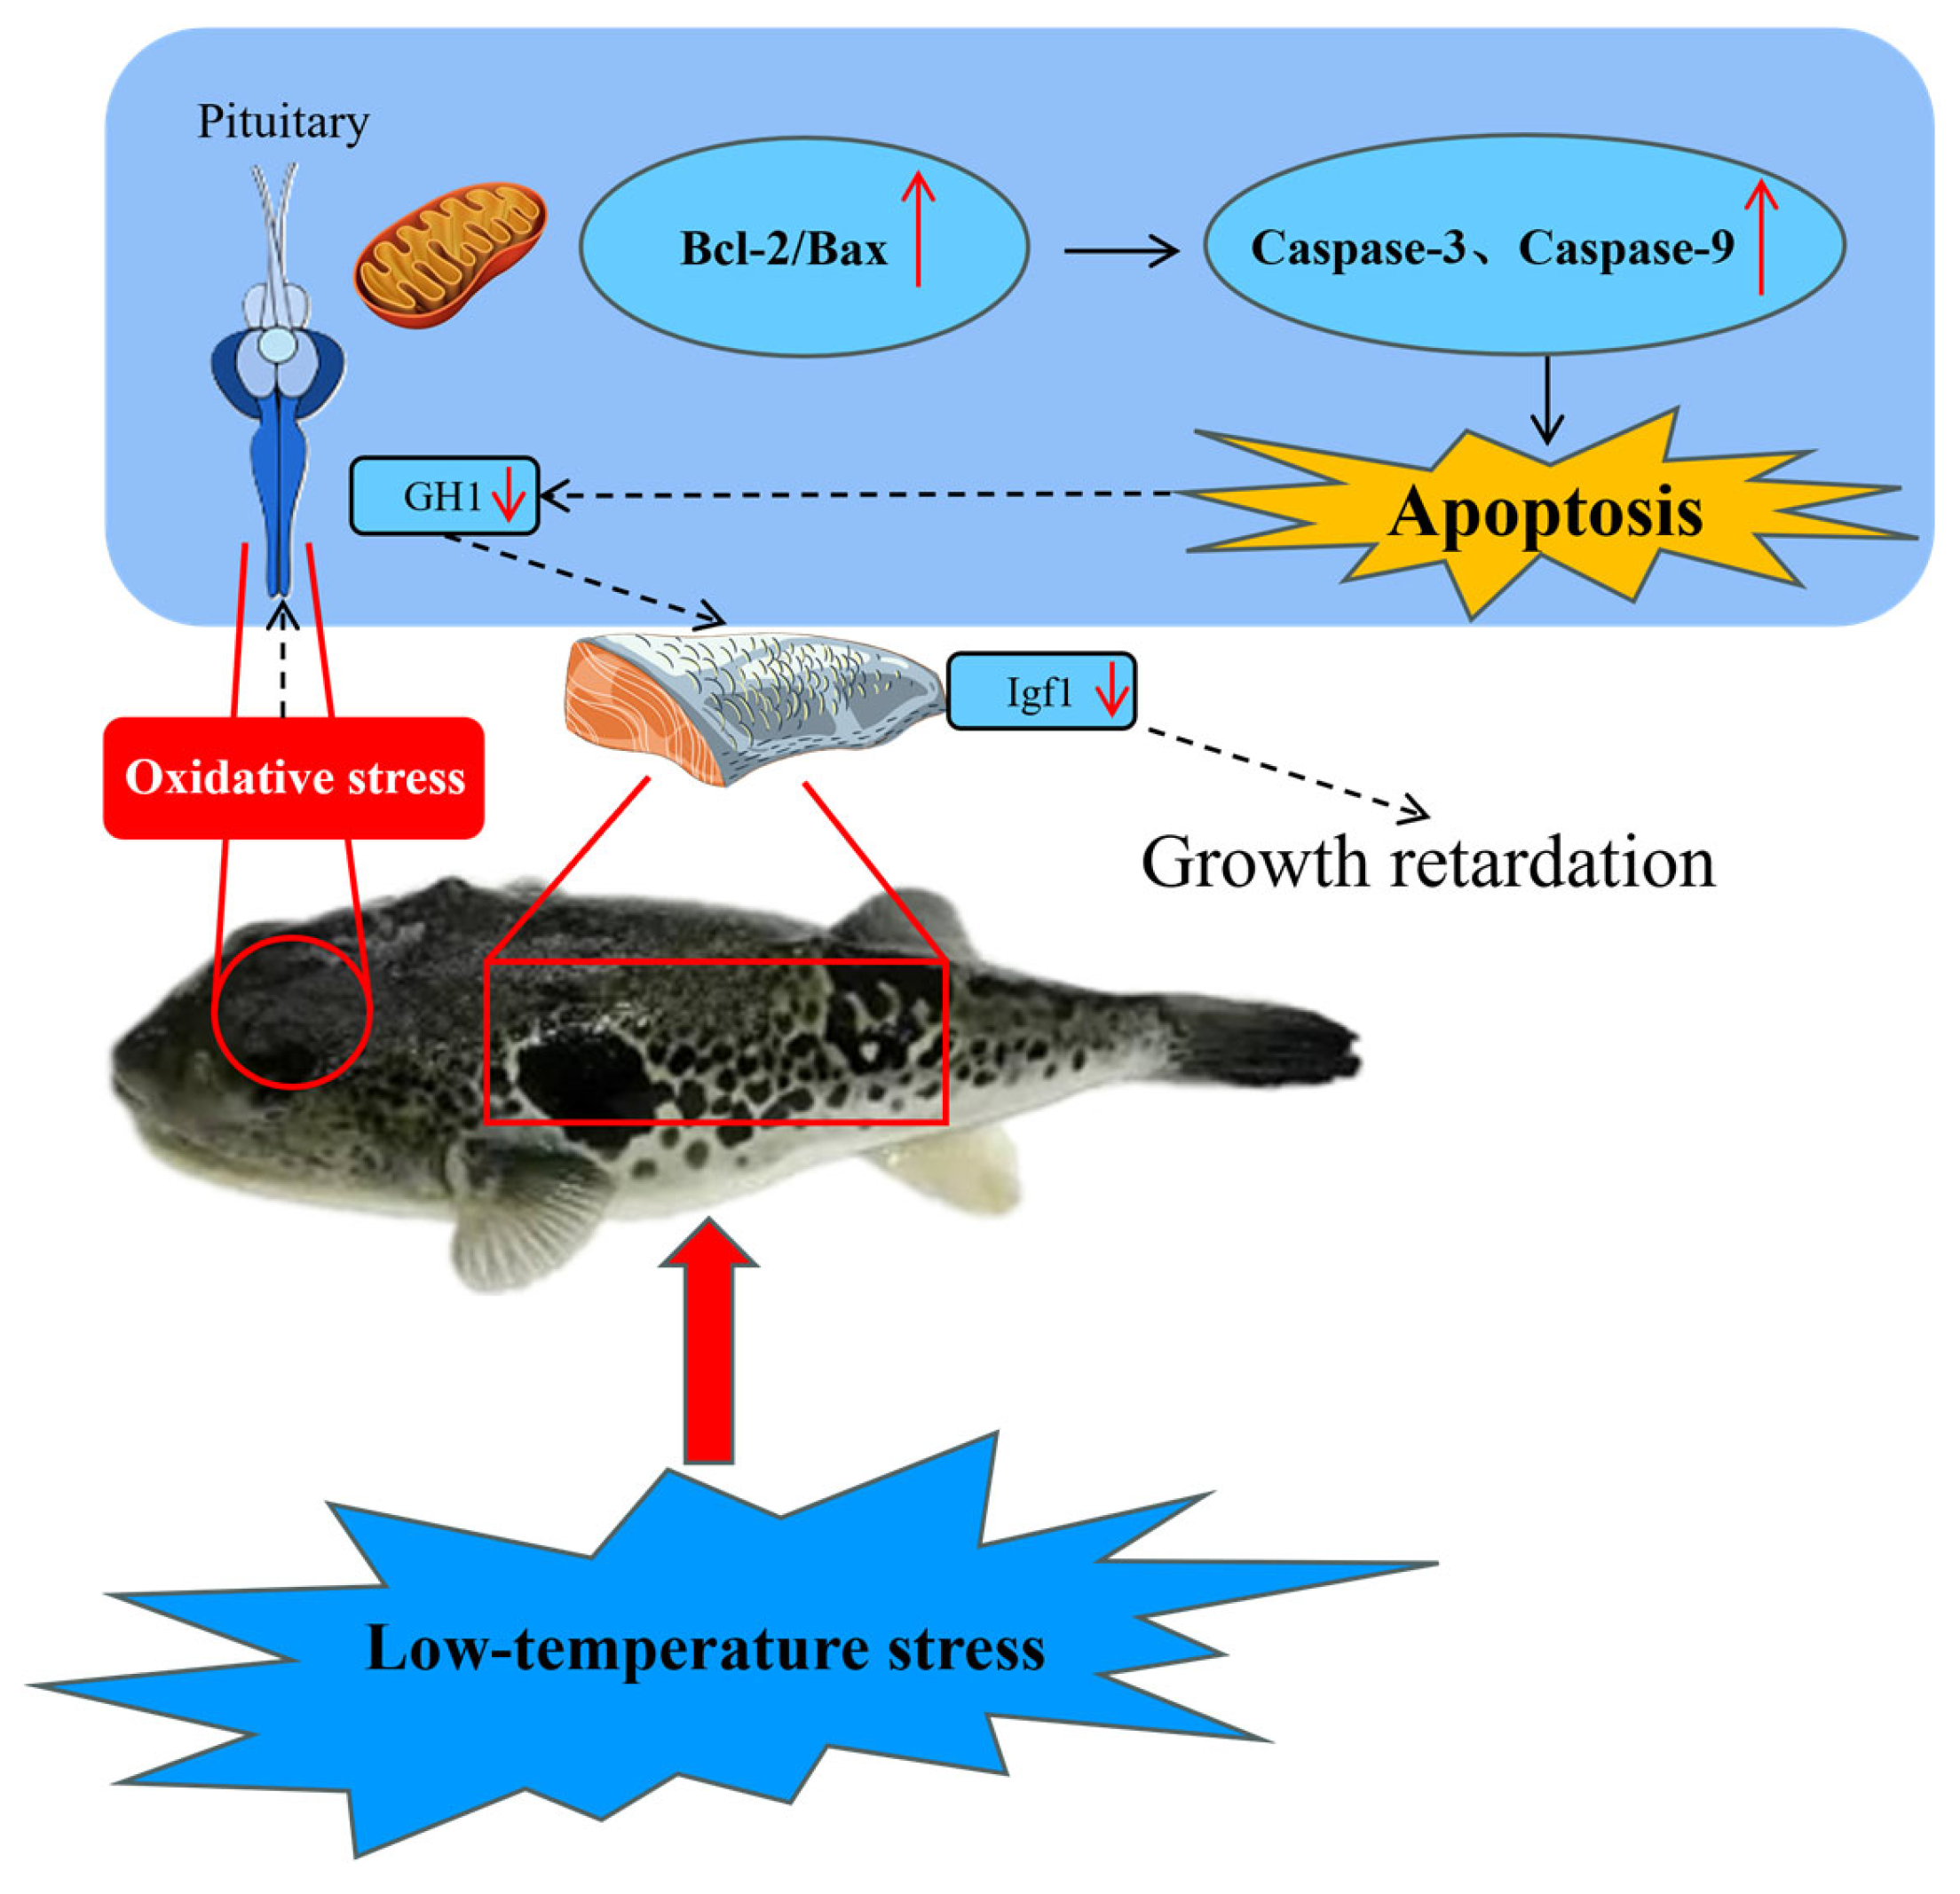
This study revealed that chronic cold stress induced varying degrees of damage to the pituitary and muscle tissues of the Tiger Puffers. Metabolomic analysis revealed significantly increased amino acid metabolic activity in the pituitary gland, indicating a protective role for amino acid metabolism in the fish’s oxidative stress response. Furthermore, antioxidant enzyme activity exhibited a trend of initial increase followed by decline as stress duration prolonged, with pro-apoptotic genes showing a similar pattern. This suggests that the fish were gradually adapting to the effects of cold stress. However, examination of muscle tissue revealed that cold stress-induced muscle atrophy did not improve in the later stages of stress. Genes associated with the JAK-STAT signaling pathway corroborated this observation, indicating that cold stress significantly inhibited muscle growth and development. In summary, this dynamic equilibrium mechanism may reflect the adaptive strategy employed by the Tiger Puffers when confronting low-temperature environments. It provides theoretical foundations and data support for subsequent optimization of breeding and rearing protocols, thereby achieving a balance between aquaculture productivity and fish health (Figure 7).

Author Contributions

Y.L. (Yifan Li): Writing—original draft, Visualization, Software, Investigation, Formal analysis, Data curation. T.L.: Visualization, Software, Investigation, Formal analysis, Data curation. M.Y.: Validation. C.L.: Resources. Z.J.: Methodology, Investigation. H.P.: Methodology, Investigation. W.W.: Writing—review and editing, Validation, Project administration, Methodology. Y.L. (Yajuan Li): Investigation, Conceptualization. H.Z.: Writing—review and editing, Validation, Project administration, Methodology, Investigation, Conceptualization. All authors have read and agreed to the published version of the manuscript.

Funding

This work was supported by the Scientific Research Project of The Major Science and Technology Project of Liaoning Province (2024JH1/11700010); The 2024 Joint Fund Project General Funding Program (2023-MSLH-003); The China Agriculture Research System (CARS-47).

Institutional Review Board Statement

The animal study was reviewed and approved by The Animal Ethics Committee of Dalian Ocean University (Dalian, China) approved all experimental protocols used in this study (Approval Code: DLOU2024015; Approval Date: 9 August 2024). All animal procedures follow the “Guidelines for Ethical Treatment of Experimental Animals” prepared by the Ministry of Science and Technology of China.

Data Availability Statement

Data supporting this study’s findings are available from the corresponding author upon request.

Conflicts of Interest

The authors declare that the research was conducted in the absence of any commercial or financial relationships that could be construed as a potential conflict of interest.

References

  1. Campana, S.E.; Stefánsdóttir, R.B.; Jakobsdóttir, K.; Sólmundsson, J. Shifting fish distributions in warming sub-Arctic oceans. Sci. Rep. 2020, 10, 16448. [Google Scholar] [CrossRef] [PubMed]
  2. Mortensen, A.; Johansen, R.B.; Hansen, Ø.J.; Puvanendran, V. Temperature preference of juvenile lumpfish (Cyclopterus lumpus) originating from the southern and northern parts of Norway. J. Therm. Biol. 2020, 89, 102562. [Google Scholar] [CrossRef] [PubMed]
  3. Arai, T.; Abdul Kadir, S.R. Diversity, distribution and different habitat use among the tropical freshwater eels of genus Anguilla. Sci. Rep. 2017, 7, 7593. [Google Scholar] [CrossRef] [PubMed]
  4. Freitas, C.; Villegas-Ríos, D.; Moland, E.; Olsen, E.M. Sea temperature effects on depth use and habitat selection in a marine fish community. J. Anim. Ecol. 2021, 90, 1787–1800. [Google Scholar] [CrossRef]
  5. Wang, H.; Wang, Y.; Niu, M.; Hu, L.; Chen, L. Cold Acclimation for Enhancing the Cold Tolerance of Zebrafish Cells. Front. Physiol. 2021, 12, 813451. [Google Scholar] [CrossRef]
  6. Guo, Y.; Wei, C.; Ding, H.; Li, P.; Gao, Y.; Zhong, K.; Bao, Z.; Qu, Z.; Wang, B.; Hu, J. Effects of cold stress on the blood-brain barrier in Plectropomus leopardus. BMC Genom. 2024, 25, 1031. [Google Scholar] [CrossRef]
  7. Parisi, M.A.; Franklin, C.E.; Cramp, R.L. Can slowing the rate of water temperature decline be utilized to reduce the impacts of cold water pollution from dam releases on fish physiology and performance? J. Fish Biol. 2022, 100, 979–987. [Google Scholar] [CrossRef]
  8. Ridgway, M.R.; Scott, G.R. Constant temperature and fluctuating temperature have distinct effects on hypoxia tolerance in killifish (Fundulus heteroclitus). J. Exp. Biol. 2023, 226, jeb245425. [Google Scholar] [CrossRef]
  9. Zhang, Z.; Lu, K.; Liang, X.F.; Li, J.; Tang, S.; Zhang, Y.; Cai, W.; Xiao, Q.; Zhang, Q. Effects of early low temperature exposure on the growth, glycolipid metabolism and growth hormone (gh) gene methylation in the late stage of Chinese perch (Siniperca chuatsi). Comp. Biochem. Physiol. B Biochem. Mol. Biol. 2022, 259, 110705. [Google Scholar] [CrossRef]
  10. Zhao, C.; Wang, S.; Liu, Y.; Chu, P.; Han, B.; Ning, X.; Wang, T.; Yin, S. Acute cold stress leads to zebrafish ovarian dysfunction by regulating miRNA and mRNA. Comp. Biochem. Physiol. Part D Genom. Proteom. 2023, 48, 101139. [Google Scholar] [CrossRef]
  11. Cao, Z.; Wang, N.; Liu, X.; Deng, W.; Dong, R.; Jiang, Q. Mechanisms of Low Temperature-induced GH Resistance via TRPA1 Channel Activation in Male Nile Tilapia. Endocrinology 2025, 166, bqaf013. [Google Scholar] [CrossRef]
  12. Ge, G.; Long, Y.; Song, G.; Li, Q.; Cui, Z.; Yan, H. Transcriptomic Profiling Revealed Signaling Pathways Associated with the Spawning of Female Zebrafish under Cold Stress. Int. J. Mol. Sci. 2022, 23, 7494. [Google Scholar] [CrossRef] [PubMed]
  13. Franco, R.; Sánchez-Olea, R.; Reyes-Reyes, E.M.; Panayiotidis, M.I. Environmental toxicity, oxidative stress and apoptosis: Ménage à Trois. Mutat. Res./Genet. Toxicol. Environ. Mutagen. 2009, 674, 3–22. [Google Scholar] [CrossRef] [PubMed]
  14. Ali, S.S.; Marcondes, M.-C.G.; Bajova, H.; Dugan, L.L.; Conti, B. Metabolic Depression and Increased Reactive Oxygen Species Production by Isolated Mitochondria at Moderately Lower Temperatures. J. Biol. Chem. 2010, 285, 32522–32528. [Google Scholar] [CrossRef] [PubMed]
  15. Sánchez-Nuño, S.; Sanahuja, I.; Fernández-Alacid, L.; Ordóñez-Grande, B.; Carbonell, T.; Ibarz, A. Oxidative attack during temperature fluctuation challenge compromises liver protein homeostasis of a temperate fish model. Comp. Biochem. Physiol. B Biochem. Mol. Biol. 2019, 236, 110311. [Google Scholar] [CrossRef]
  16. Fadhlaoui, M.; Couture, P. Combined effects of temperature and metal exposure on the fatty acid composition of cell membranes, antioxidant enzyme activities and lipid peroxidation in yellow perch (Perca flavescens). Aquat. Toxicol. 2016, 180, 45–55. [Google Scholar] [CrossRef]
  17. Wang, Z.; Dong, Z.; Yang, Y.; Wang, J.; Yang, T.; Chen, X.; Liang, L.; Mu, W. Histology, physiology, and glucose and lipid metabolism of Lateolabrax maculatus under low temperature stress. J. Therm. Biol. 2022, 104, 103161. [Google Scholar] [CrossRef]
  18. Liu, L.; Zhang, R.; Wang, X.; Zhu, H.; Tian, Z. Transcriptome analysis reveals molecular mechanisms responsive to acute cold stress in the tropical stenothermal fish tiger barb (Puntius tetrazona). BMC Genom. 2020, 21, 737. [Google Scholar] [CrossRef]
  19. Liu, T.; Li, L.; Yang, Y.; Li, J.; Yang, X.; Li, L.; Zheng, Z.; Yang, B.; Zhang, P.; Liu, H. Effects of chronic cold stress and thermal stress on growth performance, hepatic apoptosis, oxidative stress, immune response and gut microbiota of juvenile hybrid sturgeon (Acipenser baerii ♀ × A. schrenkii ♂). Fish Shellfish Immunol. 2025, 157, 110078. [Google Scholar] [CrossRef]
  20. Zhou, T.; Gui, L.; Liu, M.; Li, W.; Hu, P.; Duarte, D.F.C.; Niu, H.; Chen, L. Transcriptomic responses to low temperature stress in the Nile tilapia, Oreochromis niloticus. Fish Shellfish Immunol. 2019, 84, 1145–1156. [Google Scholar] [CrossRef]
  21. Liu, R.; Liu, R.; Song, G.; Li, Q.; Cui, Z.; Long, Y. Mitochondria Dysfunction and Cell Apoptosis Limit Resistance of Nile Tilapia (Oreochromis niloticus) to Lethal Cold Stress. Animals 2022, 12, 2382. [Google Scholar] [CrossRef] [PubMed]
  22. Wu, S.M.; Liu, J.H.; Shu, L.H.; Chen, C.H. Anti-oxidative responses of zebrafish (Danio rerio) gill, liver and brain tissues upon acute cold shock. Comp. Biochem. Physiol. A Mol. Integr. Physiol. 2015, 187, 202–213. [Google Scholar] [CrossRef] [PubMed]
  23. Canosa, L.F.; Chang, J.P.; Peter, R.E. Neuroendocrine control of growth hormone in fish. Gen. Comp. Endocrinol. 2007, 151, 1–26. [Google Scholar] [CrossRef] [PubMed]
  24. Gahete, M.D.; Durán-Prado, M.; Luque, R.M.; Martínez-Fuentes, A.J.; Quintero, A.; Gutiérrez-Pascual, E.; Córdoba-Chacón, J.; Malagón, M.M.; Gracia-Navarro, F.; Castaño, J.P. Understanding the multifactorial control of growth hormone release by somatotropes: Lessons from comparative endocrinology. Ann. N. Y. Acad. Sci. 2009, 1163, 137–153. [Google Scholar] [CrossRef]
  25. Vélez, E.J.; Unniappan, S. A Comparative Update on the Neuroendocrine Regulation of Growth Hormone in Vertebrates. Front. Endocrinol. 2020, 11, 614981. [Google Scholar] [CrossRef]
  26. Bergan-Roller, H.E.; Sheridan, M.A. The growth hormone signaling system: Insights into coordinating the anabolic and catabolic actions of growth hormone. Gen. Comp. Endocrinol. 2018, 258, 119–133. [Google Scholar] [CrossRef]
  27. Becerra, S.; Arriagada-Solimano, M.; Escobar-Aguirre, S.; Palomino, J.; Aedo, J.; Estrada, J.M.; Barra-Valdebenito, V.; Zuloaga, R.; Valdes, J.A.; Dettleff, P. High temperature induces oxidative damage, immune modulation, and atrophy in the gills and skeletal muscle of the teleost fish black cusk-eel (Genypterus maculatus). Dev. Comp. Immunol. 2025, 164, 105332. [Google Scholar] [CrossRef]
  28. Hu, J.; Zhang, M.; Yan, K.; Zhang, Y.; Li, Y.; Zhu, J.; Wang, G.; Wang, X.; Li, Y.; Huang, X.; et al. Cold Stress Induces Apoptosis in Silver Pomfret via DUSP-JNK Pathway. Mar. Biotechnol. 2023, 25, 846–857. [Google Scholar] [CrossRef]
  29. Peng, H.; Yang, B.; Li, B.; Cai, Z.; Cui, Q.; Chen, M.; Liu, X.; Yang, X.; Jiang, C. Comparative transcriptomic analysis reveals the gene expression profiles in the liver and spleen of Japanese pufferfish (Takifugu rubripes) in response to Vibrio harveyi infection. Fish Shellfish Immunol. 2019, 90, 308–316. [Google Scholar] [CrossRef]
  30. Wu, Y.; Yan, H.; Shen, X.; Jiang, J.; Yuan, Z.; Liu, Q.; Wang, Z.; Bai, L.; Zhang, L.; Song, C.; et al. Effects of different light conditions on growth, muscle nutrients content, and clock gene circadian expression of Takifugu rubripes. Aquac. Rep. 2022, 26, 101294. [Google Scholar] [CrossRef]
  31. Yan, H.; Shen, X.; Jiang, J.; Zhang, L.; Yuan, Z.; Wu, Y.; Liu, Q.; Liu, Y. Gene Expression of Takifugu rubripes Gonads During AI- or MT-induced Masculinization and E2-induced Feminization. Endocrinology 2021, 162, bqab068. [Google Scholar] [CrossRef] [PubMed]
  32. Zhou, H.; Sun, Y.; Li, X.; Zhou, Z.; Ma, K.; Guo, W.; Liang, Y.; Xie, X.; Zhang, J.; Wang, Q.; et al. A Transcriptomic Analysis of Gonads from the Low-Temperature-Induced Masculinization of Takifugu rubripes. Animals 2021, 11, 3419. [Google Scholar] [CrossRef] [PubMed]
  33. Shen, X.; Yan, H.; Hu, M.; Zhou, H.; Zhang, Q.; Gao, R.; Liu, Q.; Sun, Q. A detailed transcriptome study uncovers the epigenetic characteristics associated with Aromatase inhibitor-induced masculinization in Takifugu rubripes larvae gonads. BMC Genom. 2025, 26, 380. [Google Scholar] [CrossRef] [PubMed]
  34. Chen, T.H.; Wang, H.C.; Chang, C.J.; Lee, S.Y. Mitochondrial Glutathione in Cellular Redox Homeostasis and Disease Manifestation. Int. J. Mol. Sci. 2024, 25, 1314. [Google Scholar] [CrossRef]
  35. Guillen, A.C.; Borges, M.E.; Herrerias, T.; Kandalski, P.K.; de Souza, M.; Donatti, L. Gradual increase of temperature trigger metabolic and oxidative responses in plasma and body tissues in the Antarctic fish Notothenia rossii. Fish Physiol. Biochem. 2022, 48, 337–354. [Google Scholar] [CrossRef]
  36. Zhai, C.; Li, Y.; Wang, R.; Han, H.; Zhang, Y.; Ma, B. Combined Impacts of Acute Heat Stress on the Histology, Antioxidant Activity, Immunity, and Intestinal Microbiota of Wild Female Burbot (Lota Lota) in Winter: New Insights into Heat Sensitivity in Extremely Hardy Fish. Antioxidants 2025, 14, 947. [Google Scholar] [CrossRef]
  37. Gould, R.L.; Pazdro, R. Impact of Supplementary Amino Acids, Micronutrients, and Overall Diet on Glutathione Homeostasis. Nutrients 2019, 11, 1056. [Google Scholar] [CrossRef]
  38. Liu, X.; Hussain, R.; Mehmood, K.; Tang, Z.; Zhang, H.; Li, Y. Mitochondrial-Endoplasmic Reticulum Communication-Mediated Oxidative Stress and Autophagy. Biomed. Res. Int. 2022, 2022, 6459585. [Google Scholar] [CrossRef]
  39. Pisoschi, A.M.; Pop, A. The role of antioxidants in the chemistry of oxidative stress: A review. Eur. J. Med. Chem. 2015, 97, 55–74. [Google Scholar] [CrossRef]
  40. Liu, A.; Duan, G.; Yang, L.; Hu, Y.; Zhou, H.; Wang, H. Low-Temperature Stress-Induced Hepatic Injury in Darkbarbel Catfish (Pelteobagrus vachelli): Mediated by Gut-Liver Axis Dysregulation. Antioxidants 2025, 14, 762. [Google Scholar] [CrossRef]
  41. Huang, J.; Fu, Z.; Bai, J.; Ma, Z. Cold stress disrupts gill homeostasis in juvenile yellowfin tuna (Thunnus albacares) by altering oxidative, metabolic, and immune responses. Mar. Environ. Res. 2025, 210, 107300. [Google Scholar] [CrossRef] [PubMed]
  42. Wang, B.; Wang, Y.; Zhang, J.; Hu, C.; Jiang, J.; Li, Y.; Peng, Z. ROS-induced lipid peroxidation modulates cell death outcome: Mechanisms behind apoptosis, autophagy, and ferroptosis. Arch. Toxicol. 2023, 97, 1439–1451. [Google Scholar] [CrossRef] [PubMed]
  43. Su, L.J.; Zhang, J.H.; Gomez, H.; Murugan, R.; Hong, X.; Xu, D.; Jiang, F.; Peng, Z.Y. Reactive Oxygen Species-Induced Lipid Peroxidation in Apoptosis, Autophagy, and Ferroptosis. Oxid. Med. Cell. Longev. 2019, 2019, 5080843. [Google Scholar] [CrossRef] [PubMed]
  44. Goicoechea, L.; Conde de la Rosa, L.; Torres, S.; García-Ruiz, C.; Fernández-Checa, J.C. Mitochondrial cholesterol: Metabolism and impact on redox biology and disease. Redox Biol. 2023, 61, 102643. [Google Scholar] [CrossRef]
  45. Nolfi-Donegan, D.; Braganza, A.; Shiva, S. Mitochondrial electron transport chain: Oxidative phosphorylation, oxidant production, and methods of measurement. Redox Biol. 2020, 37, 101674. [Google Scholar] [CrossRef]
  46. Tajeddine, N. How do reactive oxygen species and calcium trigger mitochondrial membrane permeabilisation? Biochim. Biophys. Acta 2016, 1860, 1079–1088. [Google Scholar] [CrossRef]
  47. Simon, H.U.; Haj-Yehia, A.; Levi-Schaffer, F. Role of reactive oxygen species (ROS) in apoptosis induction. Apoptosis 2000, 5, 415–418. [Google Scholar] [CrossRef]
  48. Fleury, C.; Mignotte, B.; Vayssière, J.L. Mitochondrial reactive oxygen species in cell death signaling. Biochimie 2002, 84, 131–141. [Google Scholar] [CrossRef]
  49. Liu, S.; Huang, B.; Cao, J.; Wang, Y.; Xiao, H.; Zhu, Y.; Zhang, H. ROS fine-tunes the function and fate of immune cells. Int. Immunopharmacol. 2023, 119, 110069. [Google Scholar] [CrossRef]
  50. Cheng, C.H.; Ye, C.X.; Guo, Z.X.; Wang, A.L. Immune and physiological responses of pufferfish (Takifugu obscurus) under cold stress. Fish Shellfish Immunol. 2017, 64, 137–145. [Google Scholar] [CrossRef]
  51. Liu, E.; Zhao, X.; Li, C.; Wang, Y.; Li, L.; Zhu, H.; Ling, Q. Effects of acute heat stress on liver damage, apoptosis and inflammation of pikeperch (Sander lucioperca). J. Therm. Biol. 2022, 106, 103251. [Google Scholar] [CrossRef]
  52. Ma, F.; Zhao, L.; Ma, R.; Wang, J.; Du, L. FoxO signaling and mitochondria-related apoptosis pathways mediate tsinling lenok trout (Brachymystax lenok tsinlingensis) liver injury under high temperature stress. Int. J. Biol. Macromol. 2023, 251, 126404. [Google Scholar] [CrossRef] [PubMed]
  53. Cheng, C.H.; Yang, F.F.; Liao, S.A.; Miao, Y.T.; Ye, C.X.; Wang, A.L.; Tan, J.W.; Chen, X.Y. High temperature induces apoptosis and oxidative stress in pufferfish (Takifugu obscurus) blood cells. J. Therm. Biol. 2015, 53, 172–179. [Google Scholar] [CrossRef] [PubMed]
  54. Cox, B.; Roose, H.; Vennekens, A.; Vankelecom, H. Pituitary stem cell regulation: Who is pulling the strings? J. Endocrinol. 2017, 234, R135–R158. [Google Scholar] [CrossRef] [PubMed]
  55. Russell, J.P.; Lodge, E.J.; Andoniadou, C.L. Basic Research Advances on Pituitary Stem Cell Function and Regulation. Neuroendocrinology 2018, 107, 196–203. [Google Scholar] [CrossRef]
  56. Blanco, A.M. Hypothalamic- and pituitary-derived growth and reproductive hormones and the control of energy balance in fish. Gen. Comp. Endocrinol. 2020, 287, 113322. [Google Scholar] [CrossRef]
  57. Fontaine, R.; Rahmad Royan, M.; Henkel, C.; Hodne, K.; Ager-Wick, E.; Weltzien, F.A. Pituitary multi-hormone cells in mammals and fish: History, origin, and roles. Front. Neuroendocrinol. 2022, 67, 101018. [Google Scholar] [CrossRef]
  58. Campbell, G.S. Growth-hormone signal transduction. J. Pediatr. 1997, 131, S42–S44. [Google Scholar] [CrossRef]
  59. Carter-Su, C.; Rui, L.; Herrington, J. Role of the tyrosine kinase JAK2 in signal transduction by growth hormone. Pediatr. Nephrol. 2000, 14, 550–557. [Google Scholar] [CrossRef]
  60. Xu, B.C.; Wang, X.; Darus, C.J.; Kopchick, J.J. Growth hormone promotes the association of transcription factor STAT5 with the growth hormone receptor. J. Biol. Chem. 1996, 271, 19768–19773. [Google Scholar] [CrossRef]
  61. Li, X.; Liu, Y.; Duan, C.; Yang, L.; Zhou, D.; Zhang, Z.; Chen, H.; Li, G.; Zhu, C.; Tian, C. Effects of chronic high-temperature stress on muscle tissue integrity and metabolism-related genes in Clarias fuscus. Comp. Biochem. Physiol. Part D Genom. Proteom. 2025, 55, 101497. [Google Scholar] [CrossRef]
  62. Renaud, C.; de Lamballerie, M.; Guyon, C.; Astruc, T.; Venien, A.; Pottier, L. Effects of high-pressure treatment on the muscle structure of salmon (Salmo salar). Food Chem. 2022, 367, 130721. [Google Scholar] [CrossRef]
  63. Fuentes, E.N.; Einarsdottir, I.E.; Valdes, J.A.; Alvarez, M.; Molina, A.; Björnsson, B.T. Inherent growth hormone resistance in the skeletal muscle of the fine flounder is modulated by nutritional status and is characterized by high contents of truncated GHR, impairment in the JAK2/STAT5 signaling pathway, and low IGF-I expression. Endocrinology 2012, 153, 283–294. [Google Scholar] [CrossRef]
Figure 1. Metabolomic alterations in the pituitary gland of the Tiger Puffers under chronic low-temperature stress. (A) PCA (principal component analysis) analysis based on Euclidean distance algorithm. (B) Differential metabolite volcano plot. (C) Hierarchical clustering analysis heatmap of contrasting differential metabolites across groups. (D) KEGG enrichment plot of differential metabolites. (E) Metabolic pathway analysis diagram.
Fishes 10 00572 g001aFishes 10 00572 g001b
Figure 2. Effects of chronic hypothermic stress on antioxidant indicators in the pituitary gland of the Tiger Puffers (A) ROS, reactive oxygen species; (B) MDA, malondialdehyde; (C) GSH, reduced glutathione; (D) GSH-PX, glutathione peroxidase; (E) CAT, catalase; (F) SOD, superoxide dismutase; (G) T-AOC, total anti-oxidation capacity. Data are represented as means ± S.E.M (n = 9). Mean values for the same indicator with *, **, and *** were significantly different, respectively (p < 0.05, p < 0.01, and p < 0.001).
Fishes 10 00572 g002
Figure 3. Verification of apoptotic changes in pituitary cells subjected to chronic low-temperature stress using the TUNEL assay. (A) Apoptosis occurred in pituitary tissue at all four time points. Under fluorescence microscopy, apoptotic cells exhibited red fluorescence, while normal nuclei displayed blue fluorescence. (B) Apoptosis index of the Tiger Puffers pituitary cells. Data are represented as means ± S.E.M (n = 3, Microscope magnification: 40×, scale = 100 μm) The white box indicates a more pronounced apoptotic signal. Mean values for the same indicator with **, and *** were significantly different, respectively (p < 0.01, and p < 0.001).
Fishes 10 00572 g003
Figure 4. The effect of chronic hypothermia stress on the expression of apoptosis-related genes in the pituitary gland of the Tiger Puffers. (A) Bcl-2, B-cell lymphoma-2; (B) Bax, Bcl-2-Associated X Protein; (C) Apaf-1, Apoptotic protease activating factor-1; (D) Caspase-3; (E) Caspase-9. Data are represented as means ± S.E.M (n = 9). Mean values for the same indicator with *, **, and *** were significantly different, respectively (p < 0.05, p < 0.01, and p < 0.001).
Fishes 10 00572 g004
Figure 5. Effects of chronic hypothermic stress on Tiger Puffers muscle tissue. (AD) 0d, 15d, 30d, and 45d histological changes in muscle fiber. (E) Relative myofiber Area (%). Data are represented as means ± S.E.M (n = 3, Microscope magnification: 10×, scale = 200 μm). Mean values for the same indicator with *, **, and *** were significantly different, respectively (p < 0.05, p < 0.01, and p < 0.001).
Fishes 10 00572 g005
Figure 6. The effect of chronic hypothermia stress on the expression of growth and development-related genes in the muscle of the Tiger Puffers. (A) GH1, growth hormone 1; (B) Ghra; (C) jak2a, Janus Kinase 2a; (D) stat5a, signal transducer and activator of transcription 5A; (E) Igf1, insulin-like growth factor 1. Data are represented as means ± S.E.M (n = 9). Mean values for the same indicator with *, ** were significantly different, respectively (p < 0.05, p < 0.01).
Fishes 10 00572 g006
Figure 7. As illustrated, chronic cold stress modulates stress and growth responses in the Takifugu rubripes by influencing signaling pathways within its pituitary gland. In this process, reactive oxygen species induced by low-temperatures are a key component of the integrated stress response, disrupt mitochondrial dynamics via the mitochondrial pathway. This imbalance, manifested as dysregulation of fusion and fission processes, subsequently initiates apoptosis. Following pituitary tissue damage, reduced growth hormone release diminishes its synergistic action with insulin-like growth factor-1 in muscle tissue, ultimately resulting in stunted growth and development in the fish.
Fishes 10 00572 g007
Table 1. Reagent kits required for the experiment and their sources.
Commercial Reagent KitItem NumberManufacturer
Reactive Oxygen Species (ROS)Assay KitE004-1-1Nanjing Jian Cheng Bioengineering Institute
Total protein (TP) quantitative Assay KitA045-2-2Nanjing Jian Cheng Bioengineering Institute
Reduced glutathione (GSH) Assay KitA006-2-1Nanjing Jian Cheng Bioengineering Institute
Glutathione Peroxidase (GSH-PX) Assay KitA005-1-2Nanjing Jian Cheng Bioengineering Institute
Total antioxidant capacity(T-AOC) Assay KitA015-1-2Nanjing Jian Cheng Bioengineering Institute
Catalase (CAT) Assay KitA007-1-1Nanjing Jian Cheng Bioengineering Institute
Superoxide Dismutase (SOD) typed Assay KitA001-2-1Nanjing Jian Cheng Bioengineering Institute
Malondialdehyde (MDA) Assay KitA003-1-2Nanjing Jian Cheng Bioengineering Institute
Table 2. Sequences of primers used in qRT-PCR.
Graph 5.Primer Sequence (5′-3′)
Caspase9-FATCCTTCAAGCCTCTACGATGGG
Caspase9-RTCTGATTAACTGCCTAGCCTGGTC
Caspase3-FCGACCAGACAGTGAAGCAGATG
Caspase3-RATGACTCAGCAGAACGCACAC
Bcl-2-FCCTCCTCCATCTCGTGCTTCTC
Bcl-2-RGGGCTTTGAAGACATCCAGAACTG
Bax-FCGATGATGTCACCGCCACTTG
Bax-RTGACCGCCGACGCCTATAT
Apaf-1-FCCTCTTCGCCACCACCTCTG
Apaf-1-RTCCGCACGCACTCCTGATG
gh1-FGAAGCAGAGCAACAATGGACAAAG
gh1-RTGAGCAAGCAGGTGGAGGTG
igf1-FGCATCGGTCATCTATTCGGAGTC
igf1-RGCTGTTCCTTCTAATCGGCTCTG
stat5a-FGGCAGAACACCTCAGACAACAAC
stat5a-RGAACTGTGGCGGCGAACTTG
jak2a-FGCGGAGGAGGTGGAGGTGAG
jak2a-RTTGTCCTGCTTGGTGATGGTAACG
ghra-FTCATTGTGCTCGTTGCTGTATCTC
ghra-RCGGCTCGTCTCGGTAGAACTC
β-actin-FCCAGAAAGACAGCTACGTTGG
β-actin-RGCAACTCTCAGCTCGTTGTAG
Disclaimer/Publisher’s Note: The statements, opinions and data contained in all publications are solely those of the individual author(s) and contributor(s) and not of MDPI and/or the editor(s). MDPI and/or the editor(s) disclaim responsibility for any injury to people or property resulting from any ideas, methods, instructions or products referred to in the content.