Article

Impact of Ocean Acidification on the Intestinal Microflora of Sinonovacula constricta

1
Tianjin Key Laboratory of Aqua-Ecology and Aquaculture, College of Fisheries, Tianjin Agricultural University, Tianjin 300384, China
2
Key Laboratory of Smart Breeding (Co-Construction by Ministry and Province, Ministry of Agriculture and Rural Affairs), Tianjin Agricultural University, Tianjin 300384, China
3
Lanzhou Fisheries Technology Promotion Center, Lanzhou 730000, China
*
Authors to whom correspondence should be addressed.
Fishes 2025, 10(11), 571; https://doi.org/10.3390/fishes10110571
Submission received: 25 September 2025 / Revised: 26 October 2025 / Accepted: 30 October 2025 / Published: 7 November 2025
(This article belongs to the Section Aquatic Invertebrates)

Abstract

The intestinal microflora, which is vital for nutrient absorption and immune regulation, can experience dysbiosis under environmental stress, potentially enhancing host susceptibility to pathogenic invasion. The impact of ocean acidification on bivalves is substantial, but its effects on their intestinal microflora remain poorly understood. To explore the impact of ocean acidification on the intestinal microflora of Sinonovacula constricta, this study used high-throughput 16S rRNA sequencing technology to investigate the variations in the intestinal microflora communities of S. constricta during ocean acidification across different time points. After exposure to ocean acidification, changes in the composition of the intestinal microflora of S. constricta were observed, with no significant difference in α-diversity between the acidified and control groups. The abundance of Proteobacteria in the acidification group increased, whereas that of Cyanobacteria decreased. The abundance of Firmicutes initially decreased and then increased. At the genus level, the relative abundance of Pseudomonas was lower than that in the control group, whereas the relative abundance of Photobacterium, Acinetobacter, and Enterobacter gradually increased. LEfSe analysis identified Serpens as the discriminative biomarker at 7 days of acidification, Enterobacteriales, Rhodobacteraceae, and Martvita at 14 days of acidification, and Serpens, Acidibacteria, and Aeromonadaceae at 35 days of acidification. Functional prediction analysis indicated significant stimulation in various metabolic pathways at different time points following acidification stress. Specifically, pathways involved in biosynthesis were significantly stimulated at 14 days of acidification, while those related to sucrose degradation were disrupted at 35 days. The results further indicated that ocean acidification stress can influence the intestinal microflora of S. constricta, but no severe dysbiosis or digestive system impairment was observed at the microbial level. This study provides new insights into the effects of ocean acidification on the intestinal microflora of marine bivalves.
Key Contribution: For the first time, a study on ocean acidification was conducted on the bivalve shellfish Sinonovacula constricta in estuaries. This research aimed to investigate the effects of ocean acidification on Sinonovacula constricta by studying its intestinal microflora, offering fresh insights into the impact of ocean acidification on marine bivalves. Relative content of Pseudomonas, Photobacterium, Acinetobacter, and Enterobacter have changed, but the widely concerning Vibrio species has not appeared. Some changes in the intestinal microflora occurred, but ocean acidification did not have a serious impact on Sinonovacula constricta.

1. Introduction

A host organism and the microbial community coexisting with it mutually influence each other, exerting a significant impact on the host’s physiology and health [1]. Intestinal microflora, serving as an “extra organ” of the host, is receiving increasing research attention. Research has shown that the host’s nutrient absorption, immune regulation, and resistance to infectious pathogens all rely heavily on the crucial role played by the intestinal microflora [2,3]. In marine bivalves, the structure of the intestinal microflora can undergo significant changes due to alterations in the marine environment, such as increased acidity, oxygen deficiency, and variations in water temperature [3,4]. As the marine environment continues to undergo changes, the academic community has demonstrated keen interest in exploring the interactions between the intestinal microflora of aquatic animals and marine environmental factors.
Since the Industrial Revolution, substantial carbon dioxide emissions resulting from human activities have caused a persistent decline in the pH value of the global ocean, a phenomenon referred to as ocean acidification (OA) [5]. A study suggests that the pH of the ocean surface has decreased by 0.1 units over the past two centuries. By the end of this century, this value is expected to further decrease to 7.8, and by the early 23rd century, it may drop to 7.4 [6]. To investigate the potential impact of OA on marine bivalves in the future, high-throughput sequencing of the V4 region of the 16S rRNA gene was conducted. The effect of OA at pH 7.4 (predicted value for 2300) on the composition of the intestinal microflora of razor clams was evaluated. With the intensification of OA, people are becoming increasingly concerned about whether marine organisms can adapt to this rapid environmental change [7]. In particular, OA can directly affect the intestinal microflora of bivalves, including their structure and diversity, ultimately affecting their capacity to convert food into energy and other physiological functions [2]. Additionally, OA-induced dysbiosis of the intestinal microflora can potentially promote the proliferation of pathogenic species, leading to disease [4]. Nevertheless, researchers found that OA does not affect the microbial community structure of the digestive tract in Mytilus coruscus [8]. These findings indicate that under acidic conditions, intestinal microflora demonstrates species specificity, although they may exert distinct effects on the health of various marine bivalve species.
The razor clam Sinonovacula constricta, a seafood widely distributed in coastal areas around the world, is also listed as an important marine aquaculture target in China. Taking 2022 data as an example, the total production of razor clams reached over 840,000 tons, and the total area of aquaculture was close to 4326 hectares [9]. As a filter-feeding mollusk inhabiting estuarine sediments, S. constricta is particularly exposed to fluctuating pH conditions. Meanwhile, estuarine sediments also contain abundant microbial communities. Understanding its microbial response to OA provides insights into the adaptive capacity of estuarine bivalves to future ocean conditions. However, there is currently limited information available on how the intestinal microflora of marine bivalves responds to increasingly acidic ocean conditions and the subsequent impact on the health of their host organisms. The present study assessed the effects of ocean acidification (OA), with a projected pH of 7.4 by 2300, on the composition of the intestinal microflora in razor clams through high-throughput sequencing of the V4 region of the 16S rRNA gene. Our results facilitate a deeper understanding of the mechanisms by which S. constricta adapts to acidifying environments.

2. Materials and Methods

2.1. Experiment Design and Sample Collection

A total of 120 razor clams (shell length: 50.95 ± 2.45 mm) were collected from a mud aquaculture pond situated in Sanmen County, Zhejiang Province, China (geographic coordinates: 29.057166° N, 121.562862° E). Upon arrival at the laboratory, the razor clams were thoroughly cleaned and placed into a pre-prepared aquaculture system equipped with water filtration and oxygenation equipment. They were then acclimated there for one week. The environmental conditions during the acclimation period were consistent with those recorded at the collection site and on the day of collection (temperature 24 °C, salinity 18‰, pH 8.1, and dissolved oxygen (DO) ≈ 7 mg O2/L). These razor clams were then randomly and evenly allocated to two aquaculture systems, each consisting of three breeding tanks, serving as parallel experiments.
In the simulation experiment, two distinct OA environments were created by injecting pure carbon dioxide gas into the aquariums. The pH of one group was set to 8.1, serving as the control group (CON) (temperature 24.6 ± 0.3 °C, salinity 18.1 ± 0.2 ‰, pH 8.1 ± 0.2, and DO 8.5 ± 0.2 mg O2/L), whereas the other group was adjusted to 7.4 to simulate the expected acidification situation in the year 2300 [6] (acidification group, OA) (temperature 24.5 ± 0.2 °C, salinity 18.0 ± 0.2 ‰, pH 7.4 ± 0.1, and DO 8.4 ± 0.2 mg O2/L). To better mimic the natural environment, approximately 15 cm of sandy sediment was laid at the bottom of each experimental aquarium, sourced from the estuarine mudflat near Mapengkou Village in the Binhai New Area of Tianjin. Razor clams were fed twice daily at regular intervals (8:00 a.m. and 8:00 p.m.). To ensure their healthy growth, we provided fresh Dicrateria zhanjiangensis and concentrated Chlorella as food sources. Dicrateria zhanjiangensis served as the main fresh feed (containing 1 × 10⁷ cells/mL), feeding 1.5 L each time, and Chlorella vulgaris served as a supplement (containing 2 × 10⁸ cells/mL), with 3 mL fed each time. This feeding strategy aimed to avoid the high pH of fresh algal solution interfering with the pH stability of the experimental group and to ensure that they could obtain sufficient nutrients to meet their metabolic needs [10,11]. On the 7th, 14th, and 35th days of the experiment, all razor clams were fasted for 12 h to clear their digestive system for sample collection. Three razor clams were randomly selected from each of the three replicate tanks per treatment and dissected under sterile conditions to extract intestinal tissue. These tissue samples were then quickly stored in −80 °C for subsequent analysis. The samples from the control and acidification groups were processed according to this procedure. The duration of the experiments is marked as follows: OA7d and CON7d last for 7 days, OA14d and CON14d last for 14 days, and OA35d and CON35d last for 35 days.

2.2. DNA Extraction and High-Throughput Sequencing

The intestinal tissue from these three individuals from the same tank were pooled to form a single composite sample for DNA extraction. This pooling strategy was adopted to obtain a representative microbial profile for each tank unit and to mitigate the impact of individual variation, while still maintaining the tank as the unit of replication. Therefore, for each treatment group at each time point, we had three independent biological replicates (n = 3), each represented by a pooled DNA sample derived from one tank. A DNA extraction kit from Omega (Norcross, GA, USA) was used, and followed the manufacturer’s instructions to extract total genomic DNA from the samples. The purity and concentration of DNA were assessed using an agarose gel electrophoresis and a NanoDrop spectrophotometer (Thermo Scientific, Waltham, MA, USA). To minimize inter-sample variations, DNA samples from three individuals within each treatment group were pooled. The V3–V4 regions of the 16S rRNA gene were amplified using specific primer pairs, with the forward primer sequence ACTCCTACGGGAGGCAGCA and reverse primer sequence GGACTACHVGGGTWTCTAAT. The amplified products were subsequently subjected to high-throughput sequencing analysis using paired-end sequencing technology on the Illumina MiSeq sequencing platform provided by Shanghai Personal Biotechnology Co., Ltd., Shanghai, China.

2.3. Diversity Analysis and Functional Prediction

After obtaining the original sequencing results, the DADA2 plugin in QIIME2 (v.1.0, https://qiime2.org, accessed on 15 October 2024) was used to create amplicon sequence variants (ASVs) [12]. The taxonomy information of every ASV was obtained by searching for the most similar sequence on the SILVA database (v138.1, http://www.arb-silva.de, accessed on 20 November 2024) [13]. A petal diagram was constructed to identify the shared and unique ASVs. The relative abundance of taxo obtained from replicate samples was grouped using the “sum” pattern and displayed using a stacked bar chart. A phylogenetic tree was constructed using FastTree2 and used to analyze phylogenetic diversity [14]. Rarefaction curve analysis, α-diversity metrics (e.g., Chao1 and Shannon indices), and β-diversity indices (e.g., Bray–Curtis distance) were calculated using the QIIME2 (v1.0) ggplot2 plugin (v3.3.6). Principal coordinate analysis (PCoA) and Adonis/PERMANOVA tests were used to analyze the differences in microflora structures based on Bray–Curtis distance. Linear discriminant analysis (LDA) effect size (LEfSe) was performed to identify taxonomic groups (biomarkers) showing differences between the two groups with LDA > 3.5 as the threshold [15]. PICRUSt2 (https://github.com/picrust/picrust2/, accessed on 30 November 2024) was used to predict the functional profile of the intestinal microflora using the STAMP software package (v. 2.1.3) was used for further statistical analysis and visualization.

2.4. Statistical Analysis

The intestinal tissue from these three individuals from the same tank were pooled to form a single composite sample for DNA extraction. This pooling strategy was adopted to obtain a representative microbial profile for each tank unit and to mitigate the impact of individual variation, while still maintaining the tank as the unit of replication. Therefore, for each treatment group at each time point, we had three independent biological replicates (n = 3), each represented by a pooled DNA sample derived from one tank.

3. Results

3.1. Characteristics of Sequencing Data

A total of 692,837 sequences, with an average length of 424 bp, were obtained from the gut samples of acidified and control razor clams through 16S rRNA high-throughput sequencing after denoising and chimera filtering. These sequences were clustered into ASVs, with each ASV representing a unique operational taxonomic unit. After data filtering, a total of 8905 ASVs were obtained. Differential analysis was conducted on the average ASVs of each sample group to create a petal plot (Figure 1). A total of 149 ASVs were shared among all samples. The number of unique ASVs in the OA7d, OA14d, OA35d, CON7d, CON14d, and CON35d groups were 1574, 1676, 1417, 1186, 1961, and 942, respectively. The CON14d group had the highest number of unique ASVs, whereas the CON35d group had the fewest. The Good’s coverage index for all samples exceeded 0.975, indicating that the sequencing data were reliable.

3.2. Diversity and Community Structure of Intestinal Microflora

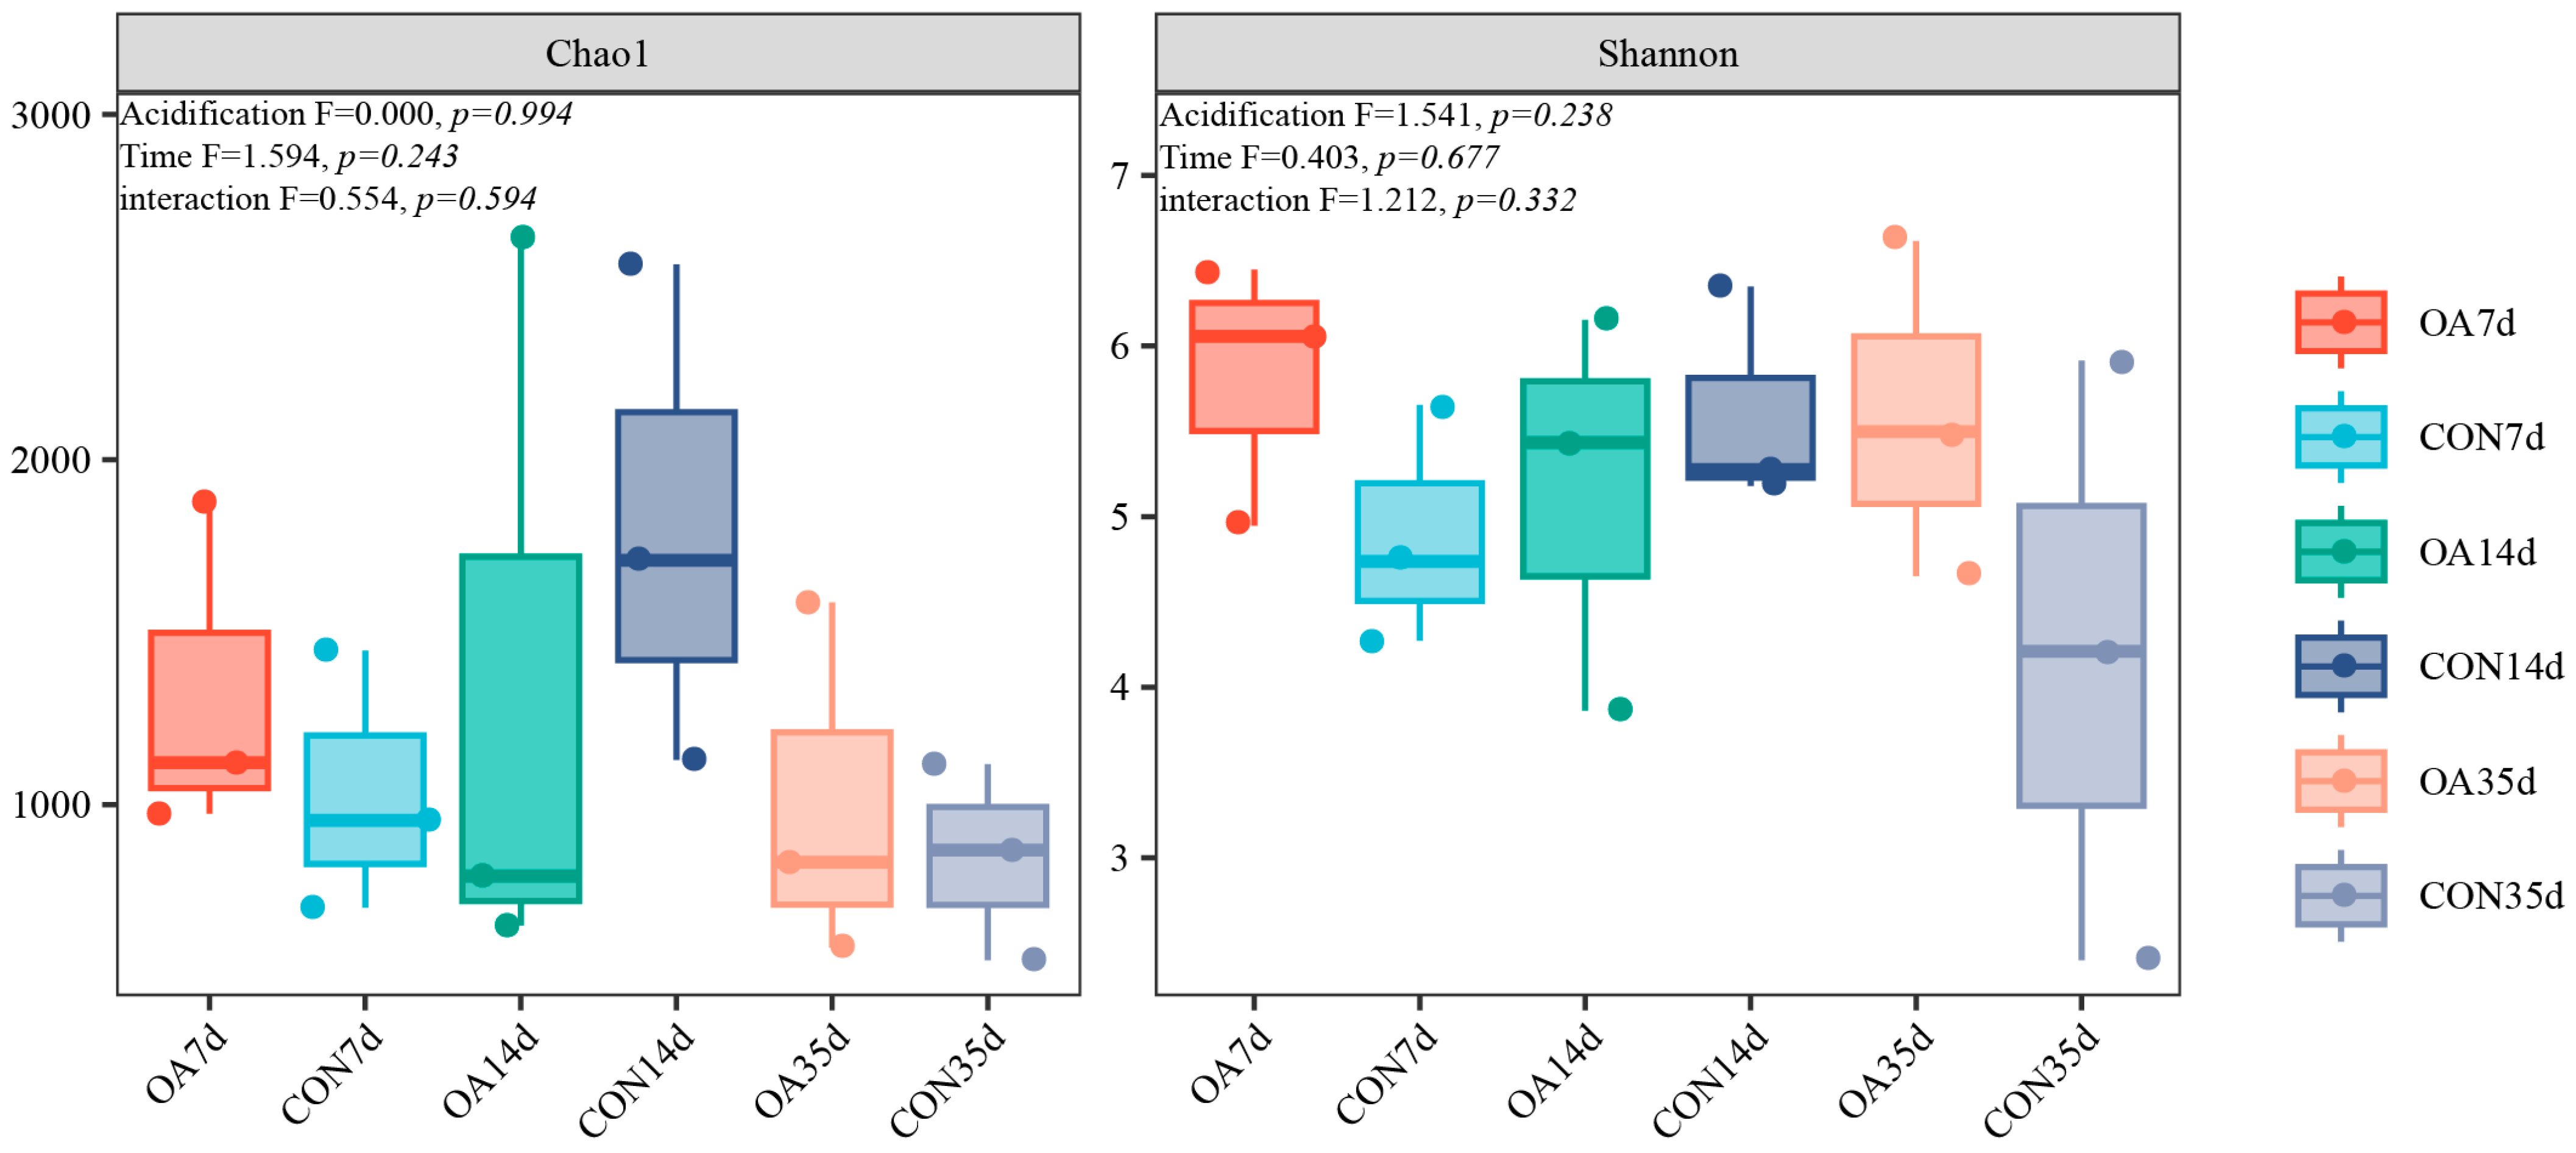
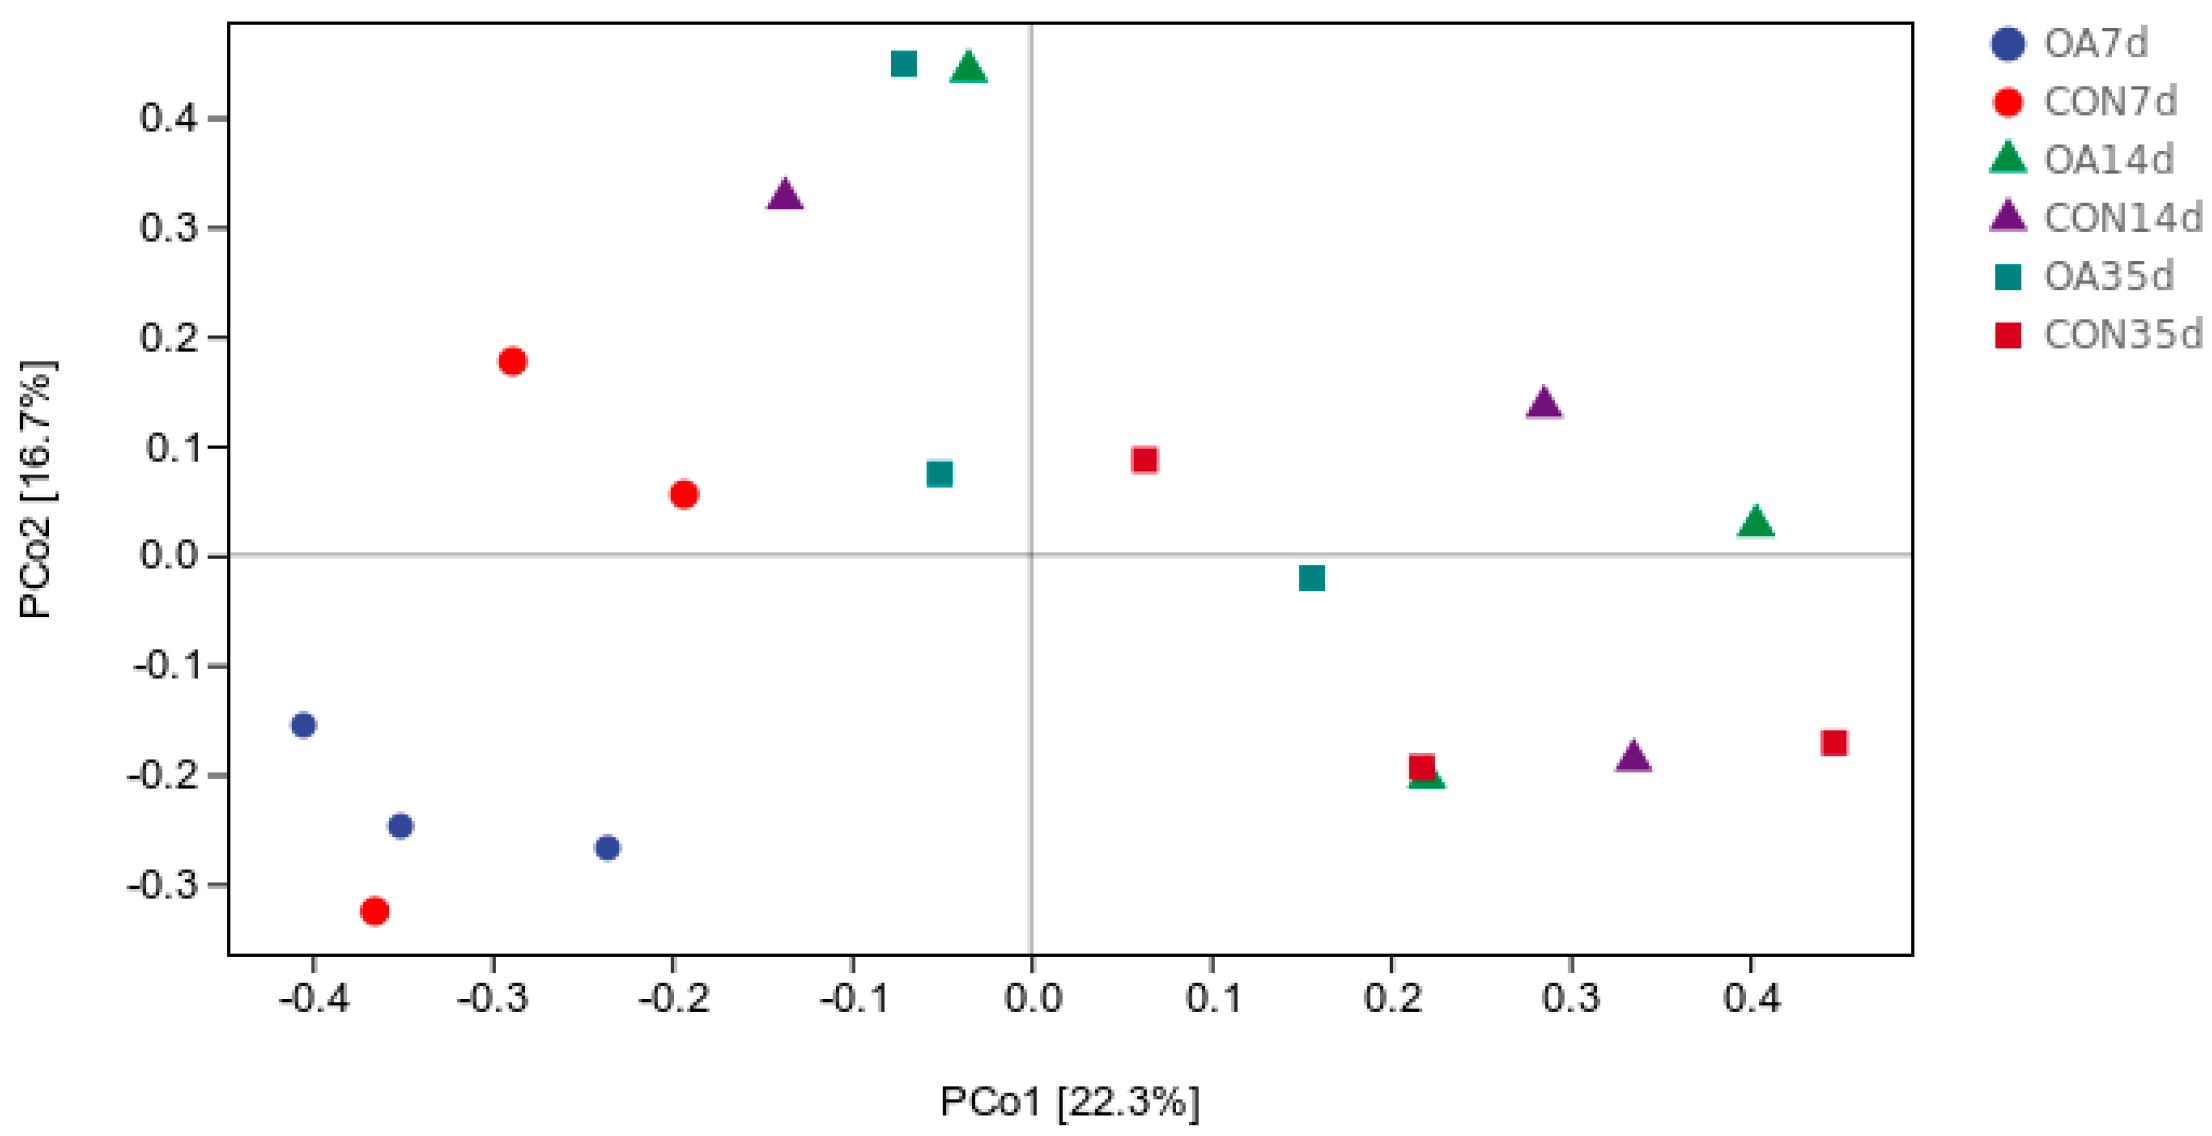
The rarefaction curves indicated that the Chao1 index was relatively stable when the sampling depth exceeded 27,003 reads (Figure 2A), and the Shannon index was relatively stable when the sampling depth exceeded 23,146 reads (Figure 2B). By calculating the α- diversity of six distinct groups of microbial communities, encompassing the Chao1 and Shannon diversity indices, we evaluated the impact of an acidic environment on the richness and diversity of the intestinal microflora in razor clams (Table S1). At three different time points, no statistically significant differences were observed in the Chao1 and Shannon indices between the acidification treatment group and the control group (p > 0.05). However, some differences were still noted between the two groups. The Chao1 index for the OA7d group was 1323.83, higher than that of the CON7d group at 1034.48; for the OA14d and CON14d groups, the Chao1 indices were 1362.47 and 1801.4, respectively; and for the OA35d group, the Chao1 index was 1002.02, higher than the CON35d group at 845.51 (Figure 3). For the OA7d group, the Shannon index was 5.82, higher than that of the CON7d group at 4.89; for the OA14d and CON14d groups, the Shannon indices were 5.09 and 5.60, respectively; and for the OA35d group, the Shannon index was 5.59, higher than that of the CON35d group at 4.18 (Figure 3). The PCoA map revealed that the structure of the intestinal microflora underwent adjustments under the pressure of acidification, although these adjustments were relatively limited (Figure 4). This finding was confirmed by the ADONIS analysis of the acidification and control groups at different time points (7 d, p = 0.8; 14 d, p = 0.4; 35 d, p = 0.2).

3.3. Species Composition of Intestinal Microflora

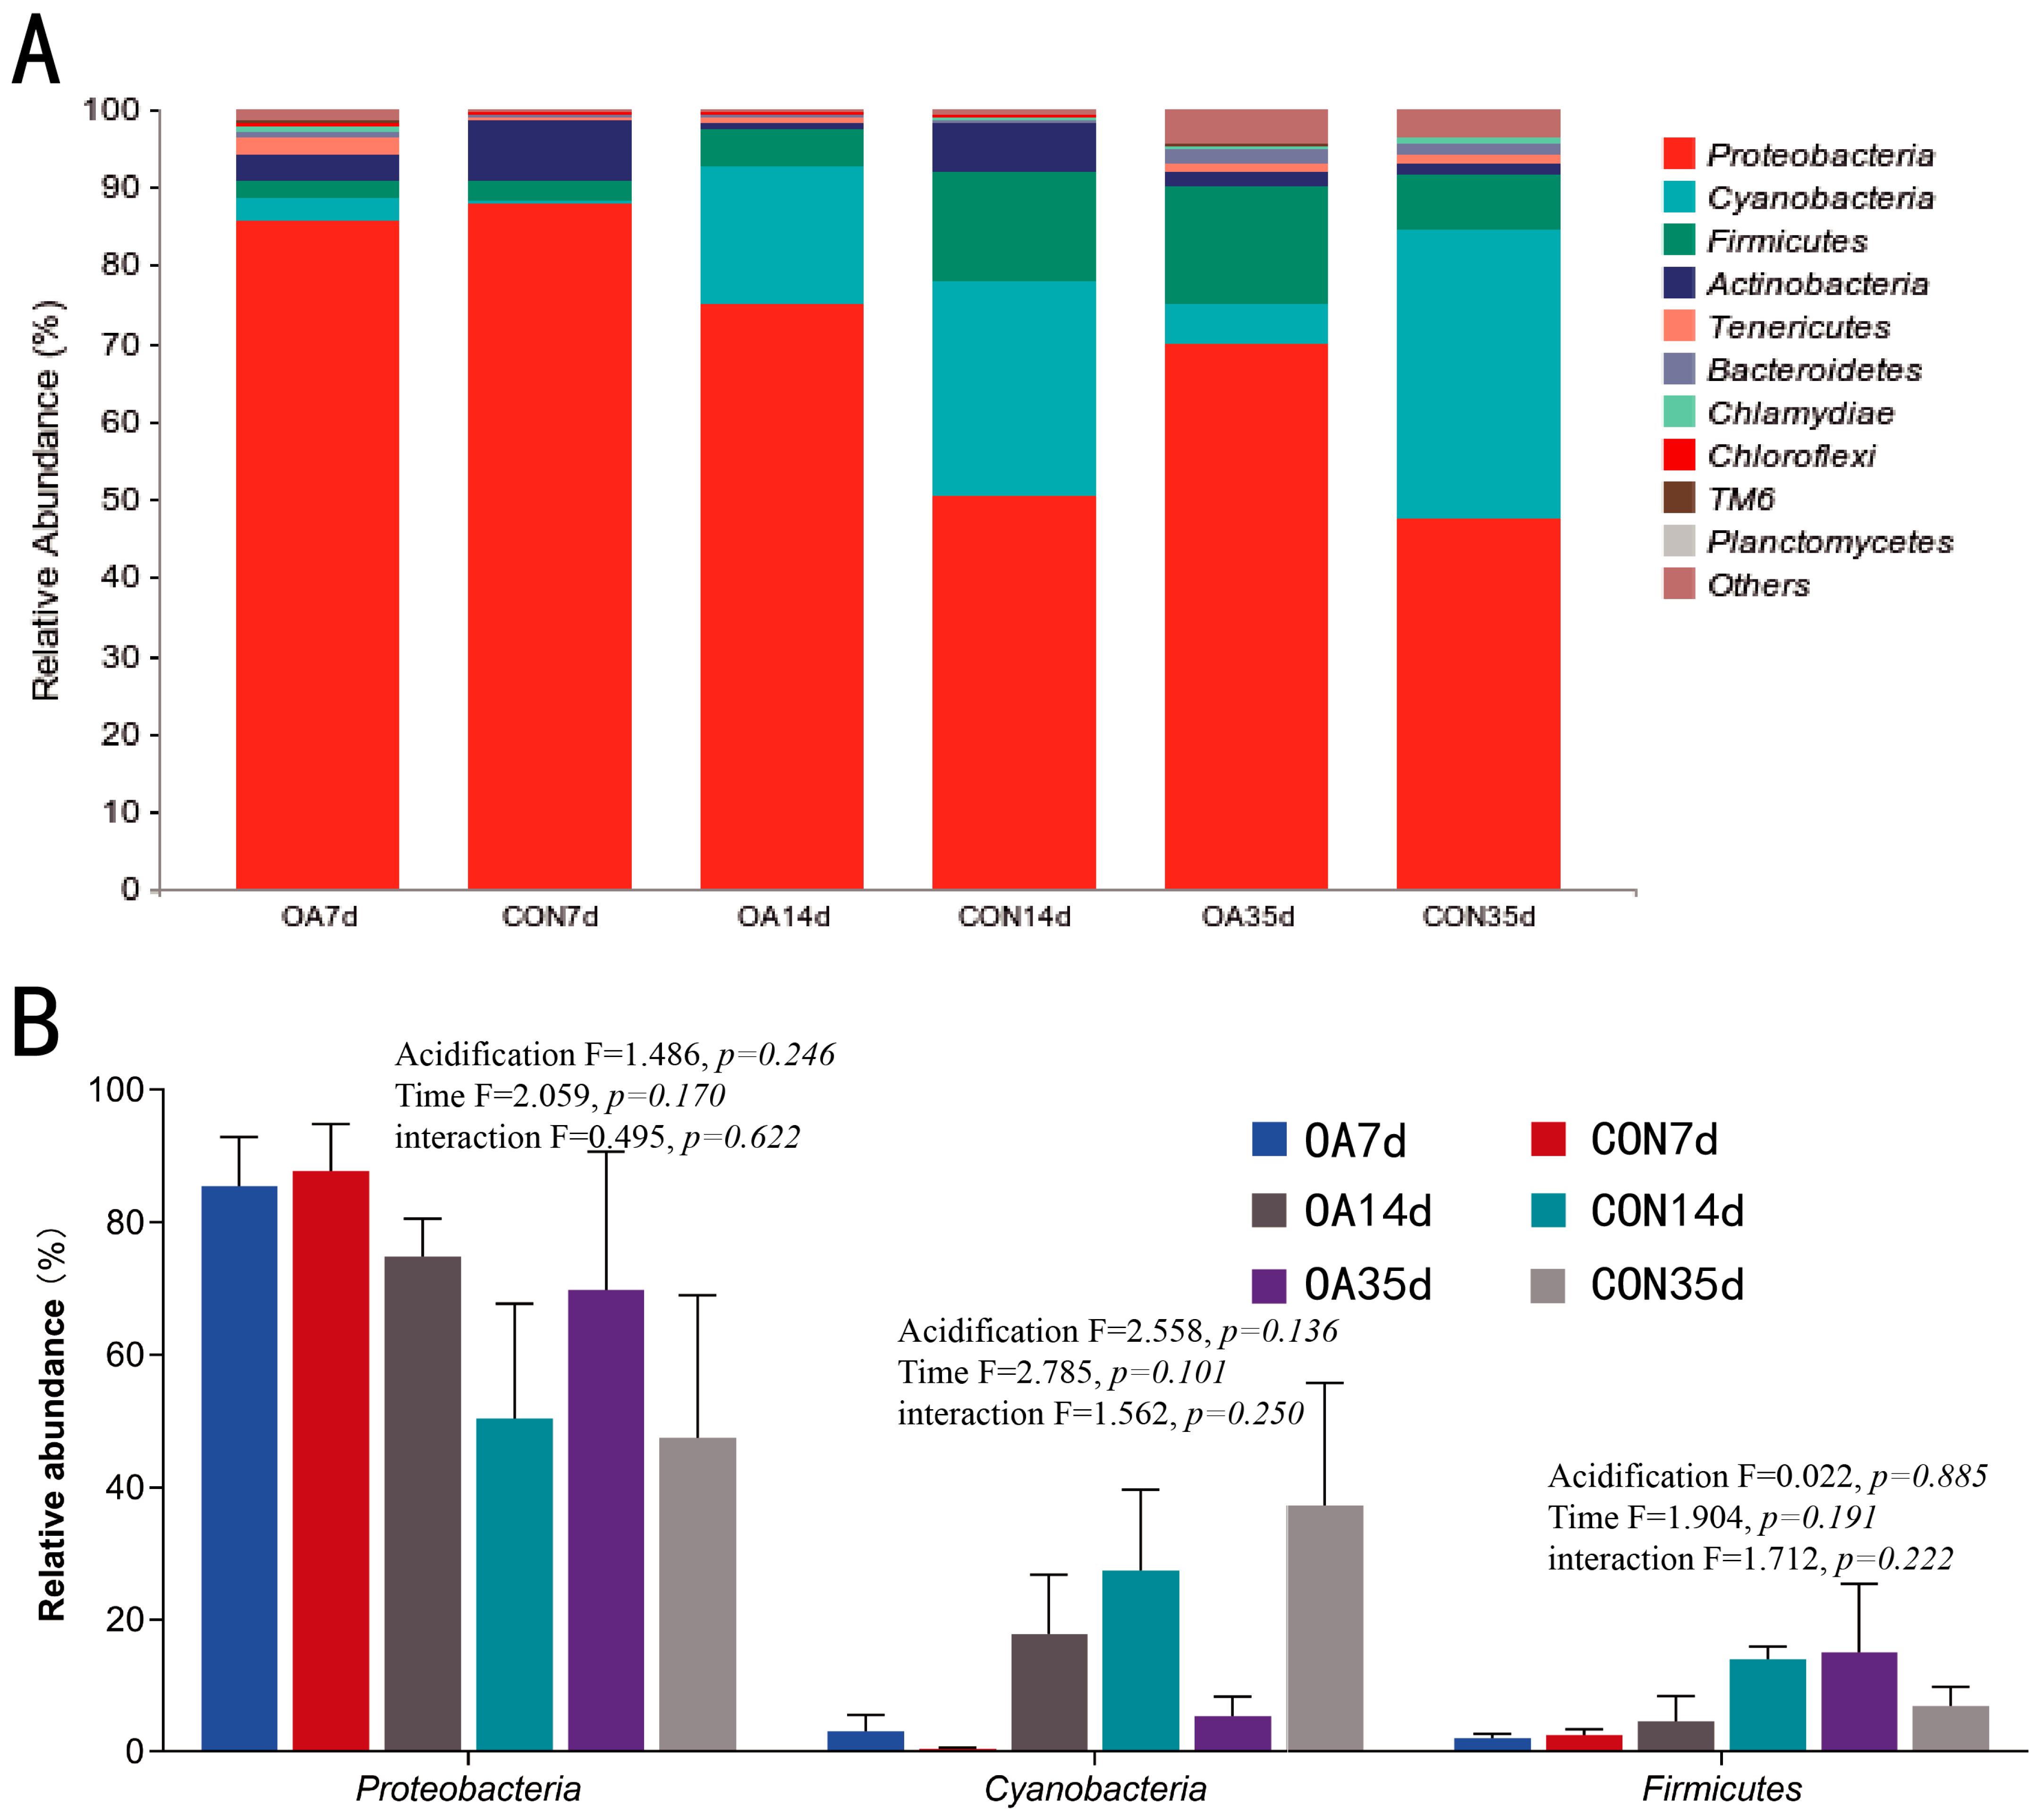
The top 10 most abundant bacterial phyla based on the phylum-classification level are listed (Figure 5A). Sequences that cannot be classified into any known phylum were assigned to the “Other” category. Proteobacteria, Cyanobacteria, and Firmicutes were the dominant phyla in the intestinal microflora of the acidified and control groups. The abundance of Proteobacteria increased under acidification stress in the OA14d and OA35d groups compared to that in the control group. Conversely, the relative abundance of Cyanobacteria decreased under acidification stress in these two groups. The relative abundance of Firmicutes decreased in the OA14d and increased in the OA35d groups compared with that in the control group. Overall, the abundance of Proteobacteria in the acidification group increased, whereas the abundance of Cyanobacteria demonstrated decreased. The abundance of Firmicutes initially decreased and then increased. However, these differences were not statistically significant (p > 0.05). Additionally, the ratio of Firmicutes to Bacteroidetes in the OA35d group was higher than that in the control group (Figure 5B).
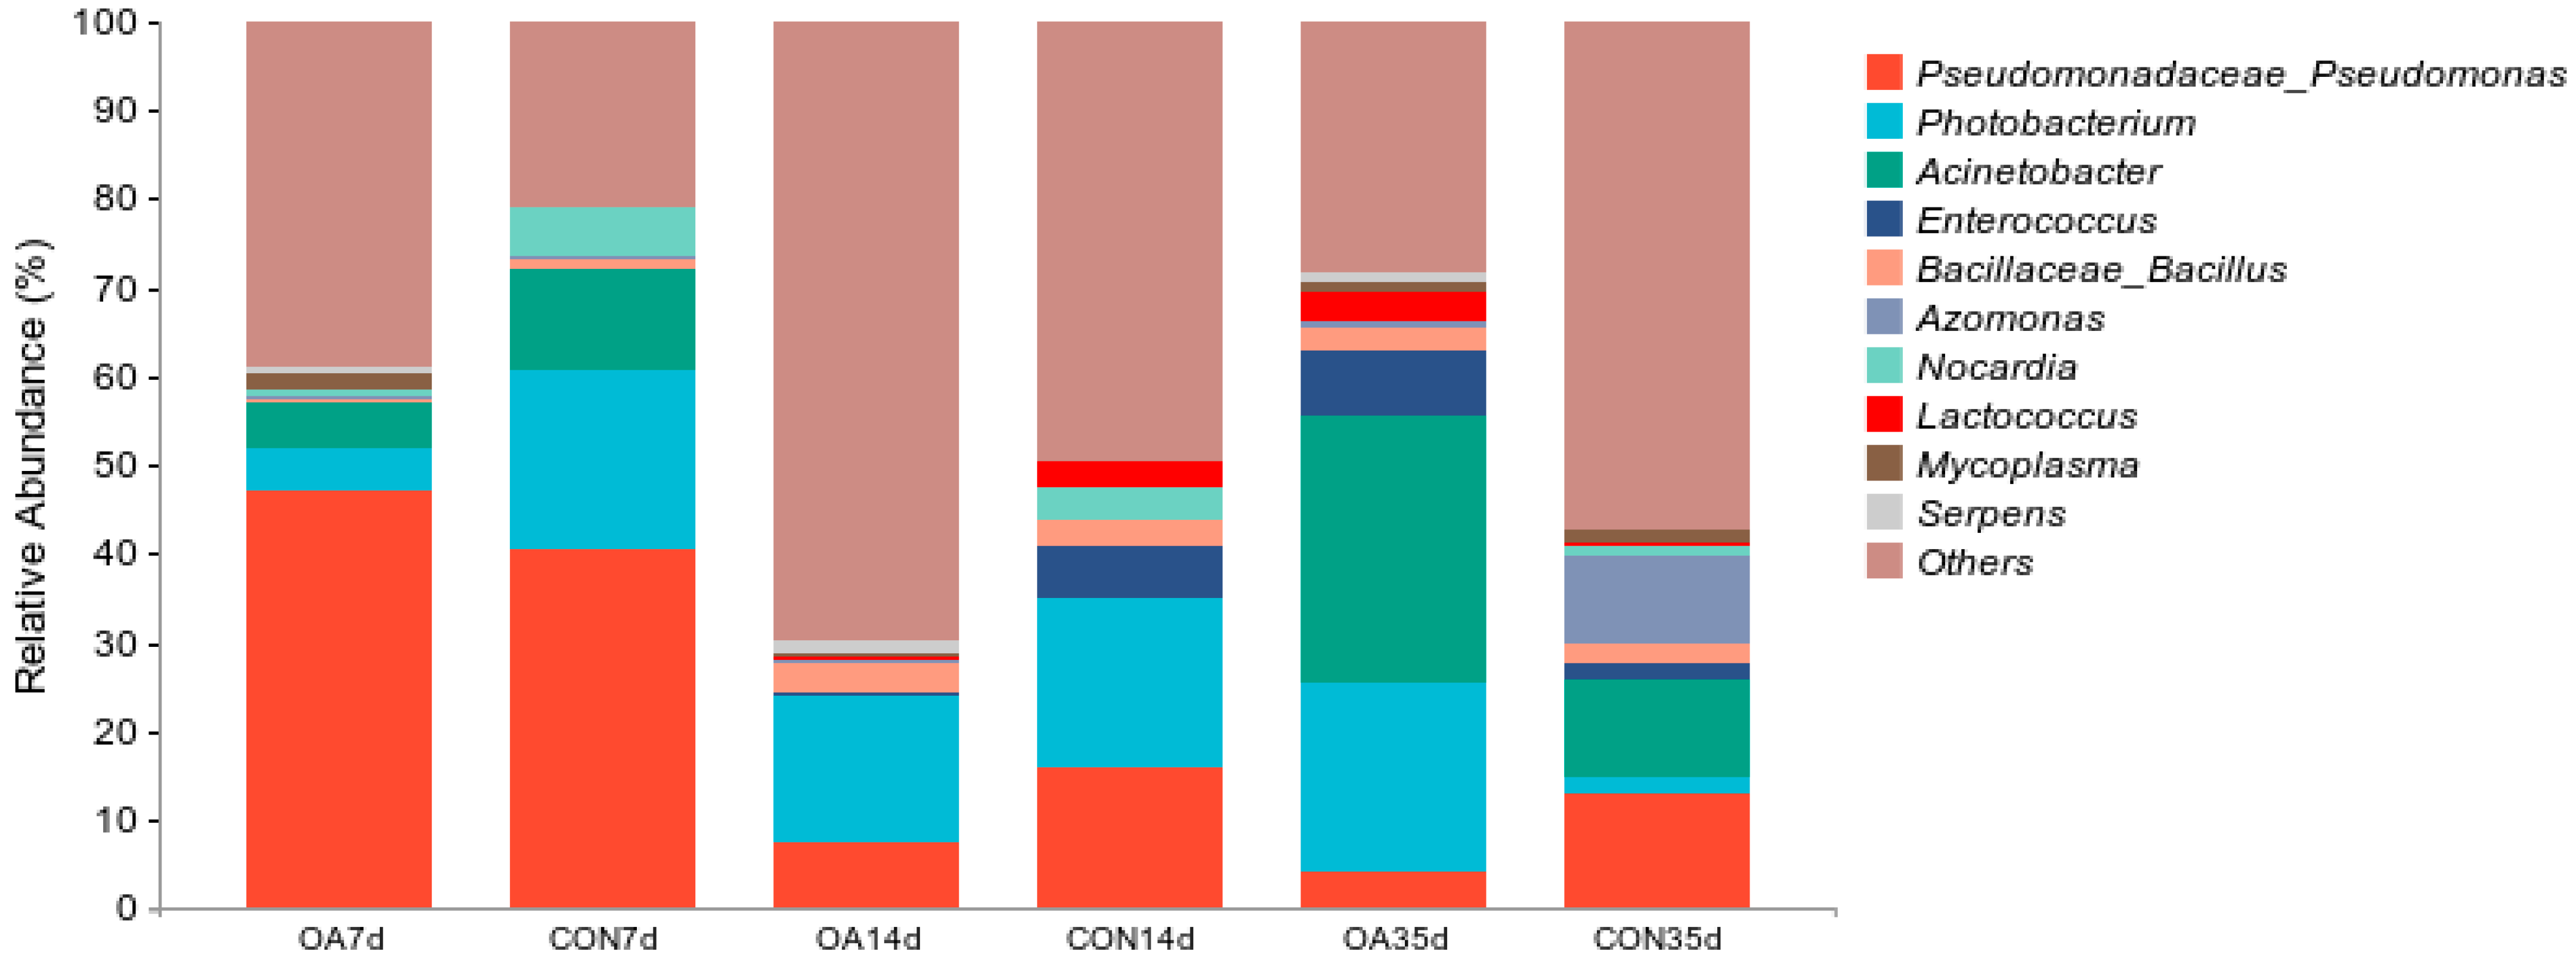
At the genus level, the intestinal microflora of the acidification group and the control group at different time points predominantly comprised Pseudomonas, Photobacterium, Acinetobacter, and Enterococcus (Figure 6). The relative content of Pseudomonas in the OA14d and OA35d groups was lower than that in the control group. Conversely, the relative abundance of Photobacterium, Acinetobacter, and Enterococcus in the acidified groups gradually increased. However, these differences were not statistically significant (p > 0.05).
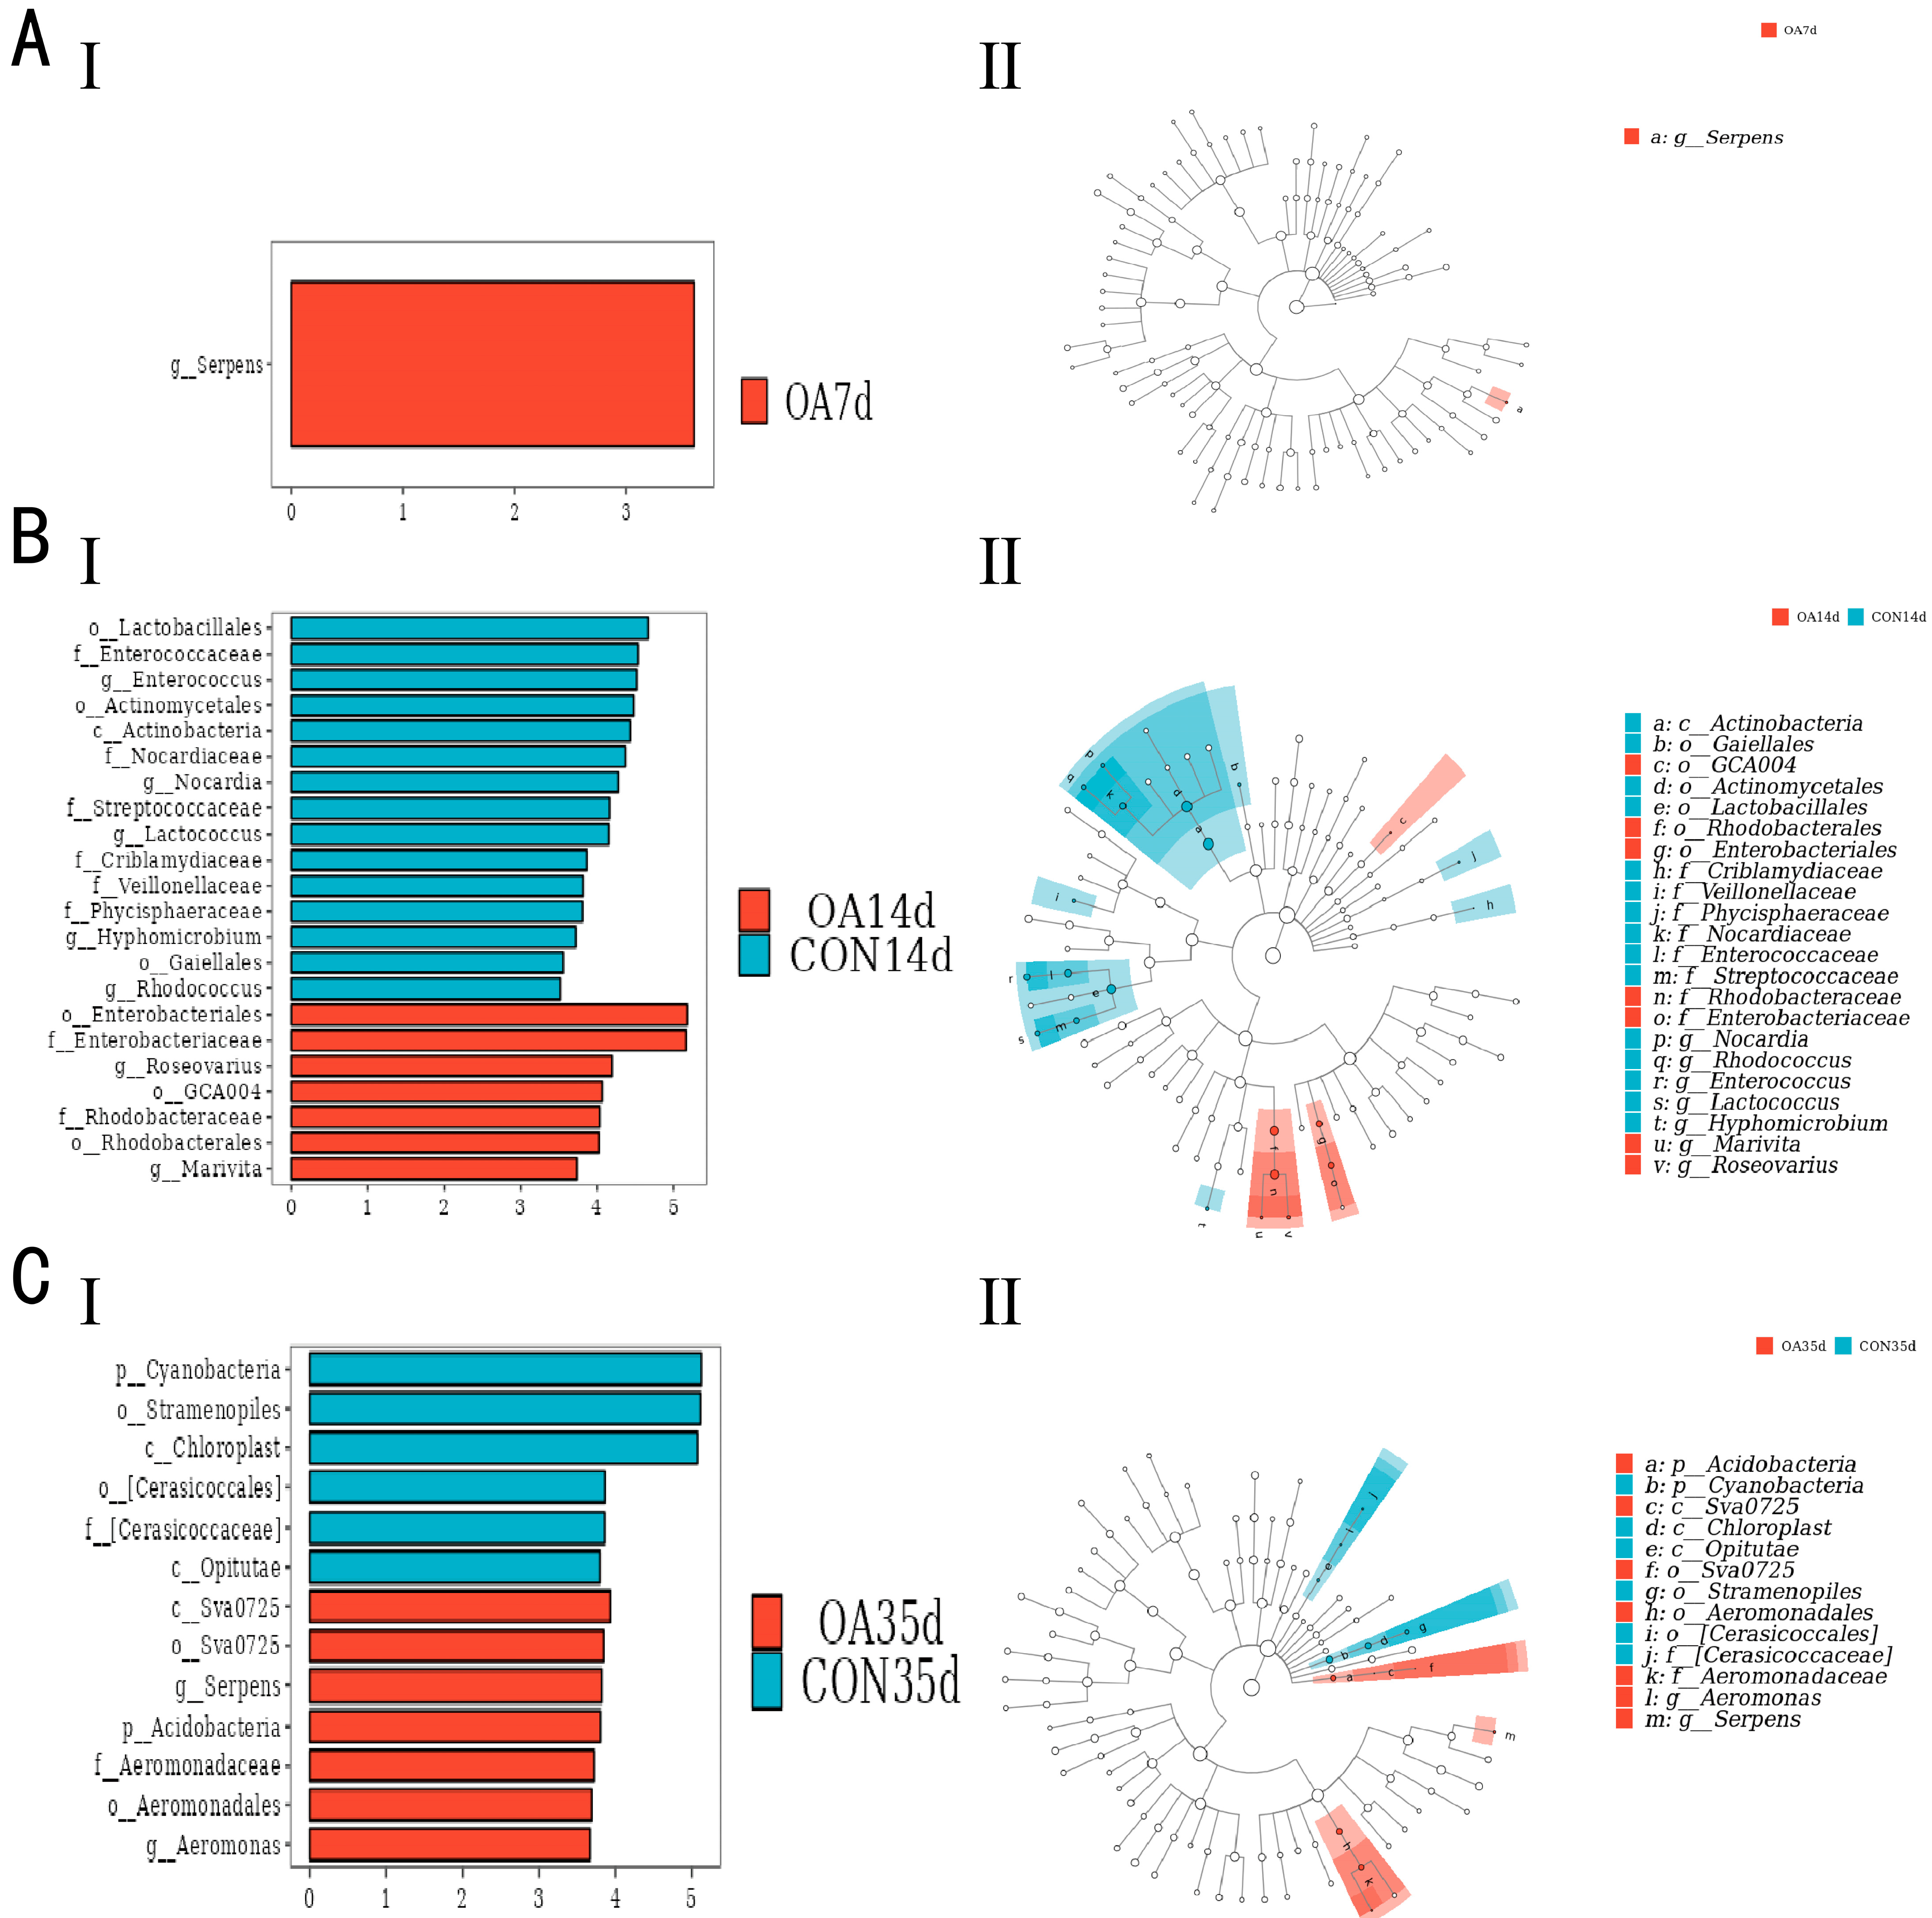
LEfSe analysis with an LDA score threshold of >3.5 was performed to study the differences in the intestinal microflora between the acidified stress groups and the control groups at different time points. Significant differences compared to the control group for OA7d were attributed to the genus Serpens (Figure 7A). The OA14d group was enriched with seven biomarker taxonomic groups, with significant differences observed in Enterobacteriales, Rhodobacteraceae, and Martvita (Figure 7B). The OA35d group was enriched with eight biomarker taxonomic groups compared to the CON35d group, with the most representative groups being Serpens, Acidobacteria, and Aeromonadaceae (Figure 7C).

3.4. Functional Prediction of Intestinal Microflora

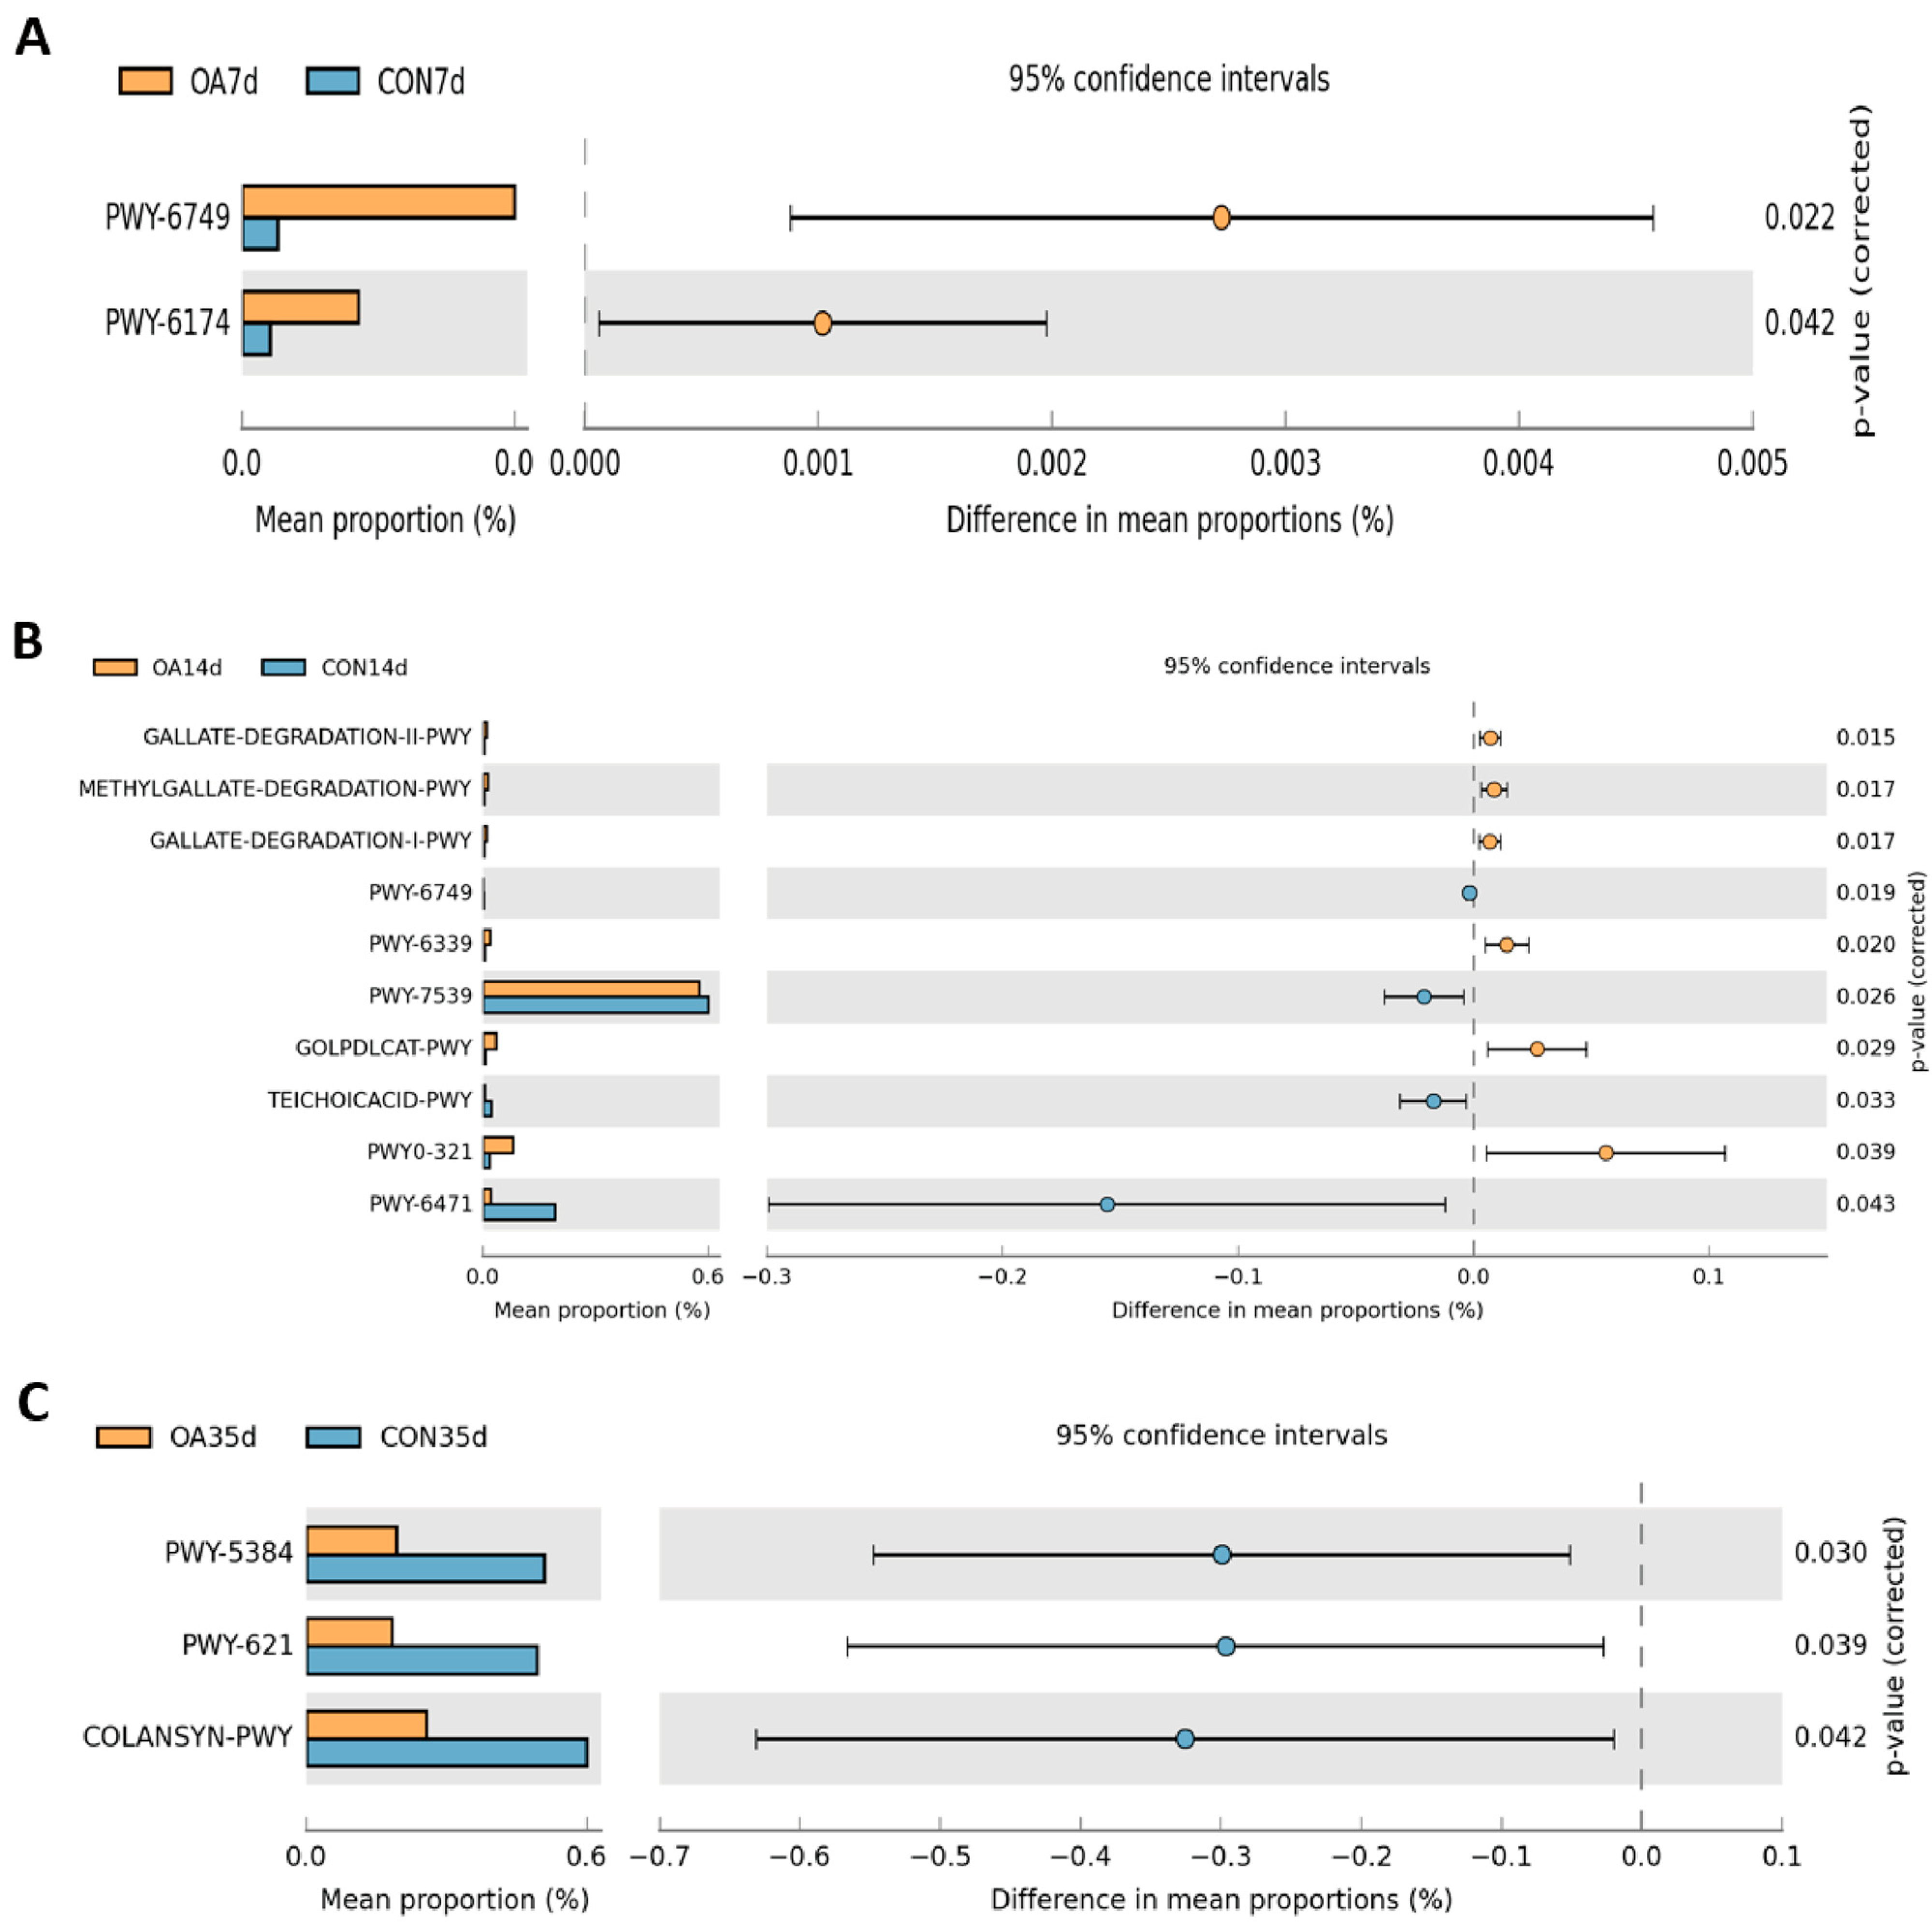
After analyzing the structure and species composition of the intestinal microflora, further functional predictions of the intestinal microflora were conducted. PICRUSt2 analysis revealed significant differences (p < 0.05) in the abundance of two MetaCyc pathways between the OA7d and CON7d groups. The OA7d group was stimulated in pathways related to CMP-Neu5Ac biosynthesis I and the haloarchaea pathway II compared with the control group (Figure 8A). Significant differences (p < 0.05) in the abundance of ten MetaCyc pathways existed between the OA14d and CON14d groups. The OA14d group was primarily stimulated in pathways related to phenylacetic acid degradation I (aerobic). Notably, the pathways for peptidoglycan biosynthesis IV (Enterococcus faecium) and 6-hydroxy-2-oxohept-3-enedioic acid biosynthesis III were disrupted compared to those in the control group (Figure 8B). Between the OA35d and CON35d groups, significant differences (p < 0.05) existed in the abundance of three MetaCyc pathways. The PWY-5384, PWY-621, and COLANSYN-PWY pathways, which are involved in sucrose degradation IV (sucrose phosphorylase), sucrose degradation III (sucrose synthase), and the biosynthesis of colanic acid building blocks, respectively, were all blocked in the OA35d group compared to the CON35d group (Figure 8C).

4. Discussion

With the dramatic surge in carbon dioxide emissions due to human activities, OA and global temperature rise are becoming increasingly severe. The rise in the partial pressure of carbon dioxide (pCO2) in the ocean and the subsequent decrease in pH are anticipated to affect the fundamental physiological functions of marine organisms, including growth and reproduction, and potentially even posing a threat to their survival in extreme scenarios [10,16,17]. These environmental shifts can potentially exert profound negative impacts on diverse organisms within the marine ecosystem.
Environmental stress can alter bacterial diversity within the gastrointestinal tract of aquatic animals, thereby affecting host health [18,19]. Environmental factors such as water temperature, pH level, salinity, dissolved oxygen content, nutrient supply, and infection risk can all affect the microbial community in bivalve mollusks [20,21,22,23]. Although various changes in the marine environment can affect the microbial communities within marine bivalves, the specific mechanisms by which their intestinal microflora responds to acidification stress remain unclear [2,21]. Therefore, in this study, high-throughput sequencing technology was employed to explore the impact of OA on the intestinal microflora of S. constricta.

4.1. Diversity and Community Structure of Intestinal Microflora

Previous studies found that the richness and diversity of intestinal microbiome are decreased by ocean acidification, which can undermine nutrient absorption [24]. The literature indicates that increased water temperature may reduce the α-diversity of intestinal microflora in Mytilus coruscus [4]. Additionally, researchers discovered that under heat stress conditions, the α-diversity of the intestinal microflora in the Mediterranean mussel (Mytilus galloprovinivialis) was significantly increased [25]. In this study, no significant difference in the α-diversity index of intestinal microflora was found between the acidified and non-acidified groups, consistent with previous research on oysters and Exopalaemon carinicauda [2,26]. Further analysis of β-diversity indicated that the structure of the intestinal microflora of razor clams did not undergo significant changes under acidification pressure.
Research has shown that dysbiosis of the intestinal microflora in a marine bivalve increases the likelihood of hosts being affected by pathogenic factors [27]. The results of this experiment indicated that acidification exposure did not cause dysbiosis of the intestinal microflora of razor clams, which may help to inhibit the growth of conditional pathogens and maintain a healthy state.

4.2. Species Composition of Intestinal Microflora

Herein, we compared the dominant microbial communities at the phylum level between the acidification group and the control group. Results indicated that there was no change in the dominant bacteria between the two groups, suggesting that OA did not affect the composition of dominant bacteria. However, there were varying degrees of changes in relative abundance. Proteobacteria and Firmicutes are major members of the gut bacteria of bivalve mollusks, suggesting that these bacteria have specific functional roles [28,29]. In our study, the abundance of Proteobacteria increased under acidification stress in the OA14d and OA35d groups. Symbiotic bacteria belonging to phylum Proteobacteria are present in the gut of healthy animals. However, under certain environmental conditions, these Proteobacteria can become pathogenic microorganisms in the gut, responsible for causing inflammation [30]. The abundance of Proteobacteria in the gut of diseased cultured striped jack (Oplegnathus punctatus) is also reportedly higher than in healthy fish [31]. The increase in Proteobacteria in the gut of razor clams under acidification stress in our work suggested that acidification stress may damage gut health and cause disease in razor clams. However, there was a change in the relative abundance of Firmicutes and the ratio of Firmicutes to Bacteroidetes under acidification exposure. Firmicutes is one of the most common phyla in aquatic animals and promotes the efficient acquisition of dietary energy through carbohydrate fermentation [2,32]. Additionally, the ratio of Firmicutes to Bacteroidetes in the gut of mammals is positively correlated with body weight [33]. The enrichment of Firmicutes in the OA35d groups may be a protective mechanism of gut bacteria for razor clams. The increased Firmicutes may help razor clams digest food to obtain sufficient energy to cope with acidification stress. Firmicutes and Bacteroidetes play crucial roles in the host’s lipid metabolism process. Changes in the relative proportion of Firmicutes and Bacteroidetes in the host body are often regarded as a marker of growth and development regulation. This change in proportion is not only related to the imbalance of the intestinal microflora, but also closely linked to the accumulation or consumption of fat in the host’s body [34,35]. The increase in this indicator in the current work, i.e., the higher ratio of Firmicutes to Bacteroidetes in the 35 d acidified group compared with the 7 d and 14 d groups, suggested that the intestinal microflora can help maintain the fat of razor clams and reduce the synthesis of digestive gland lipases. However, this may lead to an imbalance in the lipid metabolism.
At the genus level, the relative abundance of Pseudomonas in the OA14d and OA35d groups was lower than that in the control group. Pseudomonas can produce various active substances and antibiotics with antibacterial and bacteriostatic functions [36], and the reduced abundance of Pseudomonas in the acidified group may also increase the risk of infection by pathogenic bacteria in the gut of razor clams. Pseudomonas has extensive biological activities related to the secretion of extracellular compounds and has ecological significance, involving various invertebrates microbial cycles and interactions between hosts [37,38]. Therefore, Pseudomonas, as a dominant genus in both groups of razor clams, may proportionally affect the host’s nutrient acquisition and growth traits. The relative abundance of Photobacterium, Acinetobacter, and Enterobacter in the acidified group gradually increased. Photobacterium is often considered as secondary or opportunistic pathogens in aquatic animals [39]. Moreover, studies on humans have shown that Acinetobacter has become a major opportunistic pathogen and has been reported in various types of infections, primarily in patients with weakened immune systems [40]. An increase in their relative abundance may inhibit the growth of the original intestinal microflora, leading to dysbiosis of the intestinal microflora and adverse effects on the host. Therefore, the increase in the abundance of Photobacterium and Acinetobacter under acidification stress may increase the risk of disease in razor clams, and it is proportional to the duration of acidification stress. Members of the Enterobacter genus are common in the digestive tracts of freshwater and marine fish. For example, they have been found in the gut of rainbow trout, hybrid tilapia, and yellow croaker and are reported to be beneficial for metabolic activities, glycolysis, and acetate utilization [41,42,43,44]. An increase in Enterobacter may help razor clams cope with the adverse effects of acidification stress. LEfSe analysis was performed to compare differences in microbial communities between the acidified and control groups. The gut signature bacteria at 7 d and 35 d of acidification stress included Serpens, Acidobacteria, and Aeromonadaceae. Acidobacteria has been proven to have the function of cellulose degradation and can degrade cellulose to produce acetic acid and hydrogen under microoxic and anoxic conditions [45]. The significant enrichment of this group in the acidified group may help razor clams digest cellulose under acidification exposure. Although some the observed changes in microbial abundance were not statistically significant, the consistent trends across time points may reflect early microbial community adjustments to acidification stress. These shifts could indicate potential functional adaptations or stress responses, even in the absence of severe dysbiosis.

4.3. Functional Prediction of Intestinal Microflora

Functional prediction showed that, at different time points, acidified groups showed significant stimulation in metabolic pathways. This finding indicates that the metabolic rate of the intestinal microflora increased under acidification stress. Studies have shown that metabolically active microbial communities adopt diverse metabolisms to cope with environmental pressures [46,47,48]. Accordingly, the intestinal microflora of razor clams can respond to acidification stress by increasing their metabolic rate. Notably, the pathways involved in biosynthesis in the OA14d group and sucrose degradation in the OA35d group were significantly disrupted. The significant depression of biosynthesis-related pathways suggests that gut microbes may proliferate less under acidification stress. Bacterial proliferation consumes a significant amount of energy sources within the gut, and the reduced proliferation of bacteria may allow the host to accumulate more energy. Additionally, blocking carbohydrate catabolic pathways in the gut microbiota may decrease carbohydrate utilization by these microbes, potentially offering hosts more energy resources to cope with acidification exposure [49].

5. Conclusions

High-throughput sequencing technology was used to analyze the impact of acidification stress on the intestinal microflora of S. constricta. The results indicated that decreased seawater pH affected the diversity and structure of the intestinal microflora of razor clams, and the impact was greater with prolonged acidification. However, these adverse effects of acidification did not indicate severe dysbiosis or impaired microbial function, which may be attributed to the clams’ natural habitat in estuarine areas and their ability to resist the decrease in pH caused by freshwater influx. Furthermore, the sediment used in the experimental design may exert a protective effect on razor clams under acidification stress. These findings provide new insights into the gut microbiota of estuarine bivalves such as razor clams under current and expected ocean acidification conditions, emphasizing the necessity of continuous monitoring of microbial health indicators in rapidly changing marine environments.

Supplementary Materials

The following supporting information can be downloaded at: https://www.mdpi.com/article/10.3390/fishes10110571/s1, Table S1: Alpha diversity of the gut microbiota in the different groups.

Author Contributions

Y.W.: Writing—review and editing, Writing—original draft, Resources, Project administration, Methodology, Investigation, Formal analysis, Data curation, Conceptualization. H.D.: Methodology, Investigation, Formal analysis, Data curation. C.C.: Validation, Methodology, Formal analysis. T.W.: Visualization, Validation, Investigation. H.L.: Validation, Methodology, Investigation. S.L.: Visualization, Validation, Formal analysis. Y.L.: Validation, Resources. Y.G.: Visualization, Methodology. J.L.: Supervision, Project administration, Conceptualization, Funding acquisition. All authors have read and agreed to the published version of the manuscript.

Funding

This work has been facilitated by funding from various sources including National key research and development program of China (2023YFD2400800, 2024YFD2401803), Earmarked Fund for CARS (CARS-49), Tianjin Science and Technology Project (23YDTPJC00560, 24YDTPJC00820, 24ZYCGSN01210), Gansu Science and Technology Project (24CXNA086), and Tianjin Major Special Project for Seed Industry Innovation (24ZXZYSN00010).

Institutional Review Board Statement

The research object of this paper “Impact of ocean acidification on the intestinal microflora of Sinonovacula constricta” is shellfish in invertebrates. The experiment mainly measures the physiological energetics related indicators, so ethical approval is not required.

Data Availability Statement

Data will be made available upon request.

Acknowledgments

The author would like to express gratitude to the participants who have devoted their time to the experiment, and also deeply appreciate the meticulous evaluation and constructive suggestions provided by the anonymous reviewer.

Conflicts of Interest

The authors declare that they have no competing interests.

Abbreviations

The following abbreviations are used in this manuscript:
OAOcean Acidification
OA7d7-day group under ocean acidification stress
CON7dControl 7-day group
OA14d14-day group under ocean acidification stress
CON14dControl 14-day group
OA35d35-day group under ocean acidification stress
CON35dControl 35-day group

References

  1. Meron, D.; Atias, E.; Kruh, L.I.; Elifantz, H.; Minz, D.; Fine, M.; Banin, E. The impact of reduced pH on the microbial community of the coral Acropora eurystoma. ISME J. 2011, 5, 51–60. [Google Scholar] [CrossRef]
  2. Kong, N.; Han, S.; Fu, Q.; Yu, Z.; Wang, L.; Song, L. Impact of ocean acidification on the intestinal microflora of the Pacific oyster Crassostrea gigas. Aquaculture 2022, 546, 737365. [Google Scholar] [CrossRef]
  3. Sun, F.; Wang, C.; Chen, X. Bacterial community in Sinonovacula constricta intestine and its relationship with culture environment. Appl. Microbiol. Biot. 2022, 106, 5211–5220. [Google Scholar] [CrossRef] [PubMed]
  4. Ullah Khan, F.; Shang, Y.; Chang, X.; Kong, H.; Zuberi, A.; Fang, J.K.H.; Liu, W.; Peng, J.; Zhang, X.; Hu, M.; et al. Effects of Ocean Acidification, Hypoxia, and Warming on the Gut Microbiota of the Thick Shell Mussel Mytilus coruscus Through 16S rRNA Gene Sequencing. Front. Mar. Sci. 2021, 8, 736338. [Google Scholar] [CrossRef]
  5. Chair, R.K.P.; Kingdom, M.R.A.U.; Argentina, V.R.B.; Kingdom, J.B.U.; Belgium, J.P.V.Y. Synthesis Report IPCC AR5; Synthesis Report IPCC AR5; IPCC: Paris, France, 2015. [Google Scholar]
  6. Caldeira, K.; Wickett, M.E. Oceanography: Anthropogenic carbon and ocean pH. Nature 2003, 425, 365. [Google Scholar] [CrossRef]
  7. Sun, B.; Lan, X.; Bock, C.; Shang, Y.; Hu, M.; Wang, Y. Effects of ocean acidification and warming on apoptosis and immune response in the mussel Mytilus coruscus. Fish Shellfish. Immun. 2025, 158, 110134. [Google Scholar] [CrossRef]
  8. Yang, L.; Lv, L.; Liu, H.; Wang, M.; Sui, Y.; Wang, Y. Effects of Ocean Acidification and Microplastics on Microflora Community Composition in the Digestive Tract of the Thick Shell Mussel Mytilus coruscus Through 16S RNA Gene Sequencing. Bull. Environ. Contam. Toxicol. 2020, 107, 616–625. [Google Scholar] [CrossRef]
  9. Fishery Administration Bureau, Ministry of Agriculture and Rural Affairs, National Fisheries Technology Extension Station. China Fishery Statistics Yearbook 2023; China Agriculture Press: Beijing, China, 2023. [Google Scholar]
  10. Thomsen, J.; Casties, I.; Pansch, C.; Körtzinger, A.; Melzner, F. Food availability outweighs ocean acidification effects in juvenile Mytilus edulis: Laboratory and field experiments. Glob. Chang. Biol. 2012, 19, 1017–1027. [Google Scholar] [CrossRef]
  11. Xu, X.; Yang, F.; Zhao, L.; Yan, X. Seawater acidification affects the physiological energetics and spawning capacity of the Manila clam Ruditapes philippinarum during gonadal maturation. Comp. Biochem. Phys. A 2016, 196, 20–29. [Google Scholar] [CrossRef]
  12. Callahan, B.J.; McMurdie, P.J.; Rosen, M.J.; Han, A.W.; Johnson, A.J.A.; Holmes, S.P. DADA2: High-resolution sample inference from Illumina amplicon data. Nat. Methods 2016, 13, 581. [Google Scholar] [CrossRef]
  13. Quast, C.; Pruesse, E.; Yilmaz, P.; Gerken, J.; Schweer, T.; Yarza, P.; Peplies, J.; Gloeckner, F.O. The SILVA ribosomal RNA gene database project: Improved data processing and web-based tools. Nucleic Acids Res. 2013, 41, D590–D596. [Google Scholar] [CrossRef] [PubMed]
  14. Price, M.N.; Dehal, P.S.; Arkin, A.P. FastTree 2—Approximately Maximum-Likelihood Trees for Large Alignments. PLoS ONE 2010, 5, e9490. [Google Scholar] [CrossRef] [PubMed]
  15. Segata, N.; Izard, J.; Waldron, L.; Gevers, D.; Miropolsky, L.; Garrett, W.S.; Huttenhower, C. Metagenomic biomarker discovery and explanation. Genome Biol. 2011, 12, R60. [Google Scholar] [CrossRef] [PubMed]
  16. Wang, B.; Khan, F.U.; Hu, M.; Wang, Y. Effects of feed satiation on energy metabolism in the mussel Mytilus coruscus under ocean acidification and warming and possible hormonal regulation. Aquaculture 2025, 604, 742440. [Google Scholar] [CrossRef]
  17. Liang, J.; Liu, Y.; Zhu, F.; Li, Y.; Liang, S.; Guo, Y. Impact of ocean acidification on the physiology of digestive gland of razor clams Sinonovacula constricta. Front. Mar. Sci. 2022, 9, 1010350. [Google Scholar] [CrossRef]
  18. Wang, W.; Huang, J.; Zhang, J.; Wang, Z.; Li, H.; Amenyogbe, E.; Chen, G. Effects of hypoxia stress on the intestinal microflora of juvenile of cobia (Rachycentron canadum). Aquaculture 2021, 536, 736419. [Google Scholar] [CrossRef]
  19. Zhang, M.; Wei, M.; Dong, Z.; Duan, H.; Mao, S.; Feng, S.; Li, W.; Sun, Z.; Li, J.; Yan, K.; et al. Fecal DNA isolation and degradation in clam Cyclina sinensis: Noninvasive DNA isolation for conservation and genetic assessment. BMC Biotechnol. 2019, 19, 99. [Google Scholar] [CrossRef]
  20. Green, T.J.; Barnes, A.C. Bacterial diversity of the digestive gland of Sydney rock oysters, Saccostrea glomerata infected with the paramyxean parasite, Marteilia sydneyi. J. Appl. Microbiol. 2010, 109, 613–622. [Google Scholar] [CrossRef]
  21. Shang, Y.; Wang, X.; Shi, Y.; Huang, W.; Sokolova, I.; Chang, X.; Chen, D.; Wei, S.; Khan, F.U.; Hu, M.; et al. Ocean acidificationf affects the bioenergetics of marine mussels as revealed by high-coverage quantitative metabolomics. Sci. Total Environ. 2023, 858, 160090. [Google Scholar] [CrossRef]
  22. Stechele, B.; Lavaud, R. Including ocean acidification effects on biocalcification through dynamic energy budget modelling. Ecol. Model. 2024, 496, 110816. [Google Scholar] [CrossRef]
  23. Lokmer, A.; Wegner, K.M. Hemolymph microbiome of Pacific oysters in response to temperature, temperature stress and infection. ISME J. 2015, 9, 670–682. [Google Scholar] [CrossRef] [PubMed]
  24. Chang, X.; Leung, J.Y.S.; Wang, T.; Hu, M.; Wang, Y. Ocean acidification disrupts the energy balance and impairs the health of mussels (Mytilus coruscus) by weakening their trophic interactions with microalgae and intestinal microbiome. Environ. Res. 2025, 276, 121493. [Google Scholar] [CrossRef] [PubMed]
  25. Wang, C.; Han, W.; Cheng, W.; Liu, D.; Wang, W.; Yan, B.; Gao, H.; Hu, G. Impact of Ocean Acidification on the Gut Histopathology and Intestinal Microflora of Exopalaemon carinicauda. Animals 2023, 13, 3299. [Google Scholar] [CrossRef] [PubMed]
  26. Li, Y.; Xu, J.; Chen, Y.; Ding, W.; Shao, A.; Liang, X.; Zhu, Y.; Yang, J. Characterization of Gut Microbiome in the Mussel Mytilus galloprovincialis in Response to Thermal Stress. Front. Physiol. 2019, 10, 1086. [Google Scholar] [CrossRef]
  27. Liu, M.; Guo, X.; Han, L.; Zhao, Y.; Ge, C. Effects of ocean acidification on intestinal homeostasis and organismal performance in a marine bivalve: From microbial shifts to physiological suppression. Mar. Pollut. Bull. 2025, 222, 118704. [Google Scholar] [CrossRef]
  28. Conceicao, M.V.R.; Costa, S.S.; Schaan, A.P.; Ribeiro-dos-Santos, A.K.C.; Silva, A.; Gracas, D.A.D.; Schneider, M.P.C.; Barauna, R.A. Amazonia Seasons Have an Influence in the Composition of Bacterial Gut Microbiota of Mangrove Oysters (Crassostrea gasar). Front. Genet. 2021, 11, 602608. [Google Scholar] [CrossRef]
  29. Pierce, M.L.; Ward, J.E. Gut Microbiomes of the Eastern Oyster (Crassostrea virginica) and the Blue Mussel (Mytilus edulis): Temporal Variation and the Influence of Marine Aggregate-Associated Microbial Communities. Msphere 2019, 4, e00730-19. [Google Scholar] [CrossRef]
  30. Sumithra, T.G.; Sharma, K.S.R.; Gangadharan, S.; Suresh, G.; Prasad, V.; Amala, P.V.; Sayooj, P.; Gop, A.P.; Anil, M.K.; Patil, P.K.; et al. Dysbiosis and Restoration Dynamics of the Gut Microbiome Following Therapeutic Exposure to Florfenicol in Snubnose Pompano (Trachinotus blochii) to Aid in Sustainable Aquaculture Production Strategies. Front. Microbiol. 2022, 13, 881275. [Google Scholar] [CrossRef]
  31. Xu, Y. Pathogenic Pathology of Black Body Disease in Farmed Grouper and Analysis of Gut Microbiota Structure Under Drug Intervention. Master’s Thesis, Shanghai Ocean University, Shanghai, China, 2017; p. 65. [Google Scholar]
  32. Wei, Z.; Zhao, L.; Wang, S.; Chang, L.; Shi, J.; Kong, X.; Li, M.; Lin, J.; Zhang, W.; Bao, Z.; et al. Paralytic shellfish toxins producing dinoflagellates cause dysbacteriosis in scallop gut microbial biofilms. Ecotoxicol. Environ. Saf. 2024, 273, 116146. [Google Scholar] [CrossRef]
  33. Xia, B.; Wu, W.; Fang, W.; Wen, X.; Xie, J.; Zhang, H. Heat stress-induced mucosal barrier dysfunction is potentially associated with gut microbiota dysbiosis in pigs. Anim. Nutr. 2022, 8, 289–299. [Google Scholar] [CrossRef]
  34. Li, D.; Miao, J.; Pan, L.; Zhou, Y.; Gao, Z.; Yang, Y.; Xu, R.; Zhang, X. Impacts of benzo (a) pyrene exposure on scallop (Chlamys farreri) gut health and gut microbiota composition. Sci. Total Environ. 2021, 799, 149471. [Google Scholar] [CrossRef]
  35. Ley, R.E.; Turnbaugh, P.J.; Klein, S.; Gordon, J.I. Microbial ecology—Human gut microbes associated with obesity. Nature 2006, 444, 1022–1023. [Google Scholar] [CrossRef] [PubMed]
  36. Tian, Y.M.; Guan, Y.; Tian, S.Y.; Yuan, F.; Zhang, L.; Zhang, Y. Short-term Chronic Intermittent Hypobaric Hypoxia Alters Gut Microbiota Composition in Rats. Biomed. Environ. Sci. BES 2018, 31, 898–901. [Google Scholar] [PubMed]
  37. Huang, Q.C.; Tan, B.P.; Dong, X.H.; Zhang, S.; Yang, H.Q.; Chi, J.Y. Effect of chitosan oligosaccharide and mycotoxin adsorbents on intestinal mucosa structure and gut flora of Litopenaeus vannamei. J. Fish. Sci. China 2018, 25, 373–383. [Google Scholar] [CrossRef]
  38. Bowman, J.P. Bioactive compound synthetic capacity and ecological significance of marine bacterial genus Pseudoalteromonas. Mar. Drugs 2007, 5, 220–241. [Google Scholar] [CrossRef]
  39. Chang, Y.; Huang, W.; Wu, P.; Kumar, R.; Wang, H.; Lu, H. Low salinity stress increases the risk of Vibrio parahaemolyticus infection and gut microbiota dysbiosis in Pacific white shrimp. BMC Microbiol. 2024, 24, 275. [Google Scholar] [CrossRef]
  40. McConnell, M.J.; Actis, L.; Pachon, J. Acinetobacter baumannii: Human infections, factors contributing to pathogenesis and animal models. FEMS Microbiol. Rev. 2013, 37, 130–155. [Google Scholar] [CrossRef]
  41. Pond, M.J.; Stone, D.M.; Alderman, D.J. Comparison of conventional and molecular techniques to investigate the intestinal microflora of rainbow trout (Oncorhynchus mykiss). Aquaculture 2006, 261, 194–203. [Google Scholar] [CrossRef]
  42. He, S.; Zhou, Z.; Liu, Y.; Shi, P.; Yao, B.; Ringo, E.; Yoon, I. Effects of dietary Saccharomyces cerevisiae fermentation product (DVAQUA) on growth performance, intestinal autochthonous bacterial community and non-specific immunity of hybrid tilapia (Oreochromis niloticus ♀ × O. aureus ♂ cultured in cages). Aquaculture 2009, 294, 99–107. [Google Scholar] [CrossRef]
  43. Zhou, Z.; Liu, Y.; Shi, P.; He, S.; Yao, B.; Ringo, E. Molecular characterization of the autochthonous microbiota in the gastrointestinal tract of adult yellow grouper (Epinephelus awoara) cultured in cages. Aquaculture 2009, 286, 184–189. [Google Scholar] [CrossRef]
  44. Wu, S.; Tian, J.; Wang, G.; Li, W.; Zou, H. Characterization of bacterial community in the stomach of yellow catfish (Pelteobagrus fulvidraco). World J. Microb. Biot. 2012, 28, 2165–2174. [Google Scholar] [CrossRef]
  45. Romero-Freire, A.; De Marchi, L.; Freitas, R.; Velo, A.; Babarro, J.M.F.; Cobelo-Garcia, A. Ocean acidification impact on the uptake of trace elements by mussels and their biochemical effects. Aquat. Toxicol. 2024, 269, 106882. [Google Scholar] [CrossRef]
  46. Pankratov, T.A.; Kirsanova, L.A.; Kaparullina, E.N.; Kevbrin, V.V.; Dedysh, S.N. Telmatobacter bradus gen. nov., sp. nov., a cellulolytic facultative anaerobe from subdivision 1 of the Acidobacteria, and emended description of Acidobacterium capsulatum Kishimoto et al. 1991. Int. J. Syst. Evol. Microbiol. 2012, 62, 430–437. [Google Scholar] [CrossRef]
  47. Sun, S.; Su, Y.; Yu, H.; Ge, X.; Zhang, C. Starvation affects the intestinal microbiota structure and the expression of inflammatory-related genes of the juvenile blunt snout bream, Megalobrama amblycephala. Aquaculture 2020, 517, 734764. [Google Scholar] [CrossRef]
  48. Liu, X.; Liu, J.; Xiong, K.; Zhang, C.; Fang, J.K.; Song, J.; Tai, Z.; Zhu, Q.; Hu, M.; Wang, Y. Effects of Ocean Acidification on Molting, Oxidative Stress, and Gut Microbiota in Juvenile Horseshoe Crab Tachypleus tridentatus. Front. Physiol. 2022, 12, 813582. [Google Scholar] [CrossRef]
  49. Han, S.; Zheng, Y.; Yu, Z.; Fu, Q.; Lian, X.; Wang, L.; Song, L. Comparative characterization of bacterial communities in digestive glands of Crassostrea gigas fed with different microalgal diets. ISJ-Invertebr. Surviv. J. 2020, 17, 51. [Google Scholar]
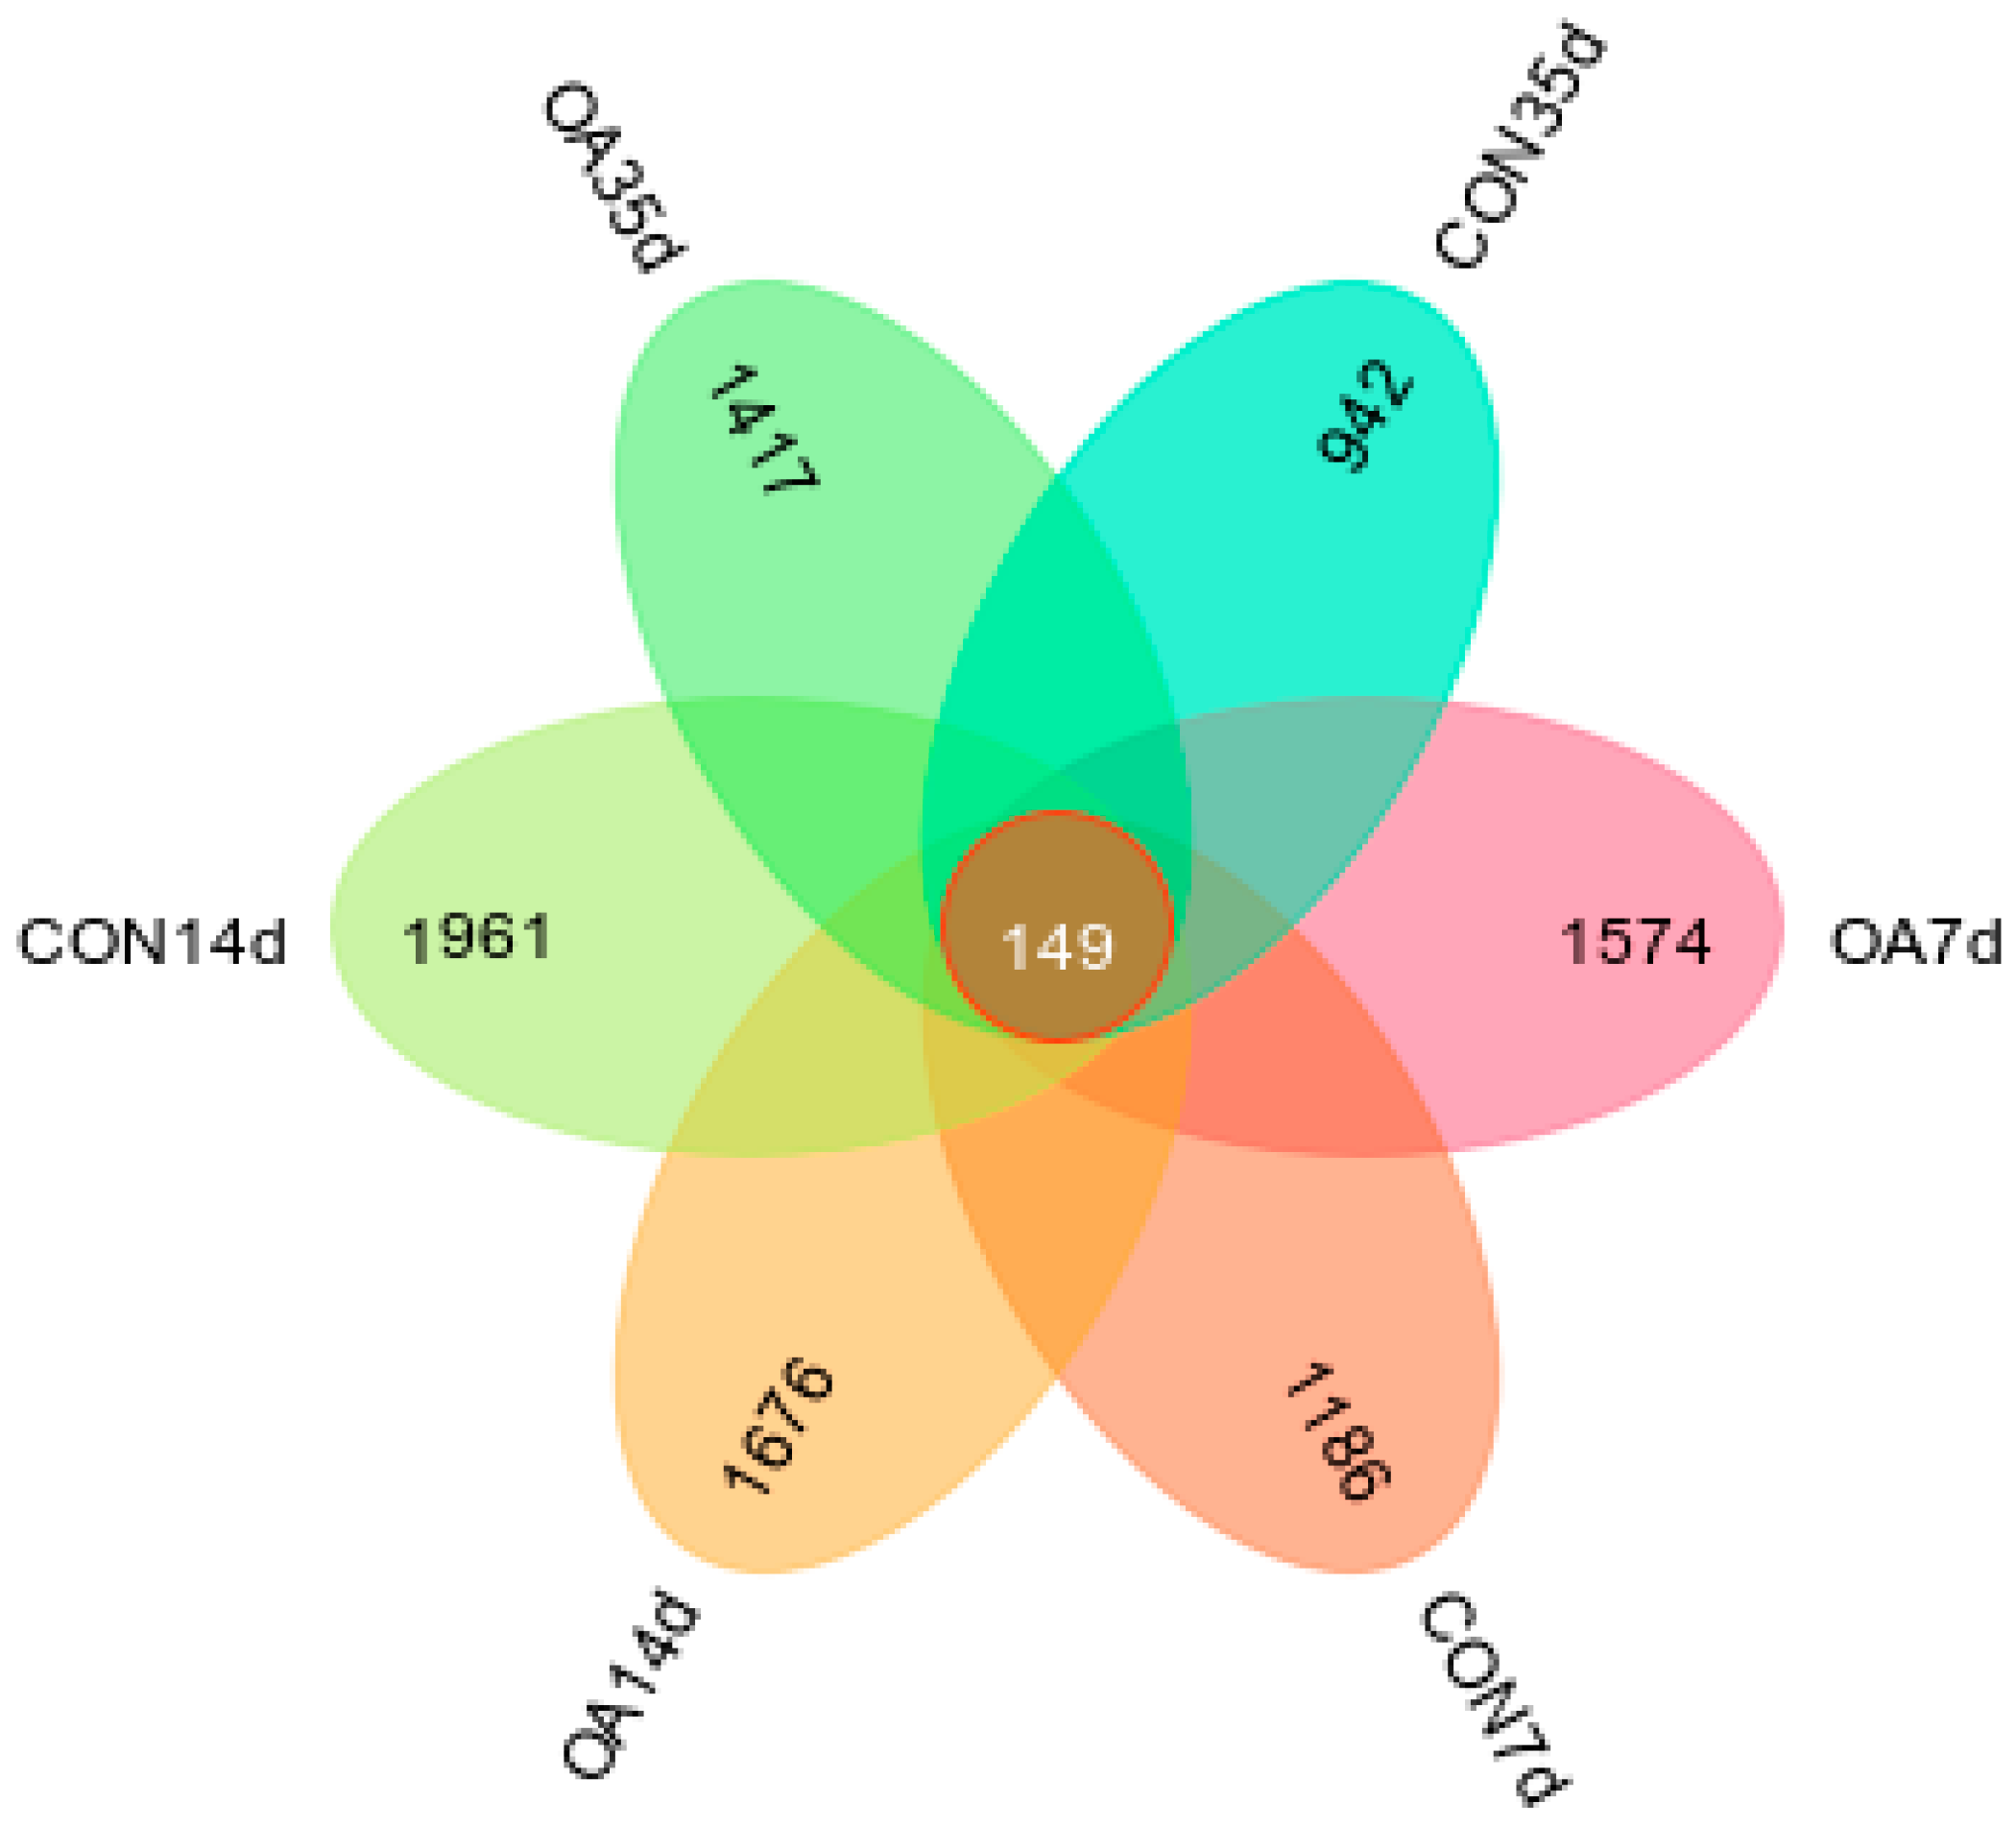
Figure 1. Petal diagram depicting the number of shared and unique ASVs among six groups (OA = ocean acidification; CON = control).
Fishes 10 00571 g001
Figure 2. Rarefaction curves of the Chao1 index (A), and Shannon index (B), (OA = ocean acidification; CON = control).
Fishes 10 00571 g002
Figure 3. Chao1 and Shannon indices at different time points for the OA and CON groups (OA = ocean acidification; CON = control).
Fishes 10 00571 g003
Figure 4. PCoA analysis of intestinal microflora diversity indices based on the Bray–Curtis distance metric (OA = ocean acidification; CON = control).
Fishes 10 00571 g004
Figure 5. Relative abundance of intestinal microflora phyla in the OA and CON groups, showing the top 10 most abundant phyla, with the remainder indicated as “Other” (A), Relative abundance of Proteobacteria, Cyanobacteria, and Firmicutes in each group (B) (OA = ocean acidification; CON = control).
Fishes 10 00571 g005
Figure 6. Relative abundance of intestinal microflora genera in the OA and CON groups, showing the top 10 most abundant genera, with the remainder indicated as “Other” (OA = ocean acidification; CON = control).
Fishes 10 00571 g006
Figure 7. LEfSe analysis revealed differences in microbial communities between the 7-day (A), 14-day (B), and 35-day (C) acidification groups and the control group, with an LDA score threshold >3.5. (I) Bar chart showing the log10-transformed LDA scores of microbial community taxonomic groups. (II) Phylogenetic tree illustrating the phylogenetic relationships among microbial community taxonomic groups (OA = ocean acidification; CON = control).
Fishes 10 00571 g007
Figure 8. Based on PICRUSt2 and STAMP analyses, significant differences were observed in the functional pathways between the acidification and control groups. The p-value is derived from a Welsh t-test and remains uncorrected. Specifically, (A), (B), and (C) denote the functional pathway differences between the 7 d, 14 d, and 35 d groups, respectively (OA = ocean acidification; CON = control).
Fishes 10 00571 g008
Disclaimer/Publisher’s Note: The statements, opinions and data contained in all publications are solely those of the individual author(s) and contributor(s) and not of MDPI and/or the editor(s). MDPI and/or the editor(s) disclaim responsibility for any injury to people or property resulting from any ideas, methods, instructions or products referred to in the content.