Article

The Tasmanian Estuary Perch Population—A Threatened Species?

1
Inland Fisheries Service, 17 Back River Road, New Norfolk, TAS 7140, Australia
2
Austral Fisheries, 53 Dutton Street, Cairns, QLD 4870, Australia
3
Institute for Marine and Antarctic Studies, Launceston, University of Tasmania, Private Bag 1370, Launceston, TAS 7250, Australia
4
Dr Fish Consulting Services, 9 Floreat Crescent, Trevallyn, TAS 7250, Australia
*
Author to whom correspondence should be addressed.
Fishes 2025, 10(1), 31; https://doi.org/10.3390/fishes10010031
Submission received: 11 December 2024 / Revised: 10 January 2025 / Accepted: 13 January 2025 / Published: 15 January 2025

Abstract

:
Estuary perch (Percalates colonorum) are a long-lived and slow-growing species which are distributed throughout southeastern Australian estuaries. In Tasmania, only one known population remains which is located in the Arthur River, on the remote northwest coast. Tasmania is the only Australian state to list estuary perch as a wholly protected species (recreational and commercial), while other populations across their mainland distribution appear to be robust. A survey undertaken on estuary perch in the Arthur River in 2014–2015 indicated that the population was small (825–2375 fish) and dominated by three age classes between 12 and 14 years old. This population also has extremely low genetic diversity and is genetically distinct to mainland populations due to its geographic isolation. During a re-survey in December 2023, 378 estuary perch were captured, with 191 tagged and released, and 31 fish retained for age and gonad analysis. Although three strong age classes were detected (five, eight and twenty-three years), numerous weak and missing cohorts were apparent. This study also confirms this population has a delayed spawning season in comparison to mainland populations, with growth models and tag recaptures (32 fish) demonstrating a very slow but sexually dimorphic growth rate. By combining the datasets of the 2014/15 and 2023 survey, we present an updated understanding of the biology and population dynamics of this unique Tasmanian population, which has previously never been published. The results confirm the population is still reproductively active and stable; however, due to their restricted distribution, variable recruitment, slow growth, and small population, further conservation efforts are still required. Further legislative listings at both the state and federal levels are possible, which if progressed could provide additional protection and assist in applications for external funding and resources. This will support the development of a recovery plan which will consider re-stocking efforts and re-establishment of previously inhabited waters and investigate potential actions to improve the genetics of the Tasmanian population. Additionally, educational campaigns to inform the public and recreational fishers on the status of estuary perch in Tasmania will be undertaken.
Key Contribution: The estuary perch population is still reproductively active and stable in the Arthur River; however, the population appears to be small and requires further conservation efforts.

1. Introduction

Estuary perch, Percalates colonorum (Günther 1863) are a catadromous native fish that are distributed throughout riverine estuaries of southeastern Australia. Although being relatively long lived (>40 years), individuals typically inhabit a single estuary for their entire lifespan. On mainland Australia, estuary perch are a popular angling species and are known for their strong fighting ability and excellent eating qualities, as well as readily taking a range of baits and lures [1,2,3]. Their popularity as a quality sports fish in Victoria has resulted in a successful stock enhancement programme as a way of conserving existing populations and diversifying recreational fishing opportunities.
Adults form annual spawning aggregations in lower estuarine habitats for 1–3 months between late winter and early summer depending on temperature-driven latitudinal effects. However, due to environmental influences on the buoyancy, survival, and retention of eggs/larvae in estuaries, recruitment is unpredictable and highly variable, with many populations displaying strong, weak, and missing cohorts [4,5]. Coupled with limited inter-estuarine recruitment and movement of adults, long periods of weak or failed recruitment increase the risk of insufficient egg production and poor genetic diversification, impacting a population’s ability to remain self-sustaining.
The combined effects of estuary perch’s morphology, catadromous migration and spawning aggregation behaviour also makes the species highly susceptible to gillnet capture. In Tasmania, commercial and recreational gillnetting in estuaries was relatively common during the 1950s–1980s and may have caused estuary perch stocks to become overfished.
Historically, estuary perch were distributed across other estuaries of northern Tasmania, but today these populations have disappeared, with only one known remnant population remaining within the Arthur River. The Arthur River estuary is located on the northwest coast of Tasmania and is one of the most remote and untouched waterways in Tasmania, with no records of damming. The estuary is large (exceeding 14 km) and the upper freshwater component spreads into a network of tributaries, reaching 180 km in length [6].
The Arthur River estuary perch population is the southern-most latitudinal population of the species, with recent genetic work highlighting that in addition to being genetically and geographically isolated from mainland populations, its genetic diversity is very low [7]. This suggests that the Arthur River population probably experienced a near extinction event about 20–30 years ago, with the few surviving individuals rebounding a new founder population in recent times from strong recruitment events in the early 2000s.
In 2014/15, an initial survey was undertaken to determine the stock structure, population size, reproductive biology, and growth of estuary perch in the Arthur River [4]. This survey found that the population size was estimated to be quite small (825 to 2375), with an age structure dominated (68%) by three age classes between 12 and 14 years of age. The survivors of these dominant cohorts would now be 21 to 23 years of age, and up until 2023, it was unknown whether successful recruitment events had occurred since the 2014/15 survey. Taking these population characteristics into account, estuary perch were listed as a “Protected” species, under Section 131 of the Inland Fisheries Act 1995 in 2019, which means they cannot be taken recreationally or commercially without an exemption permit. Tasmania is the only Australian state to list estuary perch as a wholly protected species.
Due to the need for ongoing population monitoring, conservation, and potential rehabilitation efforts, a re-survey of the existing population was undertaken in 2023 to determine the current population structure and confirm if it is still self-recruiting. An additional number of estuary perch were also tagged for future monitoring efforts. A small number of fish were retained to add to the current existing biological dataset and to assist the development of robust population dynamic models to inform future management strategies. By combining the results of the 2014/15 and 2023 survey, an updated understanding of the biology and population dynamics of this unique Tasmanian population was achieved, which was previously lacking.
In summary, the collective objectives of the two surveys were to determine key biological population dynamic parameters for the Arthur River estuary perch stock, in particular to (1) obtain estimates of stock size (based on mark-recapture methods), (2) determine the body size and age stock structure of estuary perch and develop growth models, (3) investigate the reproductive dynamics and capacity of the estuary perch stock in the Arthur River, and (4) use this baseline information to inform future conservation and management efforts for the species.

2. Materials and Methods

2.1. Capture Techniques and Effort

In 2014/15, estuary perch were sampled from the Arthur River (41°02′57.3″ S 144°40′11.8″ E) between December 2014 and August 2015. A total of four trips were undertaken which were two to four days long (3–4 December 2014, 5–8 January 2015, 26–28 March 2015, 11–14 August 2015). Two rod and reels and various gill nets with approximate lengths of 20 to 100 m were used, with mesh sizes ranging from 2.5″ to 4.5″. As gear selectivity was not a key aim of this survey, specific details of gill net lengths, numbers, and mesh sizes used were not recorded. In 2023, a re-survey was undertaken from 11 to 15 December. A range of gear types were used which included two rods and reels, two box traps, six fyke nets, and seven gill nets. For consistency, a similar mesh size range of gill nets was used (2.5″ to 4″) in comparison to the 2014/15 survey, with trammel gill nets used specifically due to their lower selectivity and higher catch rates [8]. The gill nets consisted of three 35 m and two 92 m trammel gill nets (4″ inner mesh and 24″ outer mesh), one 100 m 3″ multi-monofilament gill net, and one 50 m 2.5″ monofilament gill net. The initial 2014/15 survey design was opportunistic and focused on investigating the population dynamics of estuary perch in the Arthur River. Sampling was focused during the evening (18:00 to 21:00) and explored seasonal trends [4]. The 2023 survey design was structured around reassessing the population size and to obtain a snapshot of the size structure. Sampling was undertaken both during the day (11:00 to 16:00) and evening (18:00 to 21:00). Effort occurred throughout a 2.3 km stretch of the lower estuarine section of the river (Figure 1). Gill nets were set for a period of between 30 min and 2.5 h, and mostly set parallel to the shore ensuring both ends of the net came up onto the shore. Shorelines consisting of rock, sunken timber, and macrophyte were targeted (Figure 2a). Box traps were set during the day for soak times of 0.7 to 7 h, either parallel to the shore due to steep banks or set across the mouths of creeks. Small fyke nets were set overnight on the edges of the shoreline amongst macrophyte (Figure 2b). The box traps and small fyke nets were used to specifically target juvenile and young of the year estuary perch. Fishing effort was standardised to 100 m of net per hour for gillnets and per hour for box, fyke net and rod and reel fishing.

2.2. Catch and Release Process

Prior to retrieving set gillnets, a holding tank (250 L) was continuously pumped with fresh river water through a spray bar, to a point of overflowing. Excess water would then run onto the deck of the boat and out through the scuppers. Captured fish were cut from the mesh gill nets using knives and scissors. These fish were then placed into the holding tank until all remaining fish had been removed from the net and were then subsequently processed. The 2023 survey aimed to catch and double tag up to 200 individuals (~10% of the estimated population size); however, due to a higher-than-expected catch rate, not all individuals captured were tagged due to logistical and animal welfare constraints. All captured, estuary perch had their fork length (±1 mm) and where possible sex and reproductive maturity recorded. Sex and reproductive maturity were assigned by inspecting the urogenital opening structures near the anus [4] (Figure 3a). External sex determination was validated by internal examinations of the retained fish, with 100% accuracy. Fish destined for tagging had two t- bar tags inserted at the base of the anterior dorsal fin with their sex and presence of free-flowing milt in males or ovulation in females recorded prior to release (Figure 3b–d).

2.3. Retained Fish Process

In total, 90 estuary perch were retained during the 2014/15 survey, while 31 were retained during the 2023 survey. Selected estuary perch were euthanised using a bath containing clove oil (2 mL per 30 L) and placed in an ice slurry, prior to being frozen for later processing. In the laboratory, retained fish were thawed, had their total weight (±1 g TW) fork length (±1 mm FL), sex, gonad weight (±0.1 g GW) and macroscopic reproductive stage (Table 1) recorded, and samples of sagittal otoliths taken. Gonadosomatic Indices (GSIs) were calculated as follows: GSI = (Gonad weight/total weight) × 100.
Sagittal otoliths were removed, cleaned, and dried prior to being embedded in resin and transversely sectioned (250–300 µm). Sectioned otoliths were mounted on glass slides, viewed and photographed using a microscope with transmitted lighting. Otoliths were read by counting the number of opaque zones on the dorsal side of the otolith and otolith margin classified as opaque, narrow, or wide (Figure 4). As the sampling dates coincided with the increment formation period, count data were adjusted by 1+ when an individual possessed a wide or opaque margin.

2.4. Data Analysis

Differences between the mean day and evening catch per unit effort for the 2023 survey were tested using a T.test. Chi square tests were performed to assess if sex ratios were different from an expected 1:1 male/female ratio for individual gillnet sets which caught 10 or more individuals. This was to test for sex-specific schooling behaviour. An overall sex ratio for all fish caught during the survey was also investigated. Biological and tag recapture data from the 2014/15 survey were collated with the 2023 survey and used to generate a length–weight relationship and sex-specific growth curves and enable comparisons of size and age structure between survey years. Growth was determined by fitting sex-specific size at age data to the Von Bertalanffy growth model, where Lt = L [1 − e − K(t − t0)], and where Lt is the fork length at age t, L is the asymptotic fork length, k is the growth rate, and t0 is the theoretical age at zero length. Model parameters were estimated by ordinary least squares regression with differences in sex-specific growth models being confirmed by an analysis of the residual sum of squares test [9]. Individual growth trajectories from 34 recapture events since being tagged in 2014–2015 (22 recreational fisher recaptures and 12 recaptures from this study) were projected by using the initial size at capture (Lt of tagging) and age-transformed Von Bertalanffy growth equation [tat tagging = t0 − (1/K)ln (1 − Lt/L)] [10] with sex-specific parameters to estimate the initial age at tagging. Age at recapture was determined by adding the liberty period to the initial age at tagging estimate.

3. Results

3.1. Catch Effort

During the 2014/15 survey, a total of 189 estuary perch were caught, with 85 fish tagged and released. The majority of estuary perch were caught with gill nets, and a small proportion were caught using a rod and line.
During the 2023 survey, 378 perch were captured, with 191 fish tagged and released, while 146 were processed and released untagged. Trammel gillnet sets (4″ inner and 24″ outer mesh) captured the majority of fish (82%), followed by the 2.5″ monofilament gillnet (16%), the 3″ multi-monofilament gillnet (0.53%), and the box traps (0.26%) (Figure 5). Attempts to capture young of the year using fyke nets and box traps despite setting for a total of 274 net hours were unsuccessful. Similarly, the rod and line fishing effort did not capture any estuary perch (Figure 5).
During the 2023 survey, the catches of estuary perch during the day were markedly less than the evening, despite a higher amount of effort during daylight hours (Table 2). Trammel gill nets were the main gill nets used during the day and evening, with smaller meshed gill nets (2.5″ and 3″) used in much smaller amounts. A total of 109 estuary perch were caught during the day sets, while a total of 271 fish were caught in evening sets. Nine of the day sets (45%) failed to catch any estuary perch, whereas only one night set (5%) failed to catch any estuary perch. The catch of 70 fish during the day on the fifth day of the trip was significantly higher than the other day catches due to the capture of 63 fish in a single gill net set. This was the most fish caught in a single net in both day and evening sets. Day five also had the most fish captured in an evening at 76 fish, which resulted in the largest total daily catch of the trip with 146 fish. The highest CPUE for the trip was reached on the first evening of sampling, resulting in an average of 99.5 estuary perch per 100 m net hour. Daytime CPUE was significantly less than sampling in the evening, with a mean daytime CPUE of 3.1 estuary perch per 100 m net hour compared to 39.7 estuary perch per 100 m net hour in the evenings (Table 2).
During the 2014/14 survey, sampling was mainly undertaken in the evenings due to the observed low catch rates in gill nets set during the day.
Of the 42 gillnet sets retrieved during the 2023 survey, 2 daytime and 10 evening sets had catches greater than 10, which enabled further investigations into sex-specific schooling behaviour. Chi square tests on the sex ratio of these catches indicated several significantly different results, with five of these schools being significantly male-dominated, four significantly female-dominated, and three having a relatively even split of sex with no significant difference in sex ratio (Figure 6). Overall, there were 166 female and 212 male individuals caught with no detectable difference in a 1:1 sex ratio from the total catch numbers (p = 0.224). This was in contrast to the 2014/15 survey, where there were 96 female and 62 male individuals which were found to be significantly different to a 1:1 sex ratio (p = 0.03). Individual biological information per net sets was not collected during the 2014/15 survey; therefore, sex-specific schooling behaviour was not able to be investigated.

3.2. Biological Information

Female estuary perch caught during the 2023 survey ranged in size from 226 to 470 mm, whereas males ranged in size from 199 to 366 mm (Figure 7). Although the overall size range encountered in the 2023 survey was similar to the fish caught during the 2014/15 survey, the length frequency distributions between studies were markedly different (Figure 7). Despite the wide size range in the 2023 survey, most females (65%) were relatively small (280–300 mm). This marked size truncation was not as evident in males, where the predominant size distribution of male fish (75%) was broad (240–320 mm). This was in contrast with the length frequency distribution observed in the 2014/15 survey, where most females (67%) were between 350 and 390 mm, while most male fish (74%) were between 290 and 330 mm. During the 2023 survey, several females (n = 7) attained a larger maximum size than the biggest male fish. Similarly, the mean size (304 vs. 284 mm F:M) and modal peaks (290 vs. 270 mm F:M) were also larger for females (Figure 7b).
The length–weight relationship of estuary perch caught during the 2023 survey showed no signs of a sex-specific trend, with fish ranging in weight from 150 g (male 199 mm) to 1820 g (female 470 mm), and was consistent with the 2014/15 survey (Figure 8).
Of the 212 male fish caught during the 2023 survey, 210 (99%) could be staged externally and classed as ripe (Stage 4) including several small males (n = 15) between 199 and 220 mm with milt freely flowing from the urogenital pore. The two individuals that were not milted at capture measured 220 mm and 310 mm, respectively. The GSI of dissected males ranged from 1.6 to 8.9% with a mean GSI of 5.2%. In contrast to males, only 5% of females of the 166 encountered could be staged externally, with nine females being ovulated at the time of capture. All females retained for dissection were reproductively active, with 9 individuals (47%) possessing fully mature ovaries (Stage 3) and 12 individuals (63%) possessing ovulated ovaries (Stage 5). The smallest reproductively active female was an ovulated individual measuring 273 mm. The GSI of dissected females ranged from 4.5 to 12.8% with a mean of 8.9%. Reproductive stage had a marked influence on GSI, with Stage 3 fish having a smaller GSI (3.2–8.7% n = 9) than Stage 5 fish (12.1–12.9% n = 3).
Given that the 89 fish retained during the 2014/15 survey were collected over three months (December, March, August), only fish captured in December 2014 were used for comparison with the 2023 survey. Eight males and twenty-four females were captured in December 2014. All males captured were sexually mature, with seven of the eight (88%) classed as ripe (Stage 4), and the remaining one possessing fully mature ovaries (Stage 3). Of the 24 females retained, all were reproductively active, with 22 individuals (92%) possessing fully mature ovaries (Stage 3) and 2 individuals (8%) possessing ovulated ovaries (Stage 5). The GSI of dissected males ranged from 4.4 to 8.1%, with a mean GSI of 6.6%, while the GSI of females ranged from 6.2 to 11.3%, with a mean GSI of 9.1%. The smallest reproductively active female measured 290 mm with a GSI of 8%, while the smallest mature male was 200 mm with a GSI of 2.5%.
Pooling the data between the two surveys highlighted a clear seasonal relationship with peak GSI values in December and low GSI values in other months (Figure 9a,b). The relationship between reproductive stage and fish size from the pooled survey data is also presented in Figure 9c,d.

3.3. Ageing and Cohorts

Age determinations from the 31 retained estuary perch from the 2023 survey indicated that there were three strong cohorts present (Figure 10): an eight-year-old-cohort consisting of seven females (274–302 mm) and four males (240–254 mm) accounting for 35% of the retained fish, followed by a 23-year-old-cohort (23%) consisting of two females (379–426 mm) and five males (304–357 mm), and lastly a five-year-old-cohort (16%) consisting of five males (199–210 mm). Small numbers of fish at 6, 10, 11, 14–16, and 28 years were also present (Total N = 8). Estuary perch of the ages 0–4, 7, 9, 12, 13, 17–22, and 24–27 were not detected.
Although the overall size range encountered in this survey was similar to the 2014/15 survey, the age frequency distributions between studies were markedly different. However, due to the difference in sample sizes of fish retained between the surveys, care should be taken when interpreting these results. From the 81 estuary perch retained during the 2014/15 survey, three dominant cohorts were observed (Figure 10): a 13-year-old-cohort consisting of twenty-three females (344–410 mm) and seven males (280–379 mm) accounting for 40% of the retained fish, followed by a 12-year-old-cohort (19%) consisting of 11 females (322–398 mm) and three males (295–335 mm), and lastly a 14-year-old-cohort (12%) consisting of seven females (364–410 mm) and two males (325–338 mm). A small percentage (11%) of four-year-old fish were present, as well as small numbers of fish from 5 to 8, 10 to 11, 19, and 33 to 34 years. Estuary perch of the ages 0–3, 9, 15–18, and 20–32 years were not detected.
Size at age data indicated that sex-specific variation in growth is evident, with females being larger than males at the same age. Data from both surveys were pooled and plotted on the same axes (Figure 11). Analysis of residual sums of squares test on sex-specific growth models from pooled data confirmed a significant difference (p < 0.001) in growth between sexes, with the Von Bertalanffy growth parameters being L = 469 cm FL, k = 0.10, and t0 = −2.91 for females and L = 359 cm FL, k = 0.12, and t0 = −2.11 for males (Figure 11).

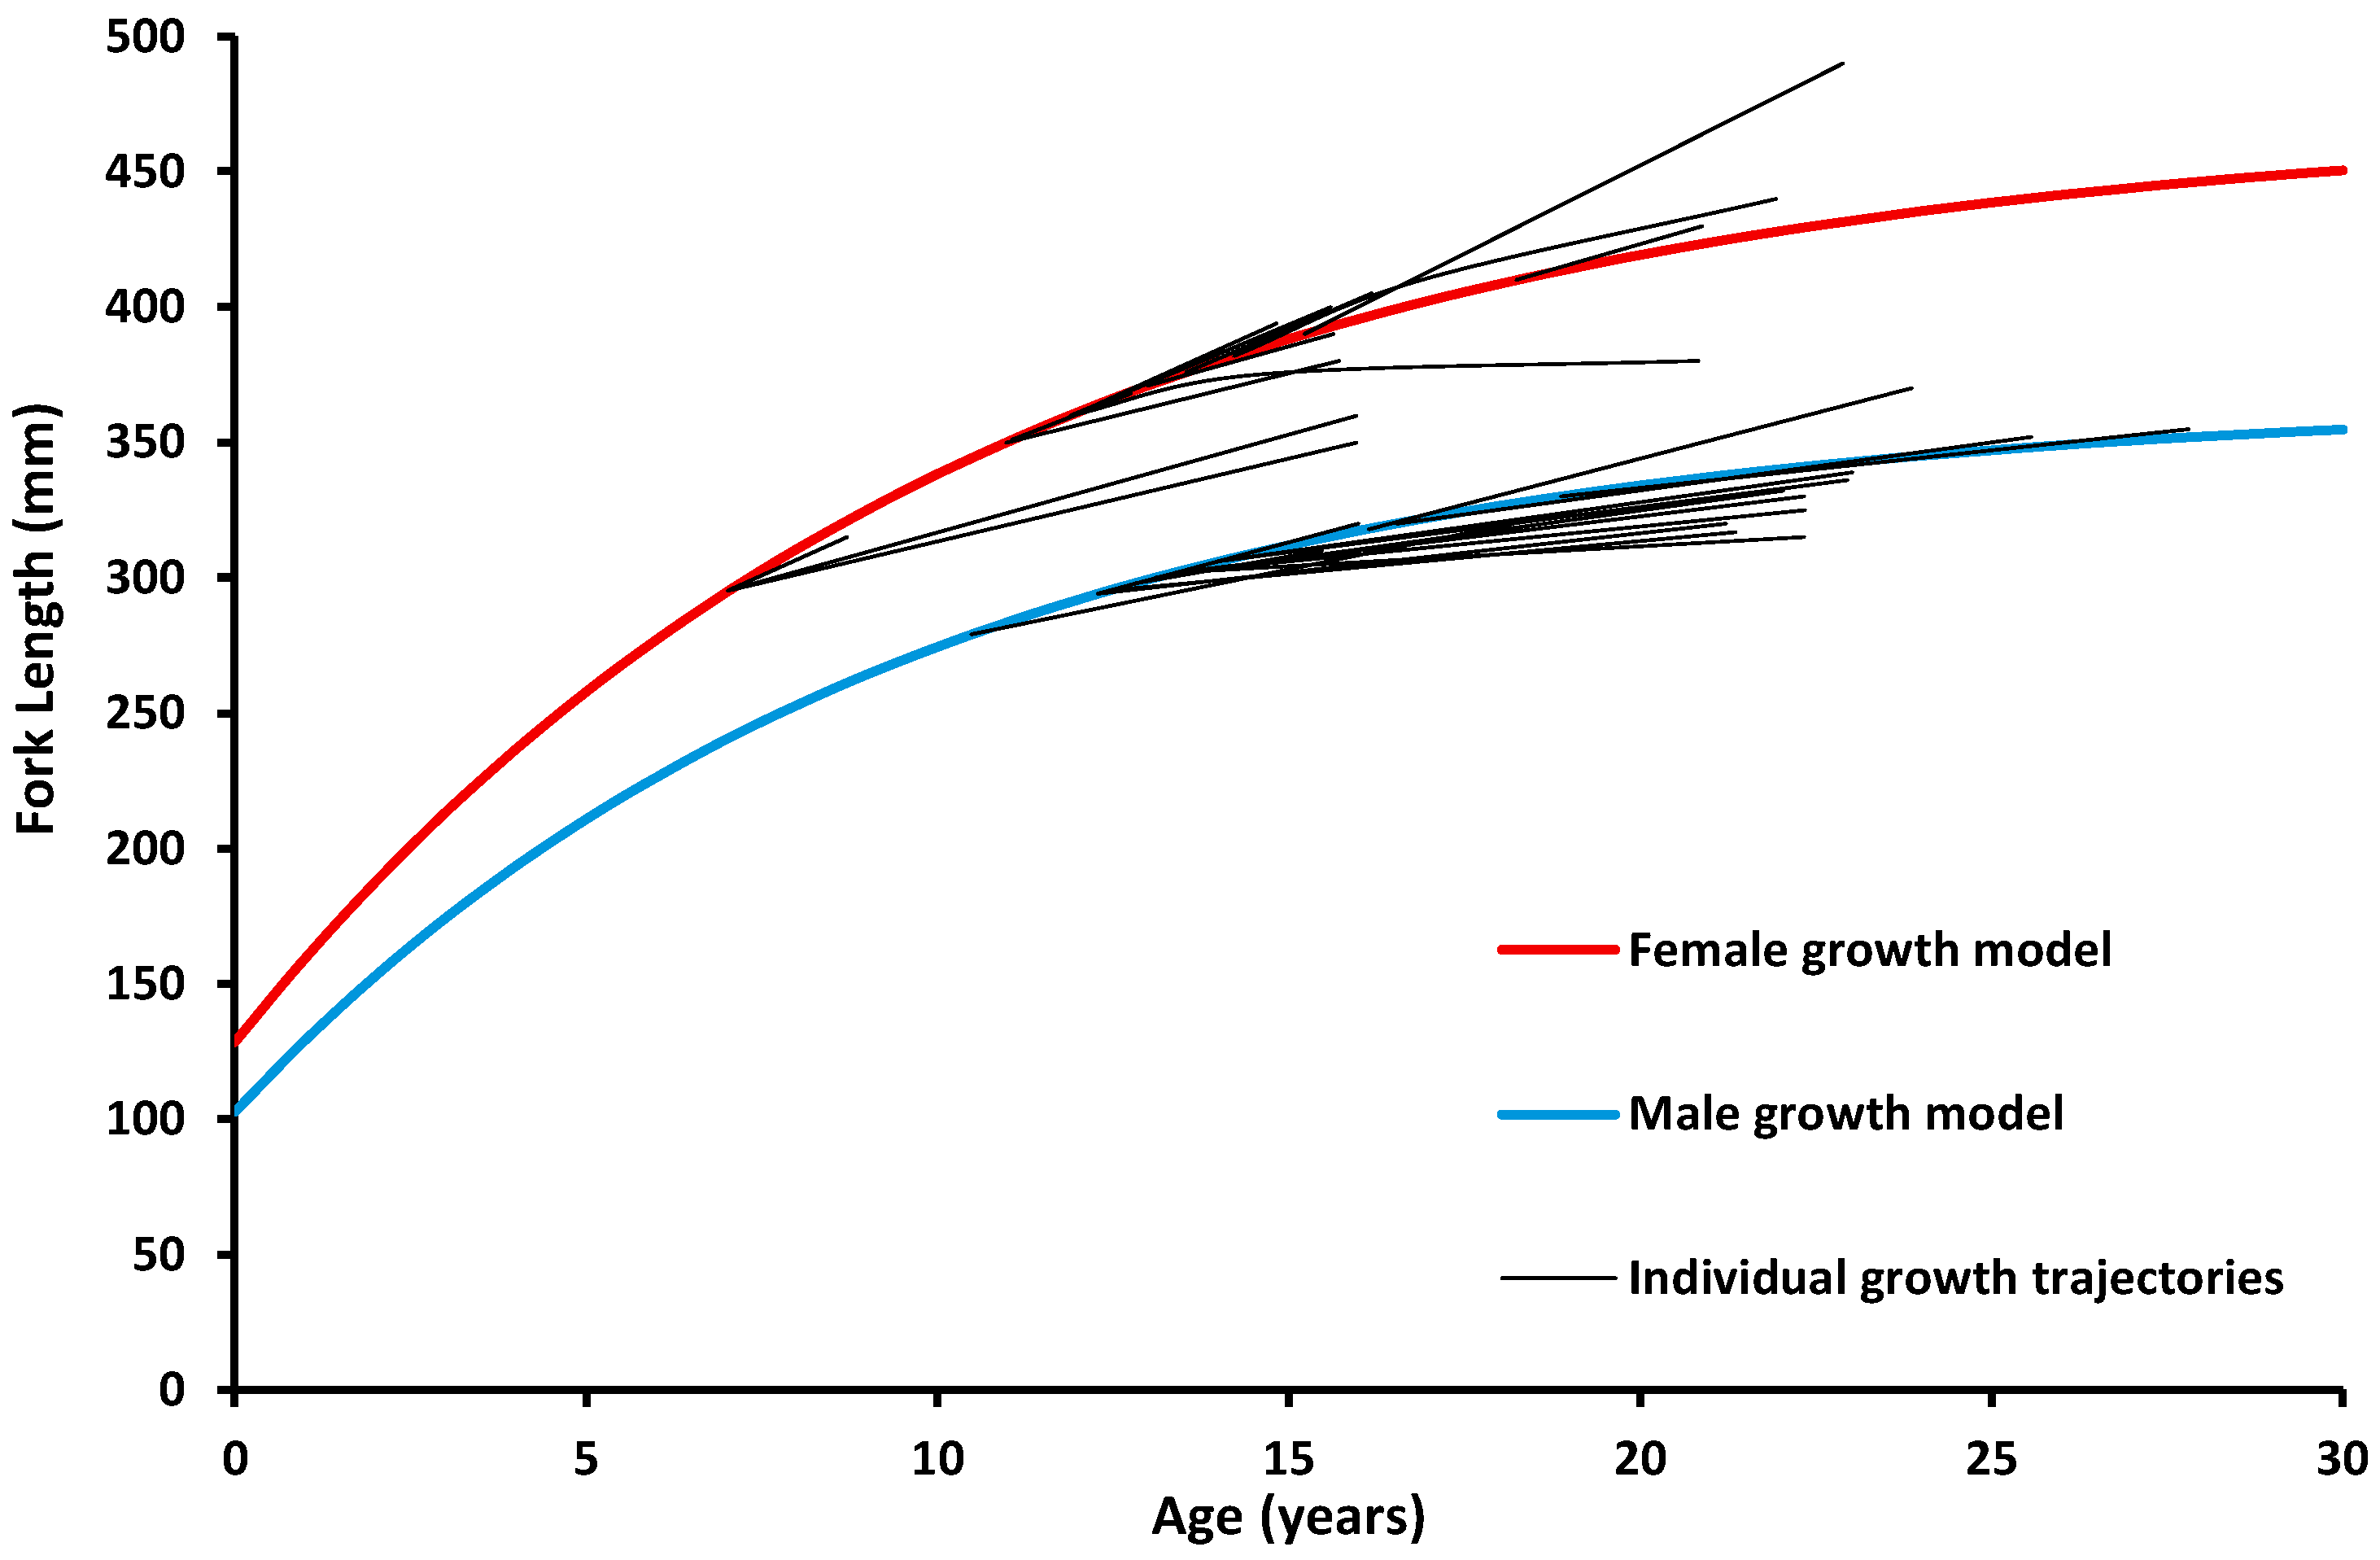
3.4. Recaptured Tagged Fish

Since the initial tag and release event during the 2014/15 survey where 85 estuary perch were tagged and released, there have been 22 reported incidental recaptures where fork length was recorded by recreational fishers. In combination with 12 recaptures from the 2023 survey, a total of 32 individuals (16 females, 15 males and 1 sex not determined) have been recaptured, with 2 individuals being recaptured twice. The four tagged fish from the 2014/15 survey which were caught and retained for age determination during the 2023 survey were found to be 23 years old. Linear growth rates from recapture data were relatively slow for males and ranged from 1.5 to 7.0 mm per year (mean 4 mm/yr) (Table 3). In contrast, female growth was typically faster and ranged from 2.2 to 13.0 mm per year (mean 8.9 mm/yr) (Table 3). The individual growth trajectories were relatively consistent with the projected sex-specific growth models and confirm that the species’ growth is sexually dimorphic (Figure 12). The indetermined sex individual grew the fastest at 14.7 mm/yr during its 2.7 yrs liberty period. The largest increase in size was a female which had 100 mm of total growth over 7.7 years. In comparison, the largest size increase in males was 52 mm over 7.7 years. The individual with the slowest growth rate was a 302 mm male which grew 1.46 mm a year and had only grown 13 mm over the past nine years. Similarly, the slowest female had only grown 20 mm over the past nine years. This female had been recaptured previously in 2017 and had originally grown 15 mm over 2.7 years; however, its continued growth markedly slowed thereafter.

4. Discussion

Despite genetic analysis of estuary perch from the Arthur River suggesting that the populations’ ongoing viability may be affected by inbreeding after a suspected near extinction event [7], this study confirms the population is still reproductively active and stable in the short term. There is evidence of at least two successful recruitment events having occurred over the past decade. Coupled with the higher-than-expected catches of numerous small fish during the 2023 survey, and the ongoing presence of at least one of the previously identified strong cohorts, the current population size may now be larger than previously estimated. However, as this survey was timed to coincide with the spawning season, where fish are aggregating in lower estuarine habitats, the high catches observed during the 2023 survey should not be used as a proxy of population size. Moreover, the recent recapture of 12 fish from the 87 tagged and released individuals in 2015 provides additional evidence that the population size in the Arthur River is small [4], but due to the addition of new individuals into the stock, a current population estimate is not possible. As such, a follow up survey is required to establish a new population size estimate in order to confirm if the stock is rebuilding.
Given concerns of the populations’ ongoing viability [7], small population size, and failure to develop a reliable non-destructive ageing technique for the species [4], the number of fish collected for age determination was limited. As such, the age structure results presented here should be viewed with some caution. Although three dominant cohorts were encountered in the current survey, it is important to note there were numerous weak and missing cohorts. However, this result should be interpreted with caution, given that it may be a reflection of the small number of fish aged. A higher number of fish aged could expose some of the missing cohorts or potentially show another dominant year class. In comparison with the fish retained and aged during the 2014/15 survey, the 12–14-year-old dominant cohorts observed during the earlier survey are likely to be reflected by the dominant 23-year-old cohort seen during the 2023 survey. Missing and weak cohorts may indicate high inter-annual recruitment variability of estuary perch in the Arthur River [4].
Despite the small sample of fish aged during the 2023 survey, the presence of several five- and eight-year-old individuals confirms that recruitment has occurred since the previous survey. The capture of numerous small estuary perch measuring less than 300 mm (N = 262; 69%) in the 2023 survey indicates that these recruitment events were reasonably successful. Given the fact that this population is genetically and geographically isolated from other mainland Australian populations, it is not possible for these cohorts to have immigrated from another waterbody [7]. This is evidence that although spawning may occur irregularly, the Arthur River population is reproductively active and stable in the short term.
Although one young of the year estuary perch was caught in the lower estuary in a previous survey [11], no young of the year or juveniles aged 1–3 were caught. This could suggest that recruitment failure has occurred recently, or more likely that juvenile fish inhabit the upper freshwater reaches of the river where the sampling effort was not conducted [9].
Highly variable recruitment is common in estuarine-dependent species [12,13] including estuary perch [5,14,15], and is influenced by complex and dynamic environmental conditions rather than human factors [14,16]. Recruitment variability in the Arthur River is probably related to numerous interrelated factors such as temperature, dissolved oxygen, salinity, food availability, and the development of significant thermoclines [4,11,15,17]. Variable freshwater flows are also likely to influence the water column characteristics on subsequent larval survival and retention [4,15]. River flows during spawning periods are known to have both positive and negative influences on recruitment in estuarine fish, including estuary perch [3,6,15,18,19]. In mainland populations, strong cohorts of estuary perch have been closely linked with high freshwater flows during the spawning season [2,15]. Unfortunately, developing a solid understanding of the environmental recruitment relationships of estuary perch in the Arthur River was outside the scope of this study, due to a lack of available environmental data and the likely complexities. The two younger cohorts observed (5 and 8 years old) were spawned in El Niño seasons, whereas the 23-year-old cohort was spawned in a La Niña season [20]. In southern Australia, the El Niño season is typically associated with warmer than average temperatures, reduced rainfall, and increased risk of drought, while the La Niña season is associated with cooler average temperatures, increased rainfall, and heightened flood risks. The water column in the lower estuarine section of the Arthur River commonly develops a marked stratification with both temperature and salinity, where the subsurface salt-wedge becomes anoxic (Haddy unpublished data). Our hypothesis is that good recruitment events will occur where rivers flows are strong enough to flush out the stagnant salt-wedge prior to spawning but slow down during the spawning season to enable the formation of an oxygenated salt-wedge that will retain eggs and larvae during their development without being flushed out of the system. However, if the river flows slow too much during the spawning season, and/or sufficient flushing does not occur, we suspect there may be poor water column mixing, with the salt-wedge becoming or remaining oxygen-depleted, resulting in weak or no recruitment. Poor recruitment may occur regularly in this system, with the populations’ growth/maintenance being dependent on isolated strong recruitment events when condition allows. Any future studies investigating the environmental recruitment relationships of estuary perch should include monitoring of water temperature, salinity, and DO throughout the water column during the spawning period.
The summer spawning period for estuary perch in the Arthur River is significantly delayed compared to mainland populations which spawn in winter and spring [2]. It is possible that spawning may occur earlier, as sampling has not been undertaken between September and November in the Arthur River. However, as mean GSI values are very low in August, and December GSI values are typical of peak spawning activity in mainland Australian populations, this suggests that late spring–early summer is the most likely spawning time in the Arthur River. This is further supported by the presence of several ovulated females and the lack of spent females in December. This delayed spawning is likely to be related to latitudinal climate differences in water temperature and river flows effecting the temperature and salinity regime in the lower estuary [4]. In winter, the lower reaches of the Arthur River can have temperatures as low as 5 to 10 °C and are known to be consistently fresh (salinity of <0.5 ppt) during high rainfall events [6]. In comparison to the Victorian and NSW rivers, these temperatures and salinities are not favourable for spawning [19]. Although delayed spawning is likely to coordinate the best chance of larval survival with environmental conditions, it also has implications on growth as juveniles do not experience as many months of warm temperatures and high food availability before temperatures start to cool.
Growth between sexes was dimorphic, with females having a larger mean size at age that progressively diverged with an increasing effect with age. Female-biassed sexual dimorphism favours females due to a larger size at maturity, increased fecundity, and lower competition with males [21]. Growth models for males indicated that they approach their asymptotic size by the age of 10–15 years, with growth thereafter being very slow. In contrast, female growth did not slow as markedly, with continued growth throughout their longevity. Sex-specific tag recapture growth rates also indicated that females grow faster than males and strongly aligned with the age-based growth models. These growth characteristics of females growing faster and reaching greater asymptotic lengths than males is similar to growth models developed by Walsh et al. (2010) [5]. It is important to note that due to the lack of young fish in the current dataset, and as L, k and t0 are not independent, direct comparisons between growth model parameters between studies are not possible at present, especially where there are variations in sample sizes, data ranges and modelling techniques [9]. However, the observed tag recapture growth rates and overall mean size at age data presented here suggest that the growth rates of estuary perch in the Arthur River are considerably slower than the mainland populations of estuary perch, which is likely to be a function of the delayed spawning influencing total growth in their first year and latitudinal temperature differences.
Gill nets were highly effective at catching estuary perch, in particular the trammel gill net and monofilament gill nets. By using scissors to cut entangled fish from the nets, then placing the fish in an aerated bin with flow through water, recovery of fish was high. Of the 378 estuary perch caught during the survey, only 3 fish were unable to be revived (0.8%). Although the trammel gill nets were able to capture the majority of size classes of fish present, the use of the 2.5″ monofilament gill net caught a much higher proportion of small fish under 270 mm.
There was a big difference in the CPUE of gill net effort between day and evening catches. It appeared that estuary perch were much more mobile in the shallows in the evening, making them susceptible to gill net capture. The habitats targeted for sampling included rocky shorelines, areas with fallen timber and logs, and areas fringed with reeds. Only two gill net sets which had catches of more than 10 fish occurred during the day. A study on estuary perch movement in a Victorian river found that during the day, the fish associated with structures in deeper sections of the river and spent the majority of time in one location for the whole day [22]. However, at night, the fish became mobile and began to move away from structures and throughout the estuary [22]. Therefore, it is likely that the higher catch rates and CPUE observed in the evening are due to increased movement associated with night.
On examination of the sex ratios of estuary perch caught in specific gill net sets, it was found that some schools were dominated by a particular sex, while others had an even split of sexes. Sex segregation has been observed in many species; however, the underlying cause/s is not well understood [23]. Sex-specific schooling may have implications for further surveys, where if the sample size collected is small, there may be a bias towards one sex.
In total, 32 fish (37%) have been recaptured from 87 estuary perch tagged during the 2014/15 survey. This suggests that the post-release survival of fish after the netting process is high, and natural mortality also appears to be low. The fact that some of these fish have also been recaptured more than once (by a combination of recreational fishers and this survey) provides additional evidence in support of a small population size. This highlights that ongoing monitoring using gillnets during the spawning season is appropriate and can form part of future conservation and management strategies for the species in Tasmania.
The results of the 2014/15 and 2023 surveys have shown that the estuary perch population in the Arthur River will require additional conservation efforts. At the state level, an application could be submitted to potentially list the conservation status of estuary perch in Tasmania as “threatened”, under the Threatened Species Protection Act 1995. At the federal level, a listing statement could also be developed to potentially list Tasmanian estuary perch as a threatened species under the Environment Protection and Biodiversity Conservation (EPBC) Act 1999. If progressed, these listings could provide further protection for the species and concurrently assist in applications for additional external funding and resources. This will support the development of a recovery plan, which will consider the feasibility of re-stocking the Arthur River and previously established waters (e.g., Ansons River). An assessment can also be made on whether estuary perch sourced from mainland Australia are required to improve the genetics of the Tasmanian population. Additionally, educational campaigns to inform the public and recreational fishers on the status of estuary perch in Tasmania will be undertaken.

5. Conclusions

Over the five-day survey undertaken in the Arthur River in December 2023, a total of 378 estuary perch were caught. Although the population appeared to be robust with better than expected catch rates, interannual recruitment frequency is concerning. The high recapture rate of tagged estuary perch from the 2014/15 survey suggests that the population is relatively small despite the addition of new individuals. The overall growth of these recaptured tagged fish and growth models confirmed a very slow growth rate, which is likely a function of cold-water temperatures and the delayed spawning season. Our findings highlight that the Arthur River population is currently reproductively active and stable; however, due to their restricted distribution, variable recruitment, and potentially small population, further efforts to conserve their population are required.

Author Contributions

Manuscript conceptualization J.L.Y. and J.H.; methodology J.L.Y., J.H. and B.V.W.; data collection J.L.Y., J.H. and B.V.W.; writing—original draft preparation J.L.Y. and J.H.; writing—review and editing J.L.Y., J.H. and B.V.W. All authors have read and agreed to the published version of the manuscript.

Funding

This research was funded internally by the University of Tasmania/Institute of Marine and Antarctic Studies and the Tasmanian State Government.

Institutional Review Board Statement

The 2014/15 survey was approved November 2014 by the University of Tasmania Animal Ethics Committee (A0014546) and conducted under Inland Fisheries Service Exemption Permit 2014-51 (approved 19 November 2014).

Informed Consent Statement

Not applicable.

Data Availability Statement

The original contributions presented in this study are included in the article. Further inquiries can be directed to the corresponding author(s).

Acknowledgments

Thanks to the Arthur River Parks and Wildlife Service rangers, in particular Peter Bonnefin for his assistance with accommodation and field logistics. Thanks also to Inland Fisheries Service Field officer Craig Burgess for his assistance in the field. We are also appreciative of the advice and input from Senior Aquatic Ecologist Scott Hardie (Water Management and Assessment Branch) during the planning and implementation phases of the survey. Thanks to Senior Technical Officer Peter Coulson from the Institute for Marine and Antarctic Studies (IMAS) for removing, processing, and reading the estuary perch otoliths and IMAS student Sarah Burnes for assisting with the construction of the site map.

Conflicts of Interest

Author Bryan Van Wyk was employed by the company Austral Fisheries. The remaining authors declare that the research was conducted in the absence of any commercial or financial relationships that could be construed as potential conflicts of interest.

Correction Statement

This article has been republished with a minor correction in the Abstract and Discussion. This change does not affect the scientific content of the article.

References

  1. McDowall, R.M. Freshwater Fishes of South-Eastern Australia; Reed Books: Terrey Hills, NSW, Australia, 1996. [Google Scholar]
  2. Walsh, C.T.; Gray, C.A.; West, R.J.; Williams, L.F.G. Reproductive Biology and Spawning Strategy of the Catadromous Percichthyid, Macquaria Colonorum (Günther, 1863). Environ. Biol. Fishes 2011, 91, 471–486. [Google Scholar] [CrossRef]
  3. Hunt, T.L.; Ingram, B.A. Investigating the Historical Abundance of Estuary Perch in Lake Tyers; Fisheries Victoria: Melbourne, Australia, 2014. [Google Scholar]
  4. Van Wyk, B. Reproduction, Growth and Population Dynamics of Estuary Perch (Percalates Colonorum) in the Arthur River, Tasmania. Honour’s Thesis, University of Tasmania, Hobart, Australia, 2015. [Google Scholar]
  5. Walsh, C.T.; Gray, C.A.; West, R.J.; van der Meulen, D.E.; Williams, L.F.G. Growth, Episodic Recruitment and Age Truncation in Populations of a Catadromous Percichthyid, Macquaria Colonorum. Mar. Freshw. Res. 2010, 61, 397–407. [Google Scholar] [CrossRef]
  6. Beard, J.; Crawford, C.; Hirst, A. Developing a Monitoring Program for Six Key Estuaries in North-West Tasmania; University of Tasmania: Hobart, Australia, 2008. [Google Scholar]
  7. Stoessel, D.J.; van Rooyen, A.R.; Beheregaray, L.B.; Raymond, S.M.C.; van Wyk, B.; Haddy, J.; Lieschke, J.; Weeks, A.R. Population Genetic Structure of Estuary Perch (Percalates Colonorum Gunther) in South-Eastern Australia. Mar. Freshw. Res. 2020, 72, 263–274. [Google Scholar] [CrossRef]
  8. Karakulak, F.S.; Erk, H. Gill Net and Trammel Net Selectivity in the Northern Aegean Sea, Turkey. Sci. Mar. 2008, 72, 527–540. [Google Scholar] [CrossRef]
  9. Haddon, M. Modelling and Quantitative Methods in Fisheries, 2nd ed.; Chapman and Hall/CRC: New York, NY, USA, 2011; ISBN 978-0-429-10949-2. [Google Scholar]
  10. King, M. Fisheries Biology, Assessment and Management; John Wiley & Sons: Hoboken, NJ, USA, 2013; ISBN 978-1-118-68804-5. [Google Scholar]
  11. Biophysical Character of Rivers in the Arthur River Catchment. In Water Assessment Aquatic Ecology Report Series; Report No. WA 14/02; Water and Marine Resources Division, Department of Primary, Industries, Parks, Water and Environment: Hobart, Australia, 2014.
  12. Morison, A.K.; Coutin, P.C.; Robertson, S.G. Age Determination of Black Bream, Acanthopagrus Butcheri (Sparidae), from the Gippsland Lakes of South-Eastern Australia Indicates Slow Growth and Episodic Recruitment. Mar. Freshw. Res. 1998, 49, 491–498. [Google Scholar] [CrossRef]
  13. Staunton-Smith, J.; Robins, J.B.; Mayer, D.G.; Sellin, M.J.; Halliday, I.A. Does the Quantity and Timing of Fresh Water Flowing into a Dry Tropical Estuary Affect Year-Class Strength of Barramundi (Lates Calcarifer)? Mar. Freshw. Res. 2004, 55, 787–797. [Google Scholar] [CrossRef]
  14. Morrongiello, J.R.; Walsh, C.T.; Gray, C.A.; Stocks, J.R.; Crook, D.A. Environmental Change Drives Long-Term Recruitment and Growth Variation in an Estuarine Fish. Glob. Change Biol. 2014, 20, 1844–1860. [Google Scholar] [CrossRef] [PubMed]
  15. Stoessel, D.J.; Morrongiello, J.R.; Raadik, T.A.; Lyon, J.P.; Nicol, M.D. Determinants of Year Class Strength and Growth of Estuary Perch Macquaria Colonorum in a Highly Regulated System. Mar. Freshw. Res. 2018, 69, 1663–1673. [Google Scholar] [CrossRef]
  16. Feyrer, F.; Nobriga, M.L.; Sommer, T.R. Multidecadal Trends for Three Declining Fish Species: Habitat Patterns and Mechanisms in the San Francisco Estuary, California, USA. Can. J. Fish. Aquat. Sci. 2007, 64, 723–734. [Google Scholar] [CrossRef]
  17. Walsh, C.T.; Reinfelds, I.V.; Ives, M.C.; Gray, C.A.; West, R.J.; van der Meulen, D.E. Environmental Influences on the Spatial Ecology and Spawning Behaviour of an Estuarine-Resident Fish, Macquaria Colonorum. Estuar. Coast. Shelf Sci. 2013, 118, 60–71. [Google Scholar] [CrossRef]
  18. McCarraher, D.B.; McKenzie, J.A. Observations on the Distribution, Growth, Spawning and Diet of Estuary Perch (Macquaria Colonorum) in Victorian Waters; Technical Report Series; Arthur Rylah Institute for Environmental Research: Victoria, Australia, 1986. [Google Scholar]
  19. Trnski, T.; Hay, A.C.; Fielder, D.S. Larval Development of Estuary Perch (Macquaria Colonorum) and Australian Bass (M. Novemaculeata) (Perciformes: Percichthyidae), and Comments on Their Life History. Fish. Bull. 2005, 103, 183–194. [Google Scholar]
  20. Bureau of Meteorology Website. Available online: Australia’s Official Weather Forecasts & Weather Radar—Bureau of Meteorology (accessed on 22 July 2024).
  21. Díaz, N.; Ribas, L.; Piferrer, F. The Relationship between Growth and Sex Differentiation in the European Sea Bass (Dicentrarchus Labrax). Aquaculture 2013, 408–409, 191–202. [Google Scholar] [CrossRef]
  22. Douglas, J. Estuary Perch Movement and Habitat Use in the Snowy River Recreational Fishing Grant Program—Research Report; Department of Primary Industries: Fisheries Victoria, Australia, 2010. [Google Scholar]
  23. Wearmouth, V.J.; Sims, D.W. Chapter 2 Sexual Segregation in Marine Fish, Reptiles, Birds and Mammals: Behaviour Patterns, Mechanisms and Conservation Implications. In Advances in Marine Biology; Academic Press: Cambridge, MA, USA, 2008; Volume 54, pp. 107–170. [Google Scholar]
Figure 1. Sampling area for estuary perch in the Arthur River, Tasmania, represented by the shaded section, during the 2014/15 and 2023 surveys. Note: highlighted red areas of Australia represent overall estuary perch distribution.
Fishes 10 00031 g001
Figure 2. (a) Typical shoreline where gill nets were set and (b) small fyke nets set amongst aquatic vegetation to target young of the year estuary perch.
Fishes 10 00031 g002
Figure 3. (a) Diagrammatic representation of the external structure of the urogenital opening of female and male estuary perch, (b) a double tagged estuary perch being released, (c) small milted male estuary perch displaying free flowing milt and (d) an ovulated female estuary perch.
Fishes 10 00031 g003
Figure 4. An image of a sectioned otolith of a 23-year-old estuary perch from the Arthur River (opaque zone counts are marked with a white circle, with every fifth zone marked with a black circle).
Fishes 10 00031 g004
Figure 5. Length frequency distribution of all estuary perch caught in the Arthur River during the 2023 survey, separated by gear types (N = 378).
Fishes 10 00031 g005
Figure 6. Comparison of Arthur River estuary perch sex ratios for the 2023 survey, in gill net sets where greater than 10 individuals were caught in a set. The dotted line indicates the 50:50 split. # indicates day time sets. * indicates significant deviation (Chi square test, p < 0.05) from a 50:50 ratio. N values of estuary perch caught per schooling event are listed on top of each bar.
Fishes 10 00031 g006
Figure 7. Sex specific percent length frequency distributions of all estuary perch caught in the Arthur River, Tasmania, comparing the (a) 2014/15 and (b) 2023 surveys.
Fishes 10 00031 g007
Figure 8. Length and weight of all estuary perch caught in the Arthur River, Tasmania, separated by sex comparing the 2014/15 and 2023 surveys. The length–weight trendline is pooled data with sex and both surveys combined. Survey from 2014/15 N = 76; survey from 2023 N = 31.
Fishes 10 00031 g008
Figure 9. Sex-specific mean seasonal gonadosomatic indices (±95% CI) (a,b) and sex-specific scatterplots for reproductive stage, gonadosomatic index, and fish size using pooled data from both surveys (c,d). Values in bar graphs indicate monthly N values.
Fishes 10 00031 g009
Figure 10. Sex-specific percentage age frequency distributions for estuary perch caught in the Arthur River, Tasmania, comparing the (a) 2014/15 and (b) 2023 surveys.
Fishes 10 00031 g010
Figure 11. Size at age of all estuary perch caught in the Arthur River, Tasmania, separated by sex comparing the 2014/15 and 2023 surveys. The solid line indicates the female growth model and dotted line the male growth model. Survey from 2023—females N = 12, males N = 19. Survey from 2014/15—females N = 57, males N = 18.
Fishes 10 00031 g011
Figure 12. Sex-specific size at age models with observed individual growth trajectories (black lines) for recaptured estuary perch tagged during the 2014/15 survey. A total of 32 individuals were recaptured, 22 from incidental capture by recreational fishers and 12 from the 2023 survey (males, N = 15, females, N = 16, with 1 sex not determined and not plotted).
Fishes 10 00031 g012
Table 1. The macroscopic characteristics for staging the maturity of male and female fish ([4], adapted from [2]).
Males
StagesMacroscopic Characteristics
1. IndeterminateSmall, moderately translucent to pink, determination of sex is difficult.
2. DevelopingMuch larger than stage 1, colourless to white, transverse sections triangular.
3. MatureTestes larger in diameter, white in colour, slightly vascularized.
4. RipeSwollen, soft and white testes. Milt flows from the urogenital pore.
5. SpentRubbery, reduced in size, bloodshot and grey in appearance.
Females
StagesMacroscopic Characteristics
1. IndeterminateSmall, moderately translucent to pink, determination of sex is difficult.
2. DevelopingMuch larger than stage 1, colourless to cream with fine granular texture. Slightly vascularized
3. MatureOvaries larger in diameter, yellow in colour with extensive vascularization. Oocytes visible, mature
4. RipeHydrated translucent oocytes visible through ovary wall, yellow to amber in colour, gonads take up three quarters of body cavity
5. OvulationOocytes extruded from the genital papilla with gentle gravitational pressure
6. SpentOvaries reduced in length, leathery, bloodshot towards posterior end.
Table 2. Comparisons of gillnet catch, effort, and catch per unit (CPUE) of estuary perch in the Arthur River, between day and evening sampling sets during the 2023 survey.
Fish NumbersNumber of Sets Total Soak Time (Hrs)Total Length of Net Soaked (m)Standardised 100 M/hrMean CPUE *
Day No.DayEveningDayEveningDayEveningDayEveningDayEveningDayEvening
1-57 2 1.5 70 0.5 99.5
2938655.83.52971753.21.22.624.0
31430538.12.4426906.70.71.736.9
416706413.82.648417011.11.11.252.6
57076386.06.92762805.52.410.629.4
Trip Totals109271202233.716.8148378526.56.03.139.7
Note: Gill net effort consists of trammel gill nets, 2.5″ monofilament gill net, and 3″ multi-monofilament gill net. Day sets classed as nets set from 11:00 to 16:00, evening sets classed as nets set from 18:00 to 21:00. A dash represents no netting undertaken. * All mean CPUE differences were significant.
Table 3. Measurements of growth from recaptured estuary perch tagged during the 2014/15 survey in the Arthur River, Tasmania.
Recapture YearInitial Length (mm)Recapture Length (mm)Time at Liberty (Yrs)Total Growth (mm)Growth per Year (mm)Sex (F/M/I)
20172983102.7124.5M
20182943203.7267.0M
20203854205.1356.9M
20222793207.7415.3M
20223183707.7526.7M
2023 *3023158.9131.5M
2023 *3003328.9323.6M
2023 *3023308.9283.1M
2023 *3303558.9252.8M
2023 *2953178.9222.5M
2023 *2943208.9262.9M
2023 *3063368.9303.4M
2023 *3023258.9232.6M
2023 *3203529.0323.5M
20243063399.0333.7M
20173063452.73914.7I
20162953151.72011.8F
20163513681.71710.0F
20173563802.6249.1F
20173864202.63412.8F
20173824102.62810.6F
20173633942.73111.7F
20173713902.7197.2F
20173764052.72910.9F
20173603752.7155.7F
20174104302.7207.5F
20183604003.74010.8F
20193503804.7306.3F
20213554206.7659.7F
20223904907.710013.0F
20223824407.7587.5F
2023 *3603808.9202.2F
2023 *2953508.9556.1F
2023 *2953608.9657.3F
* Indicates fish recaptured in the current survey, with all other fish caught incidentally by recreational fishers.
Disclaimer/Publisher’s Note: The statements, opinions and data contained in all publications are solely those of the individual author(s) and contributor(s) and not of MDPI and/or the editor(s). MDPI and/or the editor(s) disclaim responsibility for any injury to people or property resulting from any ideas, methods, instructions or products referred to in the content.

