Characterising Mutational Spectra of Carcinogens in the Tumour Suppressor Gene TP53 Using Human TP53 Knock-in (Hupki) Mouse Embryo Fibroblasts

 , and
, and
Abstract
1. Introduction
2. Experimental Design
- The original Hupki mouse (Trp53tm1/Holl) on a 129/Sv background encodes arginine at the exon 4 codon 72 polymorphic site in TP53 [5]. More information can be found at The Jackson Laboratory website (www.jax.org) where this strain is available (stock no. 004301). The related strain Trp53tm2/Holl (stock no. 008045) contains the proline variant at codon 72 in TP53 [25]
- Based on the original Hupki mouse [5] we created a Hupki strain that is heterozygous for an Xpa-knockout allele (Xpa+/−) and also harbours the pUR288 plasmid (containing the bacterial lacZ reporter gene): Hupki/Xpa/lacZ [15]. The Hupki/Xpa/lacZ strain [B6;129-Trp53tm1holl-Xpatm1Hvs-Tg(pUR288)1Vij] is on a mixed 129/Sv and C57Bl/6 background. In the Xpa-knockout allele, exon 3, intron 3 and exon 4 have been replaced by a neomycin resistance cassette with a PGK2 promoter. By breeding Hupki+/+, Xpa+/− mice, Xpa+/+ and Xpa−/− HUFs can be isolated. Hupki+/+;Xpa−/− cells are deficient in nucleotide excision repair. The pUR288 plasmid is chromosomally integrated in ∼20 tandem copies per haploid genome and allows mutagenesis of the lacZ gene to be assessed in HUFs (described in Section 3.4.4). More information can be found at the European Mouse Mutant Archive (EMMA; www.infrafrontier.eu) where this strain has been deposited (EMMA ID EM:08137).
2.1. Materials
2.1.1. Mouse Dissection
- Basic dissecting set, i.e., sharp tweezers, blunt tweezers, fine scissors, blunt scissors (S Murray & Co Ltd.; Surrey, UK; Cat. no.: E251/01) or equivalent
- Dissecting microscope (Sigma-Aldrich; Cat. no.: Z738166)
- Dissection board and minimum of 8 needles for pinning (Thermo Fisher Scientific; Cat. no.: 13459386)
2.1.2. Routine Cell Culture Reagents
- Dulbecco’s modified Eagle medium (DMEM)—high glucose (Thermo Fisher Scientific; Waltham, MA, USA; Cat. no.: 31966047)
- Penicillin/Streptomycin (P/S; Thermo Fisher Scientific; Cat. no.: 15140122)
- Foetal bovine serum (FBS; Thermo Fisher Scientific; Cat. no.: 10270106)
- Phosphate-buffered saline (PBS) pH 7.45 (Thermo Fisher Scientific; Cat. no.: 18912-014)
- Trypsin-EDTA 0.05% (Thermo Fisher Scientific; Cat. no.: 25300054)
- Ethanol 70% solution (Merck; Darmstadt, Germany; Cat. no.: 32221)
- Nutlin-3a (Cayman Chemicals; Ann Arbor, MI, USA; Cat. no.: 18585)
- Dimethyl sulfoxide (DMSO; Sigma Aldrich; St. Louis, MO, USA; Cat. no.: D2650)
- Culture-treated Nunc™ EasYFlasks™ in 25, 75 and 175 cm2 (Thermo Fisher Scientific; Cat. no.: 10568482, 10364131 and 159910)
- Corning® CellBIND® 6-well plates (Corning; New York, NY, USA; Cat. no.: 3335)
- Corning® CellBIND® 96-well plates (Corning; Cat. no.: 3330)
- Culture treated 6-well plates (Thermo Scientific; Cat. no.: D2650 10119831)
- Sterile 10-cm dishes (Corning, Cat. no.: 430591)
- Sterile serological pipettes 5, 10 and 25 mL (Corning; Cat. no.: 10127400, 10677341 and 10732742)
- Sterile centrifuge tubes 15 and 50 mL (Corning; Cat. no.: 10738771 and 10604551)
- Sterile 1.5 mL tubes (Corning; Cat. no.: 525-0259)
- Autoclaved glass Pasteur pipettes (Thermo Fisher Scientific; Cat. no.: 11566963)
- Sterile filter tips (Anachem; Leicester, UK; Cat. no.: GP20, GP200, GP1000)
- Cryogenic vials (Thermo Fisher Scientific; Cat. no.: 10577391)
- 12-well reservoir (VWR; Radnor, PA, USA; Cat. no.: 613-0100)
2.1.3. DNA Isolation and PCR Reagents
- Gentra Puregene Cell Kit B (Qiagen; Hilden, Germany; Cat. no.: 158745)
- peqGOLD Cycle-Pure Kit (peqlab; Erlangen, Deutschland; Cat. no.: 12-6493-0)
- Isopropanol (Fisher Chemicals; Cat. no.: P17500/17)
- Ethanol 70% solution in nuclease-free water
- Nuclease-free water (Thermo Fisher Scientific; Cat. no.: AM9937)
- PCR Primers (Section 5)
- Tris-EDTA (TE; 10 mM Tris-HCl, 1 mM EDTA) pH 8.0 (Sigma Aldrich; Cat. no.: 93283)
- REDTaq® ReadyMix™ (Sigma; Cat. no.: R2523-100RXN)
- UltraPure™ Agarose (Thermo Fisher Scientific; Cat. no.: 16500100)
- Ethidium bromide (Sigma-Aldrich; Cat. no.: E1510)
- DNA ladder 100 bp (Qiagen, Cat. no.: 239045)
- UltraPure™ 10X TBE buffer (Thermo Fisher Scientific; Cat. no.: 15581044)
2.1.4. Reagents and Materials for Western Blotting
- EDTA (Sigma-Aldrich Cat. no.: EDS500G)
- Cling film
- Amersham ECL kit (GE Healthcare; Cat. no.: RPN2106)
- Amersham Hyperfilm ECL (GE Healthcare; Cat. no.: 28906836)
- Bromophenol blue salt (Sigma-Aldrich; Cat. no.: B0126)
- Filter paper
- Glycerol (Sigma-Aldrich; Cat. no.: G7757)
- Glycine (Santa Cruz; Cat. no.: sc-29096)
- Halt™ Protease-/Phosphatase Inhibitor Cocktail (100X) (Thermo Scientific; Cat. no.: 78430)
- Hydrochloric acid (VWR; Cat. no.: 20252-368)
- Loading tips (VWR; Cat. no.: 53509-015)
- Methanol (Merck; Cat. no.: 32213)
- Non-fat milk powder (Marvel)
- Sodium chloride (Sigma-Aldrich; Cat. no.: S3014)
- Nitrocellulose membrane (Bio-Rad, Hercules, CA, USA; Cat. no.: 162-0112)
- NuPAGE 4–12% Bis-Tris Protein Gels, 1.5 mm, 15-well (Invitrogen; Cat. no.: NP0336BOX)
- NuPAGE MES buffer (Invitrogen; Cat. no.: NP0002)
- Pierce Bicinchoninic Acid Protein Assay (Thermo Fisher Scientific; Cat. no.: 23225)
- Pierce Bovine Serum Albumin Standard Ampules (Thermo Fisher Scientific; Cat. no.: 23209)
- Ponceau red (Sigma-Aldrich; Cat. no.: P7170)
- SDS (AppliChem GmbH; Darmstadt, Germany; Cat. no.: A0767,0250)
- SeeBlue Plus2 Pre-stained Protein Ladder (Thermo Fisher Scientific; Cat. no.: LC5925)
- Sodium azide (Sigma-Aldrich; Cat. no.: S8032)
- Tris base (Thermo Fisher Scientific; Cat. no.: 17926)
- Tween-20 (GE Healthcare; Cat. no.: 28906838)
- β-Mercaptoethanol (Sigma-Aldrich; Cat. no.: M3148)
- Film cassette (Advansta; San Jose, CA, USA; Cat. no.: L-07019-001) or equivalent
- Scalpel (Swann-Morton; Sheffield, South Yorkshire, UK; Cat. no.: 12397999)
- Gel knife (Thermo Fisher Scientific; Cat. no.: EI9010)
- Roller (Thermo Fisher Scientific; Cat no.: 84747)
2.1.5. Antibodies for Western Blotting
- anti-p53 (Cell Signaling Technology, Danvers, MA, USA; Cat. no.: 2524S)
- anti-p-p53 (Ser15; Cell Signaling Technology, Cat. no.: 9284)
- anti-p21 (BD Biosciences, Franklin Lakes, New Jersey, NJ, USA; Cat. no.: BD556431)
- anti-p-Chk1 (Ser345; Cell Signaling Technology; Cat. no.: 2348)
- anti-p-H2ax (Ser139; Cell Signaling Technology; Cat. no.: 9718
- anti-Mdm2 (abcam; Cambridge, Cambridgeshire, UK; Cat. no.: 28146)
- anti-Gapdh (Chemicon International, Temecula, CA, USA; Cat. no.: MAB374)
- anti-mouse (Bio-Rad; Cat. no.: 170-5046)
- anti-rabbit (Bio-Rad; Cat. no.: 170-5047)
2.2. Equipment
- Class 2 Biosafety cabinet (Walker; Glossop, UK; Cat. no.: Class II Gen3 Controls) or equivalent
- Incubator fitted with an oxygen sensor and a nitrogen source and capable of maintaining 37 °C, 5% CO2, 95% humidity and 3 or 21% O2 (Thermo Fisher Scientific; Cat. no.: Heracell™ 150i) or equivalent
- Culture microscope (Nikon, Minato, Tokyo, Japan; Cat. no.: Eclipse TS100) or equivalent
- Hemocytometer (Hawksley; Lancing, Sussex, UK; Cat. no.: BS.748) or equivalent
- Micropipettes (Gilson Scientific Ltd.; Middleton, WI, USA) or equivalent
- Multichannel pipette (Cole-Parmer; Vernon Hills, Il, USA; Cat. no.: P4808-200) or equivalent
- Multichannel aspirator adaptor (Thermo Fisher Scientific; Cat. no.: 10043471) or equivalent
- Pipetboy (Integra Biosciences; Zizers, Switzerland; Cat. no.: 15016)
- Centrifuge: 320× g and 2300× g (Eppendorf; Hamburg, Germany; Cat. no.: 5415D and 5804) or equivalent
- NanoDrop microvolume spectrophotometer (Thermo Fisher Scientific; Cat. no.: ND-2000) or equivalent
- Thermocycler (Eppendorf; Cat. no.: Thermomixer compact 5350) or equivalent
- Vortex (Scientific Industries; Bohemia, NY, USA; SI-0236) or equivalent
- Gel electrophoresis tank (Gibco; Cat. no.: 11068) or equivalent or equivalent
- Sonic dismembrator (Fisher Scientific; Cat. no.: FB-120) or equivalent
- Microplate reader for absorbance (BioTek; Winooski, VT, USA; Cat. no.: ELx800) with Gen5 software (BioTek) or equivalent
- PowerPac (Bio-Rad; Cat. no.: 1645052) or equivalent
- XCell SureLock Mini-Cell Electrophoresis System (Thermo Fisher Scientific; Cat. no.: EI0001) or equivalent
- Mini Trans-Blot Electrophoretic Transfer Cell (Bio-Rad; Cat. no.: 1703930) or equivalent
- pH meter (Hanna Instruments; Leighton Buzzards, Bedfordshire, UK; Cat. no.: HI220) or equivalent
- Medical film processor (Konica Minolta; Chiyoda, Tokyo, Japan; Cat. no.: SRX-101A) or equivalent
3. Procedure
3.1. Isolation of Primary Mouse Embryo Fibroblasts (Time for Completion: 18 Days)
3.1.1. Mouse Work and Dissection
- For mating place one male with 1–2 females (7–8-week virgins) and check the females for a copulation plug each morning. The copulation plug usually dissolves within 12–14 h.
- Transfer the plugged females to a new cage (=E0.5) and weigh the female on day 7, 9, 11, and 13.
 CRITICAL STEP The optimal age of mouse embryos for this protocol is 13.5 days.
 - Prior to dissection (E13.5) place medium at room temperature. Place 8–10 cryogenic vials containing 1 mL 0.05% trypsin-EDTA on ice. Prepare 8–10 10-cm petri dishes with approximately 20 mL sterile PBS. Put dissection tools in a beaker containing sterile PBS.
 CRITICAL STEP The isolation of MEFs must occur in a sterile hood with sterile material.
 - Sacrifice the female by cervical dislocation.
- Spray the mouse on both sides with 70% ethanol and pin down.
- With fine tweezers or scissors, carefully cut open the mouse and pin down the skin on both sides.
 CRITICAL STEP Do not touch fur with dissection tools in order to avoid contamination.
 - Cut out the string of embryos/uterus and place in 10-cm dish containing PBS.
- Pop out each embryo from the uterus and place each in a separate 10-cm dish containing PBS.
- Label 1.5 mL centrifuge tubes and cryogenic vials containing trypsin (from step 3) according to number of embryos and place back on ice.
- Under the microscope remove the placenta and umbilical cord if still present.
- Hold the embryo with sharp tweezers and remove the hematopoietic tissue with blunt tweezers.
- Cut off the head with blunt scissors and place in a labelled centrifuge tube from step 9 and use for genotyping if necessary.
- Place the rest of the embryo in a labelled trypsin-containing cryogenic vial from step 9 and keep on ice.
- In between each embryo, wash dissection tools in a beaker containing PBS, then with 70% ethanol and dab on tissue to dry.

3.1.2. Preparation of Cells
- 15.
- Prepare HUFs from up to four embryos at a time.
 CRITICAL STEP From here onwards the preparation of HUFs must occur in a sterile cell culture biosafety cabinet.
 - 16.
- Between dissociation of each embryo, rinse mincing scissors in a 50 mL centrifuge tube filled with PBS, then soak with 70% ethanol and dab on tissue to dry.
- 17.
- Use mincing scissors to mince the embryo in each vial.
- 18.
- Put up to four vials in a rack and place in the incubator at 37 °C for 10 min.
- 19.
- Pipette the embryo/trypsin mixture up and down 10× with 1 mL pipette.
- 20.
- Place the rack back in the incubator at 37 °C for a further 10 min.
- 21.
- Pipette the tissue up and down 10× with a 1 mL pipette.
- 22.
- Transfer the contents of each vial to separate 15 mL centrifuge tubes containing 9 mL of growth medium and invert. Centrifuge at 320× g for 5 min.
- 23.
- Aspirate supernatant and re-suspend the pellet in 1 mL medium by pipetting up and down 10×.
- 24.
- Add 4 mL of medium (total of 5 mL), mix, then let the tube sit for 3 min to sediment any large pieces of tissue.
- 25.
- Transfer 5 mL (avoiding pellet) from each tube to a separate 175-cm2 flask containing 30 mL medium.
- 26.
- Move the flask back and forth and place in incubator.
 CRITICAL STEP The incubator should be fitted with an oxygen sensor and a nitrogen source and set to 37 °C, 95% humidity, 5% CO2, and 3% O2.
 - 27.
- Check cell growth and for any signs of contamination over the next 2–3 days.
- 28.
- Change the medium after 24 h.
3.1.3. Preparation of Frozen Cell Stocks
- 29.
- Label one 15 mL tube per T175 flask with the appropriate embryo number.
 CRITICAL STEP It is possible to prepare frozen stocks from up to four flasks at a time. Because the freezing medium contains a high percentage of DMSO, it is important that cells are placed at −80 °C immediately to avoid any cellular damage.
 - 30.
- For each embryo/flask label 5–6 cryogenic vials with ID, day in culture, passage number, portion of flask per stock and date (e.g., XE7.4, D3, P0, ⅕ T175, 01/01/2019).NOTE As described in Section 3.1.2 the day of isolation is defined as Day 0. In our experience, when following this procedure, most cultures will be 80–100% confluent three days following isolation, thus, the day when frozen stocks are prepared will be Day 3 (D3). Also, we define the preparation of frozen stocks here as Passage 0 (P0).
- 31.
- Aspirate the medium from the flask and wash with PBS.
- 32.
- Incubate with trypsin for 3 min, then add medium as indicated in Table 1, transfer to 15 mL centrifuge tube and centrifuge at 320× g for 5 min at room temperature.
- 33.
- Prepare freezing medium.
- 34.
- Aspirate the supernatant and re-suspend the pellet in 5 mL freezing medium by gently pipetting up and down.
- 35.
- Add 1 mL into each of the prepared cryogenic vials.
- 36.
- Place in a Styrofoam box at −80 °C and transfer to a liquid nitrogen tank the next day.
 PAUSE STEP Frozen stocks can be stored in liquid nitrogen for many years.

3.2. Thawing of Frozen Cells. Time for Completion: 30 min Hands-on Time, 3–4 Days for Cells to Grow (D3–6/7)
- 37.
- Label two T175 flasks with embryo number, day in culture, passage number and date (i.e., XE7.4, D3, P0) and add 35 mL of medium to each flask.
- 38.
- Prepare one 15 mL tube with 9 mL medium.
- 39.
- Wearing the appropriate protective clothes, take out a vial of frozen primary cells from the liquid nitrogen tank and thaw quickly in a 37 °C water bath.
 CRITICAL STEP As cells were frozen in 10% DMSO it is crucial to work fast at this step to keep cells viable.
 - 40.
- In the cell culture hood, pipette the thawed stock into the 15 mL tube from step 38 and centrifuge at 280× g for 5 min at room temperature.
- 41.
- Aspirate the supernatant, resuspend the pellet in 1 mL of medium and add 500 µL of cell suspension per flask.
- 42.
- To ensure an even distribution of the cells, move the flasks back and forth before placing them in an incubator set to 37 °C, 95% humidity, 5% CO2, and 3% O2.
- 43.
- The next day (D4) aspirate the medium, add 35 mL fresh medium to each flask and place flasks back into the incubator.
- 44.
- Let the cells grow for an additional 48–72 h in order to reach 80–90% confluency.
3.3. Passaging of HUFs—Time for Completion: 30–45 min for Primary Cells and up to 4 h during the HIMA
- 45.
- Once cells have reached confluency (D6–7) label the required number of cell culture dishes with culture ID, date, day and passage number and add appropriate volume of growth medium as indicated in Table 1.
- 46.
- Take flasks out of the incubator and aspirate the medium. Wash once with 12 mL PBS per flask. Add 3 mL of trypsin. Make sure the trypsin has been distributed equally and place flasks at 37 °C for 2.5 min or until cells detach.
 CRITICAL STEP Timing depends on the cell density and the stage of the culture (e.g., senescent cells take longer to dissociate than post-senescent cells or primary HUFs). Do not incubate cells longer than 10 min.
 - 47.
- Check under the microscope if cells have detached. If cells are still attached place back at 37 °C. Once cells have lifted, add growth medium to inactivate trypsin and transfer the cell suspension to a 50 mL centrifuge tube.
- 48.
- Count cells using a hemocytometer and seed cells at 16,000 cells/cm2.
- 49.
- During the HIMA, after cells have been treated with a mutagen, the cells do not have to be counted. The splitting ratio depends on how quickly the culture populates the well. Cultures should be sub-cultured at 1:1.5–1:50 splitting ratio as indicated in Table 2. For example, for a 1:3 splitting ratio pipette 500 μL of the 1.5-mL cell suspension into the correct well of the prepared 6-well plate.
- 50.
- To ensure an even distribution of the cells, move the flasks/plates back and forth before placing them in the incubator at 37 °C, 95% humidity, 5% CO2, and 3% (D0–D11) or 20% O2 (D11+).
3.4. Optimisation of Carcinogen Treatment Conditions for HIMA
3.4.1. Assessment of Cell Survival
Carcinogen Treatment of Cells—Time for Completion: 30 Min/Compound Followed by Incubation
- 51.
- Prepare required amount of 96-well plates by labelling them with the date and passage number and by adding 100 μL PBS/well into the outside wells of the plate using a multichannel pipette.
- 52.
- Sub-culture the cells as described in Section 3.3 and place them in the incubator at 37 °C, 95% humidity, 5% CO2 and 3% O2. Prepare enough cells for 70 wells.
- 53.
- The next day prepare sufficient amounts of the highest concentration of the test compound by adding the required volume of carcinogen stock to medium. Also make medium containing an equal concentration of the solvent for the controls.
- 54.
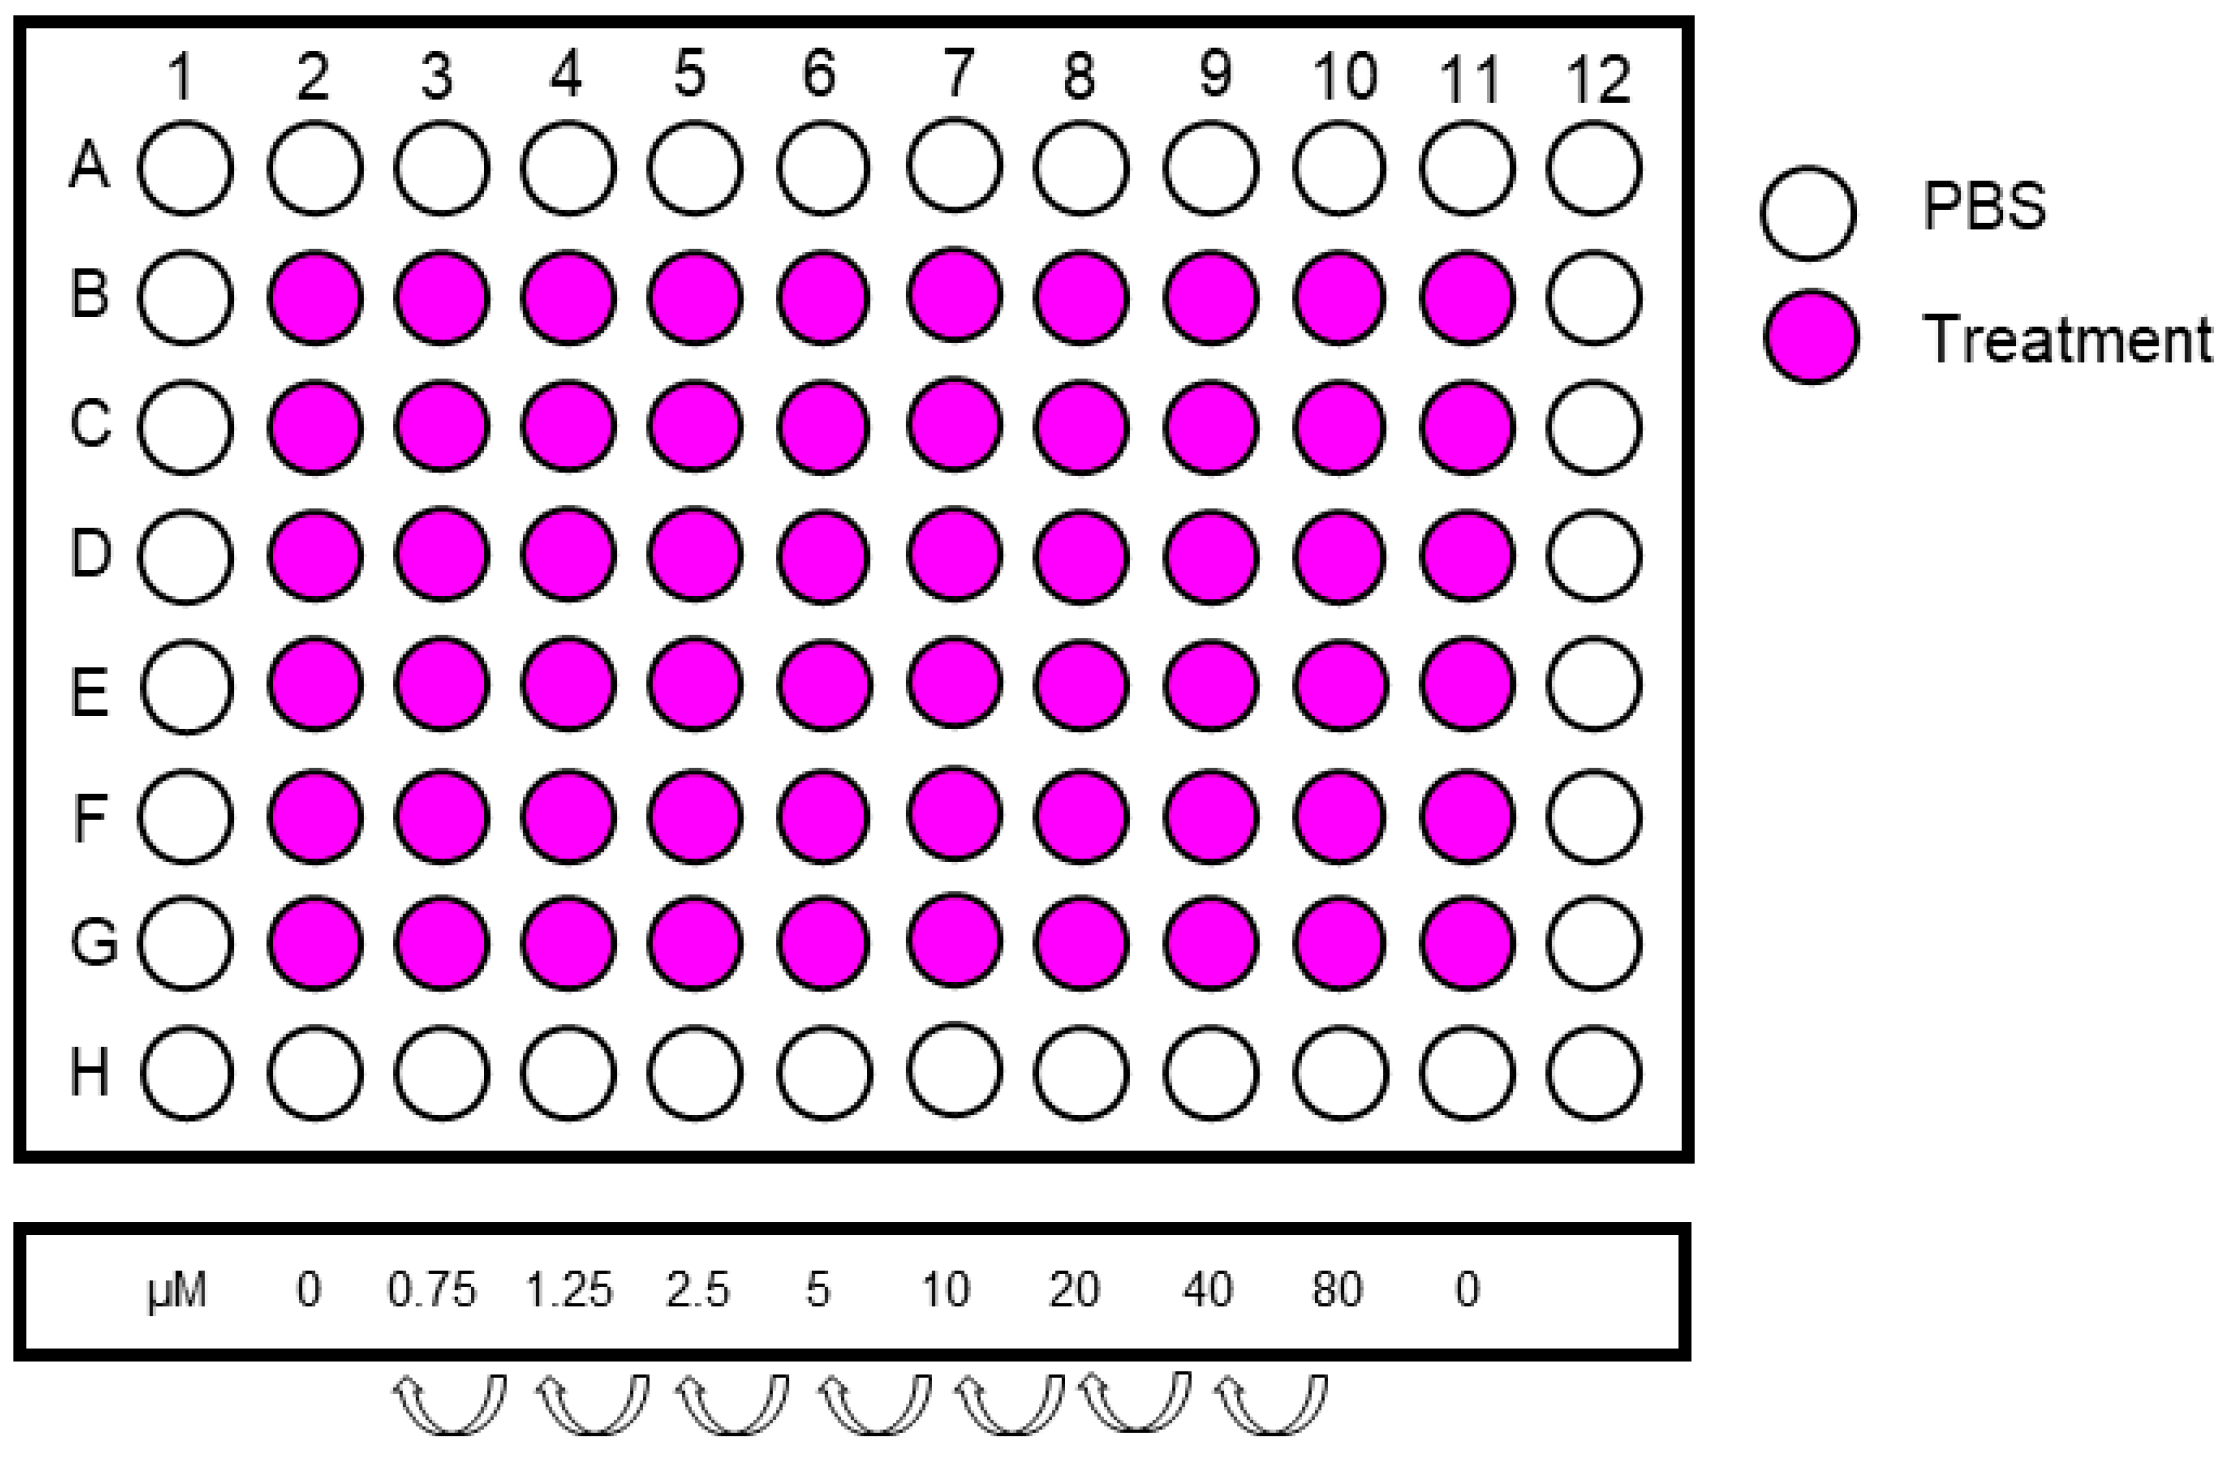
- Make a serial dilution from the highest concentration in a 12-well reservoir. Include 6 replicates per treatment concentration. An example of treatment concentrations is shown in Figure 4.
- 55.
- Include two columns (=12 replicates) of controls.
- 56.
- Aspirate the medium from the cells using a multichannel aspirator adaptor or a multichannel pipette and dispose of accordingly.
- 57.
- Add 100 μL/well of treatment medium using a multichannel pipette and incubate for appropriate time (see Section 4.1 for advice).
Staining of Cells with Crystal Violet—Time for Completion: 30 min Followed by Drying Step (at least 1 h) and then Another 15 min the Next Day
- 58.
- Remove the treatment medium and PBS from plates using a multichannel pipette.
- 59.
- Wash cells with 150 μL PBS/well and subsequently remove PBS with multichannel pipette.
- 60.
- Add 35 µL of 0.1% crystal violet in 10% ethanol to each well, as well as one row without cells (=blank).
- 61.
- Incubate at room temperature for at least 10 min.
- 62.
- Remove the crystal violet solution using a multichannel pipette and dispose of accordingly.
- 63.
- Wash 2× with 150 μL PBS.
- 64.
- Let the plate dry for at least 1 h shielded from light.
- 65.
- When dry add 100 μL of 50% ethanol to each well, tap to mix, and measure absorbance at 595 nm using a plate reader (Figure 5).
Calculation of Cell Survival—Time for Completion: 15 Min
- 66.
- Calculate the mean blank absorbance and subtract it from each absorbance value.
- 67.
- Calculate the mean control absorbance value.
- 68.
- Calculate the cell survival as % control using the following formula:
- 69.
- Calculate the mean and standard deviation of each treatment condition. The standard deviation should be below 15%.
3.4.2. Assessment of DDR Following Carcinogen Treatment
Carcinogen Treatment of Cells—Time for Completion: Set-Up of Experiment: 30 Min Followed by Overnight Incubation, Treatment: 30 Min/Compound
- 70.
- Prepare required amount of 6-well plates by labelling them with the date and passage number.
- 71.
- Sub-culture the cells as described in Section 3.3 and place them in the incubator at 37 °C, 95% humidity, 5% CO2, and 3% O2. Prepare at least four wells/compound (1 control and 3 different treatment concentration, see Section 4.1 for further advice).
- 72.
- The next day prepare sufficient amounts of the highest concentration of the test compound by adding the required volume of carcinogen stock to medium. Also make medium containing an equal concentration of the solvent for the controls.
- 73.
- Make a serial dilution from the highest concentration in tubes.
- 74.
- Aspirate the medium and dispose of accordingly.
- 75.
- Add 2 mL/well of treatment medium and place cells back into incubator for appropriate time (see Section 4.1).
Preparation of Cell Lysates—Time for Completion: 15 Min
- 76.
- When treatment time is finished, label microcentrifuge tubes with treatment conditions.
- 77.
- 78.
- Wash cells once with PBS and add 80–130 μL lysis buffer/well.
- 79.
- Collect lysates in the corner of the dish.
- 80.
- Pipette lysates into labelled microcentrifuge tubes from step 76 and store at −20 °C.
 PAUSE STEP Cell lysates can be stored at −20 °C for several months until analysis.
Protein Quantification and Normalisation—Time for Completion: 90 Min
- 81.
- Before assaying protein concentration, sonicate lysates twice at 20% amp, 0 pulse, 10 sec to shear genomic DNA.
- 82.
- 83.
- Prepare working reagent by mixing 50 parts Reagent A and 1 part Reagent B from the Pierce Bicinchoninic Acid (BCA) Protein Assay.
- 84.
- Add 195 µL working reagent to each well with a multichannel pipette.
- 85.
- Mix the plate by gently tapping on the bench.
- 86.
- Incubate at 37 °C for 20 min.
- 87.
- Read absorption with a plate reader at 595 nm.
 PAUSE STEP Samples can be stored at −20 °C or continue with step 88.
 - 88.
- Calculate protein concentration and normalise samples to the lowest protein concentration with appropriate volumes of lysis buffer. Add bromophenol-blue and 1% β-mercaptoethanol to prepare samples for SDS-PAGE.
- 89.
- Heat samples at 95 °C for 5 min to denature proteins.
 PAUSE STEP Samples can be stored at −20 °C or continue with step 90.
SDS-Polyacrylamide Gel Electrophoresis (SDS-PAGE)—Time for Completion: 2 h
- 90.
- Obtain a precast gel and remove the white tape and comb.
- 91.
- Assemble gel in gel tank and add running buffer.
- 92.
- Rinse the wells of the gel by pipetting fresh running buffer up and down.
- 93.
- Load 5 µL of protein marker in the leftmost well with a gel loading tip.
- 94.
- Load samples with gel loading tips accordingly (max. volume 21 μL).
 CRITICAL STEP Group samples starting with control up to highest concentration. Load a minimum of 15 µg protein.
 - 95.
- Press down lid on chamber, attach cables and run at 150 V for 1.5 h (1.25 h if you include pH2ax).
Transfer—Time for Completion: 2 h
- 96.
- Cut nitrocellulose membrane and filter paper at 8 × 7 cm.
 CRITICAL STEP Avoid touching the membrane with fingers or gloves. Only touch on the protective paper.
 - 97.
- Pour transfer buffer into a plastic container.
- 98.
- Soak two sponges in the buffer and press out air bubbles with a roller.
- 99.
- Disassemble gel cassette by opening the plastic casing using a spatula on all sides.
- 100.
- Remove the top and bottom of the gel.
 CRITICAL STEP As the gel is very fragile care should be taken to avoid breakage.
 - 101.
- Label pre-cut nitrocellulose membrane with the date and gel number with a pencil.
- 102.
- Assemble ‘sandwich’: black (negative) part of blotting cassette—sponge—soaked filter paper—gel—nitrocellulose membrane—soaked filter paper—sponge—red (positive) part of cassette.
 CRITICAL STEP Roll out air bubbles with a roller as they interfere with protein transfer.
 - 103.
- Close the sandwich cassette and lock in chamber.
- 104.
- Add transfer buffer in blotting tank up to line ‘blotting’.
- 105.
- Place cool pack and stir bar inside the tank and set on magnetic stirplate.
- 106.
- Press down the lid on the tank, attach cables and transfer at 110 V for 1.5 h.
- 107.
- Change cool pack after 45 min.
Blocking. Time for Completion: 90 Min
- 108.
- Disassemble the sandwich cassette.
- 109.
- Stain the blot with Ponceau red in a box to assess protein transfer.
- 110.
- Rinse the blot in another box with water to remove background Ponceau stain.
- 111.
- Cut the blot at 28 kDa using a ruler and a scalpel on a plastic sheet.
- 112.
- Place the blot in another box with TBST to remove all Ponceau stain.
- 113.
- Block the membrane in 3% milk in TBST on a shaker at room temperature for 1 h.
 PAUSE STEP Blots can be stored in TBST at 4 °C for up to 3 days.
Primary Antibody. Time for Completion: Overnight
- 114.
- Discard blocking solution.
- 115.
- 116.
- Incubate blots overnight at 4 °C on a rotator.
Secondary Antibody. Time for Completion: 90 Min
- 117.
- Place blots in separate boxes with TBST on a shaker and primary antibody solution back at −20 °C.
- 118.
- Wash blots three times for 10 min with TBST.
- 119.
- 120.
- Place blots into the secondary antibody solution (protein facing upwards).
- 121.
- Incubate on a shaker at room temperature for 1 h.
Detection of Protein Bands. Time for Completion: 30 Min
- 122.
- Discard secondary antibody solution.
- 123.
- Wash blots twice for 10 min, followed by 20 min on a shaker at room temperature with TBST.
- 124.
- Arrange membranes on a piece of cling film (protein facing up, ladder on the left).
- 125.
- Prepare an appropriate volume of enhanced chemiluminescence (ECL) solution by mixing equal parts of Reagent A and Reagent B of the Amersham ECL kit.
- 126.
- Pipette 3 mL of the ECL solution onto each membrane.
- 127.
- Incubate membranes with ECL solution for 1 min.
- 128.
- Close cling film around the membranes and remove all excess liquid with a paper towel.
- 129.
- Secure the membranes in a film cassette by taping down the edges of the cling film.
- 130.
- Expose to film (exposure time ~1–5 min) and then process the film using a medical film processor.
Reprobing a Western Blot for Loading Control (Gapdh)—Time for Completion: 3.5 h
- 131.
- Continuing from step 130, remove blots from cling film and wash for 10 min in TBST.
 PAUSE STEP Blots can be stored in TBST at 4 °C for up to 3 days.
 - 132.
- Place top blot (>28 kDa) into Gapdh-antibody solution and incubate for 30 min at room temperature on a shaker.
- 133.
- Repeat steps 117–130 and store blots at −20 °C.
3.4.3. Assessment of Pre-Mutagenic DNA Adducts (Optional)
- 134.
- Thaw appropriate number of vials of primary HUFs as described in Section 3.2. 3–4 days prior to setting up an experiment for the DNA adduct analysis.
- 135.
- Once cells have reached confluency, label the appropriate number of 75-cm2 flasks.
- 136.
- Trypsinise and count the cells as described in Section 3.3 and seed 1.2 × 10⁶ cells per flask.
- 137.
- Place the flasks in the incubator at 37 °C, 95% humidity, 5% CO2, and 3% O2.
- 138.
- The next day treat the cells with test compound and place flask back in the incubator.
- 139.
- Once the treatment is finished, prepare a pellet as described in Section 3.6.
- 140.
3.4.4. Assessment of lacZ Mutagenicity (Optional)
- 141.
- Thaw appropriate number of vials of primary HUFs as described in Section 3.2 3–4 days prior to setting up an experiment to assess the lacZ mutagenicity.
- 142.
- Once cells have reached confluency, label the appropriate number of 75-cm2 flasks (five per treatment condition).
- 143.
- Trypsinise and count the cells as described in Section 3.3 and seed 1.2 × 10⁶ cells per flask.
- 144.
- Place the flasks in the incubator at 37 °C, 95% humidity, 5% CO2 and 3% O2.
- 145.
- The next day treat the cells with test compound and place flasks back in the incubator.
- 146.
- Once the treatment is finished, label the required number of 175-cm2 flasks.
- 147.
- Trypsinise and count the cells as described in Section 3.3 and seed 2 × 10⁶ cells from each 75-cm2 flask into a 175-cm2 flask.
- 148.
- After three days, prepare a pellet as described in Section 3.6.
- 149.
3.5. Conducting the HIMA
3.5.1. Seeding Cells for the HIMA. Time for Completion: 45 Min
- 150.
- Thaw appropriate number of vials of primary HUFs as described in Section 3.2 3–4 days prior to conducting the HIMA.
- 151.
- Once primary HUFs have reached confluency (D6–7), label desired amount of Corning® CellBIND® 6-well plates with date, day and passage number (D6, P1). For simplicity, this protocol defines the plating day as D6. Assign each well a culture ID. Make sure to differ between culture ID of treated and untreated cultures (e.g., X-1 for treated; C-1 for control).
 CRITICAL STEP Each HIMA should consist of at least 48 treated cultures; the upper limit depends on the experience of the scientist. Additionally, each HIMA should include an appropriate number of controls. Initially, we recommend at least 36 controls, but fewer controls (e.g., 6–12) can be included in subsequent assays when performing consecutive HIMAs in the same laboratory and by the same operator.
 - 152.
- Detach the cells as described in Section 3.3.
- 153.
- Count cells using a hemocytometer and seed cells at 150,000 cells/well in 2 mL medium per well into 6-well plates.
- 154.
- To ensure an even distribution of the cells, move the flasks back and forth before placing them in the incubator at 37 °C, 95% humidity, 5% CO2, and 3% O2.
3.5.2. Carcinogen Treatment of HUFs and Pre-Senescence Culture—Time for Completion: 30 Min for Treatment, Followed by at Least 11 Days (D7–18)
- 155.
- The following day (D7) prepare treatment medium at the desired concentration.
 CRITICAL STEP Select the desired concentration for treatment based on the assessments conducted in Section 3.4 as discussed in Section 4.1.
 - 156.
- Aspirate growth medium and add treatment medium. Incubate with the treatment medium for the desired time.
 CRITICAL STEP Select the desired incubation time for treatment based on the assessments conducted in Section 3.4 as discussed in Section 4.1.
 - 157.
- After the treatment period (D7–9), check cultures under the microscope and remove the treatment medium. Dispose of treatment medium appropriately in hazardous waste. Add 2 mL of fresh medium per well and place cells back into the incubator.
- 158.
- NOTE The confluency of the cells is dependent on the carcinogen concentration as well as treatment time tested which both can impact on cytotoxicity. The control wells are confluent 48 h post-treatment (D9). At this stage controls grow faster than treated cultures. It has been noticed that dependent on the carcinogen tested, growth of treated cells can slow down significantly.
- 159.
- Check cultures daily under a microscope and passage at ratios indicated in Table 2 and as described in Section 3.3 once a culture has reached 80–90% confluency.
 CRITICAL STEP As each well is a separate culture, evaluate its confluency separately. It is normal that some cultures grow faster or slower than other cultures and enter or exit senescence at a different pace. Dip the Pasteur pipette into 70% ethanol between aspirating media from different cultures to avoid carry-over of one culture to another.
 - 160.
- Move cells to an incubator set to 37 °C, 95% humidity, 5% CO2, and 20% O2 five days post-treatment (D11) to induce senescence crisis.
3.5.3. Culture of HUFs during Senescence Crisis—Time for Completion: At Least 8 Days
- 161.
- Continue checking the cells at least every second day under microscope.
 CRITICAL STEP During senescence the morphology of the cells will change. Senescent cells look elongated, flat and they stop dividing.
 - 162.
- Change the medium every three days.
- 163.
- NOTE During senescence it is normal that splitting a culture is often not required for several days. However, if a culture has not continued growth after 14 days, passage all cells (1:1) to a new well.
3.5.4. Culture of HUFs Post-Senescence and Nutlin-3a Counter-Screen—Time for Completion: ~2 Months (D32–90)
- 164.
- Continue checking the cells at least every 2–3 days under the microscope until first clones are emerging.
 CRITICAL STEP When the first clones are emerging, wait until they have populated most of the well (at least half) rather than a smaller fraction of it. It is always recommended to split cells at lower dilutions initially (e.g., 1:1.5) and gradually go higher once the culture can repopulate the well quickly (e.g., 1:4, then 1:10). It is better to split the culture the next day again rather than losing the culture due to too harsh splitting. Cells can now be cultured in standard 6-well plates.NOTE Individual clones visually appear different: they often differ in size and morphology. Some clones grow quickly while others grow very slowly.
 - 165.
- Continue checking cultures daily under microscope. Passage the culture as described in Section 3.3 at ratios indicated in Table 2 when first clones are emerging.TROUBLESHOOTING If wells appear empty after splitting and cultures are not able to recover and repopulate the well again, it is possible that the splitting ratio was too high (Table 2). The culture should thus be split at a lower ratio next time. If the culture has been split too harshly and cannot recover, the remainders can be split again at a lower ratio. Keep the remainders of the cultures during critical steps, i.e., when first clones emerge, because sometimes it can be difficult to estimate the growth of a culture. If unsure how to split a culture, it can be split into two wells at different ratios (e.g., 1:3 and 1:4, or 1:5 and 1:10).
 CRITICAL STEP Perform the Nutlin-3a counter-screen once the culture shows a clonal population of homogenous appearance and has resumed growth. Generally, wait until the culture is able to repopulate a 6-well dish within six days after being split at least 1:3. Most cultures can be split at much higher ratios (Table 2). Again, each culture should be evaluated separately and split at a too low rather than a too high ratio. First clones will emerge as early as 25 days post-treatment (D32+), while some will take up until 83 days post-treatment (D90) of the assay to be ready for screening.
 - 166.
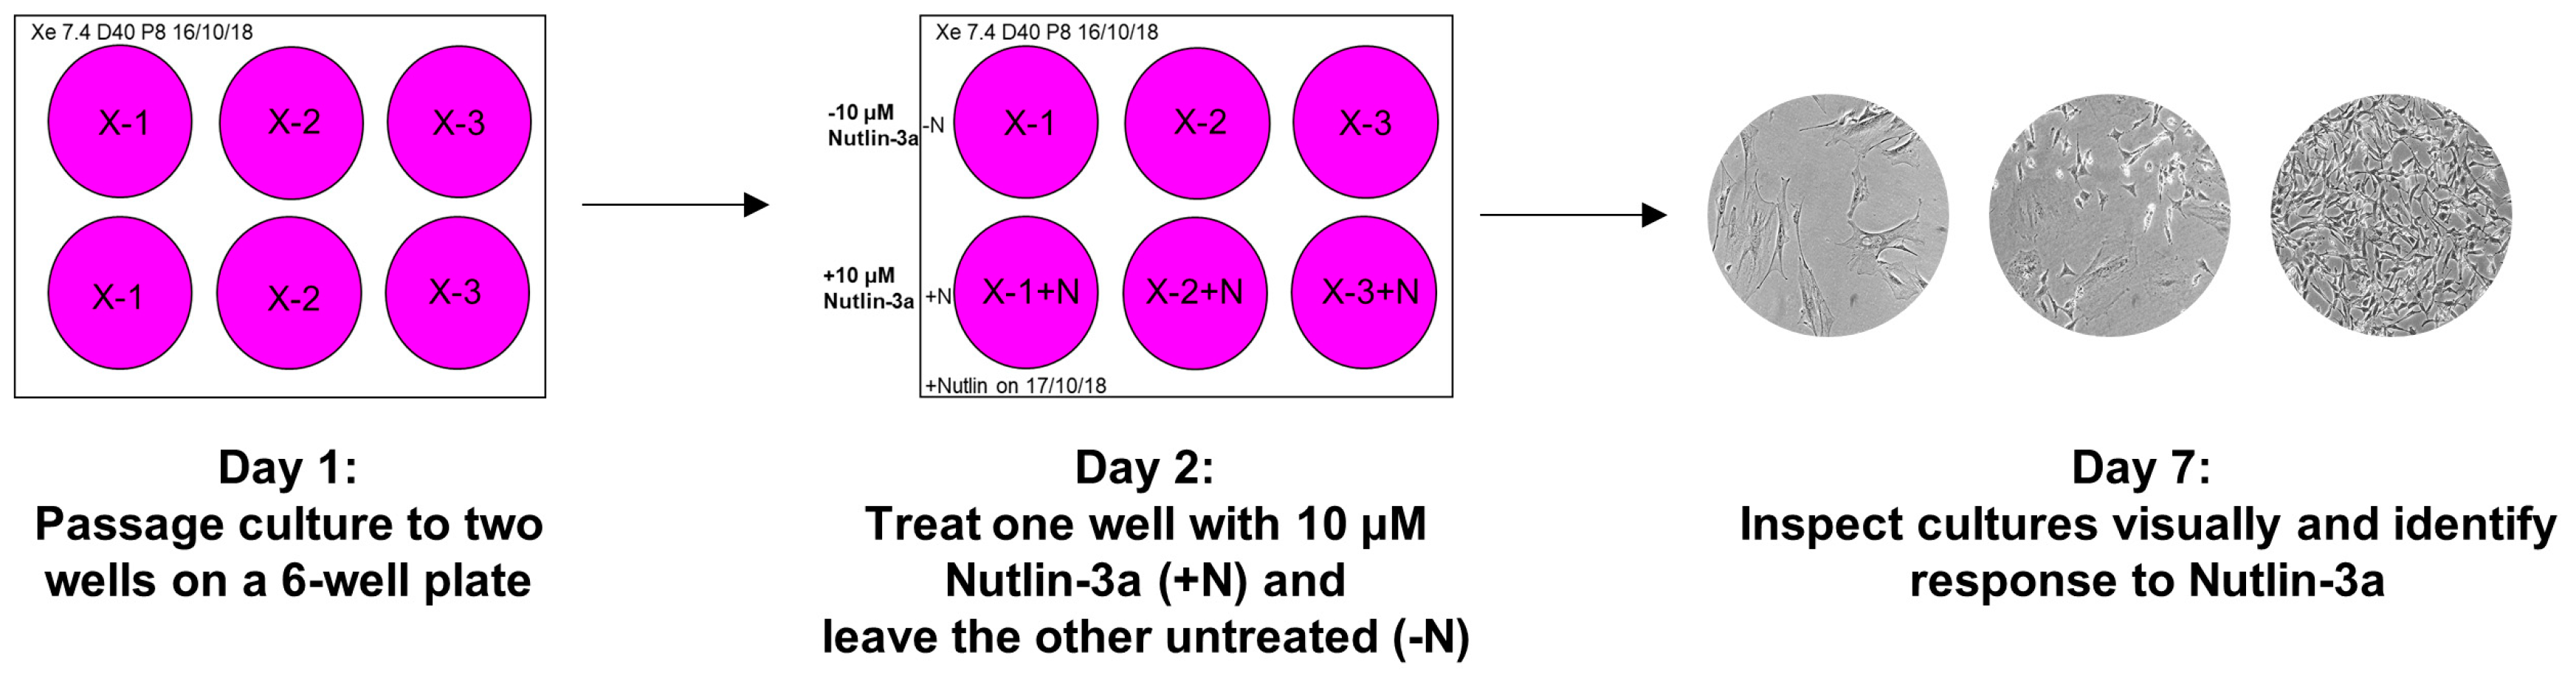
- Prepare two wells on a 6-well plate for each culture that is ready for the Nutlin-3a counter-screen. Label the plates as shown in Figure 6 (Day 1) and add 2 mL growth medium to each well.
- 167.
- Passage the culture as described in Section 3.3 to two wells of the prepared 6-well plate. Choose the splitting ratio based on the last passages so it can repopulate the well in six days.
- 168.
- The next day prepare the Nutlin-3a treatment solution in a 15 mL tube.
- 169.
- Label the plate as shown in Figure 6 (Day 2). Aspirate the medium of both culture wells. Add growth medium to the control well (-N) and the Nutlin-3a treatment solution to the other well (+N).
- 170.
- Place the plate back into the incubator and visually inspect the culture under the microscope after five days to determine the response of the culture towards Nutlin-3a (Figure 6; Day 7).TROUBLESHOOTING If the control well is not full after 5 days of treatment during the Nutlin-3a counter-screen, it is possible that the splitting ratio was too high. Passage the culture once more and rescreen at a lower splitting ratio. If the outcome of the Nutlin-3a counter-screen is unclear after 5 days of treatment, it is possible that the splitting ratio was too low or it may be a mixed-response culture. Sometimes WT-TP53 cells can appear insensitive to Nutlin-3a when they are very full at the beginning of the treatment. Passage the culture once more, then rescreen. If still unsure about the outcome, expand the Nutlin-3a-treated and untreated well and sequence for TP53 mutations.
3.5.5. Expansion into Immortalised HUF Cell Lines—Time for Completion: ~2 Months (D32–90)
- 171.
- NOTE Expand all cultures with a resistant and mixed response towards Nutlin-3a. Also keep the respective Nutlin-3a treated culture. Sometimes with mixed cultures the Nutlin-3a-treated well will have to recover for ~3 days before it can be moved to a T25 flask. Also expand at least one WT culture to prepare western blot lysates from and include on the western blot gel.
- 172.
- At the end of the Nutlin-3a counter-screen label two T25 flasks with culture ID, passage number and date (e.g., 124/124N, P10, 5/10/18) and add 5 mL growth medium per flask.
- 173.
- Passage both the control (-N) and the Nutlin-3a-treated (+N) well at an appropriate ratio from the 6-well plate to the flask. Base the splitting ratio on the ratio used for the Nutlin-3a counter-screen or adjust if well was over-/under-populated at the end of the Nutlin-3a counter-screen.NOTE Take the different surface areas into account.
- 174.
- Once the T25 flask is full repeat step 173 but passage the cells into a T75 flask with 12 mL of growth medium.
- 175.
- Once the T75 flask is full, label one T75 and two T25 flasks and add fresh growth medium into each flask. Passage the culture to the new flasks.
- 176.
- When the next T75 flask is full, trypsinise the cells and use the cell solution to prepare a pellet and two frozen stocks (continue to step 178—Section 3.6).
- 177.
- Make lysates for western blotting from the two T25 flasks (continue to step 188—Section 3.7).
3.6. Cryopreservation of Immortalised HUF Cell Lines and Preparation of Cell Pellets for DNA Isolation—Time for Completion: 30 Min
- 178.
- Following from step 176 (Section 3.5.5), prepare frozen stocks and pellet once the T75 flask is full.
- 179.
- For each T75 flask label two 15-mL tubes with the culture ID and “Tube 1” (for pellet) and “Tube 2” (for stock).
 CRITICAL STEP It is possible to prepare frozen stocks from up to four cultures at a time. Because the freezing medium contains a high percentage of DMSO it is important that cells are moved to −80 °C immediately to avoid any cellular damage.
 - 180.
- Label two cryogenic vials with culture ID, date, passage and size of flask (e.g., X-124, 10/07/18, P15, ¼ T75).
- 181.
- Label one microcentrifuge tube with culture ID and date.
- 182.
- Add half of the cell solution from step 176 (Section 3.5.5) to each of the 15-mL tubes from step 179 and centrifuge at 320× g for 5 min at room temperature.
- 183.
- Prepare freezing medium.
- 184.
- For pellet: transfer pellet from “Tube 1” to a microcentrifuge tube with 600 μL PBS, mix and centrifuge at 2300× g for 3 min at room temperature.
- 185.
- Aspirate the PBS from the pellet and store at −20 °C until DNA isolation (continue step 199—Section 3.9).
 PAUSE STEP Cell pellets can be stored at −20 °C for several months until DNA isolation.
 - 186.
- For frozen stock: Aspirate the supernatant from “Tube 2” and re-suspend the pellet in 2 mL freezing medium (for 2× 1 mL stocks) by gently pipetting up and down.
- 187.
- Add 1 mL to each of the prepared cryogenic vials and place in a Styrofoam box at −80 °C. Transfer vials to liquid nitrogen tank within 1 week.
3.7. Preparation of Cell Lysates for Western Blotting to Assess p53 Activation in Immortalised Clones Following Nutlin-3a Treatment—Time for Completion: 15 Min for Treatment Followed by 24 h Incubation, 15 Min for Collection of Cell Lysates
- 188.
- Once the T25 flasks seeded in step 173 (Section 3.5.5) have reached ~50% confluency prepare DMSO control and Nutlin-3a treatment solution (Section 5).
- 189.
- Label the flask with +DMSO or +Nutlin-3a and aspirate the medium. Add DMSO or Nutlin-3a treatment solution to respective flask and place flask back into incubator.
- 190.
- After 24 h label two microcentrifuge tubes with culture ID −/+N.
- 191.
- Prepare required amount of lysis buffer with protease inhibitors.
- 192.
- Wash cells once with PBS and add 250 μL lysis buffer.
- 193.
- Rotate the flask to ensure the lysis buffer coats the whole surface and collect the lysate in the corner of the flask using a cell scraper.
- 194.
- Pipette lysates into labelled microcentrifuge tubes from step 190 and store lysates at −20 °C.
 PAUSE STEP Cell lysates can be stored at −20 °C for several months until analysis.
3.8. Expression and Activation of p53 in Immortal HUFs Following Treatment with Nutlin-3a—Time for Completion: 3 Days
- 195.
- Following from step 194—Section 3.7 normalise samples as described in Section 3.4.2.
- 196.
- Follow western blot protocol as described in Section 3.4.2. Dilutions for primary and secondary antibodies can be found in Table 5 and Table 6 (Section 5).
 CRITICAL STEP When comparing Nutlin-treated and untreated samples they should be loaded next to each other. Include one TP53-WT culture on each gel. Load a minimum of 10 µg protein.
 - 197.
- Additionally, after probing for p53, the upper membrane should be re-probed for Mdm2.
- 198.
- Follow steps 117–130.
3.9. DNA Isolation for TP53 Sequencing—Time for Completion: 30–90 Min Hands on Time (Depending on Sample Number), Followed by Overnight Wait
- 199.
- Using pellets prepared in Section 3.6, isolate the DNA using the Gentra Puregene Cell Kit B DNA isolation according to manufacturer’s instructions.
- 200.
- The next day quantify concentration and purity of the DNA by measuring UV absorbance at 230, 260 and 280 nm using a NanoDrop microvolume spectrophotometer.
- 201.
- Dilute DNA samples to 100 ng/µL with DNA hydration solution.
- 202.
- Store DNA at −20 °C until further use.
 PAUSE STEP DNA can be stored at −20 °C for several months before PCR analysis.
3.10. PCR Amplification of Exons 4–9 of TP53 from HUF Clone DNA and Sample Preparation for Sequencing—Time for Completion: Half Day
- 203.
- Switch on UV light in PCR hood for ~20 min.
- 204.
- Prepare a Styrofoam box with ice.
- 205.
- Prepare or thaw PCR reagents [primers: 4F, 4R, 5F, 6R, 7F, 7R, 8F, 9R (Table 7—Section 5), REDTaq® ReadyMix™] and DNA samples (see step 202—Section 3.9).
- 206.
- Prepare a layout for a 96-well plate or label 0.5-mL tubes including a negative water control. Four tubes will be required per sample analysing exon 4, exons 5_6, exon 7 and exons 8_9, respectively.
- 207.
- 208.
- Add 2 µL DNA to each tube/well. Pipette up and down and make sure to change the tip after each tube/well.
- 209.
- Place samples in thermal cycler and run programme shown in Table A1 (Appendix A).
 PAUSE STEP Samples can be stored at 4 °C until the next day or for a few days at −20 °C before continuing with the next part of the protocol.
 - 210.
- Prepare agarose gel cast by taping openings with autoclave tape.
- 211.
- Weigh 4 g of ultra-pure agarose in a 200-mL beaker and add 200 mL 1X TBE buffer (2% agarose).
- 212.
- Heat agarose in microwave by boiling for ~3 min until dissolved.NOTE Microwave ovens vary. Start with 1 min, take the solution out and mix it by swirling gently. Repeat until solution is clear. Be very careful when taking the solution out of the microwave. Wear appropriate protective clothing (lab coat and goggles).
- 213.
- Pipette 10 μL ethidium bromide (10 µg/µL) into molten agarose (final ethidium bromide concentration: 0.5 µg/µL).NOTE Ethidium bromide is mutagenic. Wear appropriate clothing and handle with care.
- 214.
- Pour agarose slowly in gel cast making sure not to create bubbles and add combs to gel cast.
- 215.
- Allow the gel to set for ~40 min.
- 216.
- Take out comb, remove autoclave tape and place gel cast in gel tank.
- 217.
- Fill the gel tank with approximately 1 L 1X TBE making sure the electrodes and gel are covered.
- 218.
- Pipette 6 µL DNA ladder into the first well. Pipette 2 µL per well of each PCR reaction onto the gel.
- 219.
- Close lid of gel tank and attach cables accordingly. Run gel at 140 V for ~45 min.
- 220.
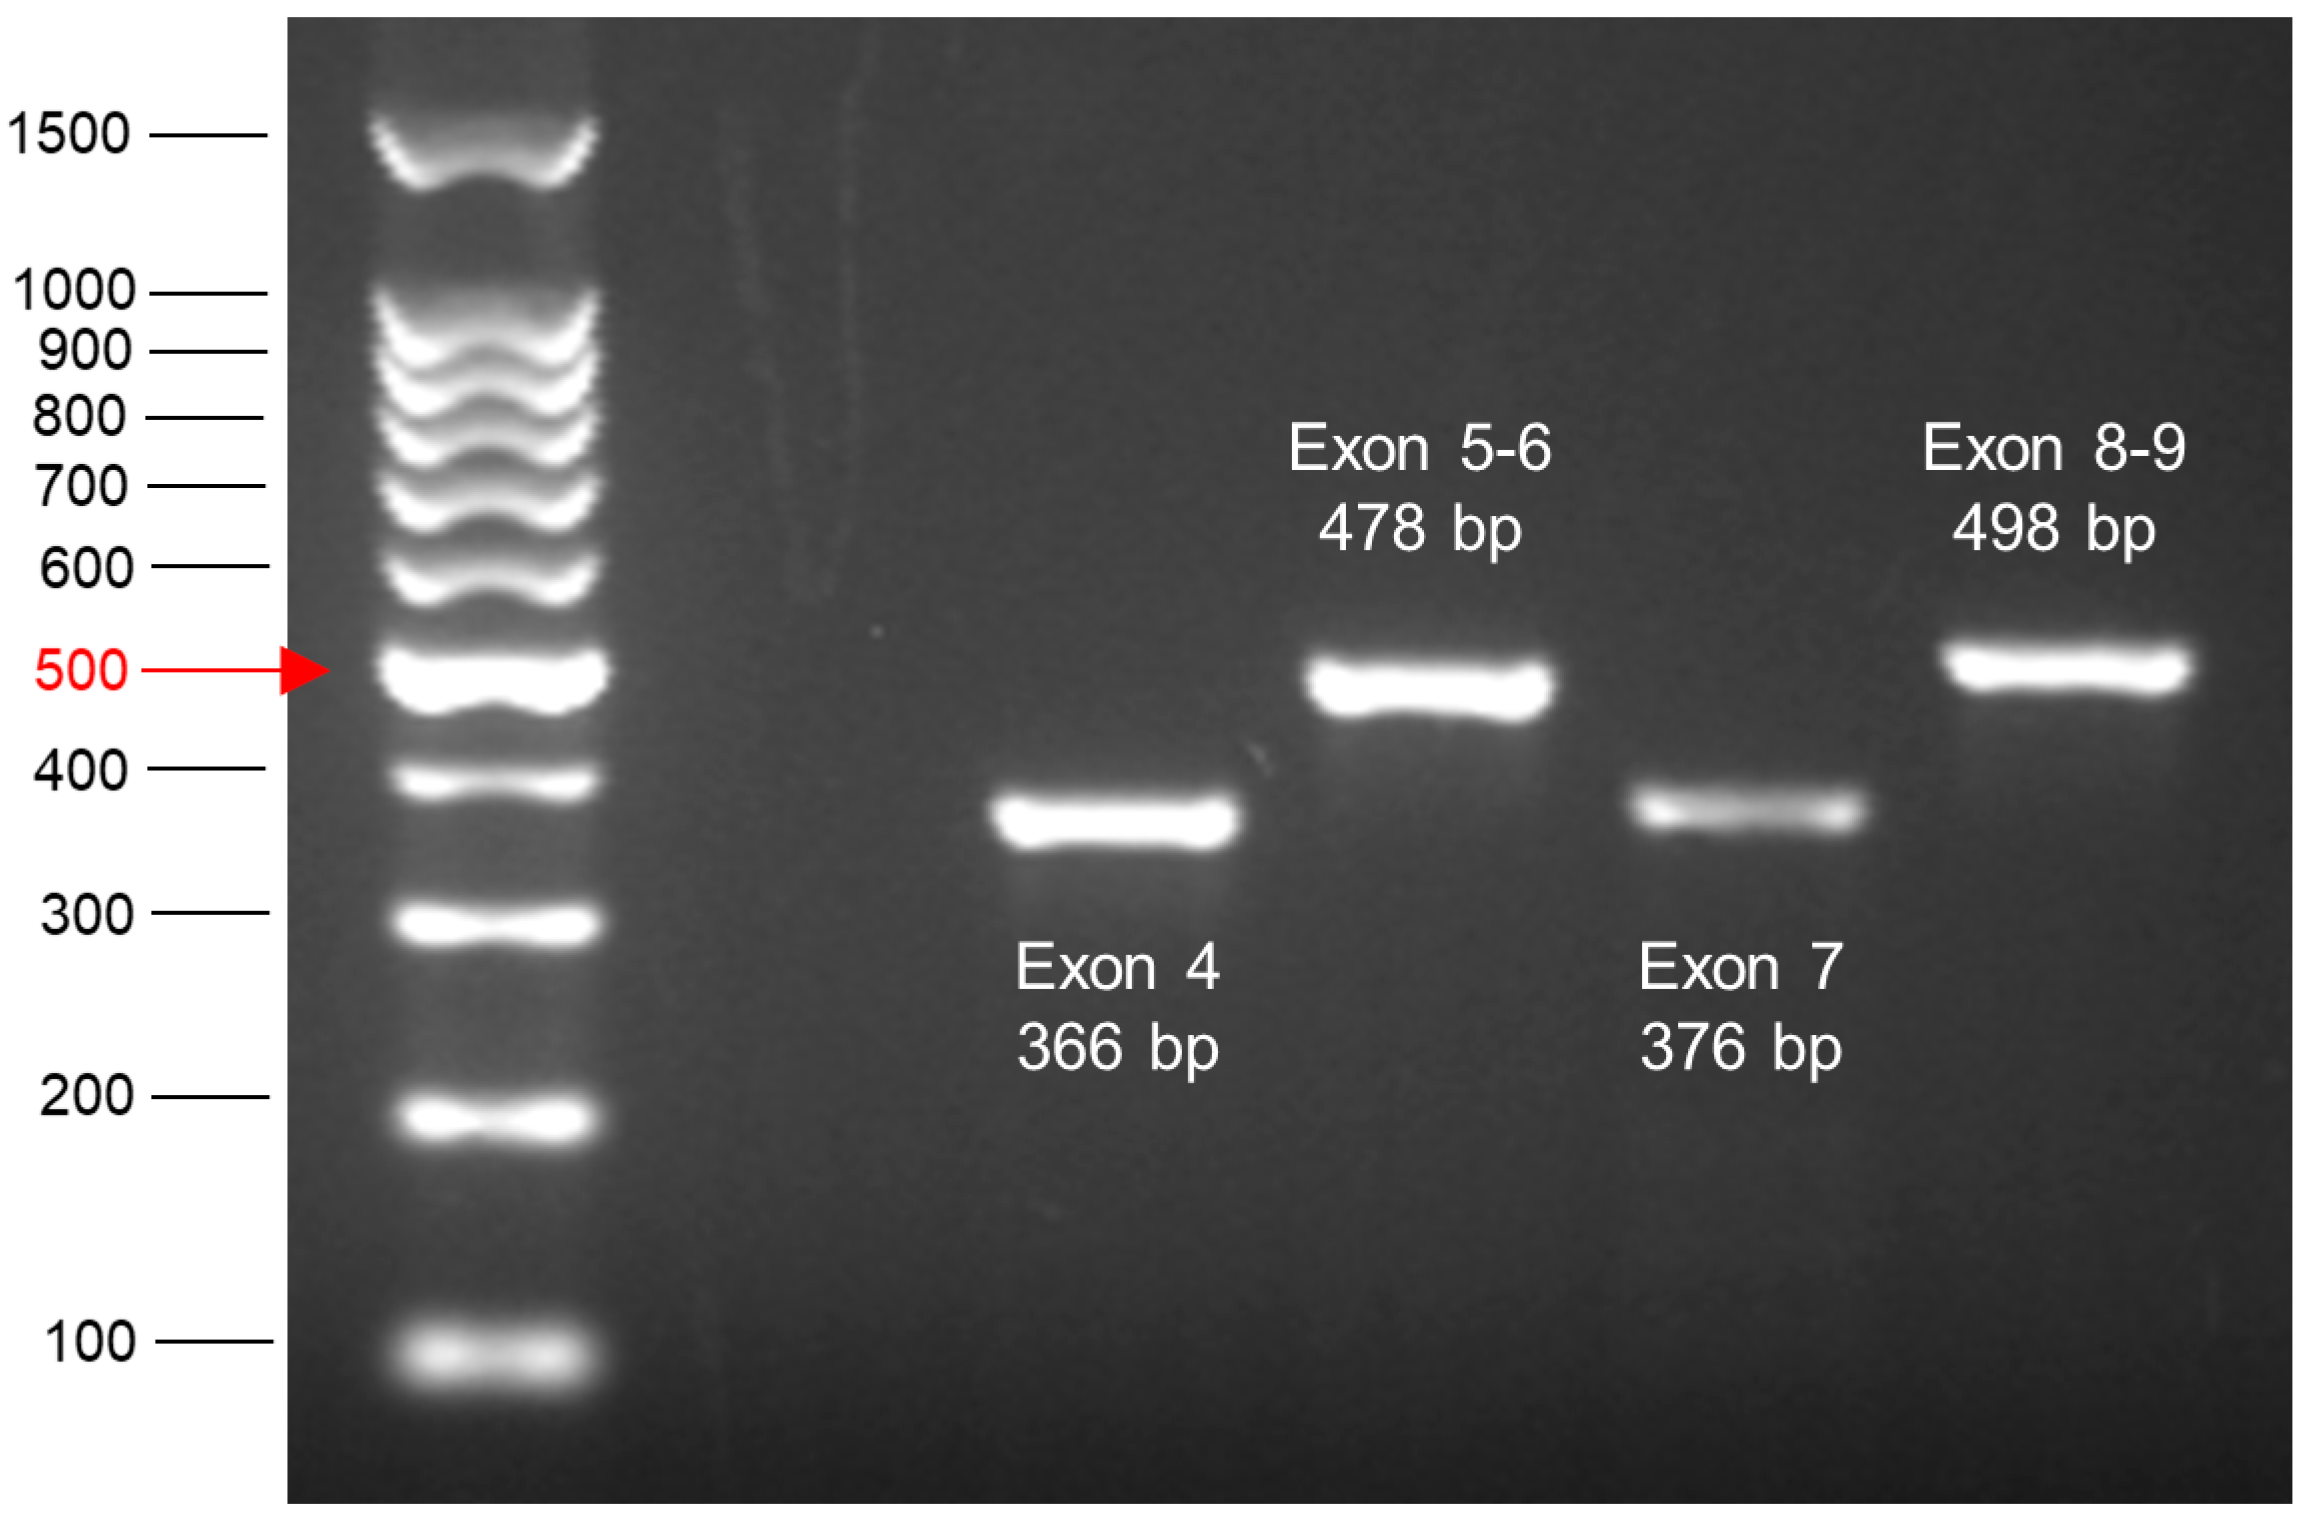
- Visualise bands by exposure to UV light and save image. The expected product sizes are shown in Table 7 (Section 5).
 PAUSE STEP Amplified products can be stored at 4 °C until the next day or for a few days at −20 °C before continuing to next section.
 - 221.
- Clean-up the PCR products from step 209 using the peqGOLD Cycle-Pure Kit according to the manufacturer’s instructions.
3.11. TP53 Sequencing and Analysis—Time for Completion: 2 Days
- 222.
- Perform Sanger dideoxy sequencing on each product from step 221 (Section 3.10) with sequencing primers shown in Table 9 (Section 5). Sanger sequencing is offered by various DNA service providers such as GENEWIZ (www.genewiz.com).
- 223.
- Once the sequencing has been performed you will be provided with an .ab1 file.
 PAUSE STEP The analysis of the .ab1 files can be performed at any preferred time.
 - 224.
- Open the .ab1 file with a suitable software (e.g., Chromas, Technelysium Pty Ltd., Australia) and examine the chromatogram visually (Figure 7A,B).
- 225.
- Reverse and complement the sequence by pressing “reverse” for all exons except exon 8_9 (Figure 7A).
- 226.
- Export the FASTA sequence of each exon using “Ctrl+B”.
- 227.
- Open the Basic Local Alignment Search Tool for Nucleotides (BLASTN) from the National Center for Biotechnology Information (NCBI) (https://blast.ncbi.nlm.nih.gov/Blast.cgi).
- 228.
- Paste the FASTA sequence from step 226 into “Query Sequence” box (Figure 7C).
- 229.
- Copy and paste the TP53-WT sequence from Table A2 (Appendix A) into the “Subject Sequence” box (Figure 7C).
- 230.
- Click “Blast” and print the result (Figure 7C).
- 231.
- Find the beginning and end of the exon. Identify the mutation by looking for missing bases, mismatched bases or insertions (Figure 8).
- 232.
- Check the mutation in the chromatogram visually to identify whether it is a homo-/hemi- or heterozygous mutation (Figure 9).
- 233.
- Use the mutation feature search tool of the IARC TP53 mutation database (http://p53.iarc.fr/TP53GeneVariations.aspx) to assess information about the specific mutation.
- 234.
- Continue analysis with the other clones.
4. Expected Results
4.1. Optimisation of Carcinogen Treatment Conditions for HIMA
4.2. Cell Morphology during HIMA
4.3. Results of the Nutlin-3a Counter-Screen
4.4. Results of TP53 Mutation Analysis in HUFs
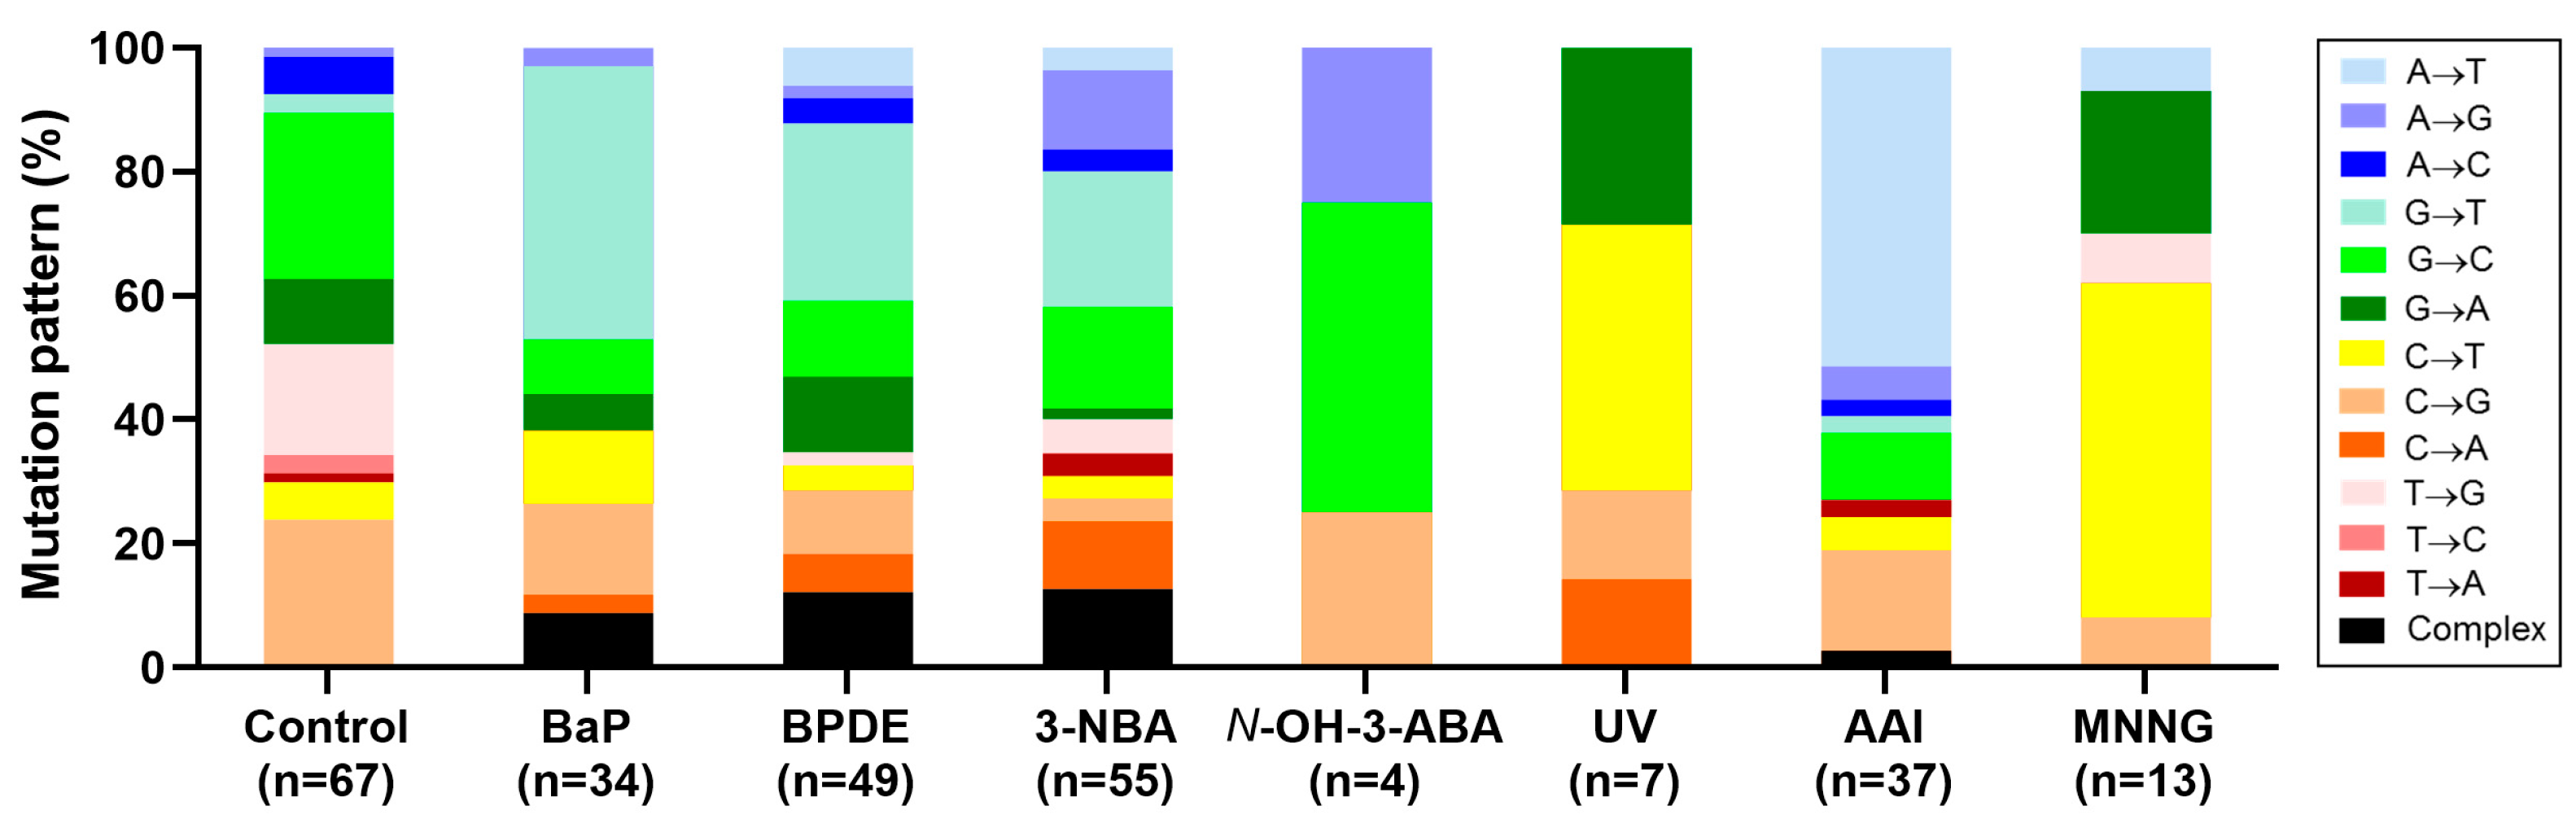
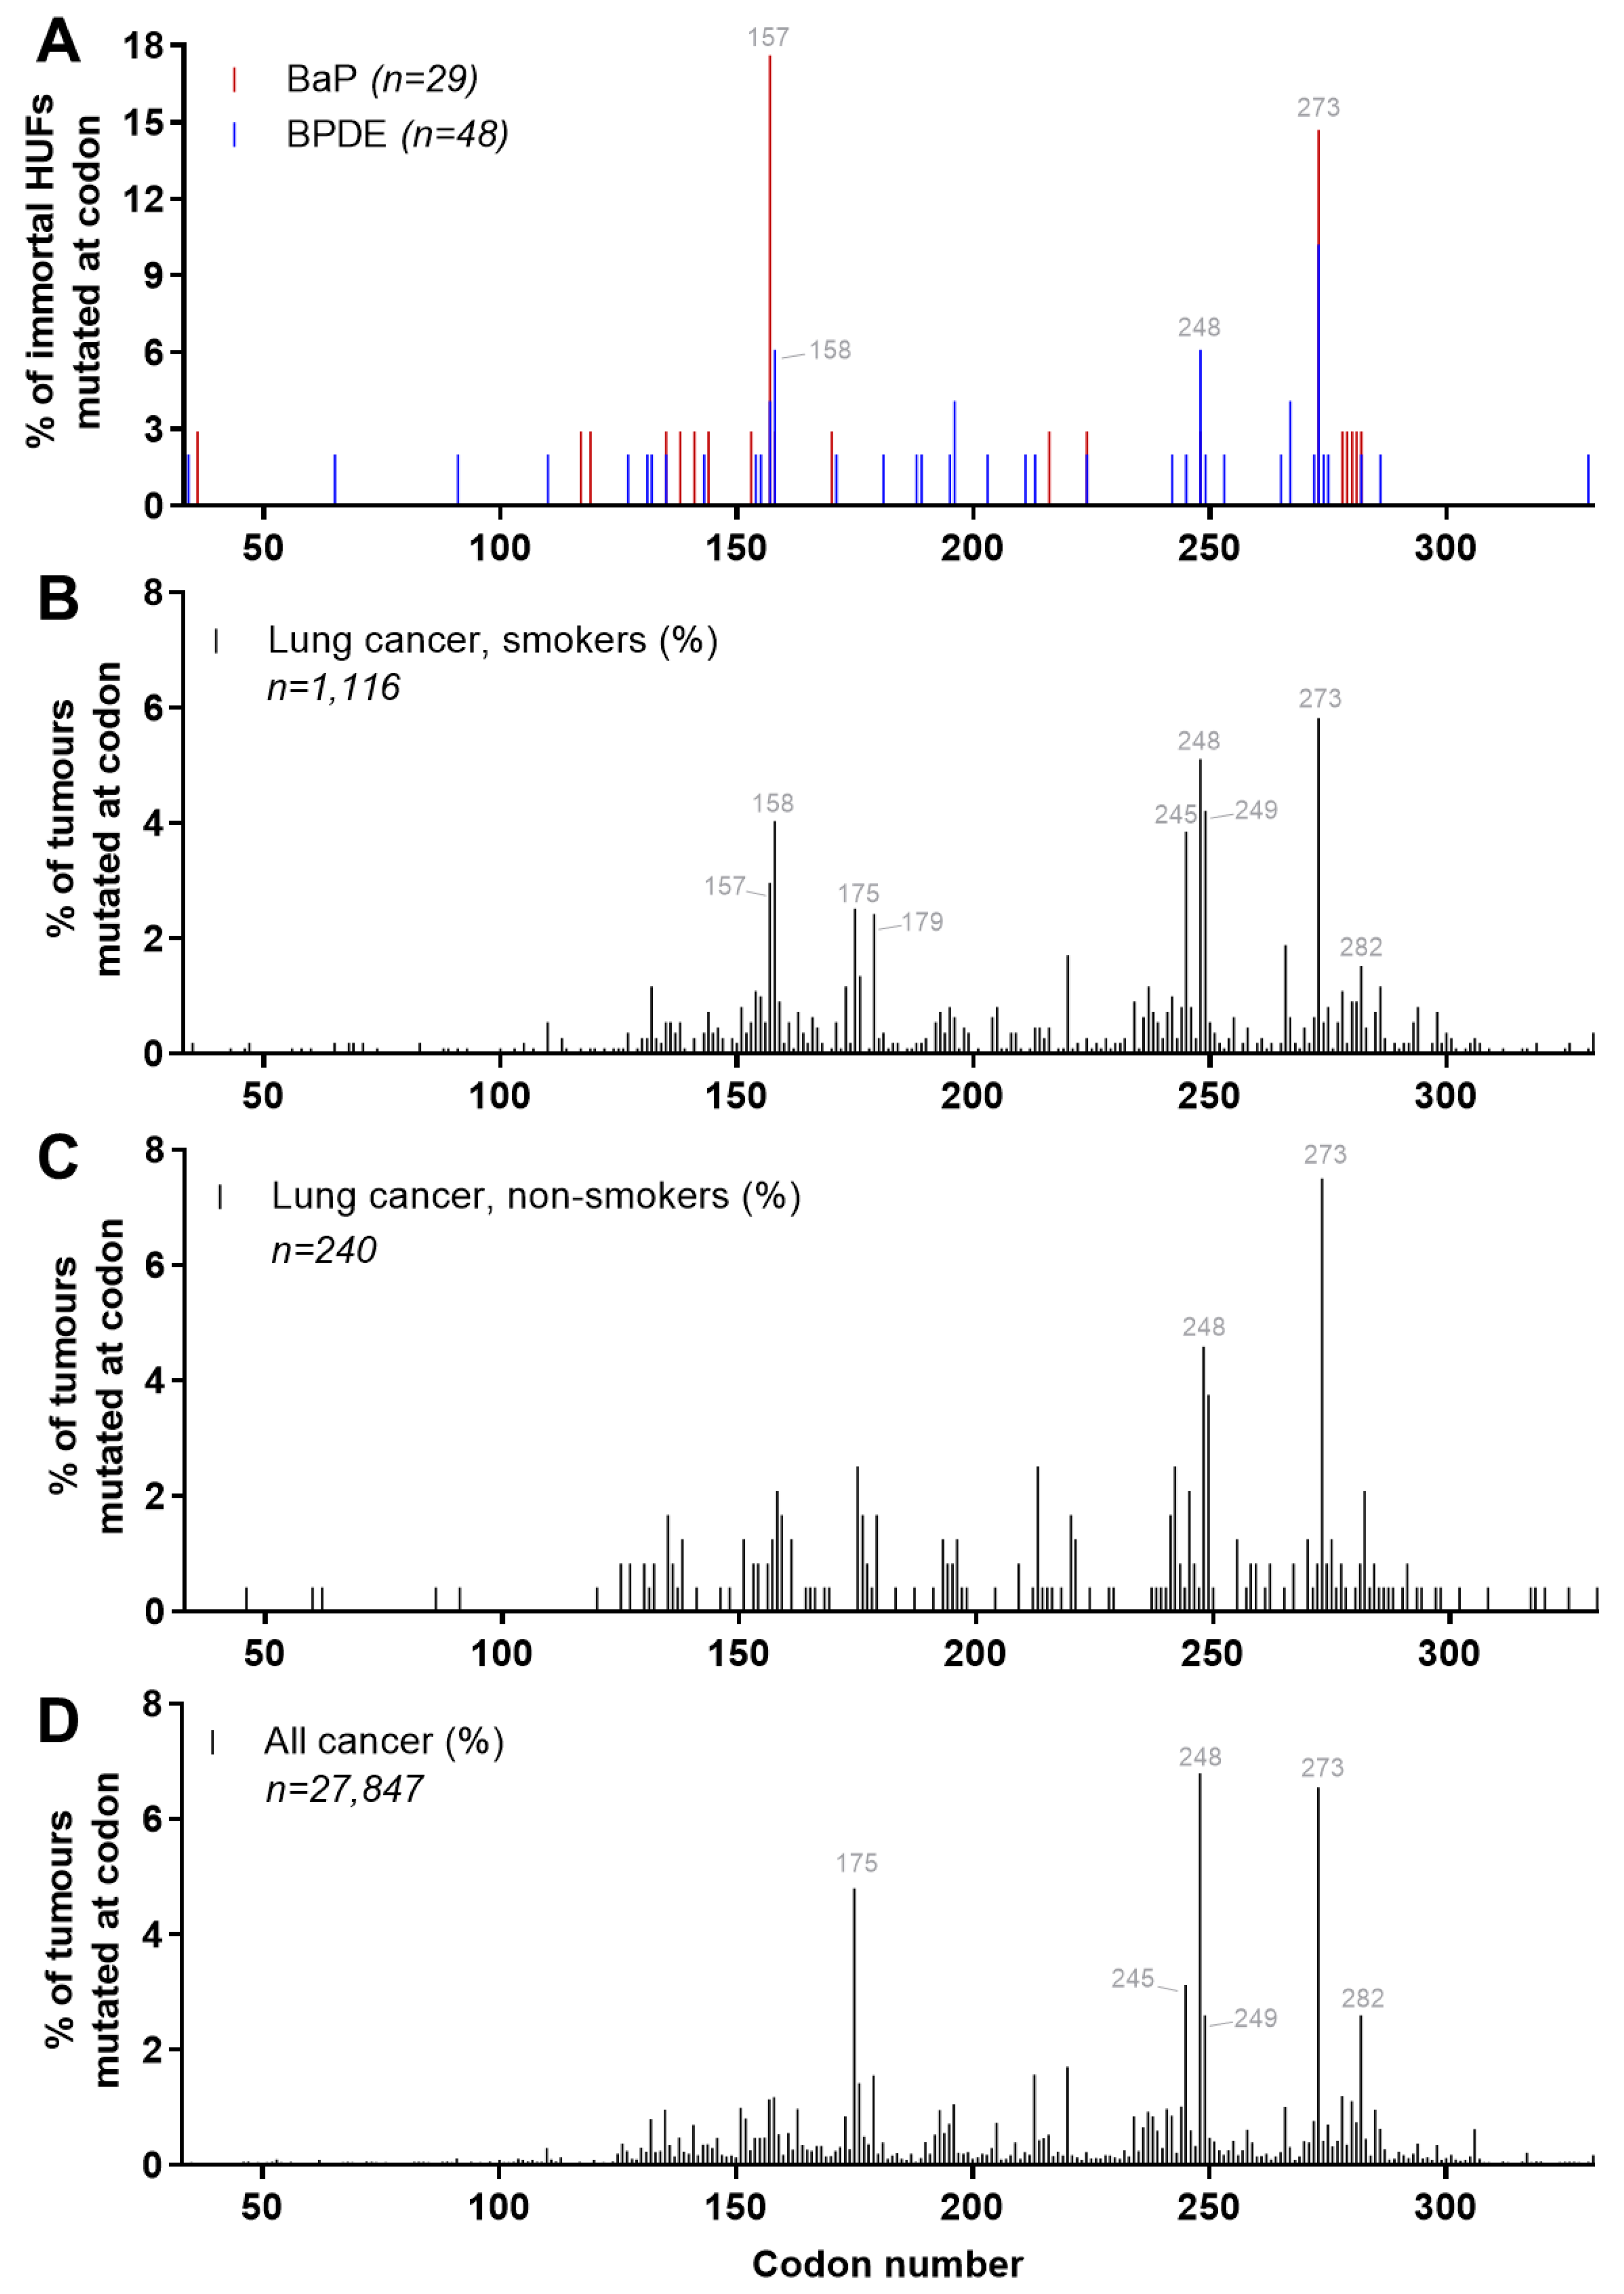
4.5. Carcinogen-Induced TP53 Mutations in HUFs
4.6. Investigating Human Cancer Aetiology Using the HIMA
4.7. Future Perspectives: Investigating Mutational Signatures by Whole Genome Sequencing in Immortalised HUFs after Carcinogen Exposure
5. Reagents Setup
- Growth medium: Mix 500 mL high glucose DMEM with 50 mL fetal bovine serum and 5 mL penicillin/streptomycin solution (10,000 U/mL/10,000 µg/mL). Label the bottle with the preparation date and store at 4 °C for up to 2 weeks.
 CRITICAL STEP All culture work must be carried out in a Class II biosafety cabinet to avoid assay culture contamination.
 - Freezing medium: Prepare 1 mL freezing medium per frozen stock. Always make 1 mL extra. For example, for 2 frozen stocks prepare 3 mL by adding 300 μL DMSO into 2.7 mL growth medium.
- Carcinogen stock solution: Prepare the stock solution by dissolving an appropriate amount in DMSO or another appropriate solvent. Make aliquots which can be store for several years at −20 °C or −80 °C dependent on the agent tested.NOTE Take care when handling carcinogenic compounds. Dispose waste appropriately.
- Carcinogen treatment medium (6-well plate): Prepare 2 mL per well and include 1 mL extra. For example, if treating 120 cultures pipette 241 mL medium into a sterile flask and add the appropriate volume of carcinogen stock solution. Make sure the carcinogen stock has dissolved properly before treating the cells. For controls prepare the medium in the same way but add DMSO instead of carcinogen stock solution. Ensure that the final DMSO concentration in medium does not exceed 1% (typically 0.1–0.2% final).
 CRITICAL STEP Prepare the treatment medium shortly before exposing cells.
 - 0.1% Crystal violet: Dissolve 500 mg of Crystal violet powder in 500 mL 10% ethanol. The solution can be stored at room temperature for up to 24 months.
- Nutlin-3a stock solution: Prepare a 10 mM stock solution by dissolving the appropriate amount of Nutlin-3a in DMSO. Make aliquots which can be stored at −20 °C for at least two years.
- Nutlin-3a treatment solution: Prepare the required volume of treatment solution by adding 10 mM Nutlin-3a stock solution to growth medium to a final concentration of 10 µM. Make 2 mL per 6-well and 5 mL per T25 flask and always include 1 mL extra. For example, for the treatment of three cultures on a 6-well plate prepare 7 mL treatment solution by combining 7 mL medium and 7 μL 10 mM Nutlin-3a stock solution in a 15-mL tube.
 CRITICAL STEP Make fresh prior to use.
 - DMSO treatment solution (for Nutlin-3a counter screen): Prepare the required volume of treatment solution by adding DMSO to growth medium. Make 5 mL treatment solution per T25 flask and add 1 mL extra. For example, for the treatment of three cultures on a 6-well plate prepare 7 mL treatment solution by combining 7 mL medium and 7 μL DMSO in a 15-mL tube.
 CRITICAL STEP Make fresh prior to use.
 - Lysis buffer: Prepare lysis buffer by pipetting components shown in Table 3 into a 50-mL tube. Store at room temperature. Add protease-/phosphatase inhibitors fresh to working solution (10 μL/mL).
- Prepare albumin standards from 0–2 mg/mL as indicated in Table 4.
- Bromophenol Blue lysis buffer (BPB-LB) stock solution: Dissolve 1 mg BPB salt in 10 mL lysis buffer.
- 20X BPB/β-mercaptoethanol (bME) solution: Pipette 80 μL BPB-LB and 20 μL bME into a microcentrifuge tube and use to normalise samples. Make fresh just before use.
- MES running buffer: Add 50 mL 20X MES to 960 mL purified water. Store at room temperature for several month.
- 10X transfer buffer stock: Add 60.57 g Tris base, 288.4 g glycine and 1800 mL water into a beaker and mix on magnetic stirrer. Store at 4 °C for several months.
- 1X transfer buffer: Add 200 mL 10X transfer buffer stock to 1800 mL water and store at 4 °C.
- 10X TBS stock solution: Add 121.14 g Tris base and 175.32 g NaCl to 1800 mL water and mix on magnetic stirrer. Once everything is dissolved, adjust pH to 7.4 by adding concentrated hydrochloric acid. Complete volume accordingly and store for several months at 4 °C.
- 1X TBS with 0.1% Tween-20 (TBST): Mix 200 mL 10X TBS with 1800 mL water, then pipette 2 mL Tween-20 in. Tween-20 is highly viscous and takes some time to be removed from the tip and dissolved. Mix on magnetic stirrer. Prepare fresh on the day.
- 3% milk in TBST: Weigh 6 g powdered milk and add 200 mL TBST. Put on magnetic stirrer until dissolved. Prepare on the day.
- Primary antibody solution: Label 50 mL tubes with antibody name, date and dilution. Add volumes of 3% milk in TBST, primary antibody and sodium azide as shown in Table 5. Primary antibody solutions can be stored for several months at −20 °C.
- Secondary antibody solution: Prepare secondary antibody solution in 40 mL 3% milk in TBST as shown in Table 6 prior to use and discard afterwards.
- Primer stock solutions (100 µM): Spin primers briefly and dilute in TE-buffer to 100 µM as advised on specification sheet. Flick tube to make sure primers are dissolved. Make aliquots which can be stored for several years at −20 °C for several years.
 CRITICAL STEP Keep on ice when not in use.
 - Primer working solutions (10 µM): Label eight microcentrifuge tubes with the primer name (4F, 4R, 5F, 6R, 7F, 7R, 8F, 9R) and concentration (10 µM). Pipette 180 µL nuclease-free water into each tube, add 20 µL of 100 µM primer and mix well by pipetting. Make aliquots which can be stored for several years at −20 °C for at least two thaw-freeze cycles.
 CRITICAL STEP Keep on ice when not in use.
 - PCR Master Mix: Label four microcentrifuge tubes (4, 5_6, 7, 8_9). Calculate the required Master Mix volume as shown in Table 8 below adding 15% extra. Add components to respective microcentrifuge tubes and place back on ice until use.
- Sequencing primer working solutions (10 µM): Label four microcentrifuge tubes with the primer name (4seq, 5_6seq, 7seq, 8_9seq) and concentration (10 µM). Pipette 180 µL nuclease-free water into each tube, add 20 µL of 100 µM primer and mix well by pipetting. Make aliquots which can be stored for several years at −20 °C for several months.
 CRITICAL STEP Keep on ice when not in use.
 - TBE buffer: Mix 1800 mL of ddH2O and 200 mL of 10X TBE buffer stock in a 2-L bottle. Store at room temperature and discard when precipitate forms.
Author Contributions
Funding
Acknowledgments
Conflicts of Interest
Appendix A

| Step | Cycling Parameters | ||
|---|---|---|---|
| Temperature (°C) | Time (min) | Cycles | |
| 1 | 94 | 4 | 1 |
| 2 | 94 | 0.5 | 40 |
| 60 | 0.5 | ||
| 72 | 1 | ||
| 3 | 72 | 7 | 1 |
| 4 | 4–10 | Hold | |
| Exon | Sequence |
|---|---|
| 4 | gtcctctgactgctcttttcacccatctacagTCCCCCTTGCCGTCCCAAGCAATGGATGATTTGATGCTGT CCCCGGACGATATTGAACAATGGTTCACTGAAGACCCAGGTCCAGATGAAGCTCCCAG AATGCCAGAGGCTGCTCCCCCCGTGGCCCCTGCACCAGCAGCTCCTACACCGGCGGCC CCTGCACCAGCCCCCTCCTGGCCCCTGTCATCTTCTGTCCCTTCCCAGAAAACCTACCAG GGCAGCTACGGTTTCCGTCTGGGCTTCTTGCATTCTGGGACAGCCAAGTCTGTGACTTGC ACGgtcagttgccctgaggggctggcttccatgagacttcaatgcctggccgtatccc |
| 5 & 6 | cttgtgccctgactttcaactctgtctccttcctcttcctacagTACTCCCCTGCCCTCAACAAGATGTTTTGCCAA CTGGCCAAGACCTGCCCTGTGCAGCTGTGGGTTGATTCCACACCCCCGCCCGGCACCCG CGTCCGCGCCATGGCCATCTACAAGCAGTCACAGCACATGACGGAGGTTGTGAGGCGC TGCCCCCACCATGAGCGCTGCTCAGATAGCGATGgtgagcagctggggctggagagacgacagggctggt tgcccagggtccccaggcctctgattcctcactgattgctcttagGTCTGGCCCCTCCTCAGCATCTTATCCGAGTG GAAGGAAATTTGCGTGTGGAGTATTTGGATGACAGAAACACTTTTCGACATAGTGTGGT GGTGCCCTATGAGCCGCCTGAGgtctggtttgcaactggggtctctgggaggaggggttaagggtggttgtcagtggc |
| 7 | agatcacgccactgcactccagcctgggcgacagagcgagattccatctcaaaaaaaaaaaaaaaaggcctcccctgcttgccacaggtc tccccaaggcgcactggcctcatcttgggcctgtgttatctcctagGTTGGCTCTGACTGTACCACCATCCACTAC AACTACATGTGTAACAGTTCCTGCATGGGCGGCATGAACCGGAGGCCCATCCTCACCA TCATCACACTGGAAGACTCCAGgtcaggagccacttgccaccctgcacactggcctgctgtgccccagcctctgcttgcc tctgacccctgggcccacctcttaccgatttcttccatactactacccatccacctctcatcacatttccgg |
| 8 & 9 | caagggtggttgggagtagatggagcctggttttttaaatgggacaggtaggacctgatttccttactgcctcttgcttctcttttcctatcctg agtagTGGTAATCTACTGGGACGGAACAGCTTTGAGGTGCGTGTTTGTGCCTGTCCTGGGA GAGACCGGCGCACAGAGGAAGAGAATCTCCGCAAGAAAGGGGAGCCTCACCACGAG CTGCCCCCAGGGAGCACTAAGCGAGgtaagcaagcaggacaagaagcggtggaggagaccaagggtgcagtta tgcctcagattcacttttatcacctttccttgcctctttcctagCACTGCCCAACAACACCAGCTCCTCTCCCCAGC CAAAGAAGAAACCACTGGATGGAGAATATTTCACCCTTCAGgtactaagtcttgggacctcttatcaag tggaaagtttccagtctaacactcaaaatgccgt <human seq, mouse seq> ggtaccaaggctggagagtcgcatgccagagac |
References
- Michael, D.; Oren, M. The p53-Mdm2 module and the ubiquitin system. Semin. Cancer Biol. 2003, 13, 49–58. [Google Scholar] [CrossRef]
- Riley, T.; Sontag, E.; Chen, P.; Levine, A. Transcriptional control of human p53-regulated genes. Nat. Rev. Mol. Cell Biol. 2008, 9, 402–412. [Google Scholar] [CrossRef]
- Bai, L.; Wei, G.Z. p53: Structure, Function and Therapeutic Applications. J. Cancer Mol. 2006, 2, 141–153. [Google Scholar]
- Muller, P.A.; Vousden, K.H. p53 mutations in cancer. Nat. Cell Biol. 2013, 15, 2–8. [Google Scholar] [CrossRef]
- Luo, J.L.; Yang, Q.; Tong, W.M.; Hergenhahn, M.; Wang, Z.Q.; Hollstein, M. Knock-in mice with a chimeric human/murine p53 gene develop normally and show wild-type p53 responses to DNA damaging agents: A new biomedical research tool. Oncogene 2001, 20, 320–328. [Google Scholar] [CrossRef] [PubMed]
- Donehower, L.A.; Harvey, M.; Slagle, B.L.; McArthur, M.J.; Montgomery, C.A.; Butel, J.S., Jr.; Bradley, A. Mice deficient for p53 are developmentally normal but susceptible to spontaneous tumours. Nature 1992, 356, 215–221. [Google Scholar] [CrossRef] [PubMed]
- Busuttil, R.A.; Rubio, M.; Dolle, M.E.; Campisi, J.; Vijg, J. Oxygen accelerates the accumulation of mutations during the senescence and immortalization of murine cells in culture. Aging Cell 2003, 2, 287–294. [Google Scholar] [CrossRef] [PubMed]
- Parrinello, S.; Samper, E.; Krtolica, A.; Goldstein, J.; Melov, S.; Campisi, J. Oxygen sensitivity severely limits the replicative lifespan of murine fibroblasts. Nat. Cell Biol. 2003, 5, 741–747. [Google Scholar] [CrossRef]
- Hahn, W.C.; Weinberg, R.A. Modelling the molecular circuitry of cancer. Nat. Rev. Cancer 2002, 2, 331–341. [Google Scholar] [CrossRef]
- Liu, Z.; Belharazem, D.; Muehlbauer, K.R.; Nedelko, T.; Knyazev, Y.; Hollstein, M. Mutagenesis of human p53 tumor suppressor gene sequences in embryonic fibroblasts of genetically-engineered mice. Genet. Eng. 2007, 28, 45–54. [Google Scholar]
- Liu, Z.; Muehlbauer, K.R.; Schmeiser, H.H.; Hergenhahn, M.; Belharazem, D.; Hollstein, M.C. p53 mutations in benzo(a)pyrene-exposed human p53 knock-in murine fibroblasts correlate with p53 mutations in human lung tumors. Cancer Res. 2005, 65, 2583–2587. [Google Scholar] [CrossRef] [PubMed]
- Feldmeyer, N.; Schmeiser, H.H.; Muehlbauer, K.R.; Belharazem, D.; Knyazev, Y.; Nedelko, T.; Hollstein, M. Further studies with a cell immortalization assay to investigate the mutation signature of aristolochic acid in human p53 sequences. Mutat. Res. 2006, 608, 163–168. [Google Scholar] [CrossRef]
- Kucab, J.E.; Zwart, E.P.; van Steeg, H.; Luijten, M.; Schmeiser, H.H.; Phillips, D.H.; Arlt, V.M. TP53 and lacZ mutagenesis induced by 3-nitrobenzanthrone in Xpa-deficient human TP53 knock-in mouse embryo fibroblasts. DNA Repair 2016, 39, 21–33. [Google Scholar] [CrossRef] [PubMed][Green Version]
- Whibley, C.; Odell, A.F.; Nedelko, T.; Balaburski, G.; Murphy, M.; Liu, Z.; Stevens, L.; Walker, J.H.; Routledge, M.; Hollstein, M. Wild-type and Hupki (human p53 knock-in) murine embryonic fibroblasts: p53/ARF pathway disruption in spontaneous escape from senescence. J. Biol. Chem. 2010, 285, 11326–11335. [Google Scholar] [CrossRef] [PubMed]
- Kucab, J.E.; van Steeg, H.; Luijten, M.; Schmeiser, H.H.; White, P.A.; Phillips, D.H.; Arlt, V.M. TP53 mutations induced by BPDE in Xpa-WT and Xpa-Null human TP53 knock-in (Hupki) mouse embryo fibroblasts. Mutat. Res. 2015, 773, 48–62. [Google Scholar] [CrossRef] [PubMed]
- Leal, J.F.; Fominaya, J.; Cascon, A.; Guijarro, M.V.; Blanco-Aparicio, C.; Lleonart, M.; Castro, M.E.; Ramon, Y.C.S.; Robledo, M.; Beach, D.H.; et al. Cellular senescence bypass screen identifies new putative tumor suppressor genes. Oncogene 2008, 27, 1961–1970. [Google Scholar] [CrossRef] [PubMed]
- Wu, R.W.; Wu, E.M.; Thompson, L.H.; Felton, J.S. Identification of aprt gene mutations induced in repair-deficient and P450-expressing CHO cells by the food-related mutagen/carcinogen, PhIP. Carcinogenesis 1995, 16, 1207–1213. [Google Scholar] [CrossRef]
- Besaratinia, A.; Pfeifer, G.P. Genotoxicity of acrylamide and glycidamide. J. Natl. Cancer Inst. 2004, 96, 1023–1029. [Google Scholar] [CrossRef]
- Maertens, R.M.; Long, A.S.; White, P.A. Performance of the in vitro transgene mutation assay in MutaMouse FE1 cells: Evaluation of nine misleading (“False”) positive chemicals. Environ. Mol. Mutagen. 2017, 58, 582–591. [Google Scholar] [CrossRef]
- Luijten, M.; Zwart, E.P.; Dolle, M.E.; de Pooter, M.; Cox, J.A.; White, P.A.; van Benthem, J. Evaluation of the LacZ reporter assay in cryopreserved primary hepatocytes for In vitro genotoxicity testing. Environ. Mol. Mutagen. 2016, 57, 643–655. [Google Scholar] [CrossRef]
- Kucab, J.E.; Zou, X.; Morganella, S.; Joel, M.; Nanda, A.S.; Nagy, E.; Gomez, C.; Degasperi, A.; Harris, R.; Jackson, S.P.; et al. A Compendium of Mutational Signatures of Environmental Agents. Cell 2019, 177, 821–836. [Google Scholar] [CrossRef] [PubMed]
- Kucab, J.E.; Hollstein, M.; Arlt, V.M.; Phillips, D.H. Nutlin-3a selects for cells harbouring TP53 mutations. Int. J. Cancer 2017, 140, 877–887. [Google Scholar] [CrossRef] [PubMed]
- Vassilev, L.T.; Vu, B.T.; Graves, B.; Carvajal, D.; Podlaski, F.; Filipovic, Z.; Kong, N.; Kammlott, U.; Lukacs, C.; Klein, C.; et al. In vivo activation of the p53 pathway by small-molecule antagonists of MDM2. Science 2004, 303, 844–848. [Google Scholar] [CrossRef] [PubMed]
- Kucab, J.E.; Phillips, D.H.; Arlt, V.M. Linking environmental carcinogen exposure to TP53 mutations in human tumours using the human TP53 knock-in (Hupki) mouse model. FEBS J. 2010, 277, 2567–2583. [Google Scholar] [CrossRef]
- Reinbold, M.; Luo, J.L.; Nedelko, T.; Jerchow, B.; Murphy, M.E.; Whibley, C.; Wei, Q.; Hollstein, M. Common tumour p53 mutations in immortalized cells from Hupki mice heterozygous at codon 72. Oncogene 2008, 27, 2788–2794. [Google Scholar] [CrossRef][Green Version]
- Krais, A.M.; Singh, R.; Arlt, V.M. Carcinogen-DNA adducts. In Encyclopedia of Cancer, 3rd ed.; Boffetta, P., Hainaut, P., Eds.; Academic Press: Cambridge, MA, USA, 2018; pp. 282–295. [Google Scholar]
- Phillips, D.H.; Arlt, V.M. The 32P-postlabeling assay for DNA adducts. Nat. Protoc. 2007, 2, 2772–2781. [Google Scholar] [CrossRef]
- Phillips, D.H.; Arlt, V.M. (32)P-postlabeling analysis of DNA adducts. Methods Mol. Biol. 2014, 1105, 127–138. [Google Scholar]
- Dolle, M.E.; Martus, H.J.; Gossen, J.A.; Boerrigter, M.E.; Vijg, J. Evaluation of a plasmid-based transgenic mouse model for detecting in vivo mutations. Mutagenesis 1996, 11, 111–118. [Google Scholar] [CrossRef]
- Stiborova, M.; Wohak, L.E.; Arlt, V.M. The role of cytochrome P450 enzymes in carcinogen metabolism: Lessons learned from studies with benzo[a]pyrene and aristolochic acid. In Carcinogens, DNA Damage and Cancer Risk–Mechanisms of Chemical Carcinogenesis; Poirier, M.C., Ed.; World Scientific: Singapore, 2019; pp. 21–69. [Google Scholar]
- Jackson, S.P.; Bartek, J. The DNA-damage response in human biology and disease. Nature 2009, 461, 1071–1078. [Google Scholar] [CrossRef]
- White, P.A.; Douglas, G.R.; Phillips, D.H.; Arlt, V.M. Quantitative relationships between lacZ mutant frequency and DNA adduct frequency in MutaMouse tissues and cultured cells exposed to 3-nitrobenzanthrone. Mutagenesis 2017, 32, 299–312. [Google Scholar]
- Long, A.S.; Wills, J.W.; Krolak, D.; Guo, M.; Dertinger, S.D.; Arlt, V.M.; White, P.A. Benchmark dose analyses of multiple genetic toxicity endpoints permit robust, cross-tissue comparisons of MutaMouse responses to orally delivered benzo[a]pyrene. Arch. Toxicol. 2018, 92, 967–982. [Google Scholar] [CrossRef] [PubMed]
- Kucab, J.E.; Phillips, D.H.; Arlt, V.M. Metabolic activation of diesel exhaust carcinogens in primary and immortalized human TP53 knock-in (Hupki) mouse embryo fibroblasts. Environ. Mol. Mutagen. 2012, 53, 207–217. [Google Scholar] [CrossRef] [PubMed]
- de Vries, A.; van Oostrom, C.T.; Hofhuis, F.M.; Dortant, P.M.; Berg, R.J.; de Gruijl, F.R.; Wester, P.W.; van Kreijl, C.F.; Capel, P.J.; van Steeg, H.; et al. Increased susceptibility to ultraviolet-B and carcinogens of mice lacking the DNA excision repair gene XPA. Nature 1995, 377, 169–173. [Google Scholar] [CrossRef] [PubMed]
- Odell, A.F.; Odell, L.R.; Askham, J.M.; Alogheli, H.; Ponnambalam, S.; Hollsein, M. A novel p53 mutant found in iatrogenic urothelial cancers is dysfunctional and can be rescued by a second-site global suppressor mutation. J. Biol. Chem. 2013, 288, 16704–16714. [Google Scholar] [CrossRef]
- Kato, S.; Han, S.Y.; Liu, W.; Otsuka, K.; Shibata, H.; Kanamaru, R.; Ishioka, C. Understanding the function-structure and function-mutation relationships of p53 tumor suppressor protein by high-resolution missense mutation analysis. Proc. Natl. Acad. Sci. USA 2003, 100, 8424–8429. [Google Scholar] [CrossRef]
- vom Brocke, J.; Krais, A.; Whibley, C.; Hollstein, M.C.; Schmeiser, H.H. The carcinogenic air pollutant 3-nitrobenzanthrone induces GC to TA transversion mutations in human p53 sequences. Mutagenesis 2009, 24, 17–23. [Google Scholar] [CrossRef]
- Liu, Z.; Hergenhahn, M.; Schmeiser, H.H.; Wogan, G.N.; Hong, A.; Hollstein, M. Human tumor p53 mutations are selected for in mouse embryonic fibroblasts harboring a humanized p53 gene. Proc. Natl. Acad. Sci. USA 2004, 101, 2963–2968. [Google Scholar] [CrossRef]
- Nedelko, T.; Arlt, V.M.; Phillips, D.H.; Hollstein, M. TP53 mutation signature supports involvement of aristolochic acid in the aetiology of endemic nephropathy-associated tumours. Int. J. Cancer 2009, 124, 987–990. [Google Scholar] [CrossRef]
- Long, A.S.; Lemieux, C.L.; Arlt, V.M.; White, P.A. Tissue-specific in vivo genetic toxicity of nine polycyclic aromatic hydrocarbons assessed using the MutaMouse transgenic rodent assay. Toxicol. Appl. Pharmacol. 2016, 290, 31–42. [Google Scholar] [CrossRef]
- Hockley, S.L.; Arlt, V.M.; Jahnke, G.; Hartwig, A.; Giddings, I.; Phillips, D.H. Identification through microarray gene expression analysis of cellular responses to benzo(a)pyrene and its diol-epoxide that are dependent or independent of p53. Carcinogenesis 2008, 29, 202–210. [Google Scholar] [CrossRef][Green Version]
- Arlt, V.M.; Schmeiser, H.H.; Osborne, M.R.; Kawanishi, M.; Kanno, T.; Yagi, T.; Phillips, D.H.; Takamura-Enya, T. Identification of three major DNA adducts formed by the carcinogenic air pollutant 3-nitrobenzanthrone in rat lung at the C8 and N2 position of guanine and at the N6 position of adenine. Int. J. Cancer 2006, 118, 2139–2146. [Google Scholar] [CrossRef] [PubMed]
- Besaratinia, A.; Pfeifer, G.P. Measuring the formation and repair of UV damage at the DNA sequence level by ligation-mediated PCR. Methods Mol. Biol. 2012, 920, 189–202. [Google Scholar] [PubMed]
- Schmeiser, H.H.; Nortier, J.L.; Singh, R.; Gamboa da Costa, G.; Sennesael, J.; Cassuto-Viguier, E.; Ambrosetti, D.; Rorive, S.; Pozdzik, A.; Phillips, D.H.; et al. Exceptionally long-term persistence of DNA adducts formed by carcinogenic aristolochic acid I in renal tissue from patients with aristolochic acid nephropathy. Int. J. Cancer 2014, 135, 502–507. [Google Scholar] [CrossRef] [PubMed]
- Jelakovic, B.; Dika, Z.; Arlt, V.M.; Stiborova, M.; Pavlovic, N.M.; Nikolic, J.; Colet, J.M.; Vanherweghem, J.L.; Nortier, J.L. Balkan Endemic Nephropathy and the Causative Role of Aristolochic Acid. Semin. Nephrol. 2019, 39, 284–296. [Google Scholar] [CrossRef]
- Stiborova, M.; Arlt, V.M.; Schmeiser, H.H. Balkan endemic nephropathy: An update on its aetiology. Arch. Toxicol. 2016, 90, 2595–2615. [Google Scholar] [CrossRef]
- Bouaoun, L.; Sonkin, D.; Ardin, M.; Hollstein, M.; Byrnes, G.; Zavadil, J.; Olivier, M. TP53 Variations in Human Cancers: New Lessons from the IARC TP53 Database and Genomics Data. Hum. Mutat. 2016, 37, 865–876. [Google Scholar] [CrossRef]
- Sarkar, F.H.; Li, Y.; Vallyathan, V. Molecular analysis of p53 and K-ras in lung carcinomas of coal miners. Int. J. Mol. Med. 2001, 8, 453–459. [Google Scholar] [CrossRef]
- DeMarini, D.M.; Landi, S.; Tian, D.; Hanley, N.M.; Li, X.; Hu, F.; Roop, B.C.; Mass, M.J.; Keohavong, P.; Gao, W.; et al. Lung tumor KRAS and TP53 mutations in nonsmokers reflect exposure to PAH-rich coal combustion emissions. Cancer Res. 2001, 61, 6679–6681. [Google Scholar] [CrossRef]
- Nik-Zainal, S.; Kucab, J.E.; Morganella, S.; Glodzik, D.; Alexandrov, L.B.; Arlt, V.M.; Weninger, A.; Hollstein, M.; Stratton, M.R.; Phillips, D.H. The genome as a record of environmental exposure. Mutagenesis 2015, 30, 763–770. [Google Scholar] [CrossRef]
- Olivier, M.; Weninger, A.; Ardin, M.; Huskova, H.; Castells, X.; Vallee, M.P.; McKay, J.; Nedelko, T.; Muehlbauer, K.R.; Marusawa, H.; et al. Modelling mutational landscapes of human cancers in vitro. Sci. Rep. 2014, 4, 4482. [Google Scholar] [CrossRef]
- Huskova, H.; Ardin, M.; Weninger, A.; Vargova, K.; Barrin, S.; Villar, S.; Olivier, M.; Stopka, T.; Herceg, Z.; Hollstein, M.; et al. Modeling cancer driver events in vitro using barrier bypass-clonal expansion assays and massively parallel sequencing. Oncogene 2017, 36, 6041–6048. [Google Scholar] [CrossRef] [PubMed]
- Zhivagui, M.; Ng, A.W.T.; Ardin, M.; Churchwell, M.I.; Pandey, M.; Renard, C.; Villar, S.; Cahais, V.; Robitaille, A.; Bouaoun, L.; et al. Experimental and pan-cancer genome analyses reveal widespread contribution of acrylamide exposure to carcinogenesis in humans. Genome Res. 2019, 29, 521–531. [Google Scholar] [CrossRef] [PubMed]


| Dish | T25 | T75 | T175 | 6-Well | 96-Well |
|---|---|---|---|---|---|
| Surface area (cm2) | 25 | 75 | 175 | 9.6 | 0.32 |
| Cells/dish (× 106) | 0.4 | 1.2 | 2.8 | 0.15 | 0.005 |
| Medium for culture (mL) | 5 | 12 | 35 | 2 | 0.1 |
| PBS for washing (mL) | 5 | 10 | 12 | 2 | - |
| Trypsin for harvesting (mL) | 1 | 2 | 3 | 0.5 | - |
| Medium to inactivate trypsin (mL) | 4 | 8 | 17 | 1 | - |
| Protocol Stage | Day | Passage | Ratio |
|---|---|---|---|
| Set-up | 6 | 1 | 150,000 cells/well |
| Pre-senescence | 9–10 | 2 | 1:3–1:5 |
| 11–17 | 3–4 | 1:2.5–1:4 | |
| 19–24 | 5 | 1:1.5–1:3 | |
| Senescence | 18+ | 5+ | 1:1 |
| Clones emerging | 32+ | 6+ | 1:1.5–1:2.5 |
| Nutlin-3a counter-screen | 32+ | 7+ | 1:3–1:50 |
| Expansion into cell lines | 32+ | 8+ | 1:3–1:50 |
| Concentration | Final Concentration | Volume (mL) | |
|---|---|---|---|
| Tris pH 6.8 | 1000 mM | 62.5 mM | 1.25 |
| EDTA pH 8.0 | 500 mM | 1 mM | 0.04 |
| SDS | 10% | 2% | 4 |
| Sterile glycerol | 40% | 10% | 5 |
| Water | - | - | 9.75 |
| Inhibitors | 100X | 1X | see text |
| ID | Albumin Concentration (mg/mL) | 2 mg/mL Bovine Serum Albumin (µL) | Lysis Buffer (µL) |
|---|---|---|---|
| A | 2 | 1000 | 0 |
| B | 1.5 | 112.5 A | 37.5 |
| C | 1 | 150 A | 150 |
| D | 0.5 | 150 C | 150 |
| E | 0.25 | 150 D | 150 |
| F | 0.125 | 150 E | 150 |
| G | 0.0625 | 150 F | 150 |
| H | 0 | 0 | 300 |
| Antibody | Dilution | 3% Milk in TBST (mL) | Primary Antibody (µL) | Sodium Azide (µL) |
|---|---|---|---|---|
| p53 | 1:500 | 10 | 20 | 100 |
| p-p53 | 1:2000 | 10 | 5 | 100 |
| p21 | 1:2000 | 10 | 5 | 100 |
| pChk1 | 1:1000 | 10 | 10 | 100 |
| pH2ax | 1:1000 | 10 | 10 | 100 |
| Mdm2 | 1:750 | 10 | 13.3 | 100 |
| Gapdh | 1:25,000 | 40 | 1.6 | 400 |
| Antibody | Rabbit/Mouse | Dilution | Secondary Antibody (µL) |
|---|---|---|---|
| p53 | Mouse | 1:10,000 | 4 |
| p-p53 | Rabbit | 1:20,000 | 2 |
| p21 | Mouse | 1:10,000 | 4 |
| pChk1 | Rabbit | 1:10,000 | 4 |
| pH2ax | Rabbit | 1:10,000 | 4 |
| Mdm2 | Mouse | 1:20,000 | 2 |
| Gapdh | Mouse | 1:10,000 | 4 |
| Exon | Primer Name | Forward/ Reserve | Primer Sequence (5′ to 3′) | Product Size (bp) |
|---|---|---|---|---|
| 4 | 4F | Forward | GTC CTC TGA CTG CTC TTT TCA CCC ATC TAC | 366 |
| 4R | Reverse | GGG ATA CGG CCA GGC ATT GAA GTC TC | ||
| 5 & 6 | 5F | Forward | CTT GTG CCC TGA CTT TCA ACT CTG TCT C | 478 |
| 6R | Reverse | GCC ACT GAC AAC CAC CCT TAA CCC CTC | ||
| 7 | 7F | Forward | AGA TCA CGC CAC TGC ACT C | 376 |
| 7R | Reverse | CCG GAA ATG TGA TGA GAG GT | ||
| 8 & 9 | 8_9F | Forward | CAA GGG TGG TTG GGA GTA GA | 498 |
| 8_9R | Reverse | GTC TCT GGC ATG CGA CTC TC |
| PCR Reaction Component | Concentration | Final Concentration | Reaction Volume (µL) |
|---|---|---|---|
| REDTaq® | 1X | 12.5 | |
| Forward primer | 10 µM | 20 pmol | 2 |
| Reverse primer | 10 µM | 20 pmol | 2 |
| DNA | ~100 ng/µL | 200 ng | 2 |
| Nuclease-free water | ‒ | ‒ | 6.5 |
| Total volume | ‒ | ‒ | 25 |
| Exon | Primer Name | Forward/Reverse | Primer Sequence (5′ to 3′) |
|---|---|---|---|
| 4 | 4seq | Reverse | GAT ACG GCC AGG CAT TG |
| 5 & 6 | 5_6seq | Reverse | GCC ACT GAC AAC CAC C |
| 7 | 7seq | Reverse | CCG GAA ATG TGA TGA GAG GT |
| 8 & 9 | 8_9seq | Forward | CAA GGG TGG TTG GGA GTA GA |
| ID | Codon Number | Exon | Mutation Type | Strand 1 | WT Codon | MUT Codon | Coding Change | Zygo- City | Activity (Kato) 2 |
|---|---|---|---|---|---|---|---|---|---|
| X-1 | 91 | 4 | G:C→A:T | NTS | TGG | TGA | W91stop | Homo-/hemi | NA |
| X-2 | 132 | 5 | A:T→T:A | NTS | AAG | ATG | R132M | Homo-/hemi | NF |
| X-3 | 158 | 5 | del. G | TS | CGC | _GC | Frame-shift | Homo-/hemi | NA |
| X-4 | 196 | 6 | G:C→C:G | TS | CGA | GGA | R196G | Homo-/hemi- | PF |
| X-5 | 224 | 6 | G:C→C:G | NTS | GAG | GAC | E224D | Hetero- | F |
| X-6 | 273 | 8 | G:C→T:A | TS | CGT | AGT | R273S | Hetero- | NF |
| Carcinogen 1 | Treatment Conditions | Total TP53 Mutants | Total TP53 Mutations Detected | Mutant Frequency (Treated) 2 | Mutant Frequency (Untreated) 2 | Reference |
|---|---|---|---|---|---|---|
| BaP #1 | 1 µM; 4–6 days | 11 | 16 | 22.9% (11/48) | 12.5% (6/48) | [11] |
| BaP #2 | 1 µM; 4–6 days | 14 | 18 | NI | NI | [25] |
| BPDE | 0.5 µM; 2 h | 16 4 | 20 4 | 15.7% 4 (16/102) | 3.7% 4 (2/54) | [15] |
| 23 5 | 29 5 | 22.5% 5 (23/102) | 3.7% 5 (2/54) | |||
| 3-NBA #1 | 2 µM; 5 days | 19 | 29 | 21.3% (19/89) | 10.4% (5/48) | [38] |
| 3-NBA #2 | 1 µM; 48–96 h | 11 4 | 14 4 | 18.3% 4 (11/60) | 3.7% 4 (2/54) | [13] |
| 11 5 | 12 5 | 18.3% 5 (11/60) | 3.7% 5 (2/54) | |||
| N-OH-3-ABA | 2 µM; 5 days | 4 | 4 | 11.1% (4/36) | 10.4% (5/48) | [38] |
| AAI #1 | 100 µM; 48 h | 5 | 6 | 20.8% (5/24) | NI | [39] |
| AAI #2 | 50 µM; 48 h | 6 | 6 | 33.3% (6/18) | NI | [12] |
| AAI #3 | 50 µM; 2/4 days | 21 | 25 | NI | NI | [40] |
| MNNG | 20 µM; 2 h | 11 | 13 | NI | NI | [40] |
| UV | 20 J/cm2 72 h | 5 | 7 | 25% (5/20) | 10% (2/20) | [39] |
© 2019 by the authors. Licensee MDPI, Basel, Switzerland. This article is an open access article distributed under the terms and conditions of the Creative Commons Attribution (CC BY) license (http://creativecommons.org/licenses/by/4.0/).
Share and Cite
Hölzl-Armstrong, L.; Kucab, J.E.; Korenjak, M.; Luijten, M.; Phillips, D.H.; Zavadil, J.; Arlt, V.M. Characterising Mutational Spectra of Carcinogens in the Tumour Suppressor Gene TP53 Using Human TP53 Knock-in (Hupki) Mouse Embryo Fibroblasts. Methods Protoc. 2019, 2, 85. https://doi.org/10.3390/mps2040085
Hölzl-Armstrong L, Kucab JE, Korenjak M, Luijten M, Phillips DH, Zavadil J, Arlt VM. Characterising Mutational Spectra of Carcinogens in the Tumour Suppressor Gene TP53 Using Human TP53 Knock-in (Hupki) Mouse Embryo Fibroblasts. Methods and Protocols. 2019; 2(4):85. https://doi.org/10.3390/mps2040085
Chicago/Turabian StyleHölzl-Armstrong, Lisa, Jill E. Kucab, Michael Korenjak, Mirjam Luijten, David H. Phillips, Jiri Zavadil, and Volker M. Arlt. 2019. "Characterising Mutational Spectra of Carcinogens in the Tumour Suppressor Gene TP53 Using Human TP53 Knock-in (Hupki) Mouse Embryo Fibroblasts" Methods and Protocols 2, no. 4: 85. https://doi.org/10.3390/mps2040085
APA StyleHölzl-Armstrong, L., Kucab, J. E., Korenjak, M., Luijten, M., Phillips, D. H., Zavadil, J., & Arlt, V. M. (2019). Characterising Mutational Spectra of Carcinogens in the Tumour Suppressor Gene TP53 Using Human TP53 Knock-in (Hupki) Mouse Embryo Fibroblasts. Methods and Protocols, 2(4), 85. https://doi.org/10.3390/mps2040085