A Crude Extract Preparation and Optimization from a Genomically Engineered Escherichia coli for the Cell-Free Protein Synthesis System: Practical Laboratory Guideline


Abstract
:1. Introduction
2. Experimental Design
2.1. Materials
2.1.1. E. coli Cell Preparation: Culture Media (2xYTPG and LB) and LB Agar Plate
- Genomically engineered E. coli strain K12 MG1655 ΔprfA ΔendA Δrne [15]
- Ampicillin sodium salt (Fisher Bioreagents, Fair Lawn, NJ, USA)
- BactoTM Tryptone (BD Biosciences, San Jose, CA, USA)
- BactoTM yeast extract (BD Biosciences)
- BactoTM agar (BD Biosciences)
- Glucose (Fisher Bioreagents)
- Sodium chloride (Fisher Bioreagents)
- Potassium phosphate dibasic (K2HPO4) (Fisher Bioreagents)
- Potassium phosphate monobasic (KH2PO4) (Fisher Bioreagents)
- Potassium hydroxide (Fisher Bioreagents)
2.1.2. Cell Disruption and Extract Preparation: Buffer A and Dialysis
- 1,4-Dithio-DL-threitol (DTT) (Sigma-Aldrich, St. Louis, MO, USA)
- Potassium acetate (Fisher Bioreagents)
- Magnesium acetate tetrahydrate (Fisher Bioreagents)
- Tris base (Fisher Bioreagents)
- Potassium hydroxide (Fisher Bioreagents)
- Slide-A-Lyzer™ G2 dialysis cassette, 10K MWCO, 3 mL (Thermo Fisher Scientific, Waltham, MA, USA) for dialysis (if necessary)
2.1.3. Cell-Free Protein Synthesis
- Magnesium glutamate (Sigma-Aldrich)
- Ammonium glutamate (MP Biomedicals, Santa Ana, CA, USA)
- Potassium glutamate (Sigma-Aldrich)
- Adenosine triphosphate (ATP) (Alfa Aesar, Haverhill, MA, USA)
- Cytidine triphosphate (CTP) (Alfa Aesar)
- Uridine triphosphate (UTP) (Alfa Aesar)
- Guanosine triphosphate (GTP) (Sigma-Aldrich)
- L-5-formyl-5, 6, 7, 8-tetrahydrofolic acid (Folinic acid) (Alfa Aesar)
- E. coli total tRNA mixture (from strain MRE600) (Roche Applied Science, Indianapolis, IN, USA)
- Phosphoenolpyruvate (PEP) (Alfa Aesar)
- 20 amino acids (Alfa Aesar)
- Nicotinamide adenine dinucleotide (NAD) (Thermo Fisher Scientific)
- Coenzyme-A (CoA) (Sigma-Aldrich)
- Potassium oxalate (Oxalic acid) (Alfa Aesar)
- Putrescine (Thermo Fisher Scientific)
- Spermidine (Thermo Fisher Scientific)
- HEPES (Thermo Fisher Scientific)
- Phusion® high-fidelity DNA polymerase (New England Biolabs, Ipswich, MA, USA) for the preparation of PCR amplified linear template
2.1.4. Protein Quantification
- NuPAGE® 4–12% bis-tris gel (Thermo Fisher Scientific)
- NuPAGE® LDS sample buffer (Thermo Fisher Scientific)
- NuPAGE® MES SDS running buffer (20×) (Thermo Fisher Scientific)
- SimplyBlueTM SafeStain (Thermo Fisher Scientific)
- Coomassie Blue assay reagent (Thermo Fisher Scientific)
- 1,4-Dithio-DL-threitol (DTT) (Sigma-Aldrich)
2.2. Equipment
- 2.5 L baffled Tunair shake flasks (IBI Scientific, Peosta, IA, USA)
- 300 mL baffled Tunair shake flasks (IBI Scientific)
- New Brunswick™ Innova® 42 incubator shaker (Eppendorf, Hamburg, Germany)
- GenesysTM 6 UV-Vis spectrophotometer (Thermo Fisher Scientific)
- Sorvall Legend X1 Sorvall Legend X1R centrifuge (Thermo Fisher Scientific, USA)
- TX-400 swinging bucket rotor (Thermo Fisher Scientific)
- Round Buckets for TX-400 rotor (Thermo Fisher Scientific)
- Fiberlite™ F15-8 × 50cy fixed angle rotor (Thermo Fisher Scientific)
- Thermo Scientific set of four adapters for 15 mL Conical Tube (Thermo Fisher Scientific)
- MicroClick 30 × 2 fixed angle microtube rotor (Thermo Fisher Scientific)
- Q125 Sonicator with 1/8” (3 mm) diameter probe (Qsonica, Newtown, CT, USA)
- SynergyTM HTX multi-mode microplate reader (BioTek, Winooski, VT, USA)
- GenesysTM 6 UV-Vis spectrophotometer (Thermo Fisher Scientific)
- Fisherbrand™ accuSpin™ micro 17 microcentrifuges (Thermo Fisher Scientific)
- PowerPac™ basic power supply (Bio-Rad, Hercules, CA, USA)
- Mini gel tank (Invitrogen, Carlsbad, CA, USA)
- Direct-Q3® UV water purification system (Millipore, Burlington, MA, USA)
- Scotsman flake ice maker (CurranTaylor, Canonsburg, PA, USA)
3. Procedure
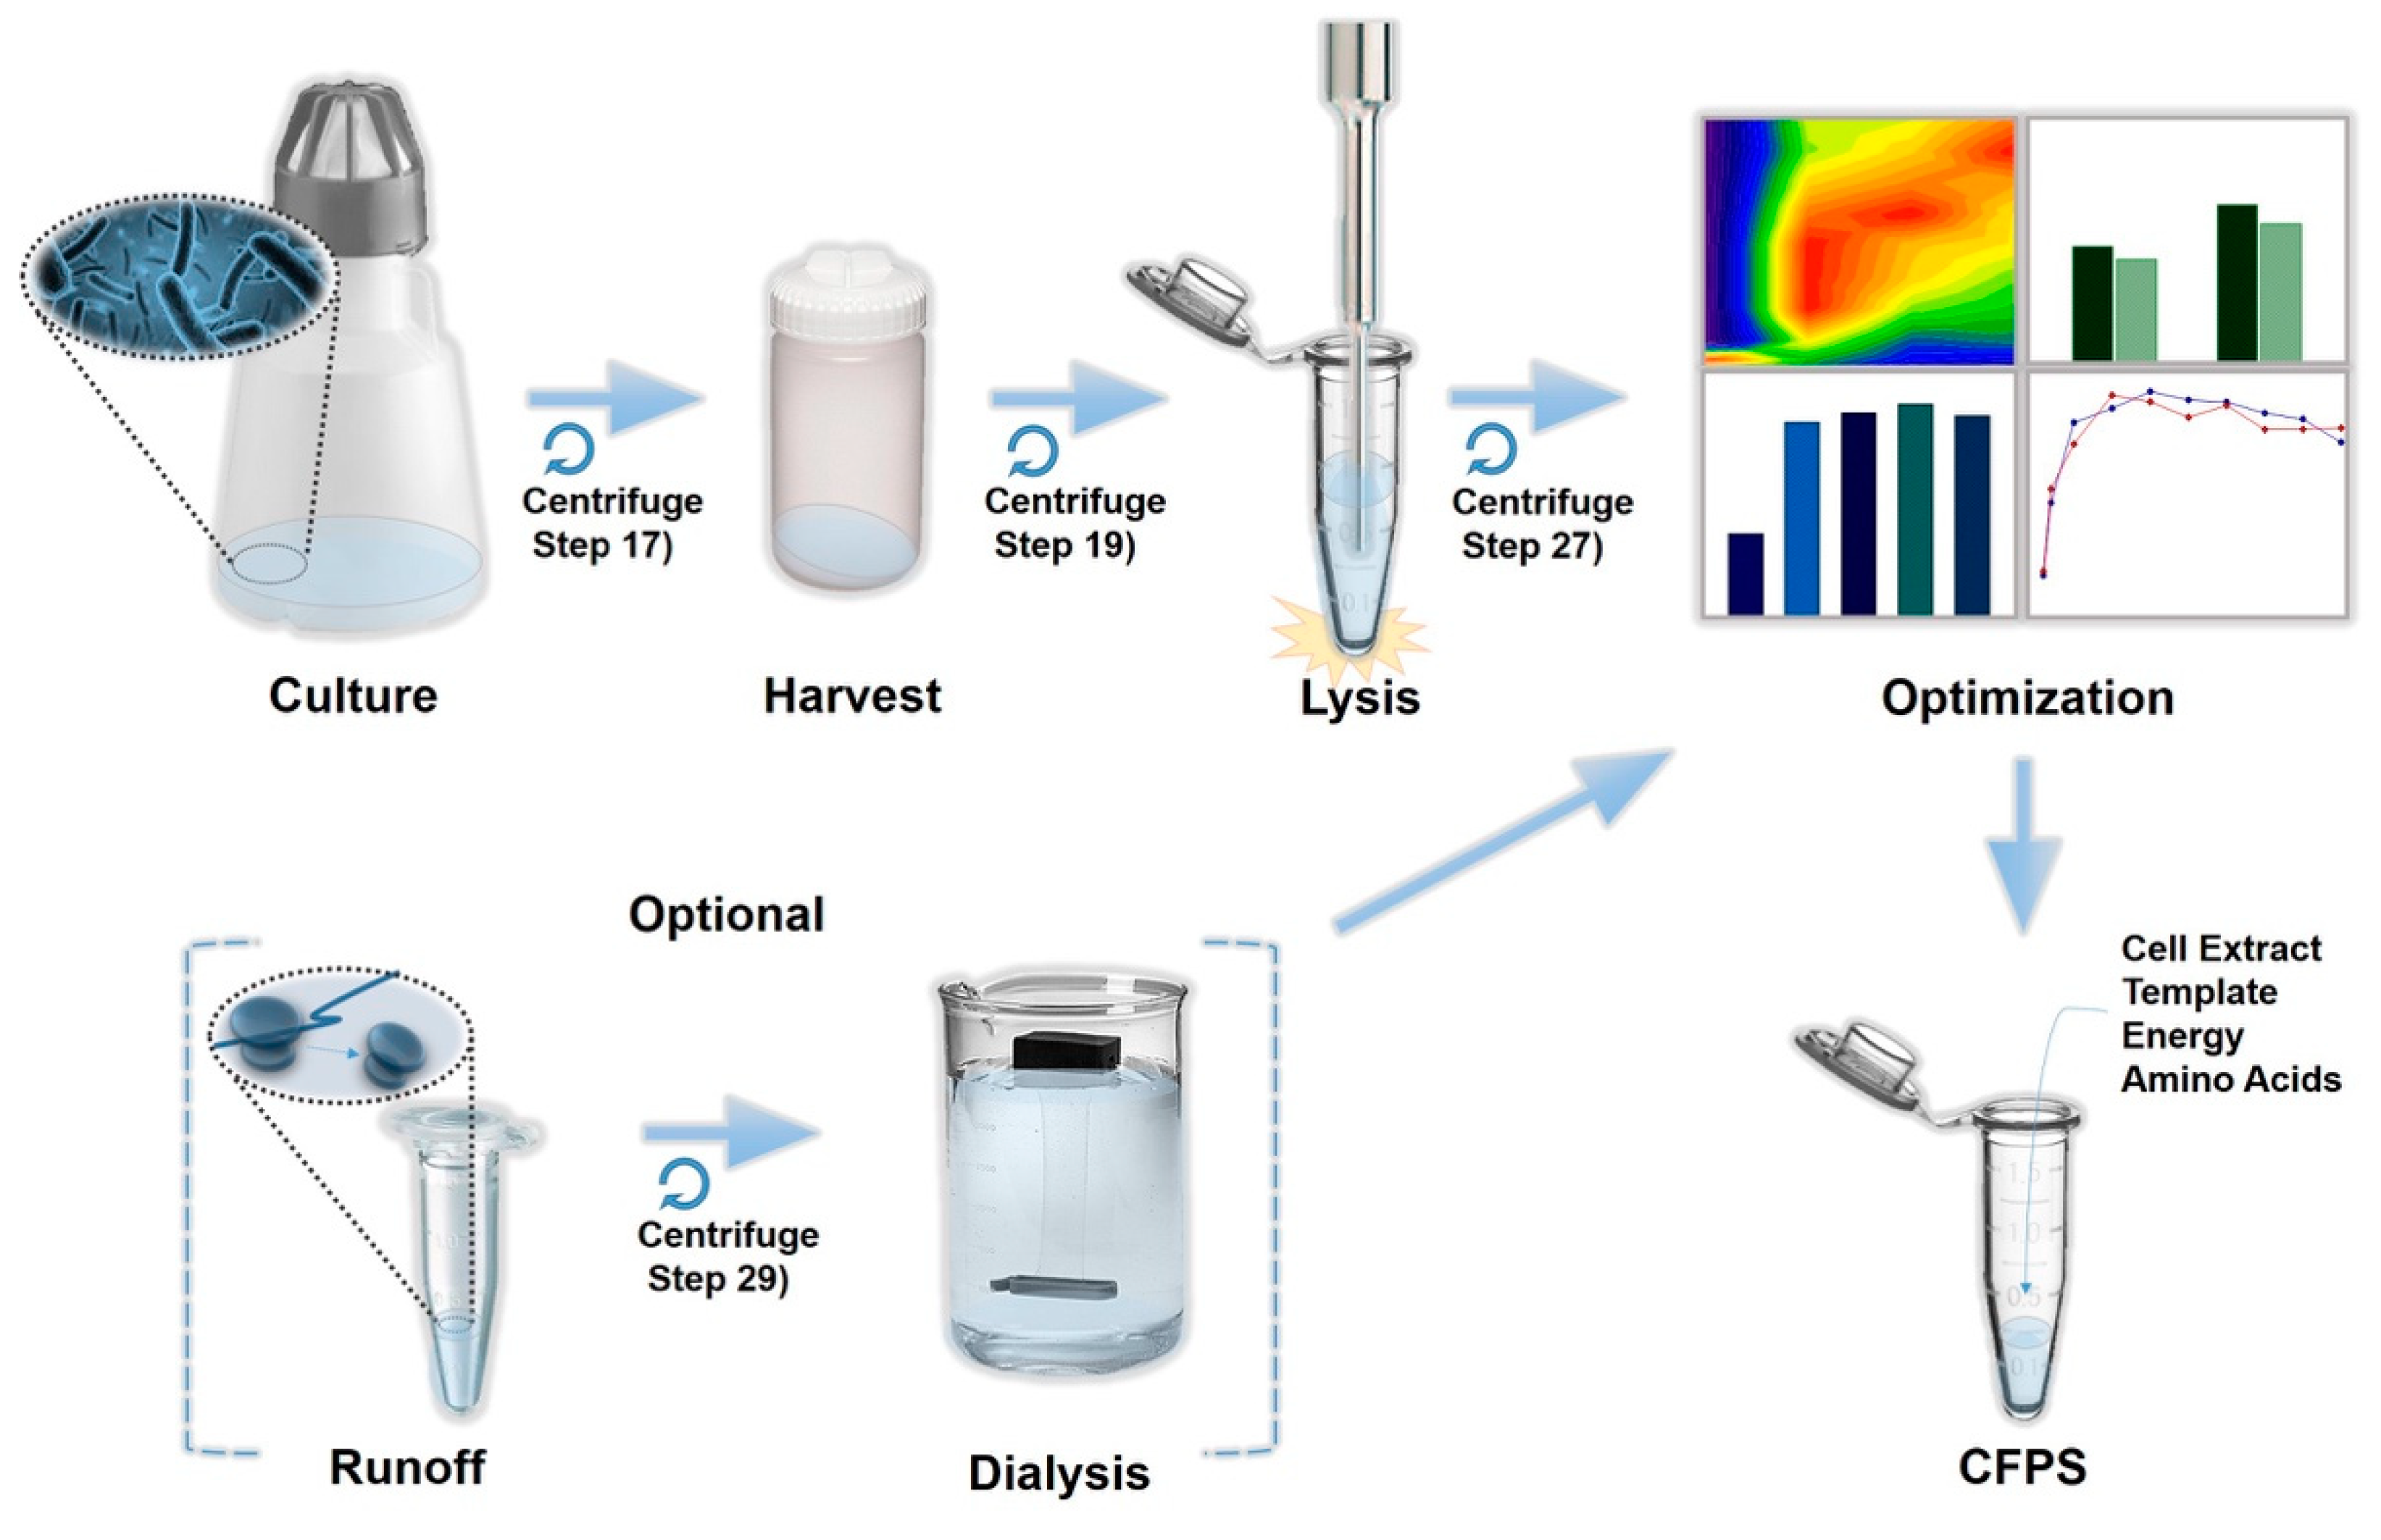
3.1. Cell Extract Preparation. Time for Completion: Four Days
3.1.1. Day 1
- (1)
- LB media: Dissolve 10 g/L of tryptone, 5 g/L of yeast extract, 10 g/L of sodium chloride in Milli-Q water and sterilize at 121 °C for 30 min.
- (2)
- LB-agar plate: Dissolve 10 g/L of tryptone, 5 g/L of yeast extract, 10 g/L of sodium chloride, and 15 g/L of bacto-agar in Milli-Q water and sterilize 121 °C for 30 min. Place the container in 55–65 °C water bath to cool the solution. Add appropriate antibiotics (if necessary), mix well, and solidify in Petri dishes (20 mL each).
- (3)
- Streak LB-agar plate with E. coli K12 MG1655 ΔprfA ΔendA Δrne and incubate overnight (16–20 h) at 34 °C.
- (4)
- Put 1 L of Milli-Q water and centrifuge rotors in 4 °C.
- (5)
- Prepare three buffer A stock solutions (100x) in separate bottles (500 mL each), (a) 1 M Tris-acetate (pH 8.2): Dissolve 60.57 g of Tris base in 500 mL of Milli-Q water and adjust pH to 8.2 with 5 N potassium hydroxide, (b) 1.4 M Magnesium acetate: dissolve 107.23 g of magnesium acetate tetrahydrate in 500 mL of Milli-Q water, (c) 6 M potassium acetate: Dissolve 294.42 g of potassium acetate in 500 mL of Milli-Q water. All solutions are filtrated by passing them through a 0.2 μm filter unit.
3.1.2. Day 2
- (1)
- Pick a single bacterial colony (2–3 mm in diameter) from the plate and transfer the colony into 30 mL of LB media in a 125 mL baffled flask with appropriate antibiotics.
- (2)
- Incubate the culture for overnight (8–12 h) at 34 °C with vigorous shaking at 250 rpm.
- (3)
- Glucose solution: 18 g/L of glucose (0.4 M) in Milli-Q water.
- (4)
- 2xYTP media: dissolve 16 g of tryptone, 10 g of yeast extract, 5 g of sodium chloride, 7 g of potassium phosphate dibasic, and 3 g of potassium phosphate monobasic in 500 mL of Milli-Q water in 1 L beaker.
- (5)
- Adjust pH with 5 N potassium hydroxide until it reaches 7.2 and then add Milli-Q water until it reaches 750 mL.
- (6)
- Transfer 750 mL 2xYTP (pH 7.2) to 2.5 L baffled Tunair shake flask, close the cap, and warp with aluminum foil.
- (7)
![Mps 02 00068 i001]() CRITICAL STEP 2xYTP media and glucose solution are prepared in separate containers and sterilize at 121 °C for 30 min separately.
CRITICAL STEP 2xYTP media and glucose solution are prepared in separate containers and sterilize at 121 °C for 30 min separately.

3.1.3. Day 3
- (8)
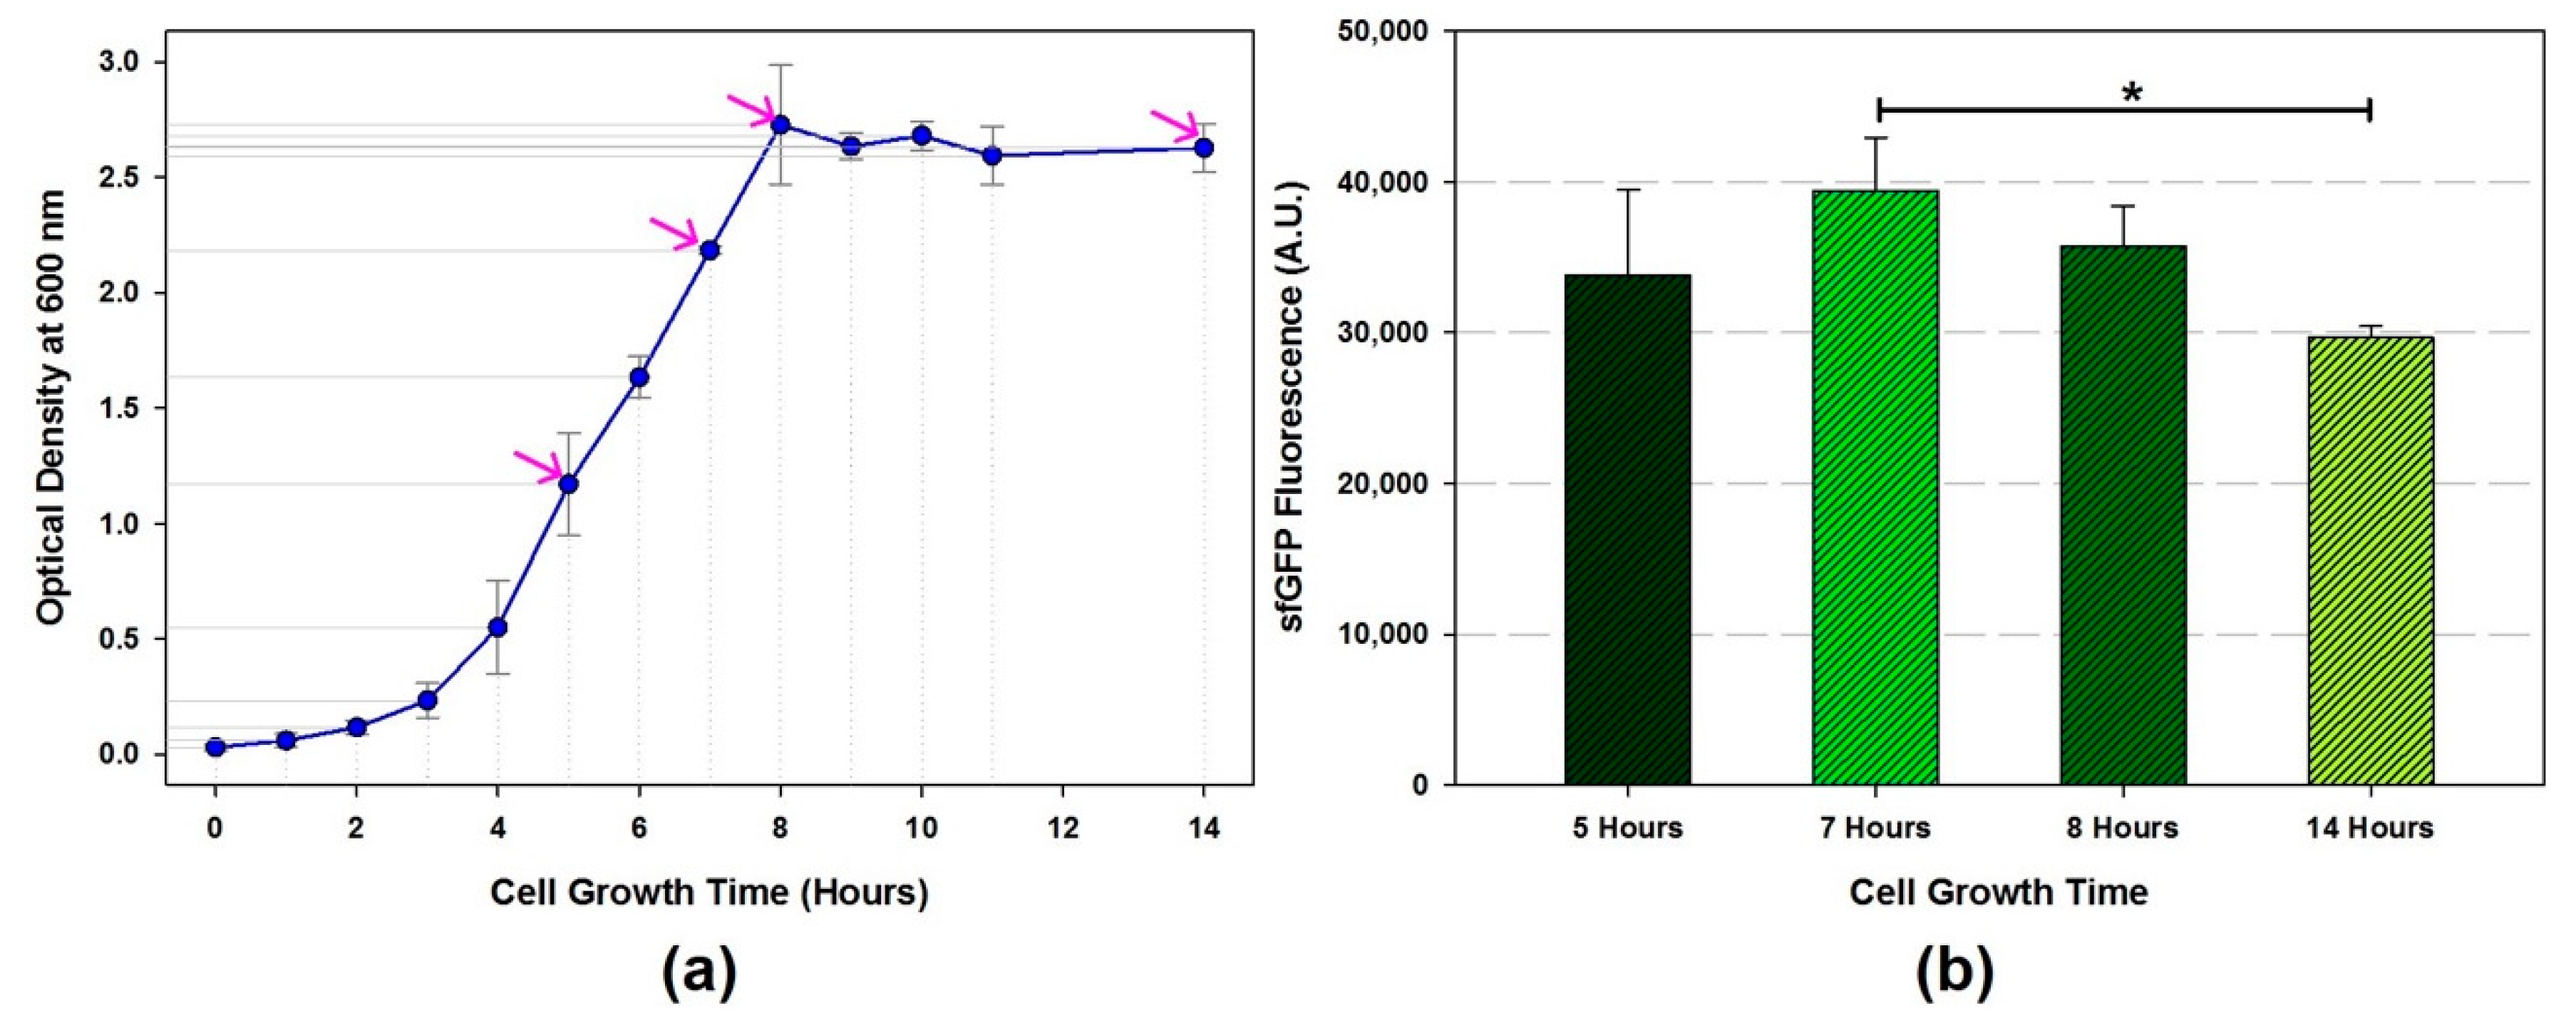
- Add 250 mL of sterilized 0.4 M glucose solution into 750 mL of sterilized 2xYTP media near the flame or in the biosafety cabinet right before inoculation. Shake well. The total 2xYTPG media volume is 1 L. Antibiotics are not included.
- (9)
- Transfer 10 mL of overnight culture (1:100 ratio) to 1 L main culture media (step (11)) near the flame or in the biosafety cabinet.
- (10)
![Mps 02 00068 i001]() CRITICAL STEP Monitor the cell growth rate (OD600) including initial inoculum by spectrophotometer until OD600 reaches to the mid-exponential growth phase. Calculate cell doubling time (Td). Optimal doubling time is 35.6 ± 0.3 [15]
CRITICAL STEP Monitor the cell growth rate (OD600) including initial inoculum by spectrophotometer until OD600 reaches to the mid-exponential growth phase. Calculate cell doubling time (Td). Optimal doubling time is 35.6 ± 0.3 [15]- (11)
![Mps 02 00068 i001]() CRITICAL STEP From here, the cells need to handle at 4 °C or below. Put the centrifuge bottles in ice before harvest. Weigh empty 50 mL conical tubes and mark weight (g) on the tube and put in ice. Turn on the centrifuge and set the temperature at 4 °C.
CRITICAL STEP From here, the cells need to handle at 4 °C or below. Put the centrifuge bottles in ice before harvest. Weigh empty 50 mL conical tubes and mark weight (g) on the tube and put in ice. Turn on the centrifuge and set the temperature at 4 °C.- (12)
- Harvest the cell when the growth curve reaches at a mid-exponential phase by centrifugation (TX-400 swinging bucket rotor) at 5000 RCF at 4 °C for 15 min and then discard the supernatants.
- (13)
- Prepare buffer A solution: Combine 10 mL of each stock solutions with 970 mL of 4 °C chilled Milli-Q water (from Day 1) and add 1 mL of 1 M DTT (Table 1). Mix well and put in ice.
- (14)
- Cell washing: transfer the harvested cells to 50 mL conical tube and add chilled buffer A solution up to 40 mL. Resuspend the cells by shaking or vortexing.
![Mps 02 00068 i001]() CRITICAL STEP Maintain low temperature during washes. Centrifugation (Fiberlite™ F15-8 × 50cy fixed angle rotor) at 5000 RCF at 4 °C for 10 min and then discard the supernatants. Repeat three times.
CRITICAL STEP Maintain low temperature during washes. Centrifugation (Fiberlite™ F15-8 × 50cy fixed angle rotor) at 5000 RCF at 4 °C for 10 min and then discard the supernatants. Repeat three times. - (15)
![Mps 02 00068 i001]() CRITICAL STEP Weigh wet cell weight (g) and marked on the conical tube.
CRITICAL STEP Weigh wet cell weight (g) and marked on the conical tube.- (16)
![Mps 02 00068 i002]() PAUSE STEP Flash freeze the pelleted cells in liquid nitrogen and stored at −80 °C until the next step.
PAUSE STEP Flash freeze the pelleted cells in liquid nitrogen and stored at −80 °C until the next step.

3.1.4. Day 4 (or Continue Day 3)
- (17)
- Take out frozen cells from −80 °C and thaw in ice.
- (18)
- Resuspend the cells in 1 mL of buffer A per 1 g of wet cell mass.
- (19)
![Mps 02 00068 i001]() CRITICAL STEP Transfer the cell suspension into 1.5 mL microtube in an ice-water container to minimize heat damage during sonication.
CRITICAL STEP Transfer the cell suspension into 1.5 mL microtube in an ice-water container to minimize heat damage during sonication.- (20)
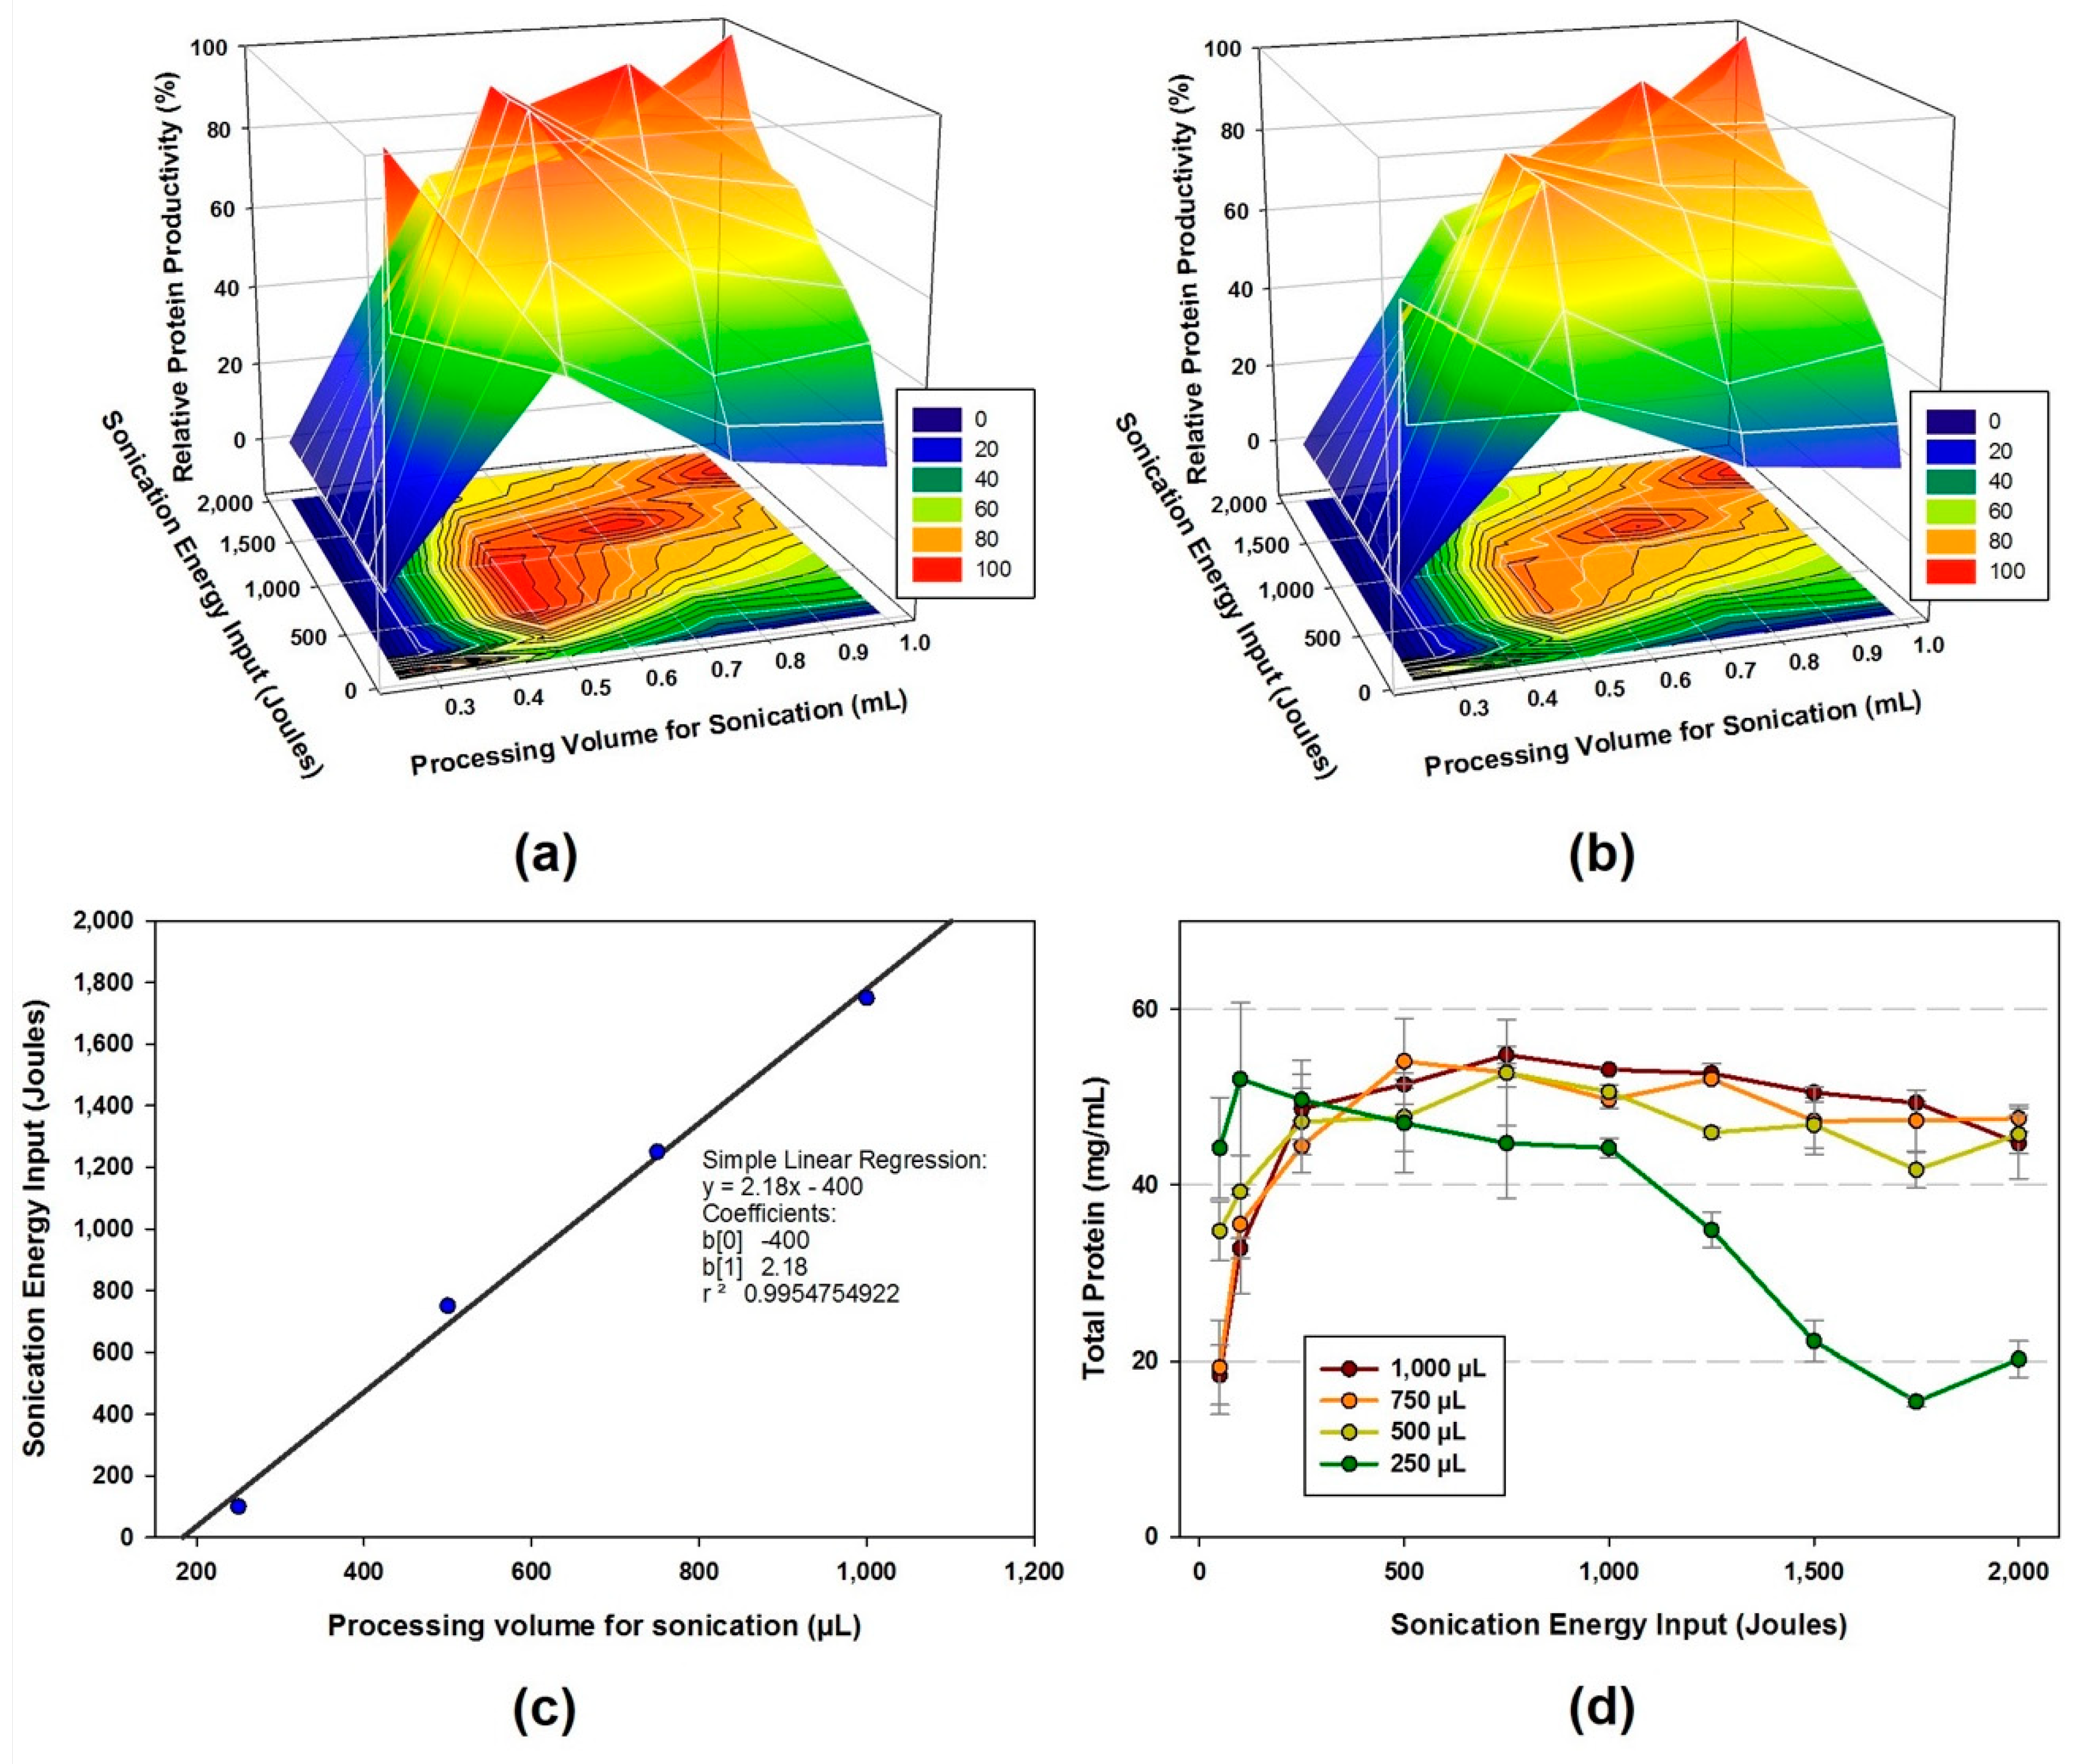
- The cell suspension is lysed using sonicator at a frequency of 20 kHz and 50% amplitude. Different levels of energy input (Joules) and sample volumes are applied during sonication to obtain the highest protein production yield for CFPS reaction.
- (21)
![Mps 02 00068 i001]() CRITICAL STEP Add DTT into cell lysate (3 µL per 1 mL lysate), invert several times quickly, and place the microtube in the ice-water bucket until the next step.
CRITICAL STEP Add DTT into cell lysate (3 µL per 1 mL lysate), invert several times quickly, and place the microtube in the ice-water bucket until the next step.- (22)
- The lysate is centrifuged once at 12,000 RCF at 4 °C for 10 min.
- (23)
![Mps 02 00068 i002]() PAUSE STEP Transfer the supernatant (crude cell extract) to a fresh microtube, flash freeze in liquid nitrogen, and store at −80 °C until use.
PAUSE STEP Transfer the supernatant (crude cell extract) to a fresh microtube, flash freeze in liquid nitrogen, and store at −80 °C until use.- (24)
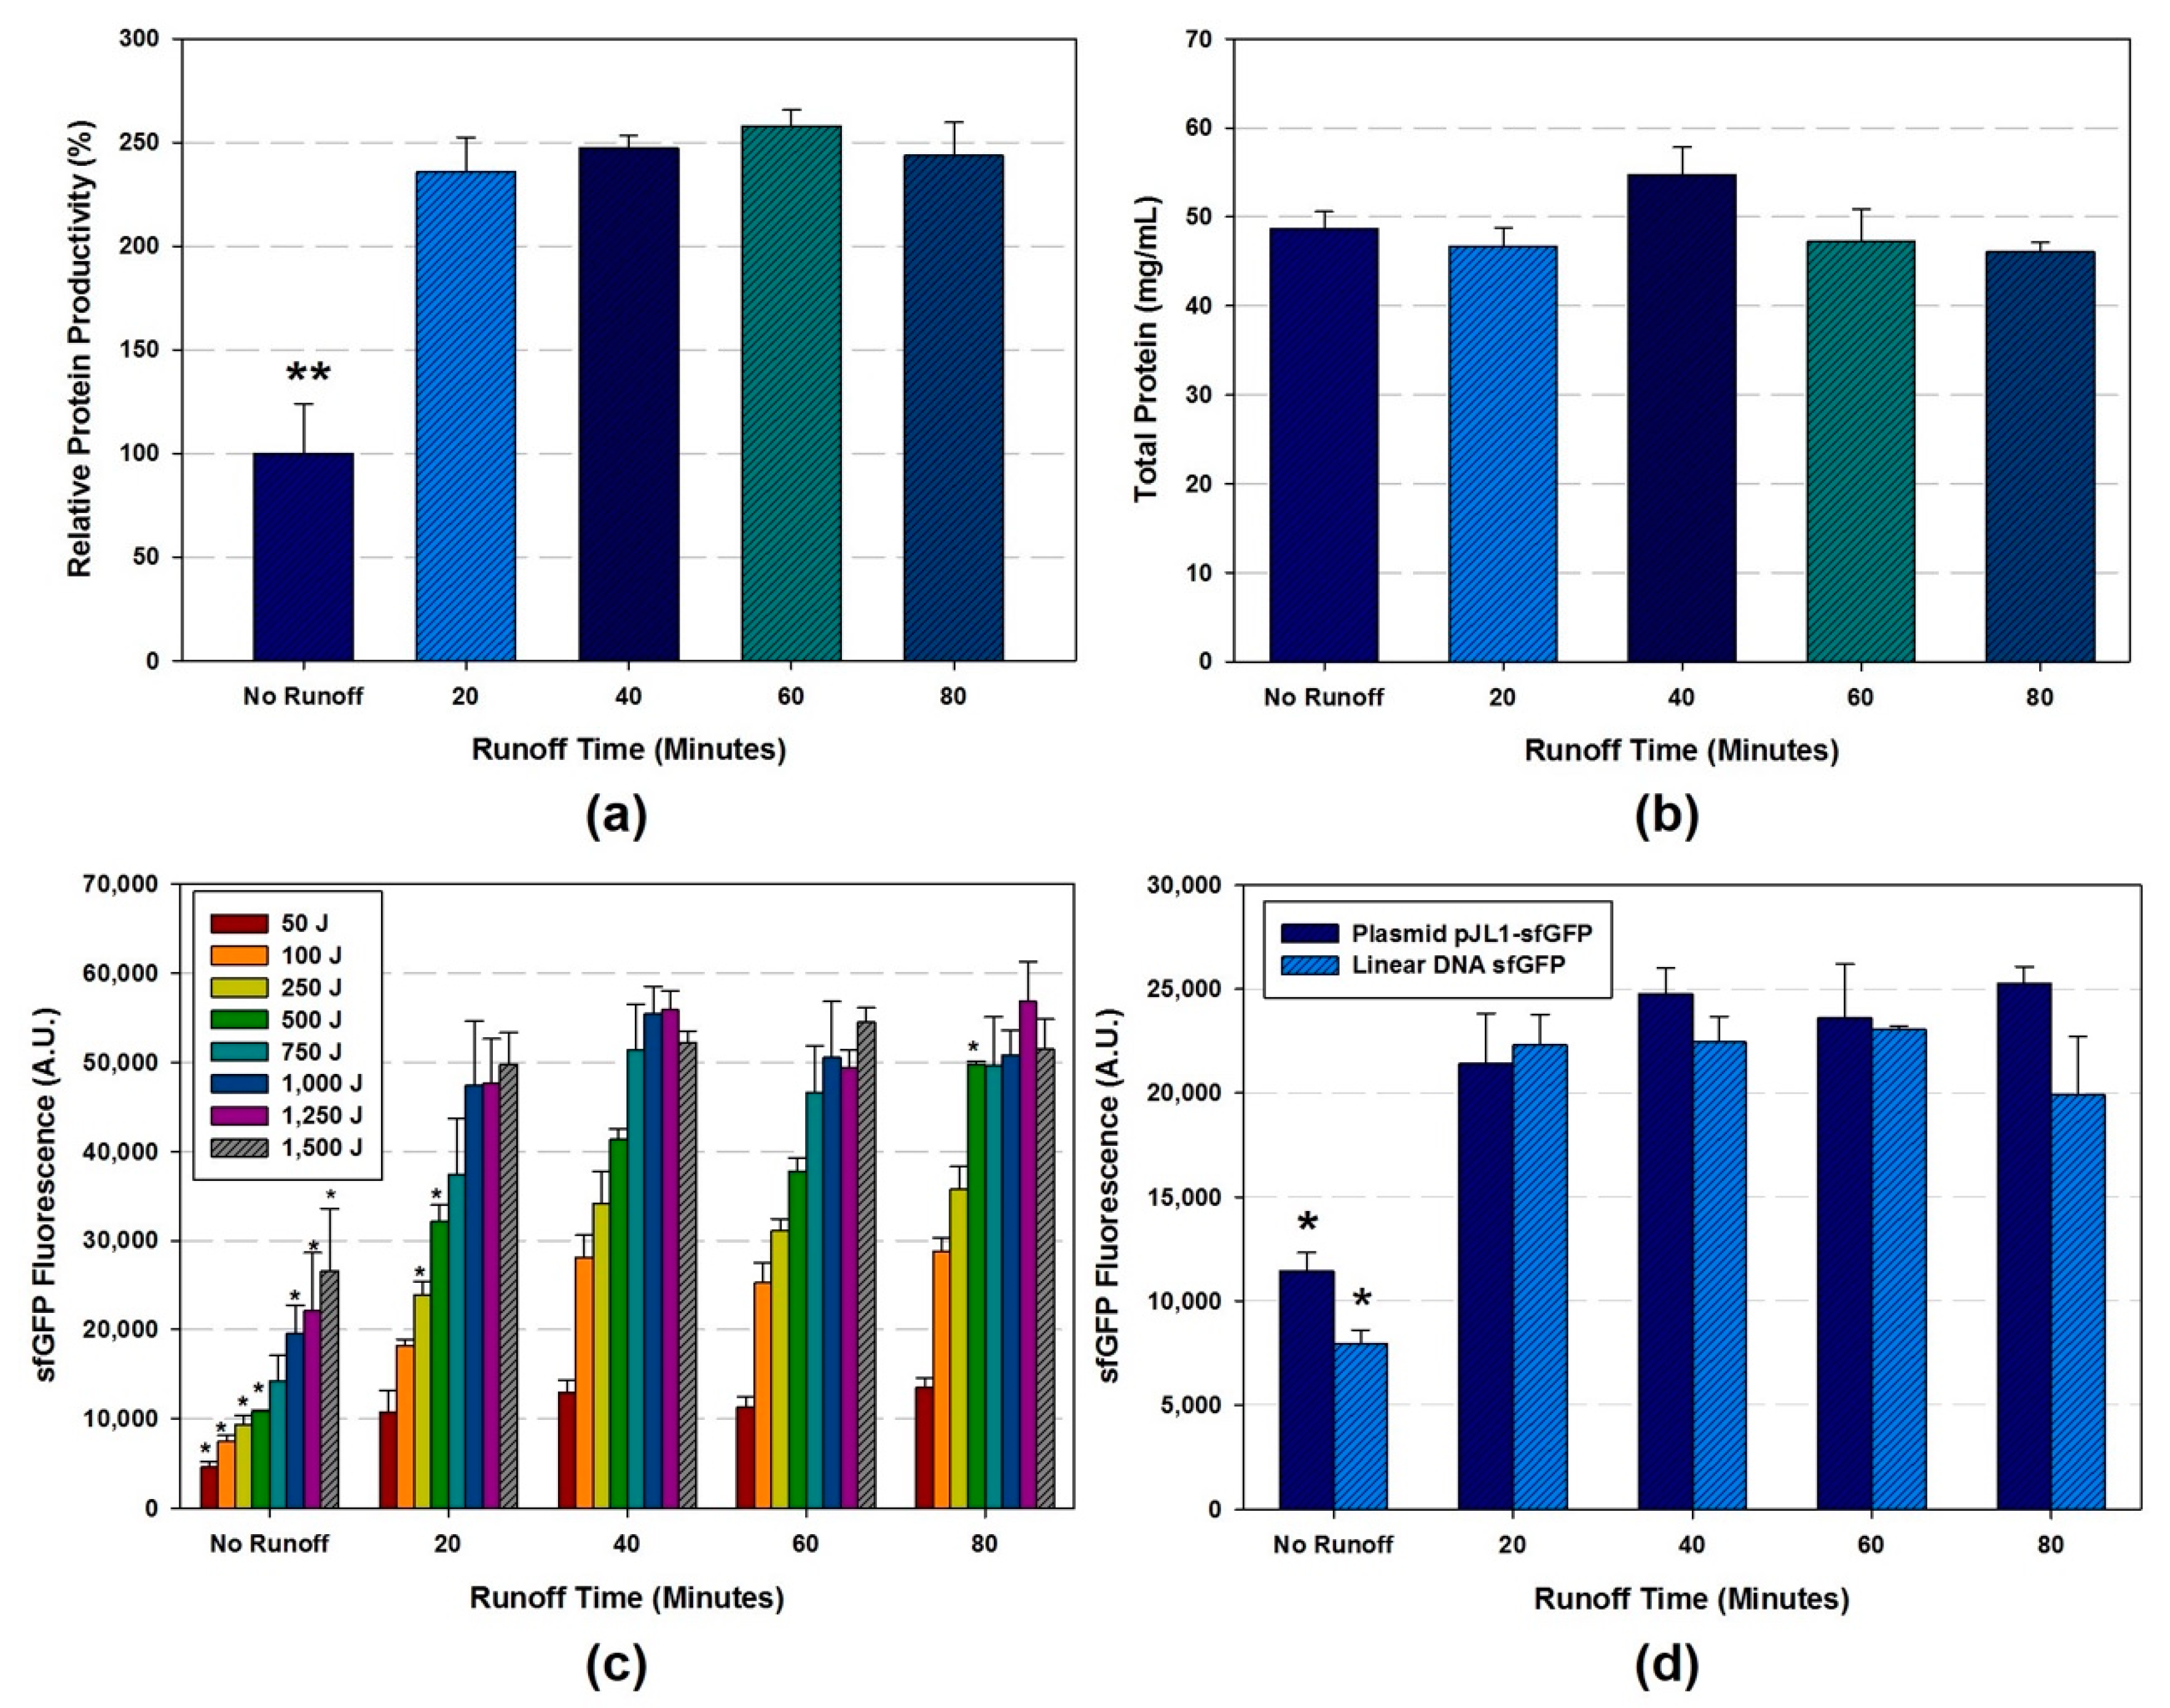
- OPTIONAL STEP The runoff reaction (pre-incubation at 37 °C at 250 rpm) is performed in different reaction time (0, 20, 40, 60, and 80 min). After runoff reaction, clear the cell extract by centrifugation at 10,000 RCF at 4 °C for 10 min.
- (25)
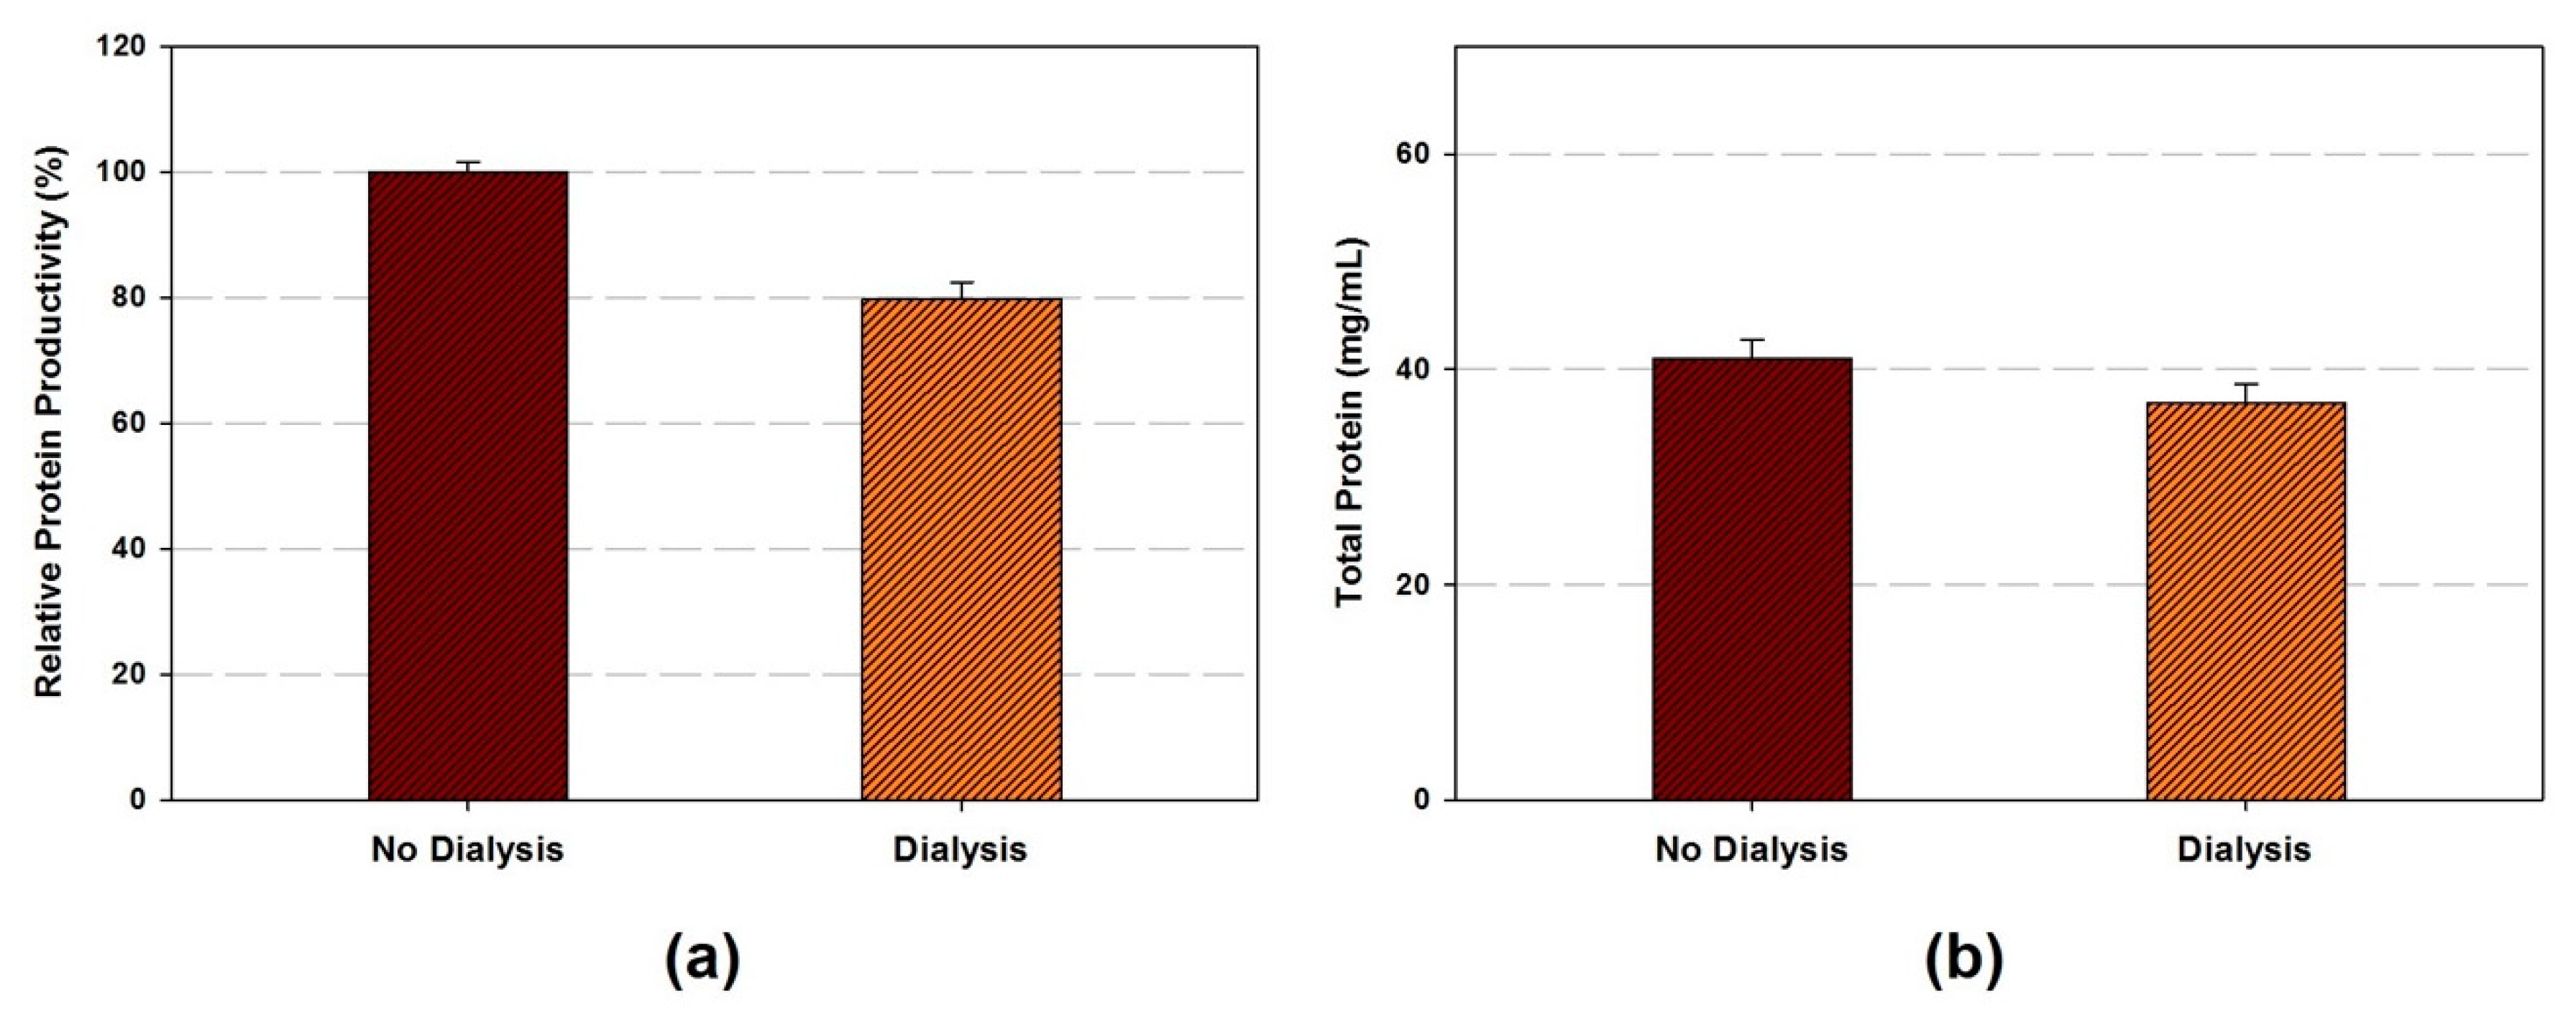
- OPTIONAL STEP The cell extract can be dialyzed if necessary. Cell extract transfer to dialysis cassette (Slide-A-Lyzer™ G2 dialysis cassette, 10K MWCO) and dialyze in chilled buffer A with stirring at 4 °C. Buffer A is exchanged every 45 min four times.
3.2. Cell-Free Protein Synthesis. Time for Completion: One to Two Days
- (1)
- The standard CFPS reaction mixture (15 µL) consists of following components: 12 mM magnesium glutamate, 10 mM ammonium glutamate, 130 mM potassium glutamate, 1.2 mM ATP, 0.85 mM each of GTP, UTP, and CTP, 34.0 µg/mL folinic acid, 171 µg/mL E. coli total tRNA (strain MRE600), 2 mM each of 20 amino acids, 33 mM phosphoenolpyruvate (PEP), 0.33 mM nicotinamide adenine dinucleotide (NAD), 0.27 mM coenzyme-A (CoA), 1.5 mM spermidine, 1 mM putrescine, 4 mM sodium oxalate, 57 mm HEPES-KOH (pH 7.5), 100 µg/mL T7 RNA polymerase, 13.3 ug/mL pJL1-sfGFP plasmid and 27% v/v of cell extract. All components store at −80 °C until use.
- (2)
- Place dry heat block (filled with water) in the incubator. Set temperature at 30 °C or 37 °C.
- (3)
![Mps 02 00068 i001]() CRITICAL STEP Take out all CFPS components from the freezer and thaw in ice. Prepare fresh microtubes for the CFPS reaction in ice.
CRITICAL STEP Take out all CFPS components from the freezer and thaw in ice. Prepare fresh microtubes for the CFPS reaction in ice.- (4)
- Vortex all CFPS reaction components well except for T7 RNA polymerase, cell extract, and plasmid. To mix T7 RNA polymerase, cell extract, and plasmid gently flick the tube.
- (5)
![Mps 02 00068 i001]() CRITICAL STEP Mix all reaction components in a fresh microtube and pipetting up and down to mix homogeneously and minimize bubbles.
CRITICAL STEP Mix all reaction components in a fresh microtube and pipetting up and down to mix homogeneously and minimize bubbles.- (6)
- Briefly spin down the microtubes.
- (7)
- Put the microtubes in the dry heat block and incubate for the desired time period (20 h for plasmid, 4 h for PCR amplified linear template).
- (8)
- Put all CFPS reaction components back in the freezer for next use.
3.3. Protein Quantification
3.3.1. Superfolder Green Fluorescent Protein (sfGFP)—Fluorescence. Time for Completion: 30 min
- (1)
- After the CFPS reaction, briefly vortex microtube.
- (2)
- Aliquot 48 µL of Milli-Q water in 96-well flat bottom black half-well microplate and add 2 µL of cell-free synthesized protein into each well to bring the total volume to 50 µL.
- (3)
- Place the microplate in the plate reader and set it to 15 s orbital shaking (fast) and measure the fluorescence. Excitation and emission wavelengths are 485 and 528 nm, respectively.
3.3.2. SDS-PAGE. Time for Completion: 3 h
- (1)
- Set the dry heat block at 80 °C.
- (2)
- Mix 5 µL of the cell-free synthesized sample, 5 µL of 4x sample loading dye, and 10 µL of 200 mM DTT solution to bring the total volume to 20 µL.
- (3)
- Vortex well and incubate 5 min in 80 °C dry heat block.
- (4)
- Prepare 4–12% SDS-PAGE, SDS-PAGE loading buffer, and gel tank. Clear out the gel wells by injection of the loading buffer.
- (5)
- After 5 min of protein denaturation, spin down and vortex the samples.
- (6)
- Load 10 µL of samples mixture to each well. For the size determination, 5 µL of pre-stained protein ladder is loaded to the first well.
- (7)
- Run the gel electrophoresis with the voltage 150 V for one hour.
- (8)
- Cell-free synthesized proteins are visualized by Coomassie blue staining.
3.3.3. Total Protein—Bradford Assay. Time for Completion: 30 min
- (1)
- Prepare the BSA dilutes (2 mg/mL to 25 µg/mL) for standards and use ultra-pure water as a blank (0 µg/mL).
- (2)
- The original cell extracts are pre-diluted 40-fold in ultra-pure water (i.e., 5 µL of cell extract plus 195 µL of water) and then use as test samples for the protein assay.
- (3)
- Mix the protein-dye solution with standards or samples, incubate for 10 min at room temperature, and measure the absorbance at 595 nm.
- (4)
- The original (undiluted) concentration is determined by multiplying 40 to the concentration of the diluted test sample.
- (5)
- The amount of total protein in the cell extracts are ranged from 15.4 to 54.8 mg/mL depends on the sonication energy input and volume.
4. Expected Results
4.1. Pre-Lysis Procedure
4.2. Lysis
4.3. Post-Lysis Procedure
5. Conclusions
Supplementary Materials
Author Contributions
Funding
Acknowledgments
Conflicts of Interest
References
- Roberts, R.B. Microsomal Particles and Protein Synthesis; Pergamon Press: Oxford, UK, 1958. [Google Scholar]
- Gregorio, N.E.; Levine, M.Z.; Oza, J.P. A user’s guide to cell-free protein synthesis. Methods Protoc. 2019, 2, 24. [Google Scholar] [CrossRef]
- Dopp, B.J.L.; Tamiev, D.D.; Reuel, N.F. Cell-free supplement mixtures: Elucidating the history and biochemical utility of additives used to support in vitro protein synthesis in E. coli extract. Biotechnol. Adv. 2019, 37, 246–258. [Google Scholar] [CrossRef] [PubMed]
- Carlson, E.D.; Gan, R.; Hodgman, C.E.; Jewett, M.C. Cell-free protein synthesis: Applications come of age. Biotechnol. Adv. 2012, 30, 1185–1194. [Google Scholar] [CrossRef] [PubMed]
- Levine, M.Z.; Gregorio, N.E.; Jewett, M.C.; Watts, K.R.; Oza, J.P. Escherichia coli-based cell-free protein synthesis: Protocols for a robust, flexible, and accessible platform technology. JoVE 2019, 144, e58882. [Google Scholar] [CrossRef] [PubMed]
- Karim, A.S.; Heggestad, J.T.; Crowe, S.A.; Jewett, M.C. Controlling cell-free metabolism through physiochemical perturbations. Metab. Eng. 2018, 45, 86–94. [Google Scholar] [CrossRef] [PubMed]
- Lim, H.J.; Kim, D.M. Cell-free metabolic engineering: Recent developments and future prospects. Methods Protoc. 2019, 2, 33. [Google Scholar] [CrossRef] [PubMed]
- Casteleijn, M.G.; Urtti, A.; Sarkhel, S. Expression without boundaries: Cell-free protein synthesis in pharmaceutical research. Int. J. Pharm. 2013, 440, 39–47. [Google Scholar] [CrossRef] [PubMed]
- Lee, S.H.; Kwon, Y.C.; Kim, D.M.; Park, C.B. Cytochrome P450-catalyzed O-dealkylation coupled with photochemical NADPH regeneration. Biotechnol. Bioeng. 2013, 110, 383–390. [Google Scholar] [CrossRef] [PubMed]
- Ahn, J.H.; Chu, H.S.; Kim, T.W.; Oh, I.S.; Choi, C.Y.; Hahn, G.H.; Park, C.G.; Kim, D.M. Cell-free synthesis of recombinant proteins from PCR-amplified genes at a comparable productivity to that of plasmid-based reactions. Biochem. Biophys. Res. Commun. 2005, 338, 1346–1352. [Google Scholar] [CrossRef] [PubMed]
- Kwon, Y.C.; Lee, K.H.; Kim, H.C.; Han, K.; Seo, J.H.; Kim, B.G.; Kim, D.M. Cloning-independent expression and analysis of omega-transaminases by use of a cell-free protein synthesis system. Appl. Environ. Microbiol. 2010, 76, 6295–6298. [Google Scholar] [CrossRef] [PubMed]
- Sun, Z.Z.; Yeung, E.; Hayes, C.A.; Noireaux, V.; Murray, R.M. Linear DNA for rapid prototyping of synthetic biological circuits in an Escherichia coli based TX-TL cell-free system. ACS Synth. Biol. 2014, 3, 387–397. [Google Scholar] [CrossRef] [PubMed]
- Son, J.-M.; Ahn, J.-H.; Hwang, M.-Y.; Park, C.-G.; Choi, C.-Y.; Kim, D.-M. Enhancing the efficiency of cell-free protein synthesis through the polymerase-chain-reaction-based addition of a translation enhancer sequence and the in situ removal of the extra amino acid residues. Anal. Biochem. 2006, 351, 187–192. [Google Scholar] [CrossRef] [PubMed]
- Hong, S.H.; Kwon, Y.C.; Jewett, M.C. Non-standard amino acid incorporation into proteins using Escherichia coli cell-free protein synthesis. Front. Chem. 2014, 2, 34. [Google Scholar] [CrossRef] [PubMed]
- Martin, R.W.; Des Soye, B.J.; Kwon, Y.C.; Kay, J.; Davis, R.G.; Thomas, P.M.; Majewska, N.I.; Chen, C.X.; Marcum, R.D.; Weiss, M.G.; et al. Cell-free protein synthesis from genomically recoded bacteria enables multisite incorporation of noncanonical amino acids. Nat. Commun. 2018, 9, 1203. [Google Scholar] [CrossRef] [PubMed]
- Pardee, K.; Green, A.A.; Ferrante, T.; Cameron, D.E.; DaleyKeyser, A.; Yin, P.; Collins, J.J. Paper-based synthetic gene networks. Cell 2014, 159, 940–954. [Google Scholar] [CrossRef] [PubMed]
- Kigawa, T.; Yabuki, T.; Matsuda, N.; Matsuda, T.; Nakajima, R.; Tanaka, A.; Yokoyama, S. Preparation of Escherichia coli cell extract for highly productive cell-free protein expression. J. Struct. Funct. Genom. 2004, 5, 63–68. [Google Scholar] [CrossRef] [PubMed]
- Zubay, G. In vitro synthesis of protein in microbial systems. Annu. Rev. Genet. 1973, 7, 267–287. [Google Scholar] [CrossRef] [PubMed]
- Kim, T.-W.; Keum, J.-W.; Oh, I.-S.; Choi, C.-Y.; Park, C.-G.; Kim, D.-M. Simple procedures for the construction of a robust and cost-effective cell-free protein synthesis system. J. Biotechnol. 2006, 126, 554–561. [Google Scholar] [CrossRef]
- Yang, W.C.; Patel, K.G.; Wong, H.E.; Swartz, J.R. Simplifying and streamlining Escherichia coli-based cell-free protein synthesis. Biotechnol. Prog. 2012, 28, 413–420. [Google Scholar] [CrossRef]
- Liu, D.V.; Zawada, J.F.; Swartz, J.R. Streamlining Escherichia coli S30 extract preparation for economical cell-free protein synthesis. Biotechnol. Prog. 2005, 21, 460–465. [Google Scholar] [CrossRef]
- Kwon, Y.-C.; Jewett, M.C. High-throughput preparation methods of crude extract for robust cell-free protein synthesis. Sci. Rep. 2015, 5, 8663. [Google Scholar] [CrossRef] [PubMed]
- Pratt, J.M. Coupled Transcription-Translation in Prokaryotic Cell-Free Systems; IRL Press: Oxford, UK, 1984; pp. 179–209. [Google Scholar]
- Goerke, A.R.; Swartz, J.R. Development of cell-free protein synthesis platforms for disulfide bonded proteins. Biotechnol. Bioeng. 2008, 99, 351–367. [Google Scholar] [CrossRef] [PubMed]
- Salehi, A.S.M.; Smith, M.T.; Bennett, A.M.; Williams, J.B.; Pitt, W.G.; Bundy, B.C. Cell-free protein synthesis of a cytotoxic cancer therapeutic: Onconase production and a just-add-water cell-free system. Biotechnol. J. 2016, 11, 274–281. [Google Scholar] [CrossRef] [PubMed]
- Krinsky, N.; Kaduri, M.; Shainsky-Roitman, J.; Goldfeder, M.; Ivanir, E.; Benhar, I.; Shoham, Y.; Schroeder, A. A simple and rapid method for preparing a cell-free bacterial lysate for protein synthesis. PLoS ONE 2016, 11, e0165137. [Google Scholar] [CrossRef] [PubMed]
- Lee, K.H.; Kim, D.M. Recent advances in development of cell-free protein synthesis systems for fast and efficient production of recombinant proteins. FEMS Microbiol. Lett. 2018, 365, fny174. [Google Scholar] [CrossRef] [PubMed]
- Kim, R.G.; Choi, C.Y. Expression-independent consumption of substrates in cell-free expression system from Escherichia coli. J. Biotechnol. 2000, 84, 27–32. [Google Scholar] [CrossRef]
- Jewett, M.C.; Swartz, J.R. Substrate replenishment extends protein synthesis with an in vitro translation system designed to mimic the cytoplasm. Biotechnol. Bioeng. 2004, 87, 465–471. [Google Scholar] [CrossRef] [PubMed]
- Jewett, M.C.; Calhoun, K.A.; Voloshin, A.; Wuu, J.J.; Swartz, J.R. An integrated cell-free metabolic platform for protein production and synthetic biology. Mol. Syst. Biol. 2008, 4, 220. [Google Scholar] [CrossRef] [PubMed]
- Bosdriesz, E.; Molenaar, D.; Teusink, B.; Bruggeman, F.J. How fast-growing bacteria robustly tune their ribosome concentration to approximate growth-rate maximization. FEBS J. 2015, 282, 2029–2044. [Google Scholar] [CrossRef]
- Scott, M.; Klumpp, S.; Mateescu, E.M.; Hwa, T. Emergence of robust growth laws from optimal regulation of ribosome synthesis. Mol. Syst. Biol. 2014, 10, 747. [Google Scholar] [CrossRef]
- Shrestha, P.; Holland, T.M.; Bundy, B.C. Streamlined extract preparation for Escherichia coli-based cell-free protein synthesis by sonication or bead vortex mixing. Biotechniques 2012, 53, 163–174. [Google Scholar] [CrossRef] [PubMed]


| Reagents | Mixing Volume (mL) |
|---|---|
| 1 M Tris-OAc, pH 8.2 | 10 |
| 1.4 M Mg(OAc)2 | 10 |
| 6 M KOAc | 10 |
| 1 M DTT | 1 |
| Chilled Milli-Q water | 970 |
© 2019 by the authors. Licensee MDPI, Basel, Switzerland. This article is an open access article distributed under the terms and conditions of the Creative Commons Attribution (CC BY) license (http://creativecommons.org/licenses/by/4.0/).
Share and Cite
Kim, J.; Copeland, C.E.; Padumane, S.R.; Kwon, Y.-C. A Crude Extract Preparation and Optimization from a Genomically Engineered Escherichia coli for the Cell-Free Protein Synthesis System: Practical Laboratory Guideline. Methods Protoc. 2019, 2, 68. https://doi.org/10.3390/mps2030068
Kim J, Copeland CE, Padumane SR, Kwon Y-C. A Crude Extract Preparation and Optimization from a Genomically Engineered Escherichia coli for the Cell-Free Protein Synthesis System: Practical Laboratory Guideline. Methods and Protocols. 2019; 2(3):68. https://doi.org/10.3390/mps2030068
Chicago/Turabian StyleKim, Jeehye, Caroline E. Copeland, Sahana R. Padumane, and Yong-Chan Kwon. 2019. "A Crude Extract Preparation and Optimization from a Genomically Engineered Escherichia coli for the Cell-Free Protein Synthesis System: Practical Laboratory Guideline" Methods and Protocols 2, no. 3: 68. https://doi.org/10.3390/mps2030068
APA StyleKim, J., Copeland, C. E., Padumane, S. R., & Kwon, Y.-C. (2019). A Crude Extract Preparation and Optimization from a Genomically Engineered Escherichia coli for the Cell-Free Protein Synthesis System: Practical Laboratory Guideline. Methods and Protocols, 2(3), 68. https://doi.org/10.3390/mps2030068