Systematic Review

Electrocardiographic Changes in Patients with Type 2 Diabetes Mellitus—A Meta-Analysis

by
Teodora-Gabriela Alexescu
1,
Antonia Nechita
2,
Paula Alexander
3,
Mirela-Georgiana Perné
1,*,
Mircea-Vasile Milaciu
1,
George Ciulei
1,
Ioana Para
1,
Vasile Negrean
1,
Ana-Florica Chiș
4,
Doina-Adina Todea
4,
Dan Vălean
3,
Simina-Felicia Țărmure
1 and
Olga-Hilda Orășan
1
1
Department of Internal Medicine, “Iuliu Hațieganu” University of Medicine and Pharmacy, 400347 Cluj Napoca, Romania
2
The County Emergency Clinical Hospital Cluj-Napoca, 400347 Cluj-Napoca, Romania
3
Regional Institute of Gastroenterology and Hepatology Cluj-Napoca, 400394 Cluj-Napoca, Romania
4
Department of Medical Sciences-Pulmonology, University of Medicine and Pharmacy “Iuliu Hațieganu”, 400347 Cluj Napoca, Romania
*
Author to whom correspondence should be addressed.
J. Mind Med. Sci. 2025, 12(1), 14; https://doi.org/10.3390/jmms12010014
Submission received: 14 February 2025 / Revised: 23 March 2025 / Accepted: 27 March 2025 / Published: 4 April 2025

Simple Summary

People with type 2 diabetes mellitus have a higher cardiovascular risk, and changes in the electrical activity of the heart, seen on an electrocardiogram, may help identify these risks earlier. However, these changes’ specific patterns and significance are not fully understood. This study combines data from multiple research studies to analyze common electrocardiographic abnormalities in people with type 2 diabetes mellitus. By identifying the most frequent changes and their potential link to heart disease, this research aims to improve early detection and risk assessment in these patients. The findings may help healthcare professionals better understand the heart-related complications of diabetes and guide future studies on prevention and treatment. This meta-analysis contributes to the research community by summarizing existing evidence and highlighting key areas for further investigation in cardiology and diabetes care.

Abstract

Background: Diabetes mellitus (DM) is a chronic metabolic disorder significantly associated with cardiovascular complications. Electrocardiographic (ECG) abnormalities are common in patients with type 2 diabetes (T2DM) and can serve as early markers for cardiovascular risk. Objective: This meta-analysis aims to evaluate the impact of T2DM on electrocardiographic changes, focusing on major ECG abnormalities, fragmented QRS (fQRS) complexes, and prolonged corrected QT (QTc) intervals. Materials and Methods: A systematic review of observational studies published between 2017 and 2022 was conducted using databases such as PubMed, Web of Science, Cochrane Library, Embase, and ClinicalTrials.gov. The inclusion criteria required studies to focus on patients with T2DM and report ECG changes. A total of 13 studies comprising 25,530 participants met the criteria and were included in the meta-analysis. The statistical analysis was performed using RevMan 5.4 with a random-effects model. Results: T2DM patients were 1.74 times more likely to develop major ECG abnormalities than non-diabetic individuals (crude OR = 1.74, 95% CI = 1.17–2.57, p = 0.006). The prevalence of fQRS complexes was significantly higher among T2DM patients (crude OR = 2.48, 95% CI = 2.09–2.957, p < 0.00001). Additionally, T2DM patients exhibited a higher likelihood of QTc interval prolongation (crude OR = 1.38, 95% CI = 1.09–1.74, p = 0.008). Conclusions: This meta-analysis demonstrates that T2DM patients have a significantly higher risk of ECG abnormalities, including major changes, fQRS complexes, and prolonged QTc intervals. Regular ECG monitoring is essential for early detection and management of cardiovascular risks in T2DM patients.

1. Introduction

Diabetes mellitus (DM) is a group of metabolic disorders affecting carbohydrate metabolism [1,2]. This chronic disease, with a progressive course and often associated with multiple complications, increases both individual and socio-economic burdens [3,4]. The diagnosis of diabetes is based on identifying an increased glucose concentration in venous blood or plasma or by detecting elevated levels of glycated hemoglobin. Diabetes is classified into several clinical categories: type 1 diabetes (T1DM), type 2 diabetes (T2DM), gestational diabetes, or it may be secondary to genetic mutations, endocrine dysfunctions, medications, toxic substances, or infections [5].
It has been demonstrated that DM is one of the major risk factors for developing vascular complications, both microvascular and macrovascular. Patients with diabetes are two to three times more likely to develop cardiovascular diseases compared to the general population [6,7]. Recent studies indicate that glycemic variability plays a more significant role in the occurrence of these complications than hyperglycemia itself [8,9,10,11].
The recent guidelines from the European Society of Cardiology and the American Diabetes Association recommend performing a resting electrocardiogram in all individuals diagnosed with type 2 diabetes whenever possible to identify early changes, intervene, and prevent further complications [12,13,14]. It is well known that individuals with T2DM also have a very high risk of developing cardiac arrhythmias [15].

2. Objective

The main objective of this paper is to evaluate the impact of T2DM on the cardiac excitatory conduction system.

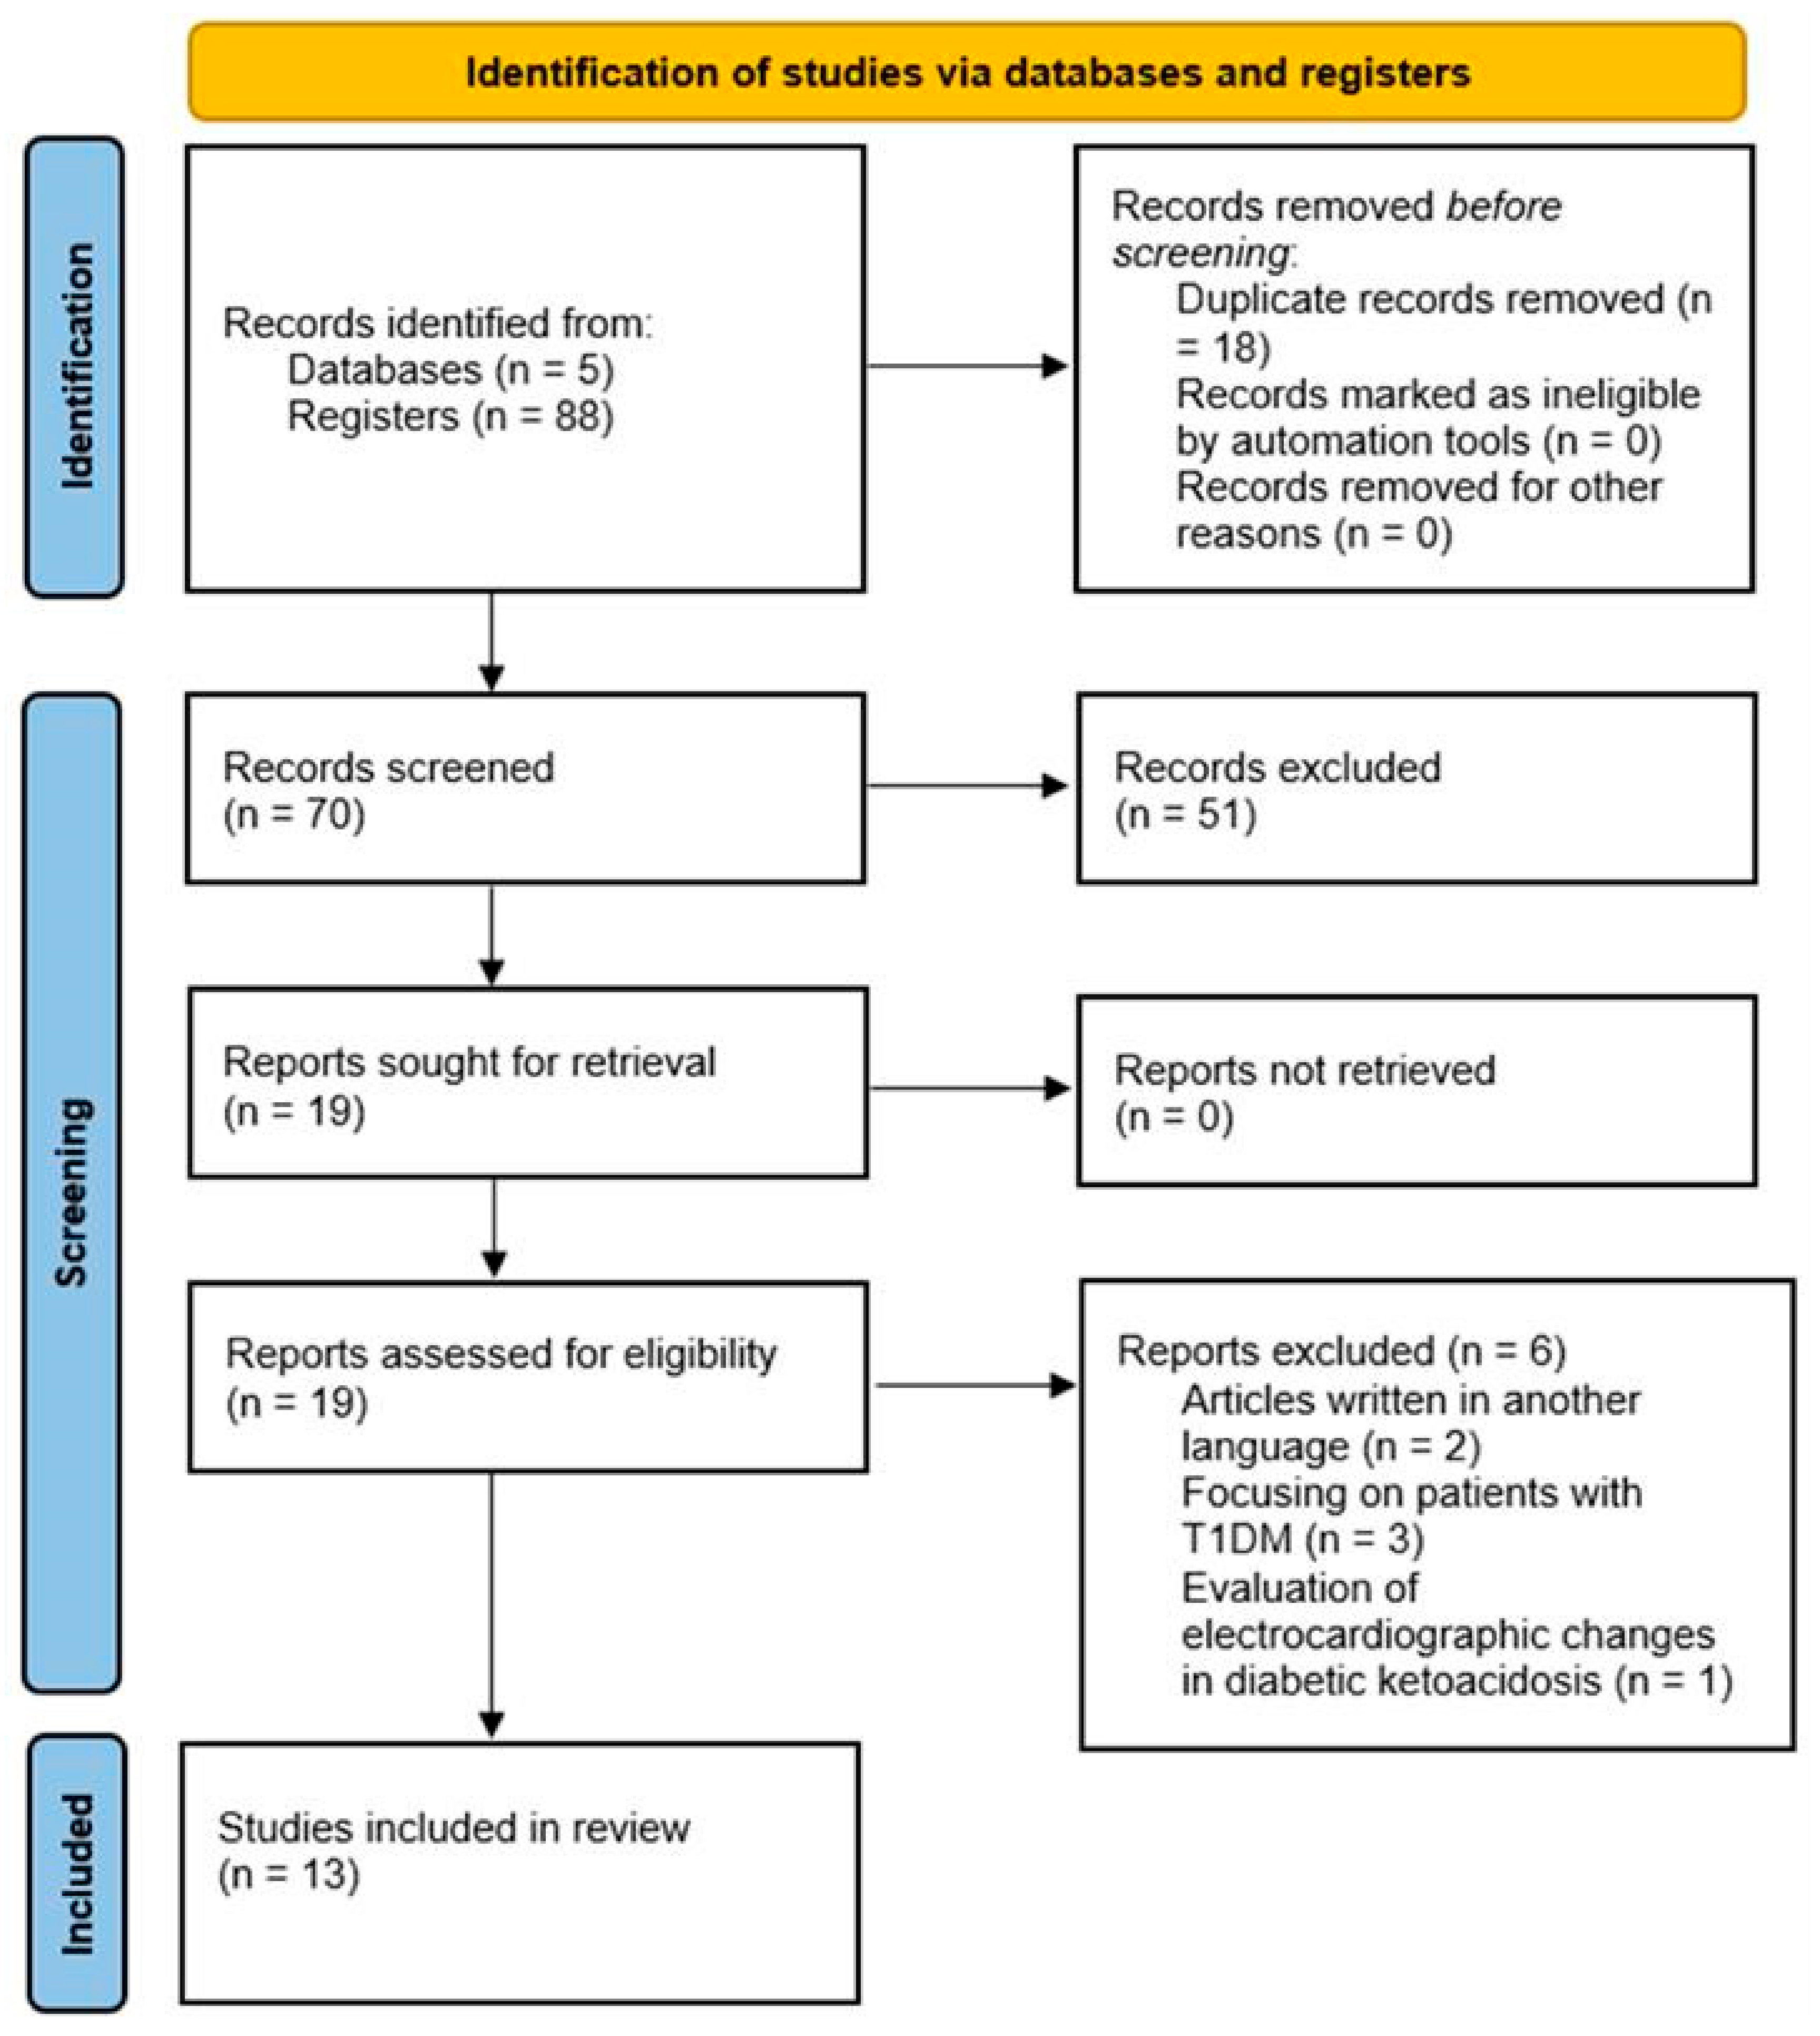
3. Materials and Methods

A systematic review was designed, conducted, and reported based on the Preferred Reporting Items for a Systematic Review and Meta-Analysis of Individual Participant Data Criteria (PRISMA) [16,17]. The protocol has not been registered. The systematic review was conducted based on a previously designed protocol, the details of which will be presented below.
A systematic search was conducted using PubMed, Web of Science, Cochrane Library, Embase, and ClinicalTrials.gov for studies published between 2017 and 2022. Observational studies (cohort and cross-sectional) assessing ECG changes in individuals with type 2 diabetes were included. Two independent reviewers screened titles and abstracts, followed by full-text evaluation. The discrepancies were resolved through discussion or third-party arbitration. Data extraction was performed using a standardized form, capturing study characteristics, patient demographics, ECG parameters, and reported effect sizes.
The search utilized specialized vocabulary specific to databases employing filters such as EMTREE or MeSH (Medical Subject Headings) and manually entered keywords. The bibliographic references cited by authors were used to identify articles that had not been previously discovered. The Quality Assessment of Diagnostic Accuracy Studies (QUADAS-2) tool was applied to evaluate the quality of the selected studies and minimize the risk of bias.
The search and selection process consisted of two stages: the first stage involved selecting studies based on their titles and abstracts. In contrast, the second stage involved evaluating compliance with the inclusion criteria for the entire paper (as illustrated in Figure 1).
The search process followed this principle:
  • Initially, a simple search was conducted using the terms “diabetes electrocardiogram” and “diabetes electrocardiography”.
  • Using MeSH, “diabetes” was entered, and “electrocardiogram changes OR electrocardiographic changes” was selected. Filters such as publication period, study type, and target population were applied.
  • Keywords such as “diabetes”, “electrocardiogram”, “changes”, “complications”, “cardiovascular”, and “disease” were combined using operators like OR, AND, and NOT.
  • A final comprehensive search was conducted using all the selected keywords and filters.
The above approach corresponds to the search algorithm used on PubMed. The steps were adapted for other databases based on their specific filters.

3.1. Inclusion and Exclusion Criteria

The studies considered for inclusion in this meta-analysis met the following criteria: (a) observational studies, including cohort and cross-sectional designs; (b) participants diagnosed with T2DM, aged 15 years or older; (c) studies published between January 2017 and December 2022; (d) studies published in English; and (e) studies that reported electrocardiographic changes in individuals with type 2 diabetes. Certain studies excluded specific patient groups, such as pregnant women, individuals with thyroid disorders, pre-existing cardiovascular conditions or symptoms, and those with renal or hepatic impairments. Including these patients required a confirmed diagnosis of T2DM through laboratory testing.
Exclusion criteria applied to studies as follows:
  • Were published before 2017;
  • Were clinical case reports or trials;
  • Focused on patients with type 1 diabetes;
  • Were written in languages other than English;
  • Provided insufficient data for analysis;
  • Were not observational in nature;
  • Involved patients who had electrocardiographic abnormalities diagnosed before their diabetes diagnosis;
  • Did not adhere to high research standards or presented a high risk of bias.

3.2. Data Extraction

A single author initially conducted the study selection process using various search strategies. A comprehensive table was then compiled to document key details of the selected studies, including the title, authors, study type, year of publication, number of participants, essential findings, and the type of statistical analysis performed. The table was subsequently reviewed by a second author, who verified the accuracy of the data and addressed any potential errors. Finally, the selection process underwent a thorough review by two independent individuals, who discussed the included studies to ensure consensus, addressing both shared perspectives and any discrepancies through an argumentative discussion.

3.3. Statistical Analysis

The meta-analysis used RevMan software, version 5.4, with all data presented as continuous variables.
A random-effects model was applied to address potential heterogeneity. Despite efforts during the study selection process, the degree of heterogeneity could not be fully minimized. Three Forest plot graphs were generated to analyze the data, with the extracted data distributed across the plots based on their level of similarity. Analyses were omitted if the available data were insufficient to ensure reliable results.
To further explore the robustness of our findings, subgroup analyses and meta-regression were conducted using crude odds ratios (crude ORs). A subgroup analysis was conducted to explore sources of heterogeneity, by stratifying studies based on design (cohort vs. cross-sectional). Additionally, a meta-regression was performed to assess whether sample size and T2DM duration influenced the effect size. The meta-regression model was built using an ordinary least squares (OLS) regression framework, with crude ORs as the dependent variable and sample size/diabetes duration as independent variables.

4. Results

4.1. Sensitivity Analysis: Exploration of Heterogeneity

A subgroup analysis based on study design showed that cross-sectional studies reported a slightly stronger association between T2DM and ECG abnormalities (pooled OR = 1.89) compared to cohort studies (pooled OR = 1.75). This suggests that the study design may contribute modestly to heterogeneity in effect sizes.
Meta-regression analyses, conducted within the sensitivity framework, indicated that neither sample size (p = 0.816) nor diabetes duration (p = 0.830) significantly influenced effect sizes. These findings suggest that the observed associations are consistent across different study characteristics, even in unadjusted analyses.

4.2. Included Studies

Through a systematic and manual search, 88 eligible articles were identified for this study. After duplicate removal, 70 studies remained and were screened based on their titles and abstracts to identify those meeting the inclusion criteria. As a result, 55 studies were excluded for various reasons, including a lack of focus on patients with diabetes mellitus, animal studies, case reports, or irrelevant studies. Figure 1 provides a detailed overview of the selection process.
The remaining 19 studies that met the inclusion criteria were thoroughly reviewed in full. Of these, six were excluded for the following reasons: two were published in languages other than English, three focused on patients with type 1 diabetes, and one examined electrocardiographic changes in diabetic ketoacidosis. Following the final assessment, 13 studies were selected for the meta-analysis. Among these, two were cohort studies [18,19], while the remaining 11 were cross-sectional studies [20,21,22,23,24,25,26,27,28,29,30], collectively involving a total of 25,530 participants. The comprehensive details on the authors, publication years, study participant characteristics, type of intervention, and outcomes are provided in Table 1.

4.3. Narrative Summary

The descriptive characteristics of the included studies are summarized in Table 1. A total of 13 studies, comprising 11 cross-sectional studies and 2 cohort studies published between 2017 and 2022, were included in the analysis. All studies employed twelve-lead electrocardiography to identify electrocardiographic changes. The extracted data included parameters such as P-wave changes (s, mV), QRS interval (s), RR interval (s), T-wave (s, mV), ST segment, QT interval (s), and QTc interval (s). Following data extraction, Forest plots were generated to analyze three key aspects: the occurrence of significant electrocardiographic changes, the presence of fragmented QRS (fQRS) complexes, and the incidence of prolonged QTc intervals (corrected QT interval).
Eight studies were selected (Figure 2) to assess major electrocardiographic changes (Figure 2). Of the 12 included studies, four focused on the occurrence of fQRS complexes (Figure 3), while five addressed QTc interval prolongation (Figure 4).
In the first meta-analysis, which encompassed eight studies, electrocardiographic changes in patients with type 2 diabetes were investigated. The abnormalities identified were categorized into two main types: minor and major. The significant abnormalities included QS abnormalities, ST segment changes, T-wave abnormalities, prolonged QT intervals, bundle branch blocks, and cardiac arrhythmias.
The fQRS complex on a twelve-lead electrocardiogram can be present in various morphologies. These changes may manifest as alterations in the Q-wave, different RSR’ patterns, the presence of an additional R’ wave, or multiple fragmented R’ waves across two or more consecutive leads corresponding to a coronary artery territory. These anomalies may serve as indicators of heart failure, often linked to myocardial fibrosis, impaired myocardial conduction, and an increased risk of ventricular arrhythmias. However, fQRS remains a nonspecific finding requiring further investigation to ascertain its precise cause and clinical significance.
The prolongation of the QTc interval is closely associated with malignant ventricular arrhythmias and has been identified as a potential cause of sudden death in patients with diabetic autonomic cardiac neuropathy. The QT interval represents the time required for ventricular depolarization and repolarization as recorded on an electrocardiogram, while the QTc interval is corrected for heart rate. A prolonged QTc interval, generally defined as exceeding 0.440 ms, indicates underlying abnormalities in intracardiac ion channels responsible for ventricular repolarization. This prolongation increases the risk of life-threatening ventricular arrhythmias, such as torsades de pointes, which may lead to severe clinical outcomes, including syncope or sudden cardiac death.

4.4. Quantitative Summary

The study included 25,530 participants. To provide a comprehensive assessment, individual meta-analyses were performed for each evaluated electrocardiographic change.

4.5. Major Electrocardiographic Changes

The first meta-analysis included 12,708 participants from eight studies [18,19,20,21,22,23,24,25] and assessed major electrocardiographic changes in individuals with T2DM compared to those without this condition.
The findings demonstrated a statistically significant association, with a crude OR of 1.74, a 95% confidence interval (CI) ranging from 1.17 to 2.57, and a p-value of 0.006, as illustrated in the Forest plot (Figure 2).
These results suggest that individuals with T2DM are 1.74 times more likely to develop electrocardiographic abnormalities than those without the diagnosis.

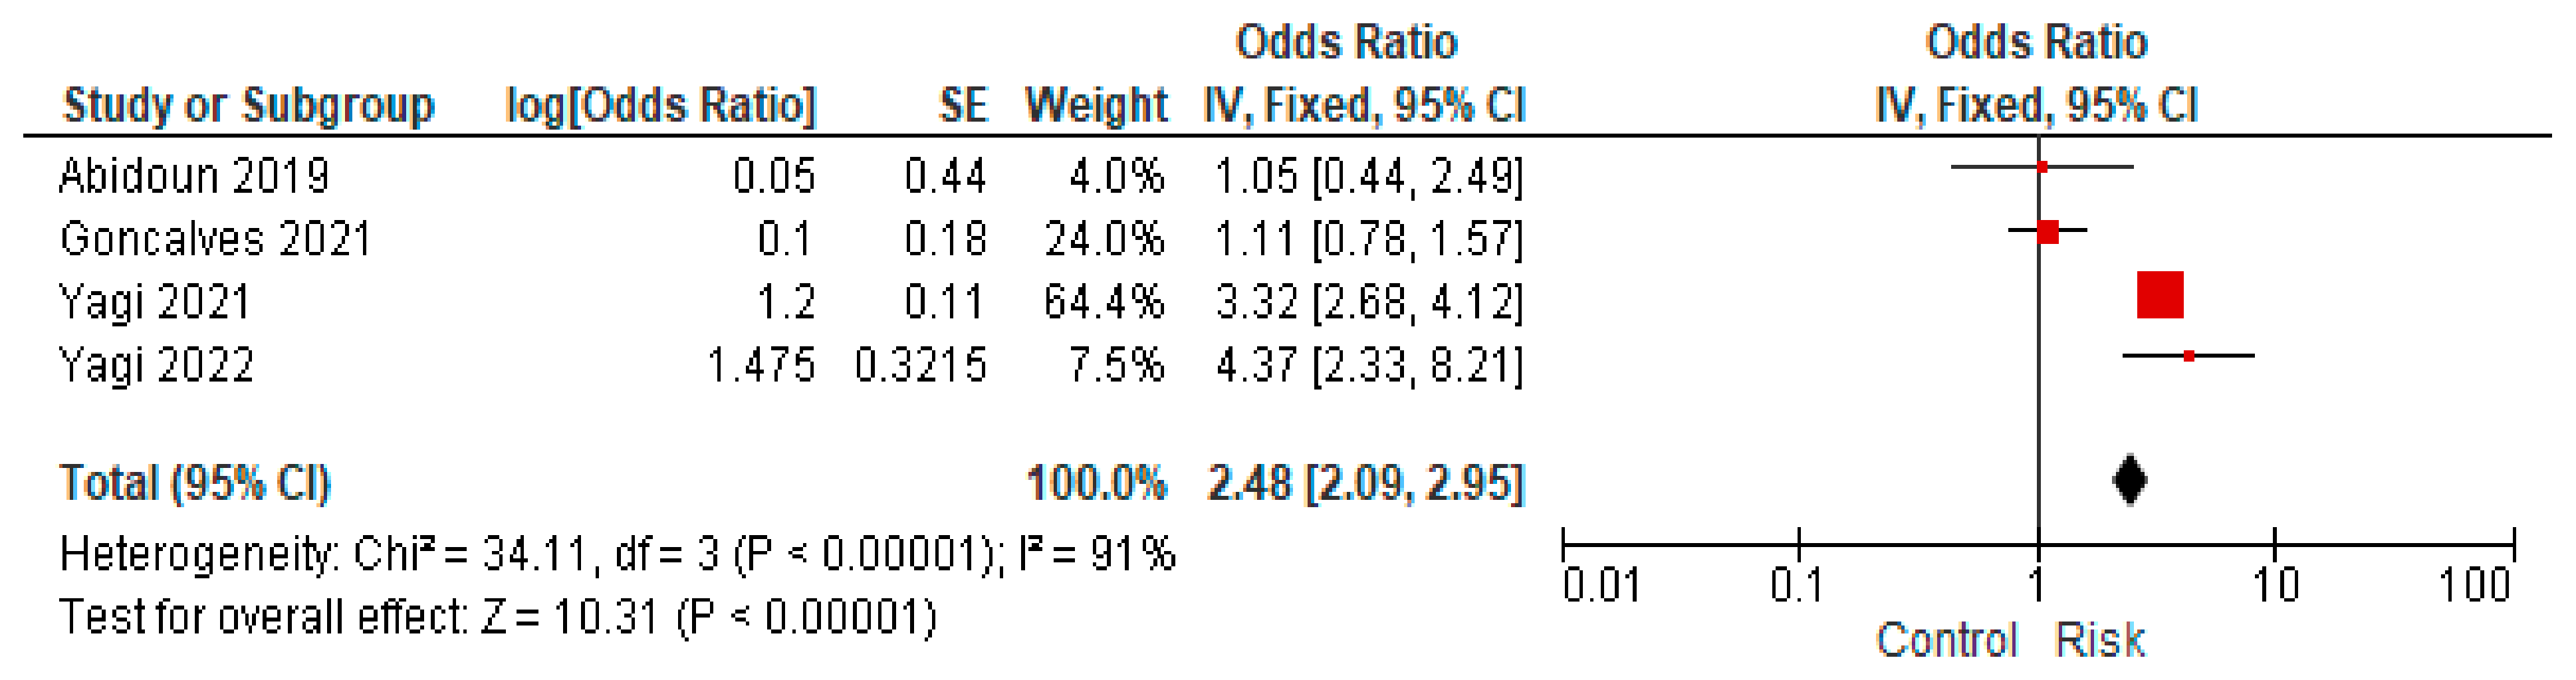
4.6. fQRS Complex Changes

The second meta-analysis examined data from four studies [20,22,25,26] encompassing a total of 3892 participants. Among these, only two studies yielded statistically significant results. This analysis aimed to evaluate the prevalence of fragmented QRS (fQRS) complexes in individuals with type 2 diabetes compared to those without the condition.
The overall findings indicated a significant association, with a crude OR of 2.48 and a 95% confidence interval (CI) ranging from 2.09 to 2.95, as illustrated in the Forest plot (Figure 3).
In summary, the results suggest that individuals with type 2 diabetes have a 2.48 times higher likelihood of developing fQRS abnormalities compared to non-diabetic individuals.

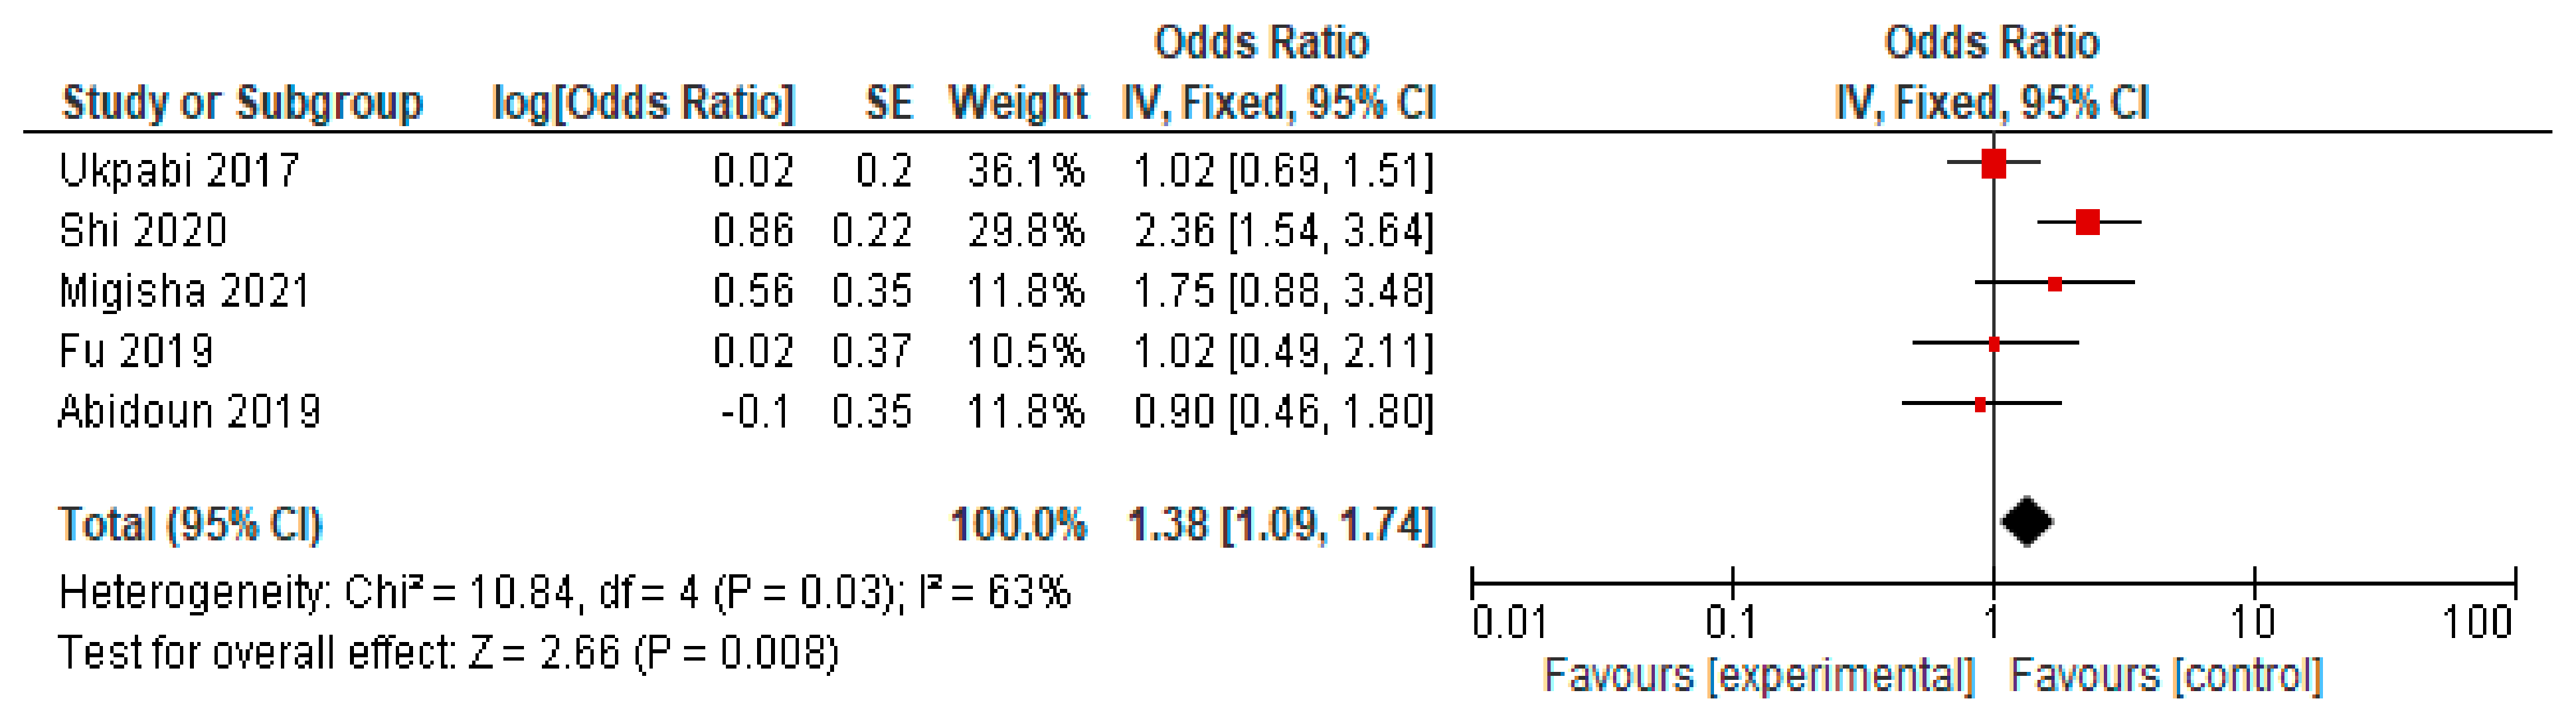
4.7. Prolonged QTc Interval Changes

The final meta-analysis assessed changes in prolonged QTc intervals among patients with type 2 diabetes. This analysis incorporated data from five studies [20,27,28,29,30], involving a total of 12,812 participants. Four of these five studies did not yield statistically significant results.
The meta-analysis’s findings demonstrated a statistically significant association, with a crude OR of 1.38, a 95% confidence interval (CI) ranging from 1.09 to 1.74, and a p-value of 0.008, as depicted in the Forest plot (Figure 4).
Overall, the results indicate that individuals with type 2 diabetes are 1.38 times more likely to develop a prolonged QTc interval compared to those without diabetes.

5. Discussions

Electrocardiography (ECG) is a crucial and widely accessible tool for evaluating cardiac function, often complemented by echocardiography to provide a comprehensive assessment of heart health, particularly in patients with T2DM [18]. This particular patient group is predisposed to cardiac abnormalities due to the cumulative impact of chronic hyperglycemia, which contributes to vascular damage as well as structural and functional changes in the heart [18,31].
The ECG can detect a broad spectrum of abnormalities, ranging from minor to severe. For example, fragmented QRS complexes (fQRS) indicate the abnormal depolarization of the heart muscle, commonly associated with myocardial fibrosis. A prolonged QTc interval suggests delayed ventricular repolarization, which may increase the risk of severe arrhythmias such as torsades de pointes. Additionally, T-wave inversions and ST-segment abnormalities are frequently observed, often signaling underlying myocardial ischemia or electrolyte imbalances [18,19,20,31]. These ECG changes are closely linked to increased morbidity and mortality in diabetic patients, as they often precede severe complications such as heart failure, myocardial infarction, and sudden cardiac death. The early detection of these abnormalities allows clinicians to monitor disease progression, adjust treatment plans, and implement preventive measures to mitigate cardiovascular risks [19,20,21,22,23,24].
Even in asymptomatic patients with T2DM, ECG changes are present in 26% of the cases [32]. The significant ECG abnormalities identified in our study include QS changes (pathological Q waves, QRS axis deviation, ventricular hypertrophy, and tall R waves—R > 26 mm in V5 and V6 leads), ST-segment abnormalities (depression, inversion), T-wave abnormalities (flattened, negative, or biphasic waves), prolonged QT intervals, bundle branch blocks (left or right), and cardiac arrhythmias such as atrial fibrillation and flutter. Minor abnormalities include isolated minor ST-segment changes and premature beats (extrasystoles). This meta-analysis revealed a statistically significant finding, indicating that patients with T2DM are 1.74 times more likely to develop ECG abnormalities compared to non-diabetic individuals. Other studies conducted in different populations from different continents have presented similar observations [24,25,26,27].
From a clinical point of view, the following can be considered major ECG abnormalities: pathological Q waves and QS abnormalities—suggestive of previous myocardial infarction or myocardial fibrosis, indicating prior cardiac ischemic events; ST-segment deviations (elevation or depression)—ST-segment elevation suggests acute myocardial infarction, while ST depression may indicate myocardial ischemia or left ventricular strain; T-wave abnormalities (inversions, flattening, or biphasic waves)—changes are often associated with ischemia, electrolyte imbalances, or structural heart disease; prolonged QTc interval—a prolonged QT interval increases the risk of life-threatening arrhythmias, such as torsades de pointes, and is commonly associated with diabetic autonomic neuropathy; bundle branch blocks (right or left)—left bundle branch block (LBBB) is often a marker of underlying structural heart disease, whereas right bundle branch block (RBBB) may be a benign variant but can also indicate pulmonary or structural cardiac conditions; atrial or ventricular arrhythmias (e.g., atrial fibrillation, premature ventricular contractions, ventricular tachycardia)—these arrhythmias can contribute to an increased risk of stroke, heart failure, and sudden cardiac death. In patients with type 2 diabetes, these ECG abnormalities are of particular concern as they signal an elevated risk of cardiovascular events, necessitating regular monitoring and early intervention.
Furthermore, the prevalence of fragmented QRS complexes was found to be notably higher in diabetic patients than in non-diabetics, suggesting an increased risk of heart failure due to myocardial fibrosis, impaired myocardial conduction, and the potential onset of ventricular arrhythmias [25,26,33]. However, the presence of fQRS on an ECG is considered a nonspecific finding, found also in lung embolism [33], and requires further investigation to determine its precise cause and clinical relevance.
Abnormalities in myocardial ion channels play a significant role in QTc prolongation, which affects ventricular repolarization. This meta-analysis determined that QTc interval prolongation is more prevalent in diabetic patients than in non-diabetics, further emphasizing the impact of diabetes on cardiac electrophysiology [29,30].
From a pathophysiological perspective, factors such as hyperglycemia, dyslipidemia, chronic systemic inflammation, and endothelial dysfunction play critical roles in developing ECG abnormalities in T2DM patients. Persistent hyperglycemia and glycemic variability negatively impact endothelial and myocardial cells, leading to long-term vascular and myocardial damage, which contributes to disturbances in heart rhythm and ECG anomalies [18,34,35].
Beyond diabetes itself, several additional risk factors are associated with ECG changes, including obesity, hypertension, consumption of solid fats (such as hydrogenated oils), and smoking. These factors contribute to arterial wall thickening, increased blood pressure, and altered blood flow, thereby promoting cardiovascular complications and disturbances in the heart’s electrical conduction system [20,36].
Overall, patients with T2DM are significantly more likely than the general population to develop ECG abnormalities, ranging from minor to major, including rhythm disturbances, ventricular hypertrophy, QT prolongation, and other electrical changes that predispose them to serious cardiovascular complications [21,22,36].
The synthesis of data from multiple studies enhances scientific understanding by providing a deeper and broader perspective on the intricate relationship between diabetes and cardiac electrical disturbances. This comprehensive approach also helps in identifying potential risks associated with severe complications such as heart failure, myocardial infarction, and life-threatening arrhythmias, all of which can profoundly impact the quality of life of affected individuals.
By evaluating the cardiovascular impact of T2DM, this meta-analysis offers valuable insights that contribute to developing targeted therapeutic protocols aimed at improving patient outcomes and reducing the risk of cardiovascular complications. Moreover, these findings support the formulation of preventive strategies, including regular ECG monitoring, optimized glycemic control, and patient education programs to lower the incidence of cardiovascular disease in individuals with T2DM.
While our results demonstrate statistically significant associations between type 2 diabetes and ECG abnormalities, the clinical significance of these findings requires further exploration. The concept of Minimal Important Difference (MID) suggests that a statistically significant result may not always translate into a meaningful clinical impact. For example, a small increase in QTc interval may not necessarily indicate a higher risk of arrhythmias unless it crosses a critical threshold (>450 ms for men, >460 ms for women). Future studies should focus on establishing clinically relevant cut-off values and assessing whether ECG changes in T2DM patients lead to tangible clinical outcomes such as cardiovascular events or mortality.
The consistency of results across subgroups and meta-regression analyses using crude estimates strengthens the robustness of our findings, despite the lack of adjusted ORs. The pooled crude estimates are presented as sensitivity analyses and should be interpreted with caution, recognizing their susceptibility to confounding. Future research should focus on generating and reporting adjusted effect sizes to enable more robust pooled analyses.
The limitations of this study include the restricted search of only the selected databases, potentially excluding other relevant studies; furthermore, access was restricted to open-access studies only.
Further studies are needed to gain a detailed understanding of the mechanisms by which T2DM alters the normal ECG and leads to patterns of ECG abnormalities.

6. Conclusions

Electrocardiography plays a crucial role in the screening and managing of patients with T2DM. This rapid, non-invasive, and cost-effective diagnostic tool can detect a wide range of ECG abnormalities. The findings of this study highlight that patients with T2DM commonly exhibit abnormalities such as fragmented QRS (fQRS) complexes, prolonged QTc intervals, and significant changes in the ST-segment, T-wave, bundle branch blocks, and cardiac arrhythmias.
Identifying these anomalies provides critical insights that can enhance patient quality of life and aid in the prevention of potential cardiac complications. These findings underscore the importance of regular ECG monitoring as an integral component of diabetes management.
This meta-analysis is essential for evaluating the impact of ECG changes in patients with diabetes, offering critical insights for prognosis and informing therapeutic strategies.

Author Contributions

Conceptualization, T.-G.A.; Data curation, A.N., D.-A.T. and P.A.; Formal analysis, D.V. and S.-F.Ț.; Funding acquisition, T.-G.A.; Investigation, T.-G.A., M.-G.P. and M.-V.M.; Methodology, O.-H.O.; Supervision, V.N., I.P., A.-F.C. and T.-G.A.; Writing—original draft, A.N. and P.A.; Writing—review and editing, P.A., T.-G.A. and G.C. All authors have read and agreed to the published version of the manuscript.

Funding

This research received no external funding.

Conflicts of Interest

Conflicts of interest were reported in the publication of this article. This material was written and approved by all authors.

References

  1. American Diabetes Association Professional Practice Committee. 2. Diagnosis and Classification of Diabetes: Standards of Care in Diabetes—2024. Diabetes Care 2024, 47 (Suppl. 1), S20–S42.
  2. Sacks, D.B.; Arnold, M.; Bakris, G.L.; Bruns, D.E.; Horvath, A.R.; Lernmark, Å.; Metzger, B.E.; Nathan, D.M.; Kirkman, M.S. Guidelines and Recommendations for Laboratory Analysis in the Diagnosis and Management of Diabetes Mellitus. Diabetes Care 2023, 46, e151–e199. [Google Scholar] [PubMed]
  3. Choi, J.H.; Lee, K.A.; Moon, J.H.; Chon, S.; Kim, D.J.; Kim, H.J.; Kim, N.H.; Seo, J.A.; Kim, M.K.; Lim, J.H.; et al. 2023 Clinical Practice Guidelines for Diabetes Mellitus of the Korean Diabetes Association. Diabetes Metab. J. 2023, 47, 575–594. [Google Scholar] [CrossRef]
  4. Bae, J.H.; Han, K.D.; Ko, S.H.; Yang, Y.S.; Choi, J.H.; Choi, K.M.; Kwon, H.S.; Won, K.C. Diabetes Fact Sheet in Korea 2021. Diabetes Metab. J. 2022, 46, 417–426. [Google Scholar] [CrossRef] [PubMed]
  5. American Diabetes Association. Standards of Care in Diabetes—2023 Abridged for Primary Care Providers. Clin. Diabetes 2023, 41, 4–31. [Google Scholar]
  6. Emerging Risk Factors Collaboration. Diabetes mellitus, fasting blood glucose concentration, and risk of vascular disease: A collaborative meta-analysis of 102 prospective studies. Lancet 2010, 375, 2215–2222. [Google Scholar] [CrossRef]
  7. Gregg, E.W.; Cheng, Y.J.; Srinivasan, M.; Lin, J.; Geiss, L.S.; Albright, A.L.; Imperatore, G. Trends in cause-specific mortality among adults with and without diagnosed diabetes in the USA: An epidemiological analysis of linked national survey and vital statistics data. Lancet 2018, 391, 2430–2440. [Google Scholar] [CrossRef]
  8. Goldberg, R.B.; Orchard, T.J.; Crandall, J.P.; Boyko, E.J.; Budoff, M.; Dabelea, D.; Gadde, K.M.; Knowler, W.C.; Lee, C.G.; Nathan, D.M.; et al. Effects of Long-term Metformin and Lifestyle Interventions on Cardiovascular Events in the Diabetes Prevention Program and Its Outcome Study. Circulation 2022, 145, 1632–1641. [Google Scholar]
  9. Zhang, J.; Yang, J.; Liu, L.; Li, L.; Cui, J.; Wu, S.; Tang, K. Significant abnormal glycemic variability increased the risk for arrhythmias in elderly type 2 diabetic patients. BMC Endocr. Disord. 2021, 21, 83. [Google Scholar]
  10. Nusca, A.; Tuccinardi, D.; Albano, M.; Cavallaro, C.; Ricottini, E.; Manfrini, S.; Pozzilli, P.; Di Sciascio, G. Glycemic variability in the development of cardiovascular complications in diabetes. Diabetes Metab. Res. Rev. 2018, 34, e3047. [Google Scholar]
  11. Cowie, C.C.; Casagrande, S.S.; Menke, A.; Cissell, M.A.; Eberhardt, M.S.; Meigs, J.B.; Gregg, E.W.; Knowler, W.C.; Barrett-Connor, E.; Becker, D.J.; et al. Diabetes in America; National Institute of Diabetes and Digestive and Kidney Diseases (US): Bethesda, MD, USA, 2018. [Google Scholar] [PubMed]
  12. Marx, N.; Federici, M.; Schütt, K.; Müller-Wieland, D.; Ajjan, R.A.; Antunes, M.J.; Christodorescu, R.M.; Crawford, C.; Di Angelantonio, E.; Eliasson, B.; et al. 2023 ESC Guidelines for the management of cardiovascular disease in patients with diabetes. Eur Heart J. 2023, 44, 4043–4140. [Google Scholar] [PubMed]
  13. American Diabetes Association Professional Practice Committee; ElSayed, N.A.; Aleppo, G.; Bannuru, R.R.; Bruemmer, D.; Collins, B.S.; Das, S.R.; Ekhlaspour, L.; Hilliard, M.E.; Johnson, E.L.; et al. 10. Cardiovascular Disease and Risk Management: Standards of Care in Diabetes—2024. Diabetes Care 2024, 47 (Suppl. S1), S179–S218. [Google Scholar]
  14. Nichols, G.A.; Reinier, K.; Chugh, S.S. Independent contribution of diabetes to increased prevalence and incidence of atrial fibrillation. Diabetes Care 2009, 32, 1851–1856. [Google Scholar] [CrossRef] [PubMed]
  15. Nijpels, G.; van der Heijden, A.A.W.A.; Elders, P.; Beulens, J.W.J.; de Vet, H.C.W. The interobserver agreement of ECG abnormalities using Minnesota codes in people with type 2 diabetes. PLoS ONE 2021, 16, e0255466. [Google Scholar] [CrossRef]
  16. Page, M.J.; McKenzie, J.E.; Bossuyt, P.M.; Boutron, I.; Hoffmann, T.C.; Mulrow, C.D.; Shamseer, L.; Tetzlaff, J.M.; Moher, D. Updating Guidance for Reporting Systematic Reviews: Development of the PRISMA 2020 Statement. J. Clin. Epidemiol. 2021, 134, 103–112. [Google Scholar] [CrossRef] [PubMed]
  17. Moher, D.; Liberati, A.; Tetzlaff, J.; Altman, D.G. Preferred Reporting Items for Systematic Reviews and Meta-Analyses: The PRISMA Statement. PLoS Med. 2009, 6, e1000097. [Google Scholar] [CrossRef]
  18. Harms, P.P.; van der Heijden, A.A.; Rutters, F.; Tan, H.L.; Beulens, J.W.; Nijpels, G.; Elders, P. Prevalence of ECG abnormalities in people with type 2 diabetes: The Hoorn Diabetes Care System cohort. J. Diabetes Its Complicat. 2021, 35, 107810. [Google Scholar] [CrossRef]
  19. Kersten, D.J.; D’Angelo, K.; Vargas, J.; Verma, G.; Malik, U.; Shavolian, S.; Zeltser, R.; Hai, O.; Makaryus, A.N. Determining the clinical significance of computer interpreted electrocardiography conclusions. Am. J. Cardiovasc. Dis. 2021, 11, 375–381. [Google Scholar]
  20. Abiodun, A.; Oladimeji, A.; Bamidele, T.; Adewole, A.; Mayowa, O. Prevalence of ECG abnormalities among adults with metabolic syndrome in a Nigerian Teaching Hospital. Afr. Health Sci. 2019, 19, 2829–2838. [Google Scholar] [CrossRef]
  21. Bedane, D.A.; Tadesse, S.; Bariso, M.; Reta, W.; Desu, G. Assessment of electrocardiogram abnormality and associated factors among apparently healthy adult type 2 diabetic patients on follow-up at Jimma Medical Center, Southwest Ethiopia: Cross-sectional study. BMC Cardiovasc. Disord. 2021, 21, 312. [Google Scholar] [CrossRef]
  22. Gonçalves, M.A.A.; Pedro, J.M.; Silva, C.; Magalhães, P.; Brito, M. Prevalence of major and minor electrocardiographic abnormalities and their relationship with cardiovascular risk factors in Angolans. Int. J. Cardiol. Heart Vasc. 2022, 39, 100965. [Google Scholar] [CrossRef] [PubMed]
  23. Sardesai, V.; Kokane, H.; Mukherjee, S.; Sangle, S. A study of electrocardiographic and 2D echocardiographic changes in type 2 diabetes mellitus patients without cardiovascular symptoms. J. Family Med. Prim. Care 2022, 11, 1036–1039. [Google Scholar] [CrossRef] [PubMed]
  24. Sinamaw, D.; Getnet, M.; Abdulkadir, M.; Abebaw, K.; Ebrahim, M.; Diress, M.; Akalu, Y.; Ambelu, A.; Dagnew, B. Patterns and associated factors of electrocardiographic abnormality among type 2 diabetic patients in Amhara National Regional State Referral Hospitals, Ethiopia: A multicenter institution-based cross-sectional study. BMC Cardiovasc. Disord. 2022, 22, 230. [Google Scholar]
  25. Yagi, K.; Nagata, Y.; Yamagami, T.; Chujo, D.; Kamigishi, M.; Yokoyama-Nakagawa, M.; Shikata, M.; Enkaku, A.; Takikawa-Nishida, A.; Honoki, H.; et al. High prevalence of fragmented QRS on electrocardiography in Japanese patients with diabetes irrespective of metabolic syndrome. J. Diabetes Investig. 2021, 12, 1680–1688. [Google Scholar] [PubMed]
  26. Yagi, K.; Imamura, T.; Tada, H.; Liu, J.; Miyamoto, Y.; Ohbatake, A.; Ito, N.; Shikata, M.; Enkaku, A.; Takikawa, A.; et al. Fragmented QRS on electrocardiography as a predictor for diastolic cardiac dysfunction in type 2 diabetes. J. Diabetes Investig. 2022, 13, 1052–1061. [Google Scholar]
  27. Fu, L.; Deng, H.; Lin, W.D.; He, S.F.; Liu, F.Z.; Liu, Y.; Zhan, X.Z.; Fang, X.H.; Liao, H.T.; Wei, W.; et al. Association between elevated blood glucose level and non-valvular atrial fibrillation: A report from the Guangzhou heart study. BMC Cardiovasc. Disord. 2019, 19, 270. [Google Scholar]
  28. Shi, H.; Jiang, X. Correlation Between QTc Prolongation and Obstructive Sleep Apnea in Patients with Type 2 Diabetes Mellitus. Med. Sci. Monit. 2020, 26, e926954-1. [Google Scholar]
  29. Ukpabi, O.J.; Onwubere, B.J.C. QTc prolongation in Black diabetic subjects with cardiac autonomic neuropathy. Afr. Health Sci. 2017, 17, 1092–1100. [Google Scholar]
  30. Migisha, R.; Agaba, D.C.; Katamba, G.; Miranda, S.L.; Muyingo, A.; Siedner, M.J. High prevalence of prolonged QTc interval among individuals in ambulatory diabetic care in southwestern Uganda. Int. J. Diabetes Dev. Ctries. 2021, 41, 614–620. [Google Scholar]
  31. Harms, P.P.; Herings, R.A.R.; Remmelzwaal, S.; Rutters, F.; Beulens, J.W.J.; Nijpels, G.; Elders, P.P.J.M.; Blom, M.T. The added value of ECG abnormalities in predicting incident cardiovascular disease risk for people with type 2 diabetes: The Hoorn Diabetes Care System cohort. Eur. J. Prev. Cardiol. Eur. J. Prev. Cardiol. 2025, zwaf033. [Google Scholar] [CrossRef]
  32. Gupta, S.; Gupta, R.K.; Kulshrestha, M.; Chaudhary, R.R. Evaluation of ECG Abnormalities in Patients with Asymptomatic Type 2 Diabetes Mellitus. J. Clin. Diagn. Res. 2017, 11, OC39–OC41. [Google Scholar] [CrossRef] [PubMed]
  33. Dehghani, M.R.; Baradaran, M.; Rostamzadeh, A.; Masudi, S.; Aghamiri, A.; Hajizadeh, R. Assessment of the fragmented QRS relative frequency and its predictive value in patients with pulmonary embolism. Caspian J. Intern. Med. 2024, 16, 83–89. [Google Scholar] [PubMed]
  34. Soflaei Saffar, S.; Nazar, E.; Sahranavard, T.; Fayedeh, F.; Moodi Ghalibaf, A.; Ebrahimi, M.; Alimi, H.; Shahri, B.; Izadi-Moud, A.; Ferns, G.A.; et al. Association of T-wave electrocardiogram changes and type 2 diabetes: A cross-sectional sub-analysis of the MASHAD cohort population using the Minnesota coding system. BMC Cardiovasc. Disord. 2024, 24, 48. [Google Scholar] [CrossRef] [PubMed]
  35. Teimouri, K.; Pakravan, S.; Azadbakht, K. The most common electrocardiographic abnormalities in patients with diabetes mellitus. J. Parathyroid Dis. 2022, 10, e9142. [Google Scholar]
  36. Vaidya, A.; Bentley-Lewis, R.; Jeunemaitre, X.; Adler, G.K.; Williams, J.S. Dietary sodium alters the prevalence of electrocardiogram determined left ventricular hypertrophy in hypertension. Am. J. Hypertens. 2009, 22, 669–673. [Google Scholar] [CrossRef]
Figure 1. PRISMA diagram—study selection.
Jmms 12 00014 g001
Figure 2. Major electrocardiographic changes.
Jmms 12 00014 g002
Figure 3. fQRS complex changes.
Jmms 12 00014 g003
Figure 4. Prolonged QTc interval changes.
Jmms 12 00014 g004
Table 1. Descriptive characteristics of the included studies.
StudyAuthorYear of PublicationStudy TypeCharacteristics of Studied SubjectsNumber of PatientsType of InterventionFollowed Effect
1Harms et al. [18]2021CohortAverage age:
67.7 ± 11.0
Male sex: 55.6%
Female sex: 44.4%
8068 Participants without a history of cardiovascular diseases: 6494Electrocardiogram abnormalities were defined using the Minnesota classification. These were classified into different types of abnormalities (minor and major electrocardiogram abnormalities).Electrocardiogram abnormalities were very commonly found in the population with type II diabetes, including among those without a history of cardiovascular diseases. Among patients with diabetes diagnosed for more than 10 years, the prevalence was of 48.8% minor abnormalities and 48.9% significant abnormalities.
2Kersten et al. [19]2021CohortAverage age:
57 ± 16
Male sex: 41%
Female sex: 59%
517The electrocardiograms were performed using the Nihon Kohden Cardiofax V Electrocardiograph ECG-1550A (Nihon Kohden, Shinjuku, Japan) and were interpreted using the ECAPS 12C software.It was found that the appearance of electrocardiographic abnormalities in the context of advanced age, coronary artery disease, or diabetes mellitus is very likely to be accompanied by changes in echocardiography.
3Abiodun et al. [20]2019Cross-sectionalAverage age:
53.72 ± 15.2
Male sex: 51.7%
Female sex: 48.3%
491An electrocardiogram was performed. An assessment of the risk of metabolic syndrome in the cardiovascular system was conducted. Questionnaires were used to collect data about the patients.There was a high prevalence of metabolic syndrome and the occurrence of electrocardiographic changes in the studied population. Electrocardiogram abnormalities appeared more frequently in the male population, with no significant difference between those with or without metabolic syndrome.
4Bedane et al. [21]2021Cross-sectionalAverage age:
53.34  ±  11.07
Male sex: 61%
Female sex: 39%
344A standard twelve-lead electrocardiogram was performed.Most of the studied population had electrocardiographic abnormalities (3 out of 5). Factors such as a duration of diabetes of more than 10 years or the use of solid oils were associated with the appearance of abnormalities on electrocardiography.
5Goncalves et al. [22]2021Cross-sectionalAverage age:
35.0 ± 14.5
Male sex: 37%
Female sex: 63%
2379A standard twelve-lead electrocardiogram was performed on all patients and then coded using the Minnesota classification.Minor electrocardiographic abnormalities were more frequently observed in the male population, while significant abnormalities were more common in the female population. The prevalence was as follows: 22.3% minor abnormalities and 4.58% significant abnormalities.
6Sardesai et al. [23]2022Cross-sectionalAverage age:
56.3 ± 8.60
Male sex: 58.5%
Female sex: 41.5%
130The results of the electrocardiogram and 2D echocardiography were correlated with blood glucose levels.Electrocardiogram abnormalities were strongly correlated with postprandial glucose levels, while they were not correlated with fasting glucose levels.
7Sinamaw et al. [24]2021Cross-sectionalAverage age:
56.7 (±12.7,
range  =  28–80)
Male sex: 51.55%
Female sex: 48.45
258A digital electrocardiograph was used to measure electrocardiographic parameters, and other data were collected using a questionnaire.Half of the patients had at least one change observed on the electrocardiogram. Factors such as the long duration of disease (type II diabetes), high postprandial glucose, or hypertension were associated with electrocardiographic abnormalities.
8Yagi et al. [25]2021Cross-sectionalAverage age:
51 ± 8
Male sex: 76%
Female sex: 24%
702An electrocardiogram was performed, and fQRS-type changes were sought.fQRS-type changes were more frequently observed in patients with diabetes than in those with metabolic syndrome or the control group.
9Yagi et al. [26]2022Cross-sectionalAverage age:
67.3  ±  12.6
Male sex: 60.3%
Female sex: 39.7%
320An electrocardiogram was performed, and fQRS-type changes were sought to associate them with diastolic cardiac dysfunction in the context of diabetes mellitus.The appearance of fQRS could be a promising predictor for the onset of diastolic cardiac dysfunction, but the results should be confirmed through a more extensive cohort study.
10Fu et al. [27]2019Cross-sectional Average age: 58.2
Male sex: 35.2%
Female sex: 64.8%
11488Each study participant completed a questionnaire and underwent a physical examination, blood collection for laboratory tests, electrocardiography, and other tests.Increased blood glucose levels are highly prevalent in those over 35 years old and are associated with an increased prevalence of non-valvular atrial fibrillation.
11Shi et al. [28]2020Cross-sectionalAverage age: 52
Male sex: 70.11%
Female sex: 29.88%
358A standard twelve-lead electrocardiogram was performed to identify QTc. Tests were also performed to diagnose obstructive sleep apnea and then correlated with QTc changes.The severity of obstructive sleep apnea was strongly correlated with QTc prolongation in 358 patients with type II diabetes. Factors such as advanced age, body mass index, and female sex are independent factors for the occurrence of obstructive sleep apnea or cardiovascular diseases.
12Ukpabi et al. [29]2017Cross-sectionalAverage age:
46.09 ± 9.51
Male sex: 49.43%
Female sex: 50.56%
176A control group of non-diabetic patients was included. Tests for cardiac autonomic function were performed to diagnose cardiac autonomic neuropathy.The prevalence of prolonged QTc in patients with type II diabetes and cardiac autonomic neuropathy was 12%.
13Migisha et al. [30]2021Cross-sectionalAverage age:
50.1 years (SD ± 9.8)
Male sex: 30.4%
Female sex: 69.6%
299A standard twelve-lead electrocardiogram was performed. A linear progression analysis was conducted to identify QTc correlations.The prevalence of QTc abnormalities was very high.
Disclaimer/Publisher’s Note: The statements, opinions and data contained in all publications are solely those of the individual author(s) and contributor(s) and not of MDPI and/or the editor(s). MDPI and/or the editor(s) disclaim responsibility for any injury to people or property resulting from any ideas, methods, instructions or products referred to in the content.

