

Diagnostic Performance in Differentiating COVID-19 from Other Viral Pneumonias on CT Imaging: Multi-Reader Analysis Compared with an Artificial Intelligence-Based Model
 , , and
Abstract
1. Introduction
2. Materials and Methods
2.1. Study Design and Imaging Data
2.2. Artificial Intelligence-Based Model
2.3. Reader Evaluation
2.4. Data Analysis
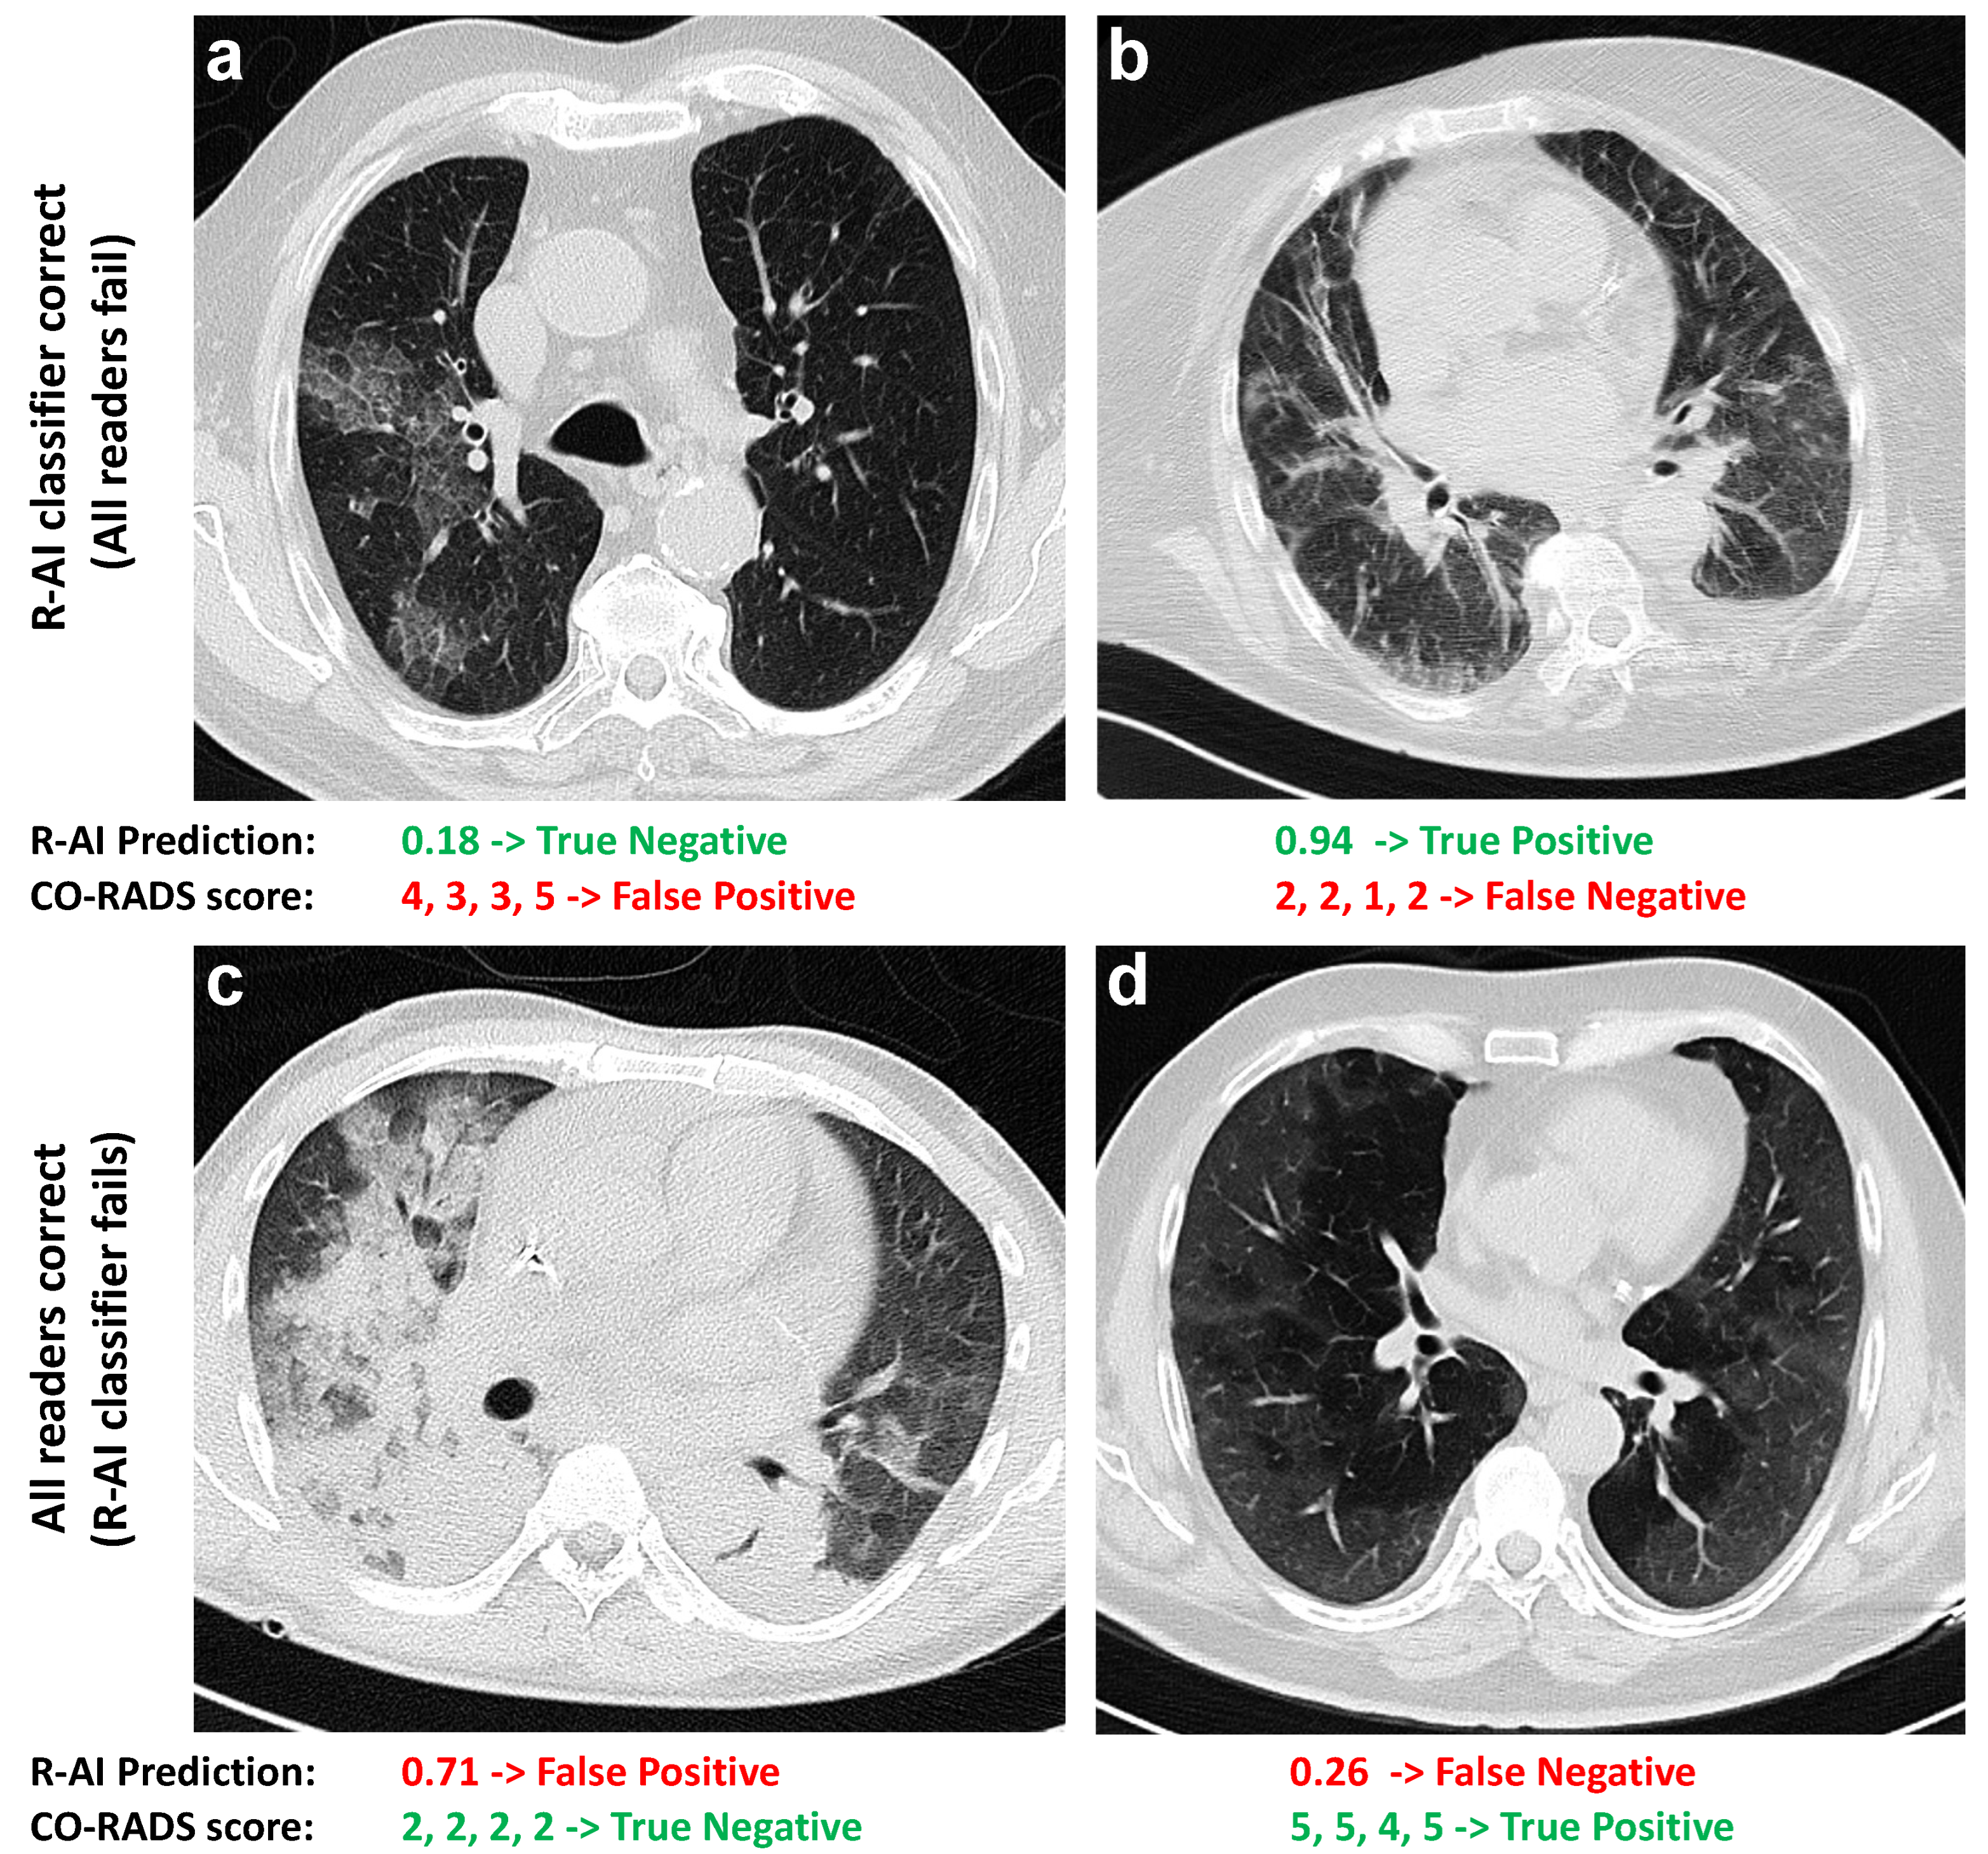
3. Results
4. Discussion
Author Contributions
Funding
Institutional Review Board Statement
Informed Consent Statement
Data Availability Statement
Conflicts of Interest
References
- Johns Hopkins University. COVID-19 Map; Johns Hopkins Coronavirus Resource Center: Singapore, 2021; Available online: https://coronavirus.jhu.edu/map.html (accessed on 20 August 2022).
- Rizzetto, F.; Perillo, N.; Artioli, D.; Travaglini, F.; Cuccia, A.; Zannoni, S.; Tombini, V.; Di Domenico, S.L.; Albertini, V.; Bergamaschi, M.; et al. Correlation between lung ultrasound and chest CT patterns with estimation of pulmonary burden in COVID-19 patients. Eur. J. Radiol. 2021, 138, 109650. [Google Scholar] [CrossRef] [PubMed]
- Yang, W.; Sirajuddin, A.; Zhang, X.; Liu, G.; Teng, Z.; Zhao, S.; Lu, M. The role of imaging in 2019 novel coronavirus pneumonia (COVID-19). Eur. Radiol. 2020, 30, 4874–4882. [Google Scholar] [CrossRef] [PubMed]
- Parekh, M.; Donuru, A.; Balasubramanya, R.; Kapur, S. Review of the Chest CT Differential Diagnosis of Ground-Glass Opacities in the COVID Era. Radiology 2020, 297, E289–E302. [Google Scholar] [CrossRef]
- Garrana, S.H.; Som, A.; Ndakwah, G.S.; Yeung, T.; Febbo, J.; Heeger, A.P.; Lang, M.; McDermott, S.; Mendoza, D.P.; Zhang, E.W.; et al. Comparison of Chest CT Findings of COVID-19, Influenza, and Organizing Pneumonia: A Multireader Study. Am. J. Roentgenol. 2021, 217, 1093–1102. [Google Scholar] [CrossRef] [PubMed]
- Koo, H.J.; Lim, S.; Choe, J.; Choi, S.-H.; Sung, H.; Do, K.-H. Radiographic and CT Features of Viral Pneumonia. Radiographics 2018, 38, 719–739. [Google Scholar] [CrossRef] [PubMed]
- Bai, H.X.; Hsieh, B.; Xiong, Z.; Halsey, K.; Choi, J.W.; Tran, T.M.L.; Pan, I.; Shi, L.-B.; Wang, D.-C.; Mei, J.; et al. Performance of Radiologists in Differentiating COVID-19 from Non-COVID-19 Viral Pneumonia at Chest CT. Radiology 2020, 296, E46–E54. [Google Scholar] [CrossRef]
- Prokop, M.; Van Everdingen, W.; van Rees Vellinga, T.; Quarles van Ufford, H.; Stöger, L.; Beenen, L.; Geurts, B.; Gietema, H.; Krdzalic, J.; Schaefer-Prokop, C.; et al. CO-RADS: A Categorical CT Assessment Scheme for Patients Suspected of Having COVID-19—Definition and Evaluation. Radiology 2020, 296, E97–E104. [Google Scholar] [CrossRef]
- Liu, G.; Chen, Y.; Runa, A.; Liu, J. Diagnostic performance of CO-RADS for COVID-19: A systematic review and meta-analysis. Eur. Radiol. 2022, 32, 4414–4426. [Google Scholar] [CrossRef]
- Bellini, D.; Panvini, N.; Rengo, M.; Vicini, S.; Lichtner, M.; Tieghi, T.; Ippoliti, D.; Giulio, F.; Orlando, E.; Iozzino, M.; et al. Diagnostic accuracy and interobserver variability of CO-RADS in patients with suspected coronavirus disease-2019: A multireader validation study. Eur. Radiol. 2020, 31, 1932–1940. [Google Scholar] [CrossRef]
- Kundu, S.; Elhalawani, H.; Gichoya, J.W.; Kahn, C.E. How Might AI and Chest Imaging Help Unravel COVID-19’s Mysteries? Radiol. Artif. Intell. 2020, 2, e200053. [Google Scholar] [CrossRef]
- Wang, M.; Xia, C.; Huang, L.; Xu, S.; Qin, C.; Liu, J.; Cao, Y.; Yu, P.; Zhu, T.; Zhu, H.; et al. Deep learning-based triage and analysis of lesion burden for COVID-19: A retrospective study with external validation. Lancet Digit. Health 2020, 2, e506–e515. [Google Scholar] [CrossRef] [PubMed]
- Zhou, M.; Yang, D.; Chen, Y.; Xu, Y.; Xu, J.-F.; Jie, Z.; Yao, W.; Jin, X.; Pan, Z.; Tan, J.; et al. Deep learning for differentiating novel coronavirus pneumonia and influenza pneumonia. Ann. Transl. Med. 2021, 9, 111. [Google Scholar] [CrossRef] [PubMed]
- Wang, H.; Wang, L.; Lee, E.H.; Zheng, J.; Zhang, W.; Halabi, S.; Liu, C.; Deng, K.; Song, J.; Yeom, K.W. Decoding COVID-19 pneumonia: Comparison of deep learning and radiomics CT image signatures. Eur. J. Pediatr. 2021, 48, 1478–1486. [Google Scholar] [CrossRef]
- Bai, H.X.; Wang, R.; Xiong, Z.; Hsieh, B.; Chang, K.; Halsey, K.; Tran, T.M.L.; Choi, J.W.; Wang, D.-C.; Shi, L.-B.; et al. Artificial Intelligence Augmentation of Radiologist Performance in Distinguishing COVID-19 from Pneumonia of Other Origin at Chest CT. Radiology 2020, 296, E156–E165. [Google Scholar] [CrossRef] [PubMed]
- Mulrenan, C.; Rhode, K.; Fischer, B.M. A Literature Review on the Use of Artificial Intelligence for the Diagnosis of COVID-19 on CT and Chest X-ray. Diagnostics 2022, 12, 869. [Google Scholar] [CrossRef]
- Kriza, C.; Amenta, V.; Zenié, A.; Panidis, D.; Chassaigne, H.; Urbán, P.; Holzwarth, U.; Sauer, A.V.; Reina, V.; Griesinger, C.B. Artificial intelligence for imaging-based COVID-19 detection: Systematic review comparing added value of AI versus human readers. Eur. J. Radiol. 2021, 145, 110028. [Google Scholar] [CrossRef] [PubMed]
- Zorzi, G.; Berta, L.; Rizzetto, F.; De Mattia, C.; Felisi, M.M.J.; Carrazza, S.; Nerini Molteni, S.; Vismara, C.; Scaglione, F.; Vanzulli, A.; et al. Artificial intelligence for differentiating COVID-19 from other viral pneumonias on CT imaging: Comparative analysis between different models based on quantitative and radiomic approaches. Eur. Radiol. Exp. 2022; in press. [Google Scholar]
- Wilson, E.B. Probable Inference, the Law of Succession, and Statistical Inference. J. Am. Stat. Assoc. 1927, 22, 209–212. [Google Scholar] [CrossRef]
- Tran, D.; Dolgun, A.; Demirhan, H. Weighted inter-rater agreement measures for ordinal outcomes. Commun. Stat.—Simul. Comput. 2018, 49, 989–1003. [Google Scholar] [CrossRef]
- Quarfoot, D.; Levine, R.A. How Robust Are Multirater Interrater Reliability Indices to Changes in Frequency Distribution? Am. Stat. 2016, 70, 373–384. [Google Scholar] [CrossRef]
- Vial, A.; Assink, M.; Stams, G.J.J.M.; van der Put, C. Safety and Risk Assessment in Child Welfare: A Reliability Study Using Multiple Measures. J. Child Fam. Stud. 2019, 28, 3533–3544. [Google Scholar] [CrossRef]
- Berta, L.; Rizzetto, F.; De Mattia, C.; Lizio, D.; Felisi, M.; Colombo, P.; Carrazza, S.; Gelmini, S.; Bianchi, L.; Artioli, D.; et al. Automatic lung segmentation in COVID-19 patients: Impact on quantitative computed tomography analysis. Phys. Med. 2021, 87, 115–122. [Google Scholar] [CrossRef] [PubMed]
- Altman, D. Practical Statistics for Medical Research; Chapman and Hall: London, UK, 1991. [Google Scholar]
- Gwet, K.L. On the Krippendorff’s Alpha Coefficient. 2011. Available online: http://www.bwgriffin.com/gsu/courses/edur9131/content/onkrippendorffalpha.pdf (accessed on 20 August 2022).
- Nair, A.V.; McInnes, M.; Jacob, B.; Kumar, D.; Soman, D.K.; Subair, H.S.V.; Mahajan, P.S.; Shah, M.A.H.; Sabawi, M.A.S.; Al-Heidous, M. Diagnostic accuracy and inter-observer agreement with the CO-RADS lexicon for CT chest reporting in COVID-19. Emerg. Radiol. 2021, 28, 1045–1054. [Google Scholar] [CrossRef]
- Luo, L.; Luo, Z.; Jia, Y.; Zhou, C.; He, J.; Lyu, J.; Shen, X. CT differential diagnosis of COVID-19 and non-COVID-19 in symptomatic suspects: A practical scoring method. BMC Pulm. Med. 2020, 20, 129. [Google Scholar] [CrossRef] [PubMed]
- Jalaber, C.; Chassagnon, G.; Hani, C.; Dangeard, S.; Babin, M.; Launay, O.; Revel, M.-P. Is COVID-19 pneumonia differentiable from other viral pneumonia on CT scan? Respir. Med. Res. 2021, 79, 100824. [Google Scholar] [CrossRef] [PubMed]
- Cardobi, N.; Benetti, G.; Cardano, G.; Arena, C.; Micheletto, C.; Cavedon, C.; Montemezzi, S. CT radiomic models to distinguish COVID-19 pneumonia from other interstitial pneumonias. La Radiol. Med. 2021, 126, 1037–1043. [Google Scholar] [CrossRef]
- Wang, L.; Kelly, B.; Lee, E.H.; Wang, H.; Zheng, J.; Zhang, W.; Halabi, S.; Liu, J.; Tian, Y.; Han, B.; et al. Multi-classifier-based identification of COVID-19 from chest computed tomography using generalizable and interpretable radiomics features. Eur. J. Radiol. 2021, 136, 109552. [Google Scholar] [CrossRef] [PubMed]
- Rubin, G.D.; Ryerson, C.J.; Haramati, L.B.; Sverzellati, N.; Kanne, J.; Raoof, S.; Schluger, N.W.; Volpi, A.; Yim, J.-J.; Martin, I.B.K.; et al. The Role of Chest Imaging in Patient Management during the COVID-19 Pandemic: A Multinational Consensus Statement from the Fleischner Society. Radiology 2020, 296, 172–180. [Google Scholar] [CrossRef]


| Total Population | |||
| All Patients | COVID-19 | Non-COVID-19 | |
| Age | 66 (55–77) | 67 (55–78) | 66 (54–74) |
| Sex | |||
| Male | 694 (67%) | 458 (71%) | 236 (61%) |
| Female | 337 (33%) | 189 (29%) | 148 (39%) |
| Virus | |||
| SARS-CoV-2 | 647 (63%) | 647 (100%) | - |
| Adenovirus | 14 (1%) | - | 14 (4%) |
| Coronavirus 229E/NL63/OC43 | 29 (3%) | - | 29 (8%) |
| Enterovirus | 5 (0%) | - | 5 (1%) |
| Influenza virus A/B | 147 (14%) | - | 147 (38%) |
| Bocavirus 1/2/3/4 | 12 (1%) | - | 12 (3%) |
| Metapneumovirus | 22 (2%) | - | 22 (6%) |
| Parainfluenza virus 1/2/3/4 | 25 (2%) | - | 25 (7%) |
| Rhinovirus A/B/C | 94 (9%) | - | 94 (24%) |
| Respiratory syncytial virus A/B | 36 (3%) | - | 36 (9%) |
| Total | 1031 (100%) | 647 (100%) | 384 (100%) |
| Train Set | |||
| All Patients | COVID-19 | Non-COVID-19 | |
| Age | 66 (54–77) | 67 (55–78) | 65 (54–74) |
| Sex | |||
| Male | 535 (66%) | 347 (70%) | 188 (60%) |
| Female | 276 (34%) | 149 (30%) | 127 (40%) |
| Virus | |||
| SARS-CoV-2 | 496 (61%) | 496 (100%) | - |
| Adenovirus | 12 (1%) | - | 12 (4%) |
| Coronavirus 229E/NL63/OC43 | 25 (3%) | - | 25 (8%) |
| Enterovirus | 4 (0.5%) | - | 4 (1%) |
| Influenza virus A/B | 119 (15%) | - | 119 (38%) |
| Bocavirus 1/2/3/4 | 10 (1%) | - | 10 (3%) |
| Metapneumovirus | 17 (2%) | - | 17 (5%) |
| Parainfluenza virus 1/2/3/4 | 19 (2%) | - | 19 (6%) |
| Rhinovirus A/B/C | 79 (10%) | - | 79 (25%) |
| Respiratory syncytial virus A/B | 30 (4%) | - | 30 (10%) |
| Total | 811 (100%) | 496 (100%) | 315 (100%) |
| Independent Validation Set | |||
| All Patients | COVID-19 | Non-COVID-19 | |
| Age | 68 (59–78) | 67 (59–79) | 68 (60–75) |
| Sex | |||
| Male | 159 (72%) | 111 (74%) | 48 (70%) |
| Female | 61 (28%) | 40 (26%) | 21 (30%) |
| Virus | |||
| SARS-CoV-2 | 151 (69%) | 151 (100%) | - |
| Adenovirus | 2 (1%) | - | 2 (3%) |
| Coronavirus 229E/NL63/OC43 | 4 (2%) | - | 4 (6%) |
| Enterovirus | 1 (0.005%) | - | 1 (1%) |
| Influenza virus A/B | 28 (13%) | - | 28 (41%) |
| Bocavirus 1/2/3/4 | 2 (1%) | - | 2 (3%) |
| Metapneumovirus | 5 (2%) | - | 5 (7%) |
| Parainfluenza virus 1/2/3/4 | 6 (3%) | - | 6 (9%) |
| Rhinovirus A/B/C | 15 (7%) | - | 15 (22%) |
| Respiratory syncytial virus A/B | 6 (3%) | - | 6 (9%) |
| Total | 220 (100%) | 151 (100%) | 69 (100%) |
| COVID-19 Patients | Non-COVID-19 Patients | Total Readings | |||||||||
|---|---|---|---|---|---|---|---|---|---|---|---|
| CO-RADS | Reader 1 | Reader 2 | Reader 3 | Reader 4 | Total | Reader 1 | Reader 2 | Reader 3 | Reader 4 | Total | |
| 1 | 7 (5%) | 4 (3%) | 9 (6%) | 12 (8%) | 32 (5% | 16 (23%) | 10 (14%) | 11 (16%) | 18 (26%) | 55 (20%) | 87 (10%) |
| 2 | 25 (17%) | 7 (5%) | 29 (19%) | 8 (5%) | 69 (11%) | 28 (41%) | 23 (33%) | 48 (70%) | 27 (39%) | 126 (46%) | 195 (22%) |
| 3 | 21 (14%) | 25 (17%) | 24 (16%) | 20 (13%) | 91 (15%) | 16 (23%) | 25 (36%) | 6 (9%) | 15 (22%) | 62 (22%) | 152 (17%) |
| 4 | 36 (24%) | 33 (22%) | 46 (30%) | 21 (14%) | 135 (22%) | 4 (6%) | 6 (9%) | 3 (4%) | 0 (0%) | 13% (5%) | 149 (17%) |
| 5 | 62 (41%) | 82 (54%) | 43 (28%) | 90 (60%) | 277 (46%) | 5 (7%) | 5 (7%) | 1 (1%) | 9 (13%) | 20 (7%) | 297 (34%) |
| 151 (100%) | 604 (100%) | 69 (100%) | 276 (100%) | 880 (100%) | |||||||
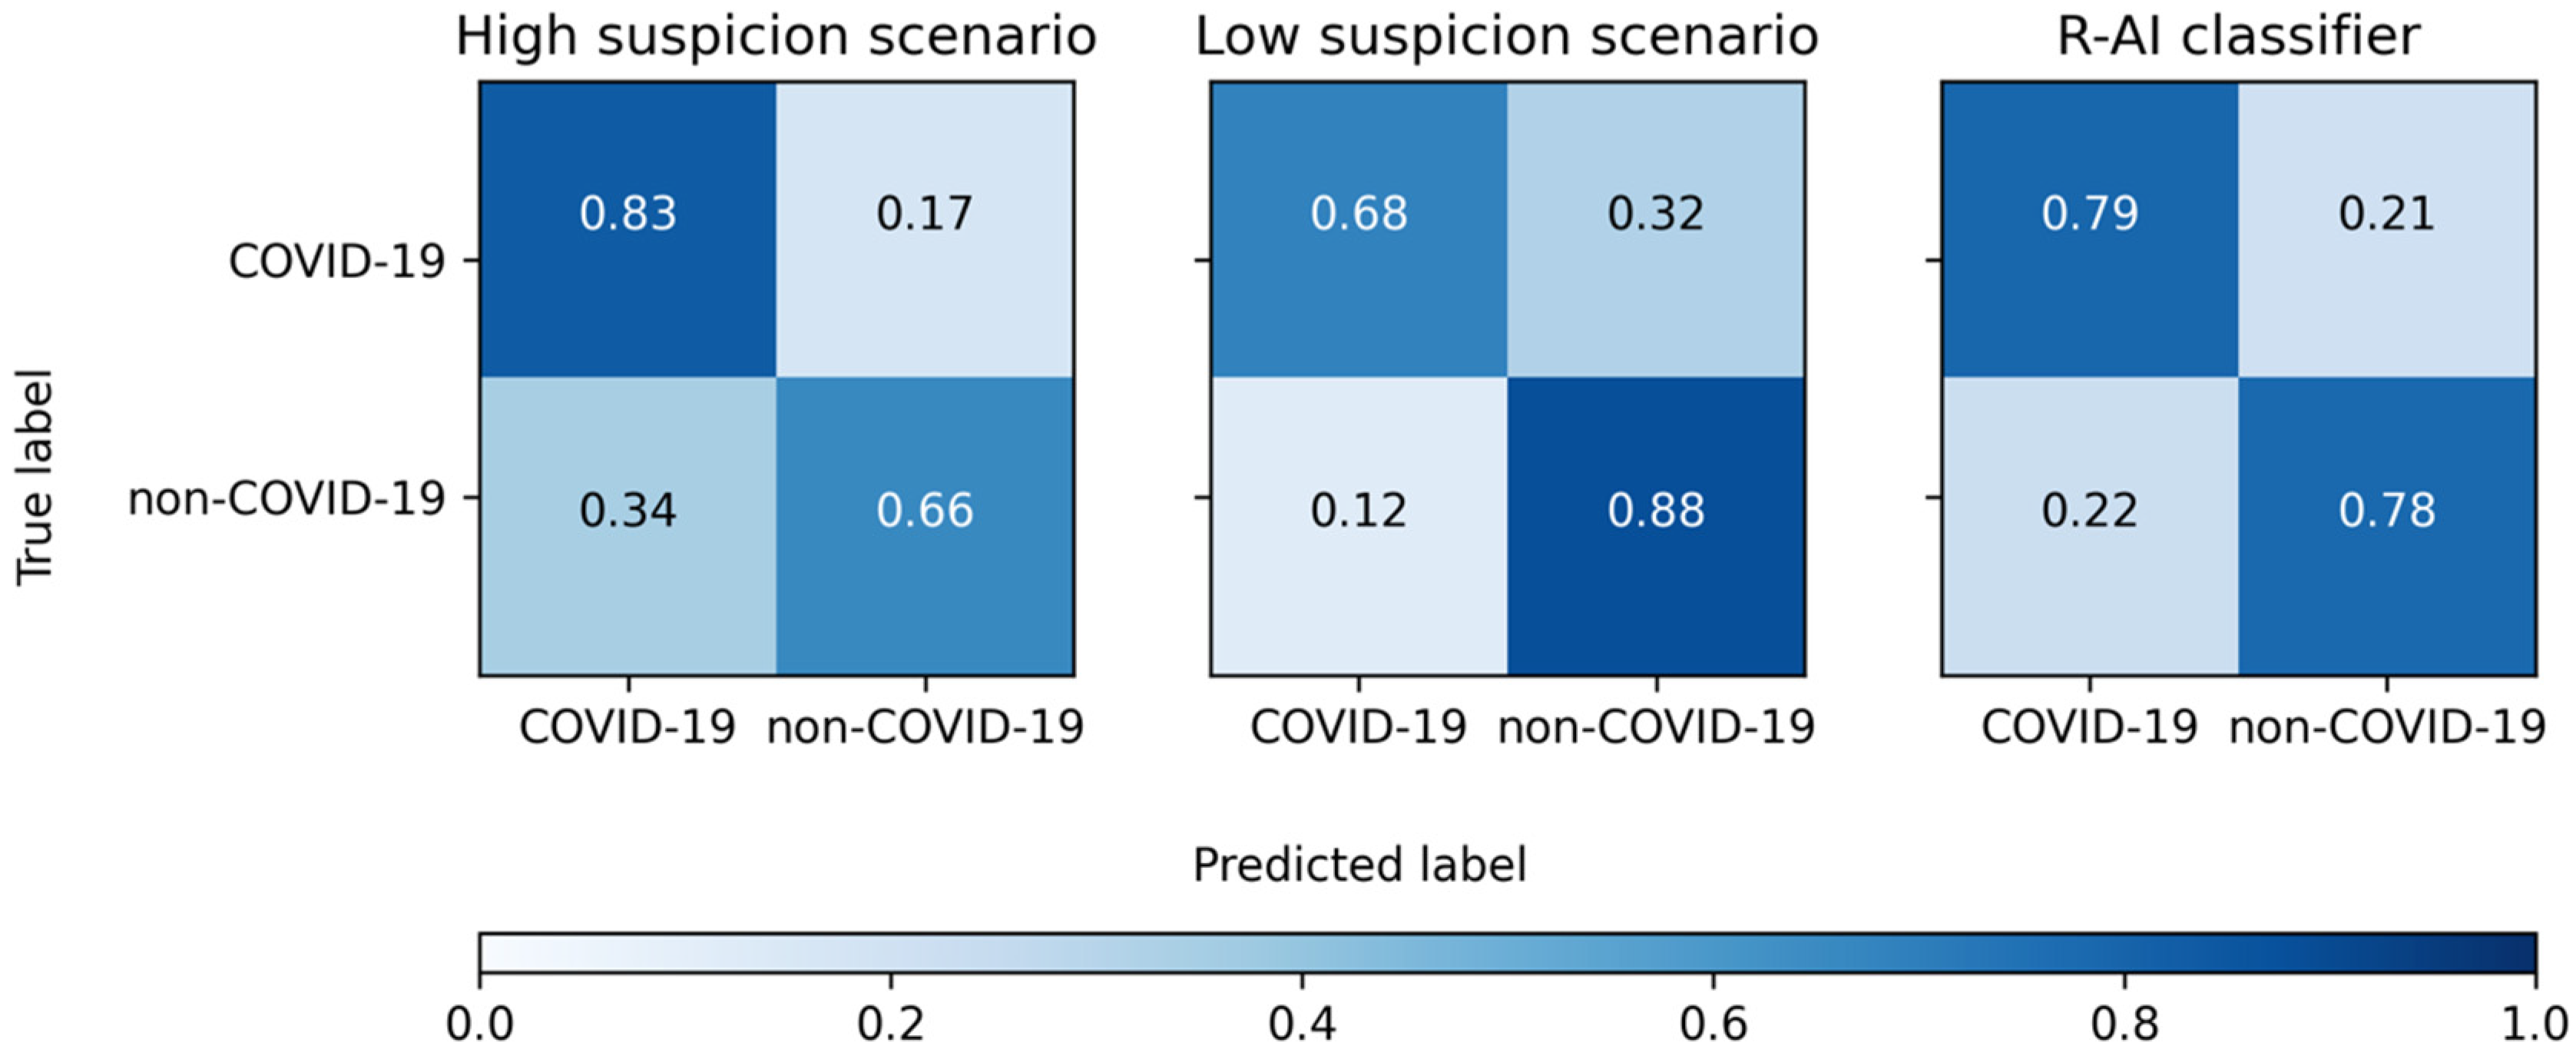
| SE | SP | ACC | PLR | NLR | |
|---|---|---|---|---|---|
| High Suspicion Scenario | |||||
| Reader 1 | 79% (71–85%) | 64% (51–75%) | 74% (68–80%) | 2.18 (1.57–3.01) | 0.33 (0.23–0.47) |
| Reader 2 | 93% (87–96%) | 48% (36–60%) | 79% (73–84%) | 1.78 (1.41–2.24) | 0.15 (0.08–0.28) |
| Reader 3 | 75% (67–82%) | 86% (75–93%) | 78% (72–83%) | 5.16 (2.89–9.23) | 0.29 (0.22–0.39) |
| Reader 4 | 87% (80–92%) | 65% (53–76%) | 80% (74–85%) | 2.49 (1.79–3.47) | 0.20 (0.13–0.32) |
| Total | 83% (80–86%) | 66% (60–71%) | 78% (75–80%) | 2.42 (2.05–2.86) | 0.25 (0.21–0.31) |
| Low suspicion scenario | |||||
| Reader 1 | 65% (57–72%) | 87% (77–94%) | 72% (65–78%) | 4.98 (2.68–9.25) | 0.40 (0.32–0.51) |
| Reader 2 | 76% (69–83%) | 84% (73–92%) | 79% (73–84%) | 4.78 (2.76–8.27) | 0.28 (0.21–0.38) |
| Reader 3 | 59% (51–67%) | 94% (86–98%) | 70% (63–76%) | 10.17 (3.89–26.57) | 0.44 (0.36–0.53) |
| Reader 4 | 74% (66–80%) | 87% (77–94%) | 78% (72–83%) | 5.64 (3.04–10.44) | 0.30 (0.23–0.40) |
| Total | 68% (64–72%) | 88% (84–92%) | 75% (72–77%) | 5.70 (4.12–7.89) | 0.36 (0.32–0.41) |
| R-AI | 79% (71–85%) | 78% (67–87%) | 79% (73–84%) | 3.63 (2.30–5.72) | 0.27 (0.19–0.38) |
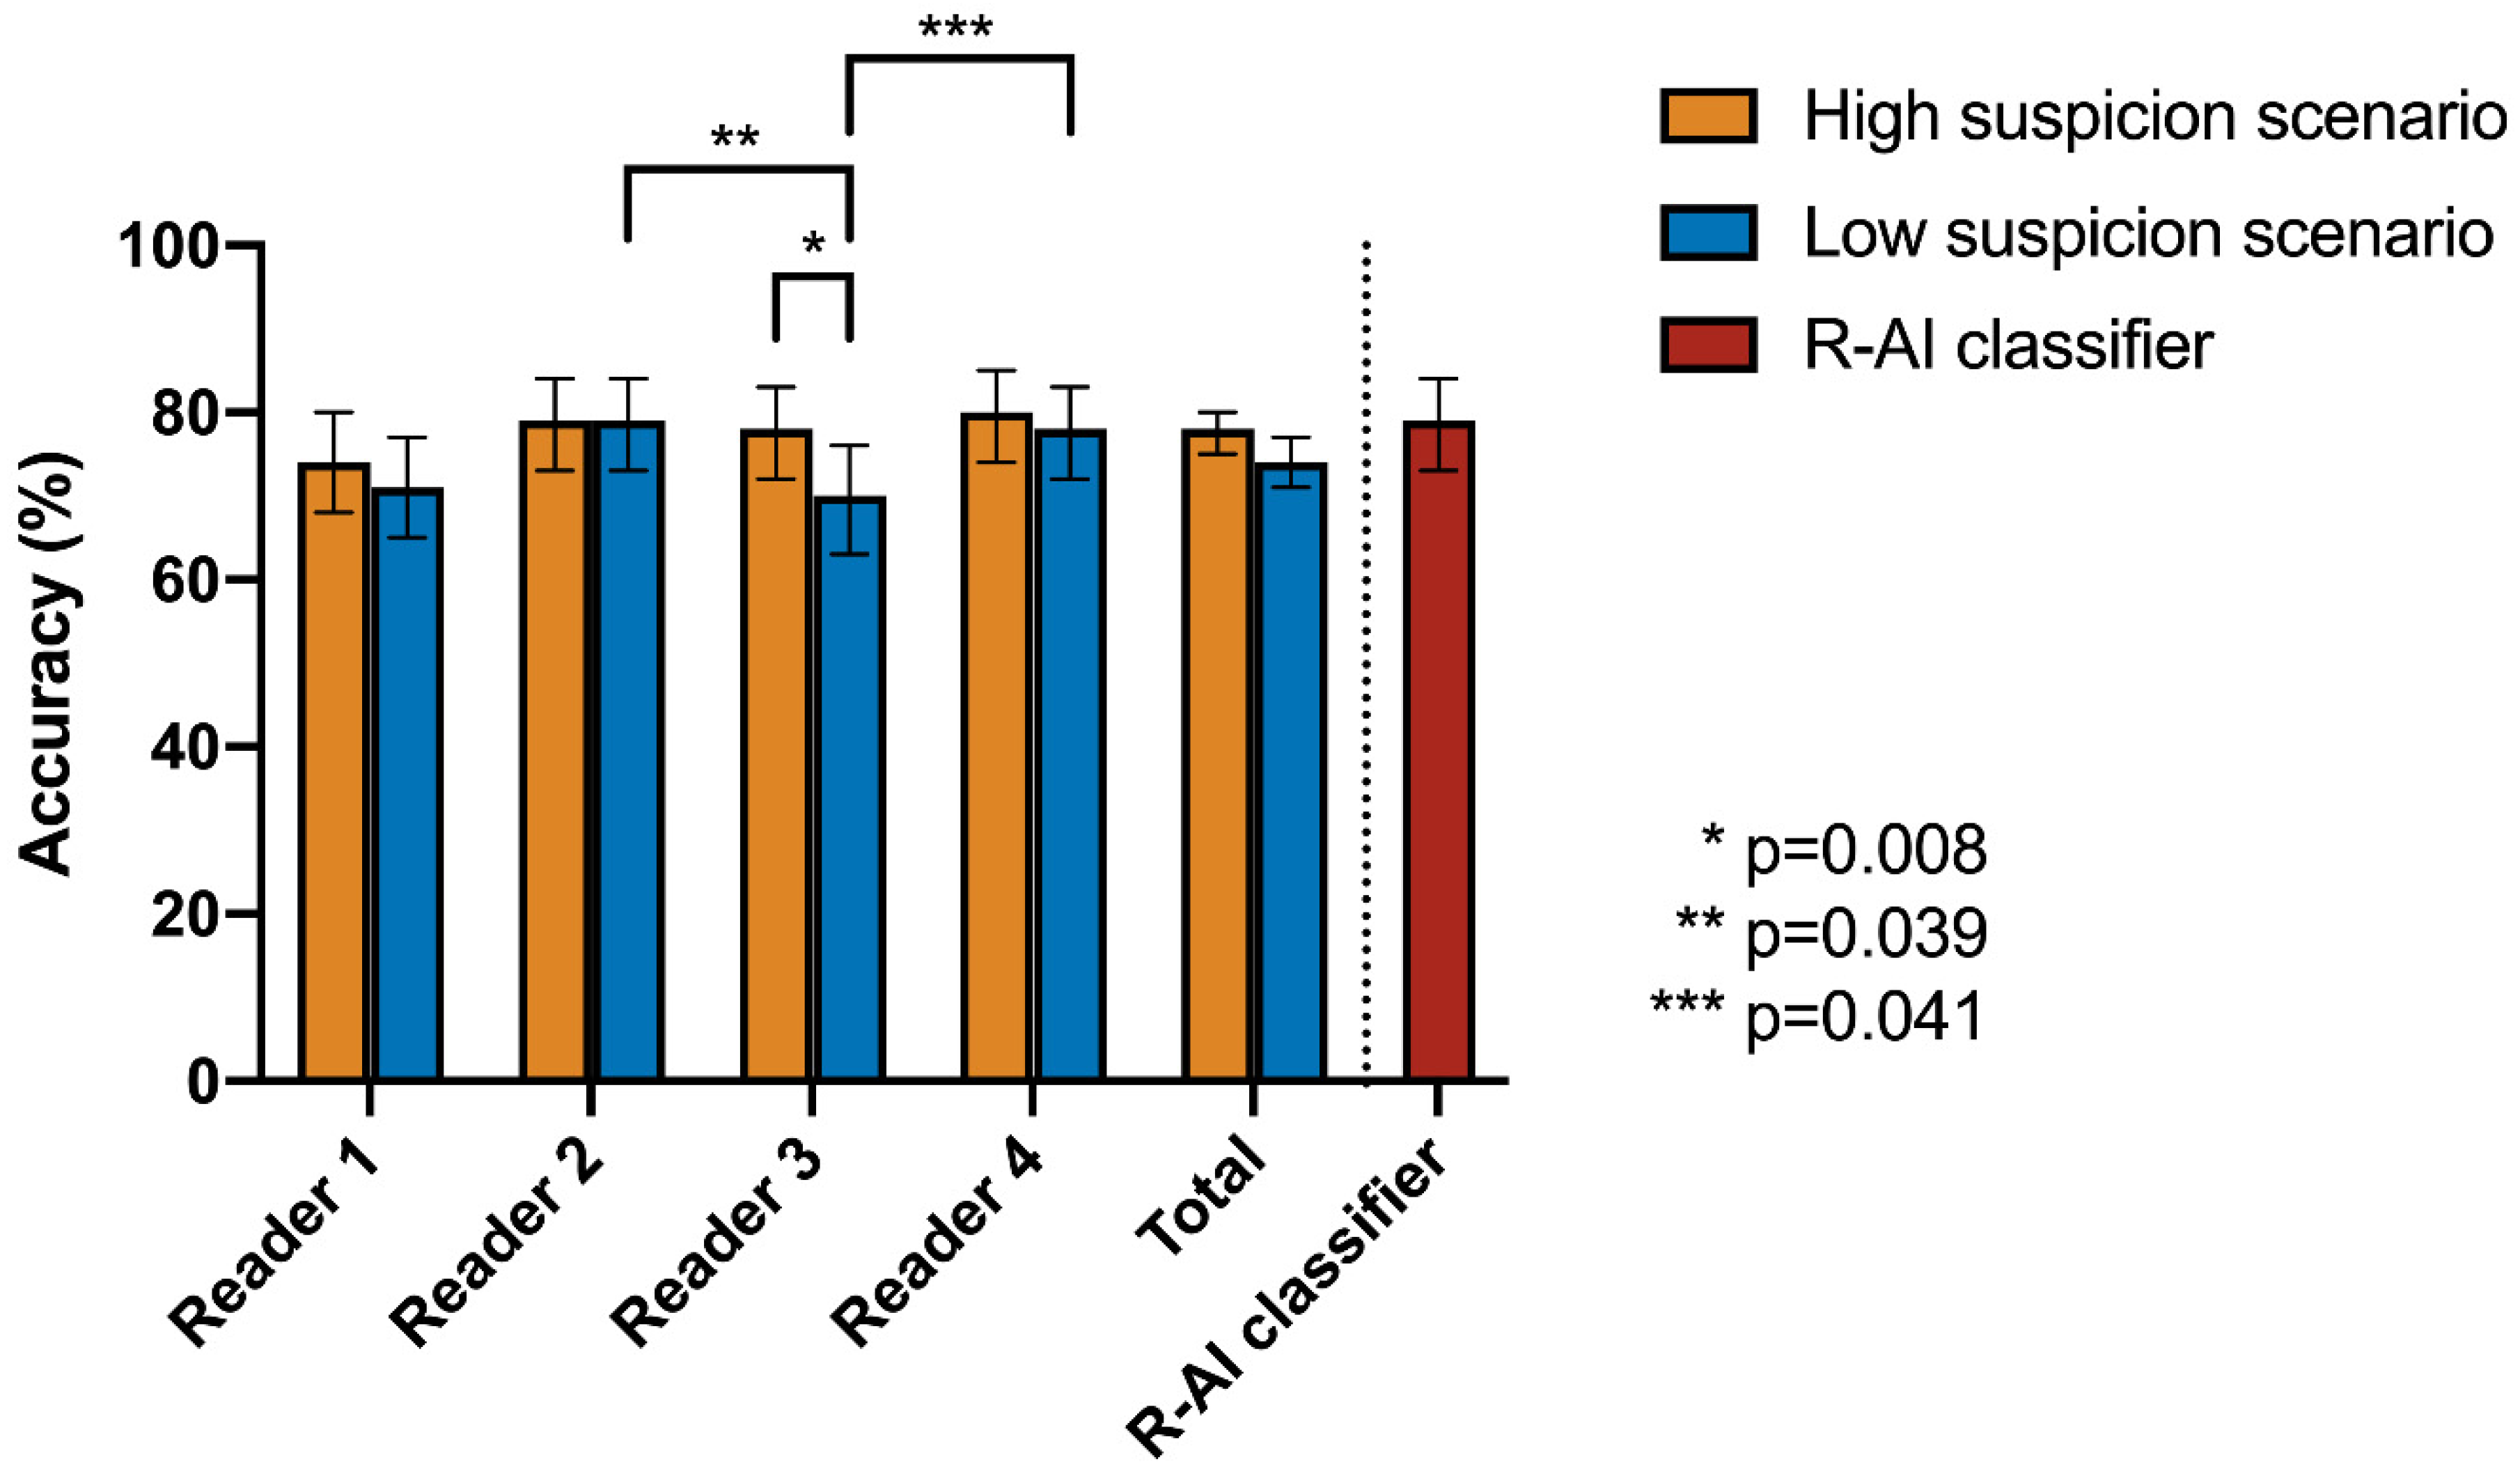
| Cochran’s Q Test | Post-Hoc Pairwise McNemar Test | |||||||||
|---|---|---|---|---|---|---|---|---|---|---|
| High Suspicion Scenario | Low Suspicion Scenario | R-AI | Reader 1 | Reader 2 | Reader 3 | Reader 4 | ||||
| Accuracy | p-Value | Accuracy | p-Value | |||||||
| R-AI | 79% | 0.369 | 79% | 0.003 * | R-AI | 1 | - | - | - | - |
| Reader 1 | 74% | 72% | Reader 1 | 0.637 | 1 | - | - | - | ||
| Reader 2 | 79% | 79% | Reader 2 | 1 | 0.288 | 1 | - | - | ||
| Reader 3 | 78% | 70% | Reader 3 | 0.256 | 1 | 0.039 * | 1 | - | ||
| Reader 4 | 80% | 78% | Reader 4 | 1 | 0.259 | 1 | 0.041 * | 1 | ||
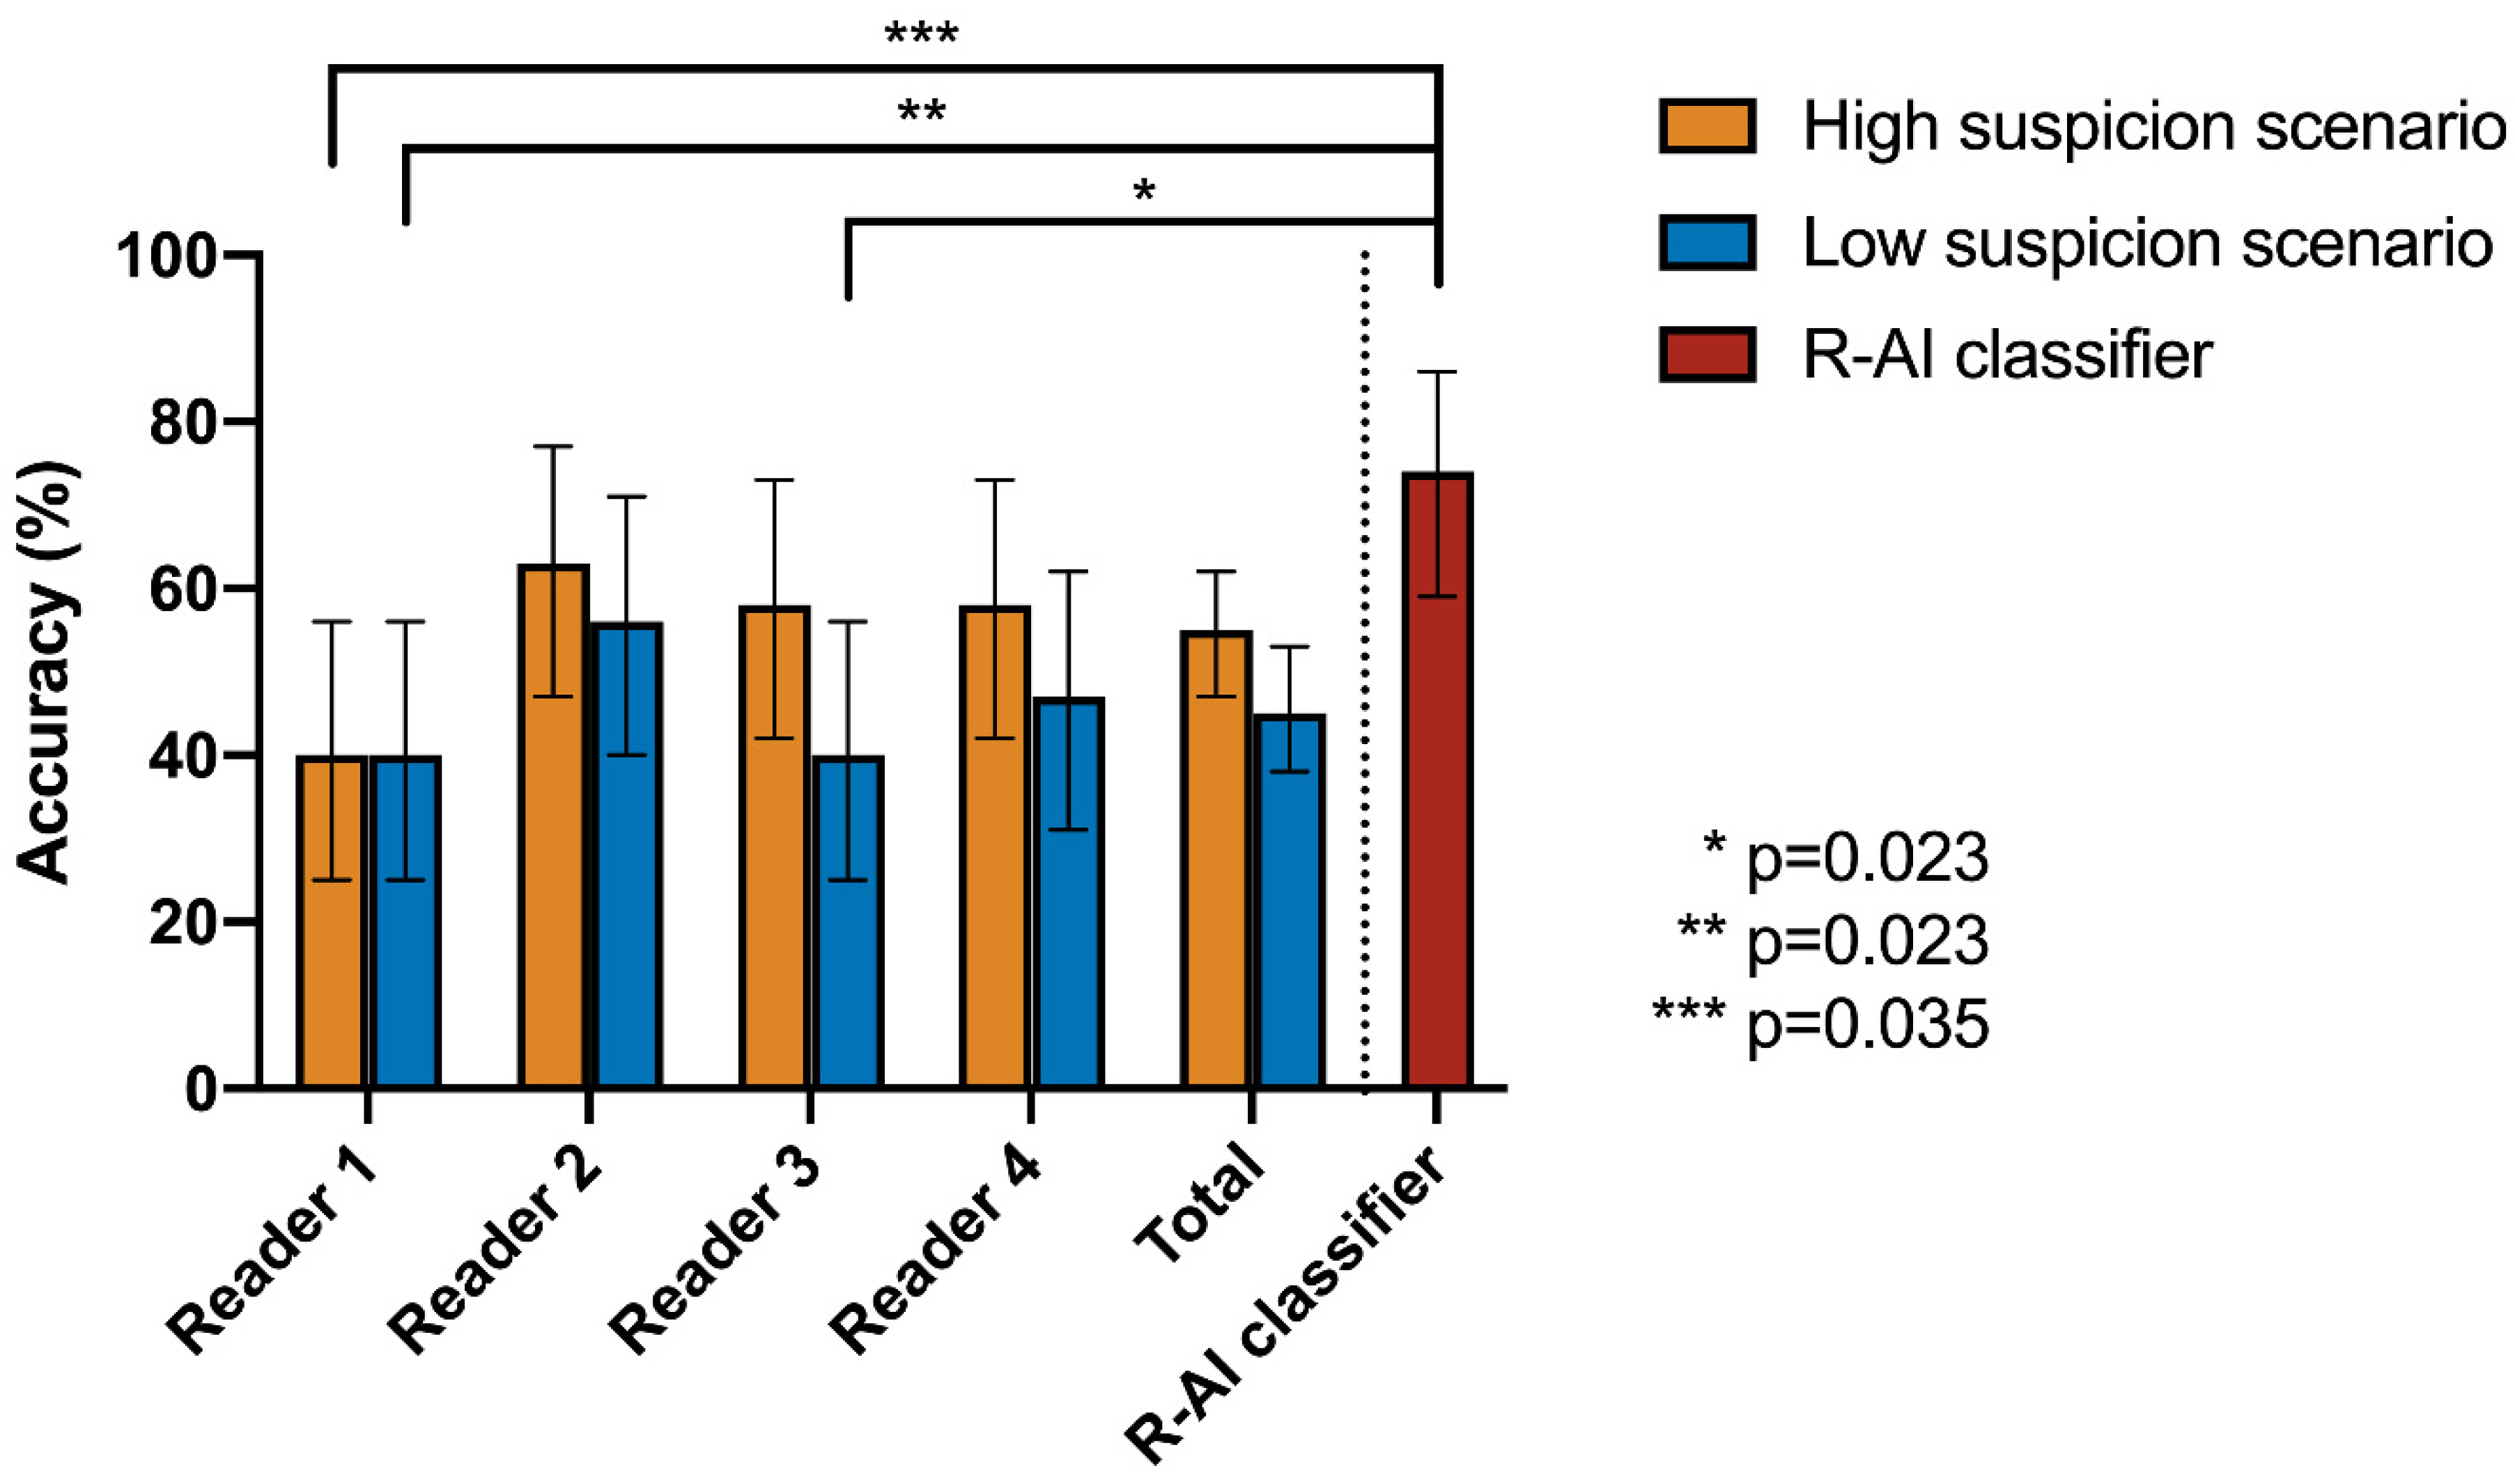
| SE | SP | ACC | PLR | NLR | |
|---|---|---|---|---|---|
| High Suspicion Scenario | |||||
| Reader 1 | 42% (23–63%) | 35% (14–62%) | 40% (25–56%) | 0.65 (0.37–1.16) | 1.63 (0.79–3.37) |
| Reader 2 | 100% (87–100%) | 6% (0–29%) | 63% (47–77%) | 1.06 (0.94–1.20) | n/a |
| Reader 3 | 42% (23–63%) | 82% (57–96%) | 58% (42–73%) | 2.4 (0.78–7.35) | 0.7 (0.47–1.04) |
| Reader 4 | 92% (75–99%) | 6% (0–29%) | 58% (42–73%) | 0.98 (0.83–1.15) | 1.31 (0.13–13.32) |
| Total | 69% (59–78%) | 32% (22–45%) | 55% (47–62%) | 1.02 (0.83–1.26) | 0.95 (0.61–1.49) |
| Low Suspicion Scenario | |||||
| Reader 1 | 12% (2–30%) | 82% (57–96%) | 40% (25–56%) | 0.65 (0.15–2.87) | 1.07 (0.83–1.39) |
| Reader 2 | 31% (14–52%) | 94% (71–100%) | 56% (40–71%) | 5.23 (0.72–38.15) | 0.74 (0.55–0.98) |
| Reader 3 | 0% (0–13%) | 100% (80–100%) | 40% (25–56%) | n/a | 1 (1.00–1.00) |
| Reader 4 | 19% (7–39%) | 88% (64–99%) | 47% (31–62%) | 1.63 (0.36–7.49) | 0.92 (0.71–1.18) |
| Total | 15% (9–24%) | 91% (82–97%) | 45% (38–53%) | 1.74 (0.72–4.23) | 0.93 (0.83–1.04) |
| R-AI | 69% (48–86%) | 82% (57–96%) | 74% (59–86%) | 3.92 (1.36–11.31) | 0.37 (0.20–0.69) |
| Cochran’s Q Test | Post-Hoc Pairwise McNemar Test | |||||||
|---|---|---|---|---|---|---|---|---|
| High Suspicion Scenario | R-AI | Reader 1 | Reader 2 | Reader 3 | Reader 4 | |||
| Accuracy | p-value | |||||||
| R-AI | 74% | <0.001 * | R-AI | 1 | - | - | - | - |
| Reader 1 | 40% | Reader 1 | 0.035 * | 1 | - | - | - | |
| Reader 2 | 63% | Reader 2 | 1 | 0.550 | 1 | - | - | |
| Reader 3 | 58% | Reader 3 | 1 | 0.614 | 1 | 1 | - | |
| Reader 4 | 58% | Reader 4 | 1 | 1 | 1 | 1 | 1 | |
| Low Suspicion Scenario | R-AI | Reader 1 | Reader 2 | Reader 3 | Reader 4 | |||
| Accuracy | p-value | |||||||
| R-AI | 74% | <0.001 * | R-AI | 1 | - | - | - | - |
| Reader 1 | 40% | Reader 1 | 0.023 * | 1 | - | - | - | |
| Reader 2 | 56% | Reader 2 | 0.990 | 1 | 1 | - | - | |
| Reader 3 | 40% | Reader 3 | 0.023 * | 1 | 0.455 | 1 | - | |
| Reader 4 | 47% | Reader 4 | 0.139 | 1 | 1 | 1 | 1 | |
Publisher’s Note: MDPI stays neutral with regard to jurisdictional claims in published maps and institutional affiliations. |
© 2022 by the authors. Licensee MDPI, Basel, Switzerland. This article is an open access article distributed under the terms and conditions of the Creative Commons Attribution (CC BY) license (https://creativecommons.org/licenses/by/4.0/).
Share and Cite
Rizzetto, F.; Berta, L.; Zorzi, G.; Cincotta, A.; Travaglini, F.; Artioli, D.; Nerini Molteni, S.; Vismara, C.; Scaglione, F.; Torresin, A.; et al. Diagnostic Performance in Differentiating COVID-19 from Other Viral Pneumonias on CT Imaging: Multi-Reader Analysis Compared with an Artificial Intelligence-Based Model. Tomography 2022, 8, 2815-2827. https://doi.org/10.3390/tomography8060235
Rizzetto F, Berta L, Zorzi G, Cincotta A, Travaglini F, Artioli D, Nerini Molteni S, Vismara C, Scaglione F, Torresin A, et al. Diagnostic Performance in Differentiating COVID-19 from Other Viral Pneumonias on CT Imaging: Multi-Reader Analysis Compared with an Artificial Intelligence-Based Model. Tomography. 2022; 8(6):2815-2827. https://doi.org/10.3390/tomography8060235
Chicago/Turabian StyleRizzetto, Francesco, Luca Berta, Giulia Zorzi, Antonino Cincotta, Francesca Travaglini, Diana Artioli, Silvia Nerini Molteni, Chiara Vismara, Francesco Scaglione, Alberto Torresin, and et al. 2022. "Diagnostic Performance in Differentiating COVID-19 from Other Viral Pneumonias on CT Imaging: Multi-Reader Analysis Compared with an Artificial Intelligence-Based Model" Tomography 8, no. 6: 2815-2827. https://doi.org/10.3390/tomography8060235
APA StyleRizzetto, F., Berta, L., Zorzi, G., Cincotta, A., Travaglini, F., Artioli, D., Nerini Molteni, S., Vismara, C., Scaglione, F., Torresin, A., Colombo, P. E., Carbonaro, L. A., & Vanzulli, A. (2022). Diagnostic Performance in Differentiating COVID-19 from Other Viral Pneumonias on CT Imaging: Multi-Reader Analysis Compared with an Artificial Intelligence-Based Model. Tomography, 8(6), 2815-2827. https://doi.org/10.3390/tomography8060235