
Chemical Exchange Saturation Transfer for Lactate-Weighted Imaging at 3 T MRI: Comprehensive In Silico, In Vitro, In Situ, and In Vivo Evaluations

 , , , , , , , ,
Abstract
:1. Introduction
2. Materials and Methods
2.1. Study Design
2.2. MRI
2.3. In Silico Study: Numerical Sequence Optimization
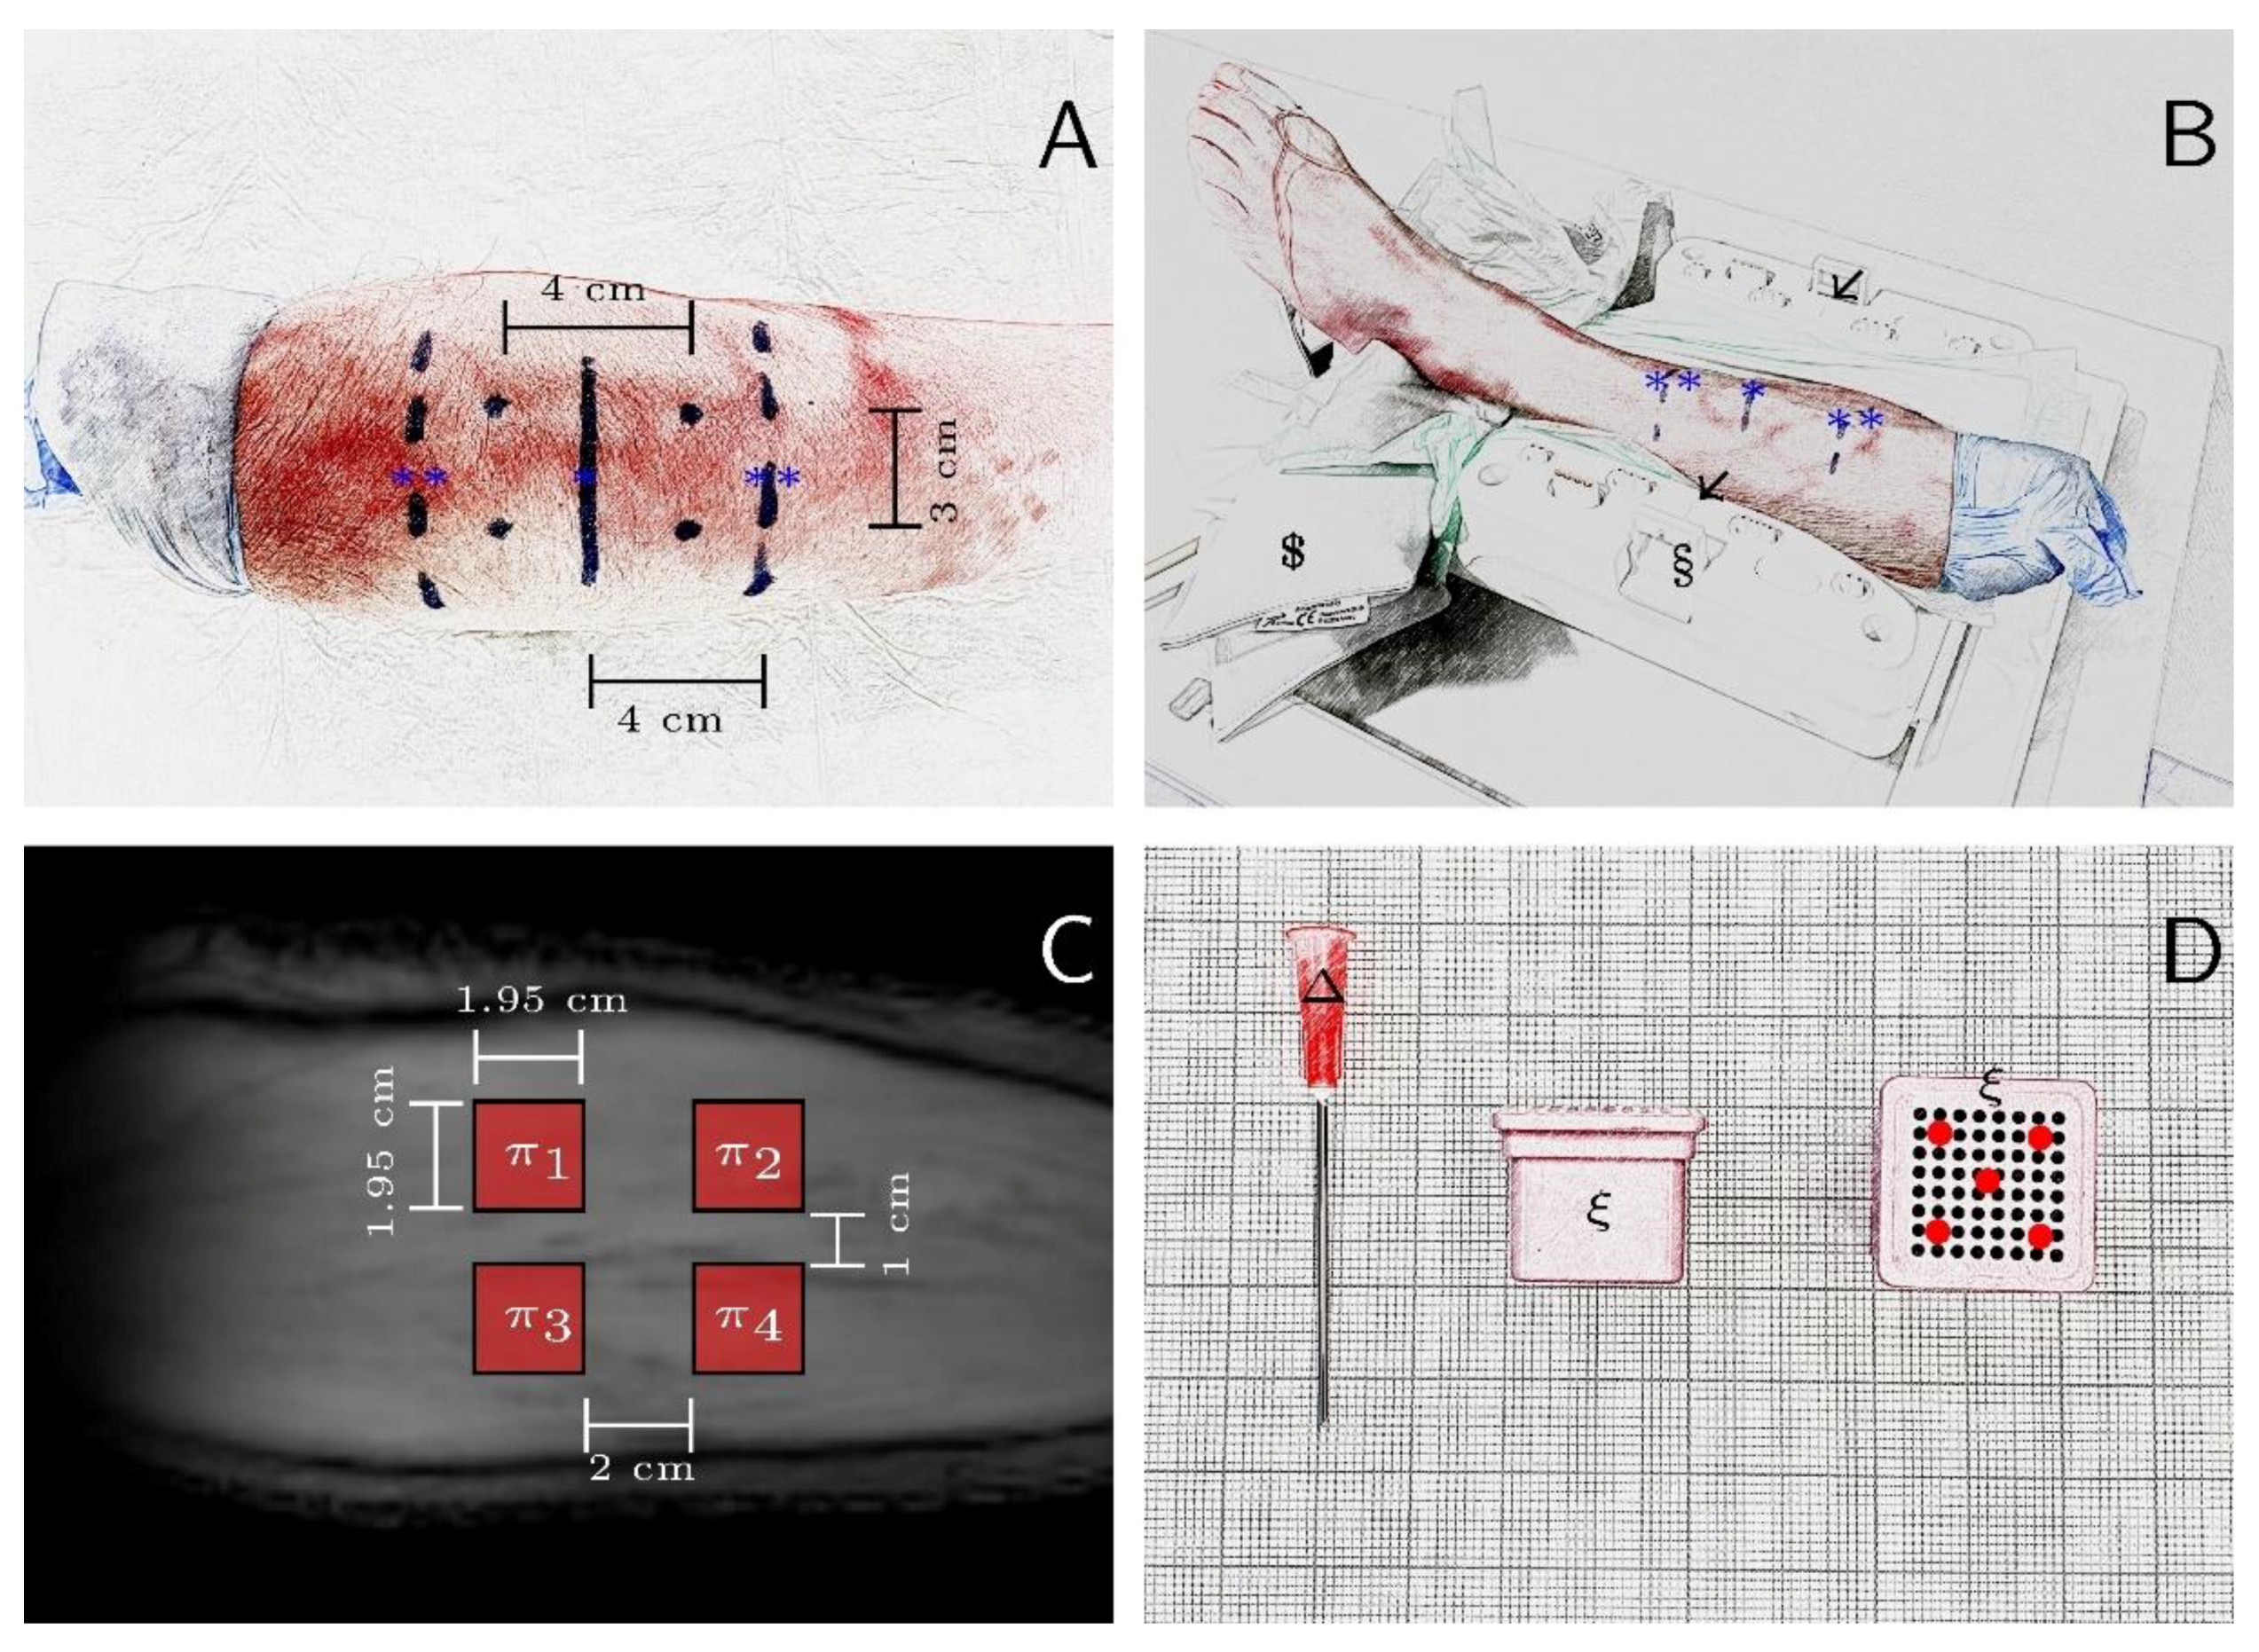
2.4. In Vitro Study
2.5. In Situ Study
2.6. In Vivo Study
2.7. MR Image Analysis
2.8. Statistical Analyses
3. Results
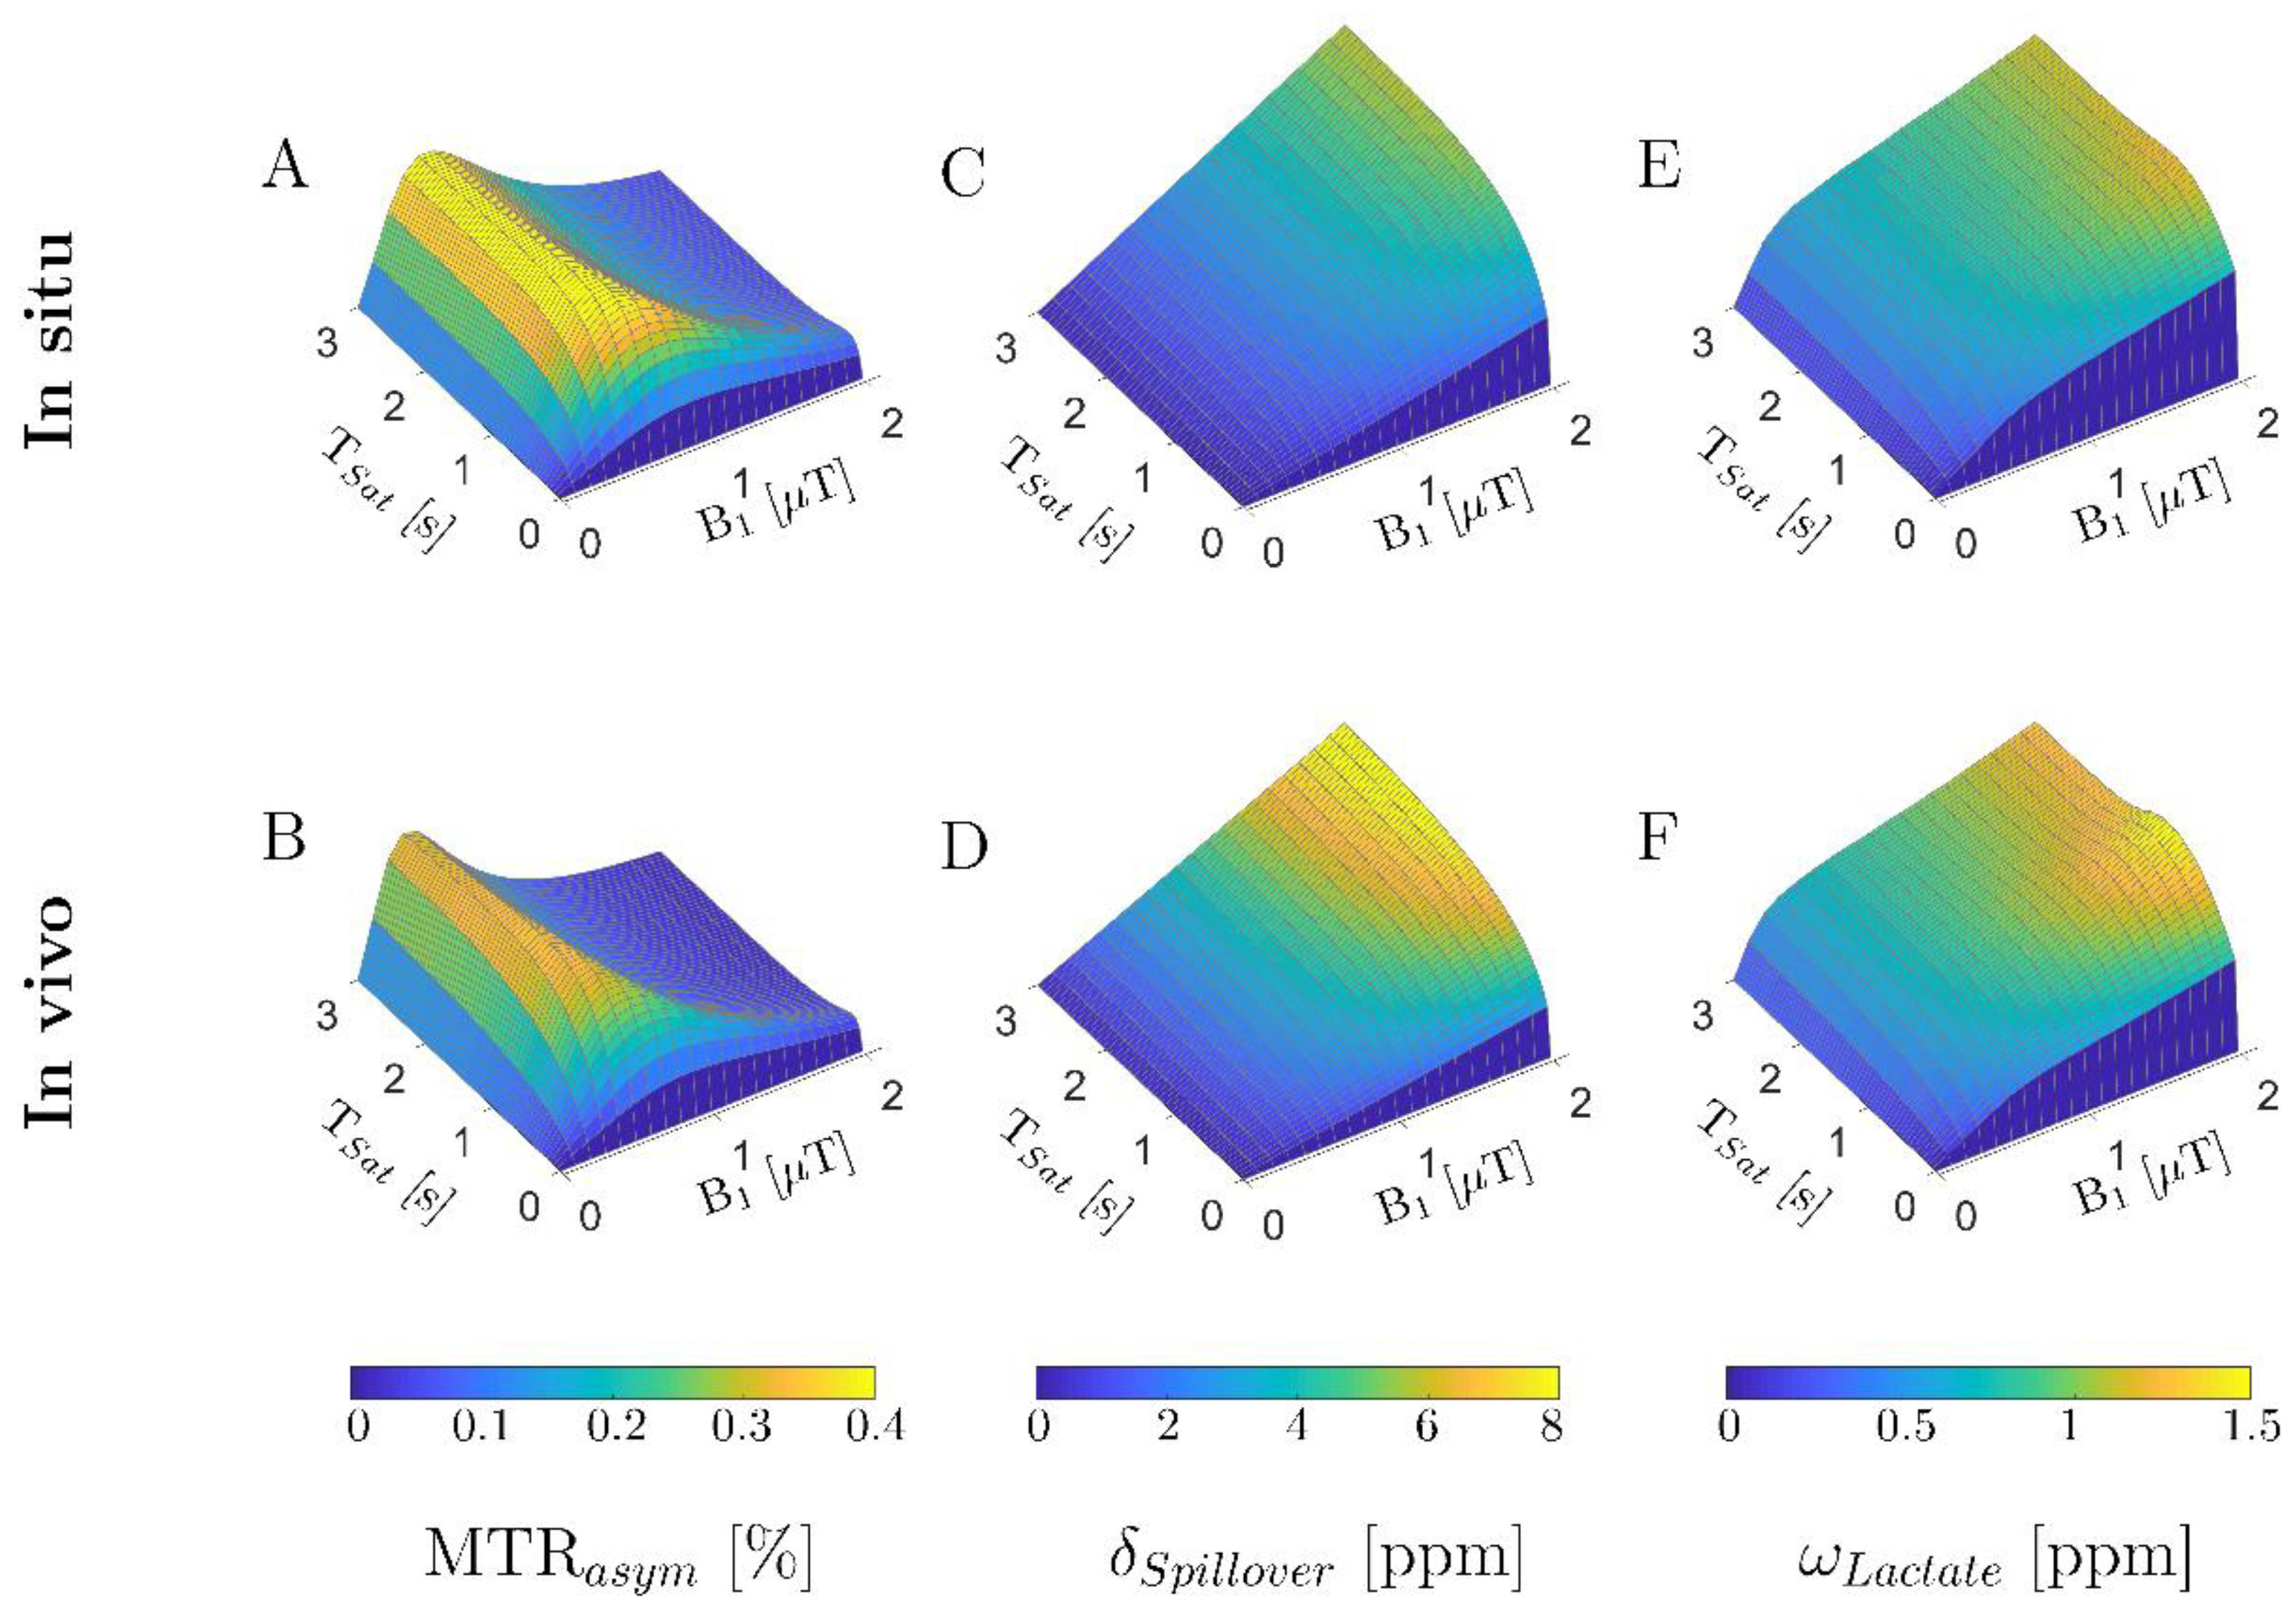
3.1. In Silico Study: Numerical Sequence Optimization
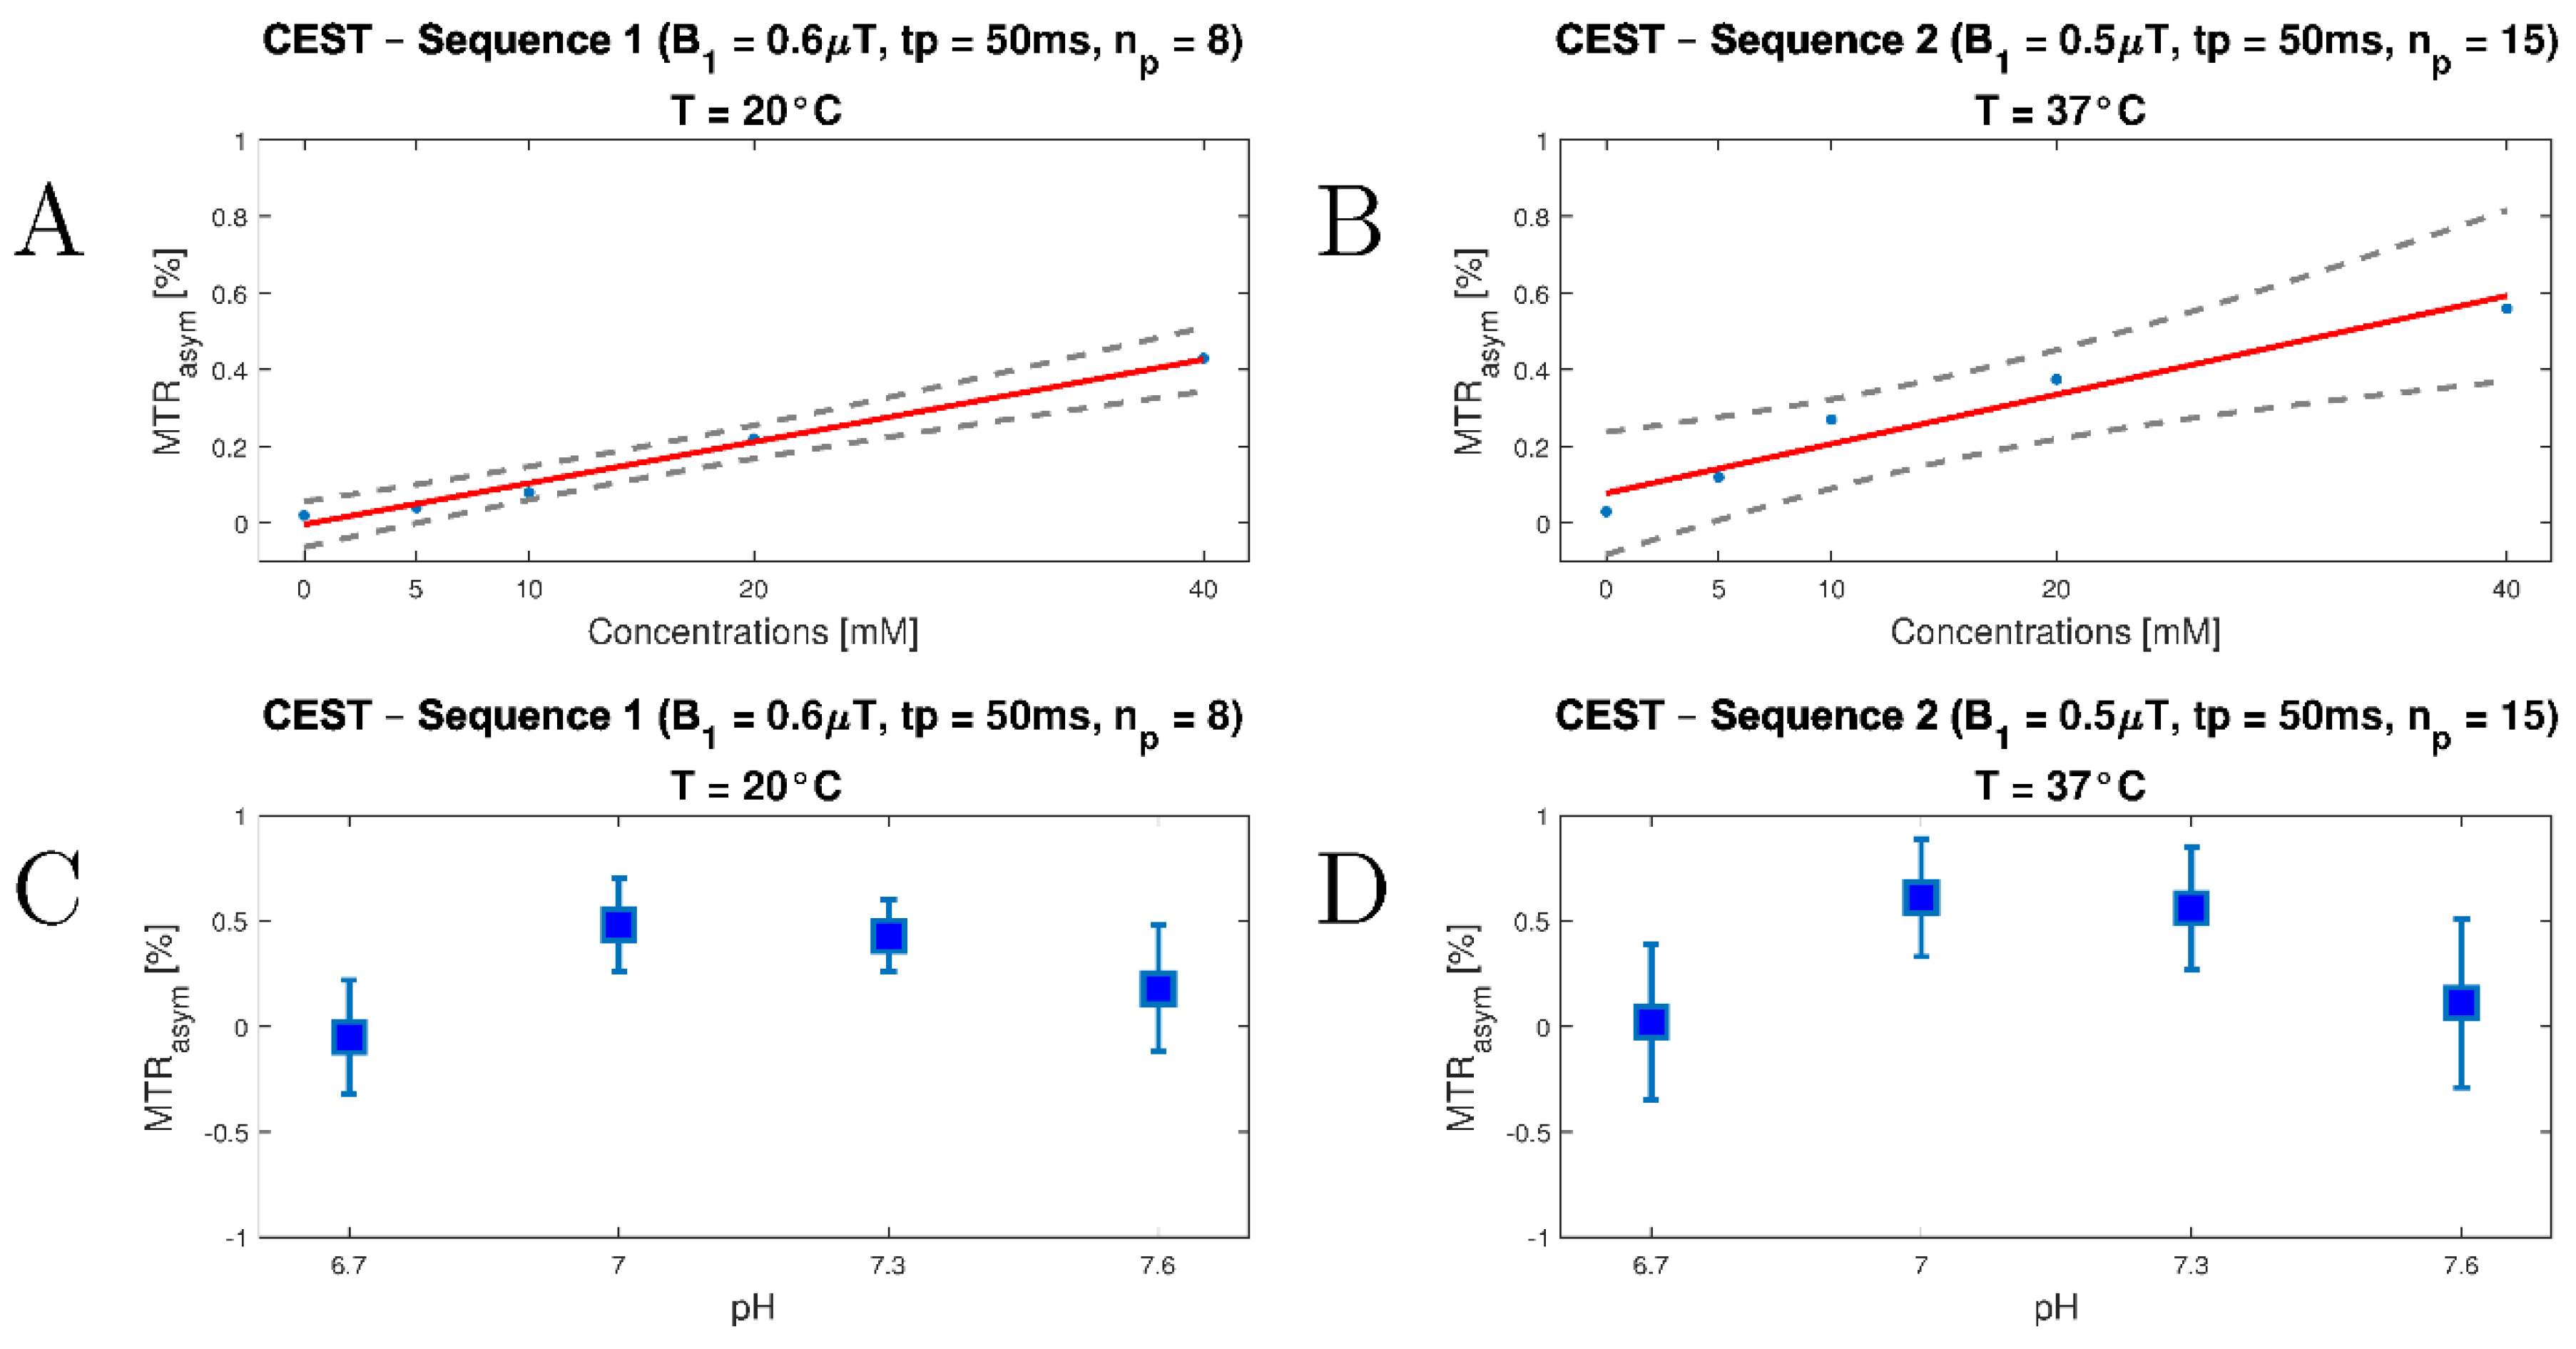
3.2. In Vitro Study
3.3. In Situ Study
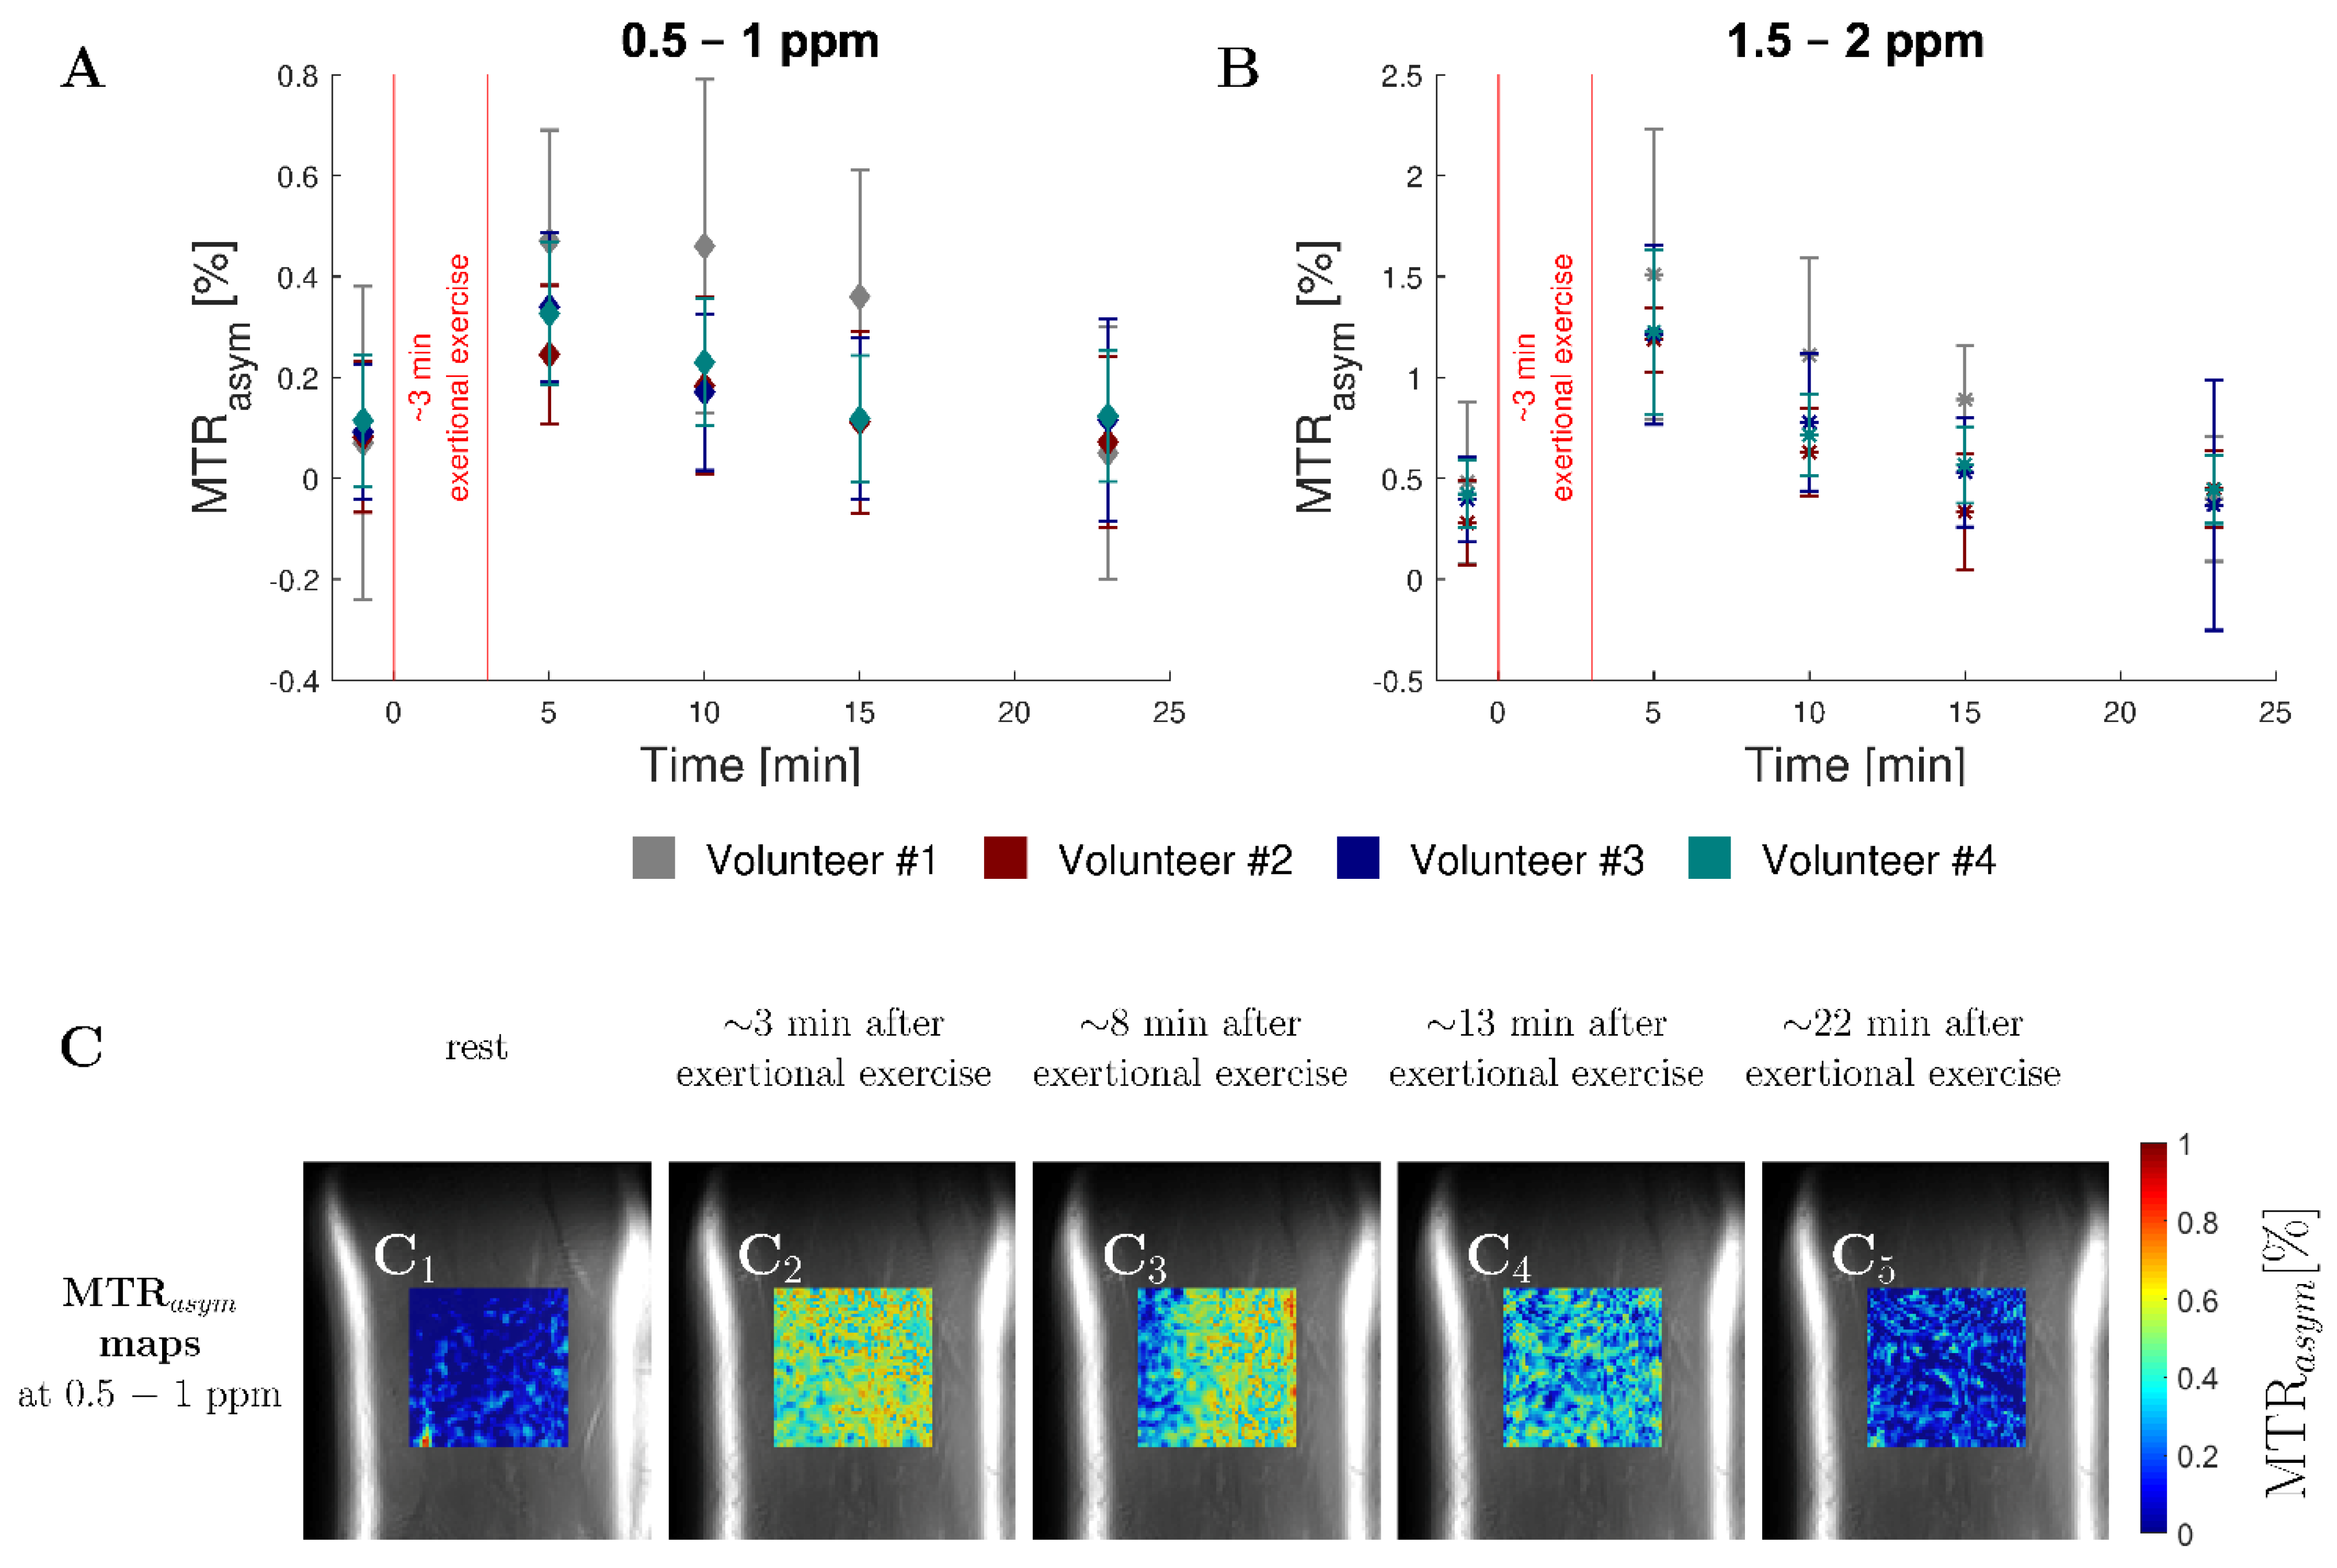
3.4. In Vivo Study
4. Discussion
5. Conclusions
Supplementary Materials
Author Contributions
Funding
Institutional Review Board Statement
Informed Consent Statement
Data Availability Statement
Acknowledgments
Conflicts of Interest
References
- Okorie, O.N.; Dellinger, P. Lactate: Biomarker And Potential Therapeutic Target. Crit. Care Clin. 2011, 27, 299–326. [Google Scholar] [CrossRef] [PubMed]
- Liberti, M.V.; Locasale, J.W. The Warburg Effect: How Does It Benefit Cancer Cells? Trends Biochem. Sci. 2016, 41, 211–218. [Google Scholar] [CrossRef] [PubMed] [Green Version]
- Brizel, D.M.; Schroeder, T.; Scher, R.L.; Walenta, S.; Clough, R.W.; Dewhirst, M.W.; Mueller-Klieser, W. Elevated Tumor Lactate Concentrations Predict For An Increased Risk Of Metastases In Head-And-Neck Cancer. Int. J. Radiat. Oncol. Biol. Phys. 2001, 51, 349–353. [Google Scholar] [CrossRef]
- Bosso, G.; Mercurio, V.; Diab, N.; Pagano, A.; Porta, G.; Allegorico, E.; Serra, C.; Guiotto, G.; Numis, F.G.; Tocchetti, C.G.; et al. Time-Weighted Lactate As A Predictor Of Adverse Outcome In Acute Heart Failure. ESC Heart Fail. 2021, 8, 539–545. [Google Scholar] [CrossRef] [PubMed]
- Gizak, A.; Mccubrey, J.A.; Rakus, D. Cell-To-Cell Lactate Shuttle Operates In Heart And Is Important In Age-Related Heart Failure. Aging 2020, 12, 3388–3406. [Google Scholar] [CrossRef]
- Salpeter, S.R.; Greyber, E.; Pasternak, G.A.; Salpeter, E.E. Risk Of Fatal And Nonfatal Lactic Acidosis With Metformin Use In Type 2 Diabetes Mellitus. In Cochrane Database Of Systematic Reviews; Salpeter, S.R., Ed.; John Wiley & Sons, Ltd.: Chichester, UK, 1996. [Google Scholar]
- Wu, Y.; Dong, Y.; Atefi, M.; Liu, Y.; Elshimali, Y.; Vadgama, J.V. Lactate, A Neglected Factor For Diabetes And Cancer Interaction. Mediat. Inflamm. 2016, 2016, 6456018. [Google Scholar] [CrossRef] [Green Version]
- Lichtenauer, M.; Wernly, B.; Ohnewein, B.; Franz, M.; Kabisch, B.; Muessig, J.; Masyuk, M.; Lauten, A.; Schulze, P.C.; Hoppe, U.C.; et al. The Lactate/Albumin Ratio: A Valuable Tool For Risk Stratification In Septic Patients Admitted To Icu. Int. J. Mol. Sci. 2017, 18, 1893. [Google Scholar] [CrossRef] [Green Version]
- Nolt, B.; Tu, F.; Wang, X.; Ha, T.; Winter, R.; Williams, D.L.; Li, C. Lactate and immunosuppression in Sepsis. Shock 2018, 49, 120–125. [Google Scholar] [CrossRef]
- Bertolucci, F.; Neri, R.; Dalise, S.; Venturi, M.; Rossi, B.; Chisari, C. Abnormal Lactate Levels In Patients With Polymyositis And Dermatomyositis: The Benefits Of A Specific Rehabilitative Program. Eur. J. Phys. Rehabil. Med. 2014, 50, 161–169. [Google Scholar]
- Vafai, S.B.; Mootha, V.K. Mitochondrial Disorders As Windows Into An Ancient Organelle. Nature 2012, 491, 374–383. [Google Scholar] [CrossRef]
- Lake, N.J.; Bird, M.J.; Isohanni, P.; Paetau, A. Leigh Syndrome: Neuropathology And Pathogenesis. J. Neuropathol. Exp. Neurol. 2015, 74, 482–492. [Google Scholar] [CrossRef] [PubMed] [Green Version]
- Brouns, R.; Sheorajpanday, R.; Wauters, A.; De Surgeloose, D.; Mariën, P.; De Deyn, P.P. Evaluation Of Lactate As A Marker Of Metabolic Stress And Cause Of Secondary Damage In Acute Ischemic Stroke Or Tia. Clin. Chim. Acta 2008, 397, 27–31. [Google Scholar] [CrossRef] [PubMed]
- Lee, J.-I.; Wittsack, H.-J.; Christaras, A.; Miese, F.R.; Siebler, M. Normalization Of Brain Tissue Lactate After Hyperbaric Oxygen Therapy In A Progressive Stroke Patient. Cereb. Dis. 2008, 26, 447–448. [Google Scholar] [CrossRef]
- Hoogeveen, A.R.; Hoogsteen, J.; Schep, G. The maximal lactate steady state in elite endurance athletes. Jpn. J. Physiol. 1997, 47, 481–485. [Google Scholar] [CrossRef]
- Debrosse, C.; Nanga, R.P.R.; Bagga, P.; Nath, K.; Haris, M.; Marincola, F.; Schnall, M.D.; Hariharan, H.; Reddy, R. Lactate chemical exchange saturation transfer (latest) imaging in vivo a biomarker for ldh activity. Sci. Rep. 2016, 6, 19517. [Google Scholar] [CrossRef] [Green Version]
- Gorman, G.S.; Chinnery, P.F.; Dimauro, S.; Hirano, M.; Koga, Y.; Mcfarland, R.; Suomalainen, A.; Thorburn, D.R.; Zeviani, M.; Turnbull, D.M. Mitochondrial diseases. Nat. Rev. Dis. Primers 2016, 2, 16080. [Google Scholar] [CrossRef]
- Singer, M.; Deutschman, C.S.; Seymour, C.W.; Shankar-Hari, M.; Annane, D.; Bauer, M.; Bellomo, R.; Bernard, G.R.; Chiche, J.-D.; Coopersmith, C.M.; et al. The third international consensus definitions for sepsis and septic shock (Sepsis-3). Jama 2016, 315, 801–810. [Google Scholar] [CrossRef]
- Camara-Lemarroy, C.R.; Escobedo-Zúñiga, N.; La Guzmán-De Garza, F.J.; Castro-Garza, J.; Vargas-Villarreal, J.; Góngora-Rivera, F. D-Lactate and intestinal fatty acid-binding protein are elevated in serum in patients with acute ischemic stroke. Acta Neurol. Belg. 2021, 121, 87–93. [Google Scholar] [CrossRef]
- Ran, J.; Yin, C.; Liu, C.; Li, Y.; Hou, B.; Morelli, J.N.; Dai, B.; Li, X. The diagnostic value of mr ivim and t2 mapping in differentiating autoimmune myositis from muscular dystrophy. Acad. Radiol. 2021, 28, E182–E188. [Google Scholar] [CrossRef]
- Da José Rocha, A.; Túlio Braga, F.; Carlos Martins Maia, A.; Da Jorge Silva, C.; Toyama, C.; Pereira Pinto Gama, H.; Kok, F.; Rodrigues Gomes, H. Lactate detection by mrs in mitochondrial encephalopathy: Optimization of technical parameters. J. Neuroimaging 2008, 18, 1–8. [Google Scholar] [CrossRef]
- Lunsing, R.J.; Strating, K.; De Koning, T.J.; Sijens, P.E. Diagnostic value of mrs-quantified brain tissue lactate level in identifying children with mitochondrial disorders. Eur. Radiol. 2017, 27, 976–984. [Google Scholar] [CrossRef] [PubMed] [Green Version]
- Golman, K.; Zandt, R.I.; Lerche, M.; Pehrson, R.; Ardenkjaer-Larsen, J.H. Metabolic imaging by hyperpolarized 13c magnetic resonance imaging for in vivo tumor diagnosis. Cancer Res. 2006, 66, 10855–10860. [Google Scholar] [CrossRef] [PubMed] [Green Version]
- Golman, K.; Zandt, R.I.T.; Thaning, M. Real-time metabolic imaging. Proc. Natl. Acad. Sci. USA 2006, 103, 11270–11275. [Google Scholar] [CrossRef] [Green Version]
- Rao, Y.; Gammon, S.; Zacharias, N.M.; Liu, T.; Salzillo, T.; Xi, Y.; Wang, J.; Bhattacharya, P.; Piwnica-Worms, D. Hyperpolarized 1-13cpyruvate-To-1-13clactate conversion is rate-limited by monocarboxylate transporter-1 in the plasma membrane. Proc. Natl. Acad. Sci. USA 2020, 117, 22378–22389. [Google Scholar] [CrossRef] [PubMed]
- Goldenberg, J.M.; Pagel, M.D. Assessments of tumor metabolism with cest mri. NMR Biomed. 2019, 32, E3943. [Google Scholar] [CrossRef] [PubMed]
- Lenich, T.; Pampel, A.; Mildner, T.; Möller, H.E. A new approach to z-spectrum acquisition: Prospective baseline enhancement (probe) for cest/nuclear overhauser effect. Magn. Reson. Med. 2019, 81, 2315–2329. [Google Scholar] [CrossRef]
- Zhang, X.-Y.; Xie, J.; Wang, F.; Lin, E.C.; Xu, J.; Gochberg, D.F.; Gore, J.C.; Zu, Z. Assignment of the molecular origins of cest signals at 2 ppm in rat brain. Magn. Reson. Med. 2017, 78, 881–887. [Google Scholar] [CrossRef]
- Wollschläger, L.M.; Nebelung, S.; Schleich, C.; Müller-Lutz, A.; Radke, K.L.; Frenken, M.; Boschheidgen, M.; Prost, M.; Antoch, G.; Konieczny, M.R.; et al. Evaluating lumbar intervertebral disc degeneration on a compositional level using chemical exchange saturation transfer: Preliminary results in patients with adolescent idiopathic scoliosis. Diagnostics 2021, 11, 934. [Google Scholar] [CrossRef]
- Müller-Lutz, A.; Schleich, C.; Pentang, G.; Schmitt, B.; Lanzman, R.S.; Matuschke, F.; Wittsack, H.-J.; Miese, F. Age-Dependency of Glycosaminoglycan Content in Lumbar Discs: A 3t Gagcest Study. J. Magn. Reson. Imaging JMRI 2015, 42, 1517–1523. [Google Scholar] [CrossRef]
- Abrar, D.B.; Schleich, C.; Radke, K.L.; Frenken, M.; Stabinska, J.; Ljimani, A.; Wittsack, H.-J.; Antoch, G.; Bittersohl, B.; Hesper, T.; et al. Detection of early cartilage degeneration in the tibiotalar joint using 3 t gagcest imaging: A feasibility study. Magn. Reson. Mater. Phy. 2021, 34, 249–260. [Google Scholar] [CrossRef]
- Frenken, M.; Schleich, C.; Radke, K.L.; Müller-Lutz, A.; Benedikter, C.; Franz, A.; Antoch, G.; Bittersohl, B.; Abrar, D.B.; Nebelung, S. Imaging of exercise-induced spinal remodeling in elite rowers. J. Sci. Med. Sport 2021, 25, 75–80. [Google Scholar] [CrossRef] [PubMed]
- Nebelung, S.; Dötsch, L.; Shah, D.; Abrar, D.B.; Linka, K.; Knobe, M.; Sewerin, P.; Thüring, J.; Kuhl, C.; Truhn, D. Functional mri mapping of human meniscus functionality and its relation to degeneration. Sci. Rep. 2020, 10, 2499. [Google Scholar] [CrossRef] [PubMed]
- Müller-Lutz, A.; Kamp, B.; Nagel, A.M.; Ljimani, A.; Abrar, D.; Schleich, C.; Wollschläger, L.; Nebelung, S.; Wittsack, H.-J. Sodium mri of human articular cartilage of the wrist: A feasibility study on a clinical 3t mri scanner. Magn. Reson. Mater. Phy. 2021, 34, 241–248. [Google Scholar] [CrossRef]
- Thiel, T.A.; Schweitzer, J.; Xia, T.; Bechler, E.; Valentin, B.; Steuwe, A.; Boege, F.; Westenfeld, R.; Wittsack, H.-J.; Ljimani, A. Evaluation of radiographic contrast-induced nephropathy by functional diffusion weighted imaging. J. Clin. Med. 2021, 10, 4573. [Google Scholar] [CrossRef] [PubMed]
- Abergel, D.; Palmer, A.G. Approximate solutions of the bloch-mcconnell equations for two-site chemical exchange. Chemphyschem 2004, 5, 787–793. [Google Scholar] [CrossRef] [PubMed]
- Zaiss, M.; Zu, Z.; Xu, J.; Schuenke, P.; Gochberg, D.F.; Gore, J.C.; Ladd, M.E.; Bachert, P. A Combined analytical solution for chemical exchange saturation transfer and semi-solid magnetization transfer. NMR Biomed. 2015, 28, 217–230. [Google Scholar] [CrossRef]
- Stabinska, J.; Cronenberg, T.; Wittsack, H.-J.; Lanzman, R.S.; Müller-Lutz, A. Quantitative pulsed cest-mri at a clinical 3t mri system. Magn. Reson. Mater. Phys. 2017, 30, 505–516. [Google Scholar] [CrossRef]
- Zaiss, M.; Angelovski, G.; Demetriou, E.; Mcmahon, M.T.; Golay, X.; Scheffler, K. quesp and quest revisited-fast and accurate quantitative cest experiments. Magn. Reson. Med. 2018, 79, 1708–1721. [Google Scholar] [CrossRef]
- Madan, A.; Ganji, S.K.; An, Z.; Choe, K.S.; Pinho, M.C.; Bachoo, R.M.; Maher, E.M.; Choi, C. Proton T2 measurement and quantification of lactate in brain tumors by mrs at 3 tesla in vivo. Magn. Reson. Med. 2015, 73, 2094–2099. [Google Scholar] [CrossRef] [Green Version]
- Street, D.; Bangsbo, J.; Juel, C. Interstitial ph in human skeletal muscle during and after dynamic graded exercise. J. Physiol. 2001, 537, 993–998. [Google Scholar] [CrossRef]
- Guizar-Sicairos, M.; Thurman, S.T.; Fienup, J.R. Efficient subpixel image registration algorithms. Opt. Lett. 2008, 33, 156–158. [Google Scholar] [CrossRef] [PubMed] [Green Version]
- Ng, M.-C.; Hua, J.; Hu, Y.; Luk, K.D.; Lam, E.Y. magnetization transfer (mt) asymmetry around the water resonance in human cervical spinal cord. J. Magn. Reson. Imaging 2009, 29, 523–528. [Google Scholar] [CrossRef] [PubMed] [Green Version]
- R Core Team. R: A Language and Environment For Statistical Computing. 2017. Available online: Https://Www.R-Project.Org/ (accessed on 20 November 2021).
- Giraudoux, P. Pgirmess: Spatial Analysis and Data Mining for Field Ecologists. 2021. Available online: Https://Cran.R-Project.Org/Package=Pgirmess (accessed on 20 November 2021).
- Revelle, W. Psych: Procedures for Psychological, Psychometric, and Personality Research: Evanston, Illinois. 2021. Available online: Https://Cran.R-Project.Org/Package=Psych (accessed on 20 November 2021).
- Kassambara, A. Ggpubr: ‘Ggplot2’ Based Publication Ready Plots. 2020. Available online: Https://Cran.R-Project.Org/Package=Ggpubr (accessed on 20 November 2021).
- Holm, S. A Simple Sequentially Rejective Multiple Test Procedure. Scand. J. Stat. 1979, 6, 65–70. [Google Scholar]
- Cohen, S.; Kamarck, T.; Mermelstein, R. A Global Measure Of Perceived Stress. J. Health Soc. Behav. 1983, 24, 385. [Google Scholar] [CrossRef]
- Guermazi, A.; Alizai, H.; Crema, M.D.; Trattnig, S.; Regatte, R.R.; Roemer, F.W. Compositional mri techniques for evaluation of cartilage degeneration in osteoarthritis. Osteoarthr. Cartil. 2015, 23, 1639–1653. [Google Scholar] [CrossRef] [Green Version]
- Zaiss, M.; Anemone, A.; Goerke, S.; Longo, D.L.; Herz, K.; Pohmann, R.; Aime, S.; Rivlin, M.; Navon, G.; Golay, X.; et al. Quantification of hydroxyl exchange of d-glucose at physiological conditions for optimization of glucocest mri at 3, 7 and 9.4 tesla. NMR Biomed. 2019, 32, E4113. [Google Scholar] [CrossRef] [Green Version]
- Wang, Z.; Collins, C.M. Effect of rf pulse sequence on temperature elevation for a given time-average sar. Concepts Magn. Reson. Part Magn. Reson. Eng. 2010, 37, 215–219. [Google Scholar] [CrossRef] [Green Version]
- Zaiss, M.; Xu, J.; Goerke, S.; Khan, I.S.; Singer, R.J.; Gore, J.C.; Gochberg, D.F.; Bachert, P. Inverse Z-Spectrum analysis for spillover-, mt-, and t1 -corrected steady-state pulsed cest-mri--application to ph-weighted mri of acute stroke. NMR Biomed. 2014, 27, 240–252. [Google Scholar] [CrossRef] [Green Version]
- Villano, D.; Romdhane, F.; Irrera, P.; Consolino, L.; Anemone, A.; Zaiss, M.; Dastrù, W.; Longo, D.L. A fast multislice sequence for 3d mri-cest ph imaging. Magn. Reson. Med. 2021, 85, 1335–1349. [Google Scholar] [CrossRef]
- Gaitanos, G.C.; Williams, C.; Boobis, L.H.; Brooks, S. Human muscle metabolism during intermittent maximal exercise. J. Appl. Physiol. 1993, 75, 712–719. [Google Scholar] [CrossRef] [Green Version]
- Goodwin, M.L.; Harris, J.E.; Hernández, A.; Gladden, L.B. Blood lactate measurements and analysis during exercise: A guide for clinicians. J. Diabetes Sci. Technol. 2007, 1, 558–569. [Google Scholar] [PubMed] [Green Version]


| Coronal | Sagittal | T1 | T2 | LATEST- CEST | LATEST- CEST | WASSR d | |
|---|---|---|---|---|---|---|---|
| T2w TSE | T1w TSE | Mapping a | Mapping | In Situ b | In Vivo c | ||
| Orientation | cor | sag | cor | cor | cor | cor | cor |
| TE (ms) | 78 | 11 | 10 | e | 5.76 | 5.76 | 5.76 |
| TR (ms) | 4720 | 650 | 6000 | 856 | 11 | 11 | 11 |
| Flip Angle (°) | 150 | 150 | 180 | 180 | 10 | 10 | 10 |
| Slices | 30 | 25 | 1 | 1 | 1 | 1 | 1 |
| Slice Thickness (mm) | 3 | 3 | 6 | 6 | 6 | 6 | 6 |
| FoV (mm × mm) | 160 × 160 | 320 × 320 | 160 × 160 | 160 × 160 | 160 × 160 | 160 × 160 | 160 × 160 |
| Image matrix (pixels) | 512 × 512 | 704 × 704 | 128 × 128 | 128 × 128 | 128 × 128 | 128 × 128 | 128 × 128 |
| Pixel Size (mm × mm) | 0.3 × 0.3 | 0.5 × 0.5 | 1.3 × 1.3 | 1.3 × 1.3 | 1.3 × 1.3 | 1.3 × 1.3 | 1.3 × 1.3 |
| Duration (min:s) | 2:12 | 1:54 | 8:38 | 1:02 | 3:37 | 5:07 | 3:41 |
| In Situ Measurements | In Vivo Measurements | |
|---|---|---|
| Pool parameters: | ||
| Exchange rate ksw | 350 Hz | 550 Hz |
| Δω [C3H4O3−] | 0.6 ppm | 0.4 ppm |
| c [H2O] | 88 M | 88 M |
| c [C3H4O3−] | 15 mM | 15 mM |
| T1 [H2O]\T2 [H2O] | 856 ms\69 ms | 1412 ms\50 ms |
| T2 [C3H4O3−] | 240 ms | 240 ms |
| Boundaries: | ||
| B1 | [0; 1.5] µT | |
| tp | [0; 0.6] ms | |
| np | [1; 20] | |
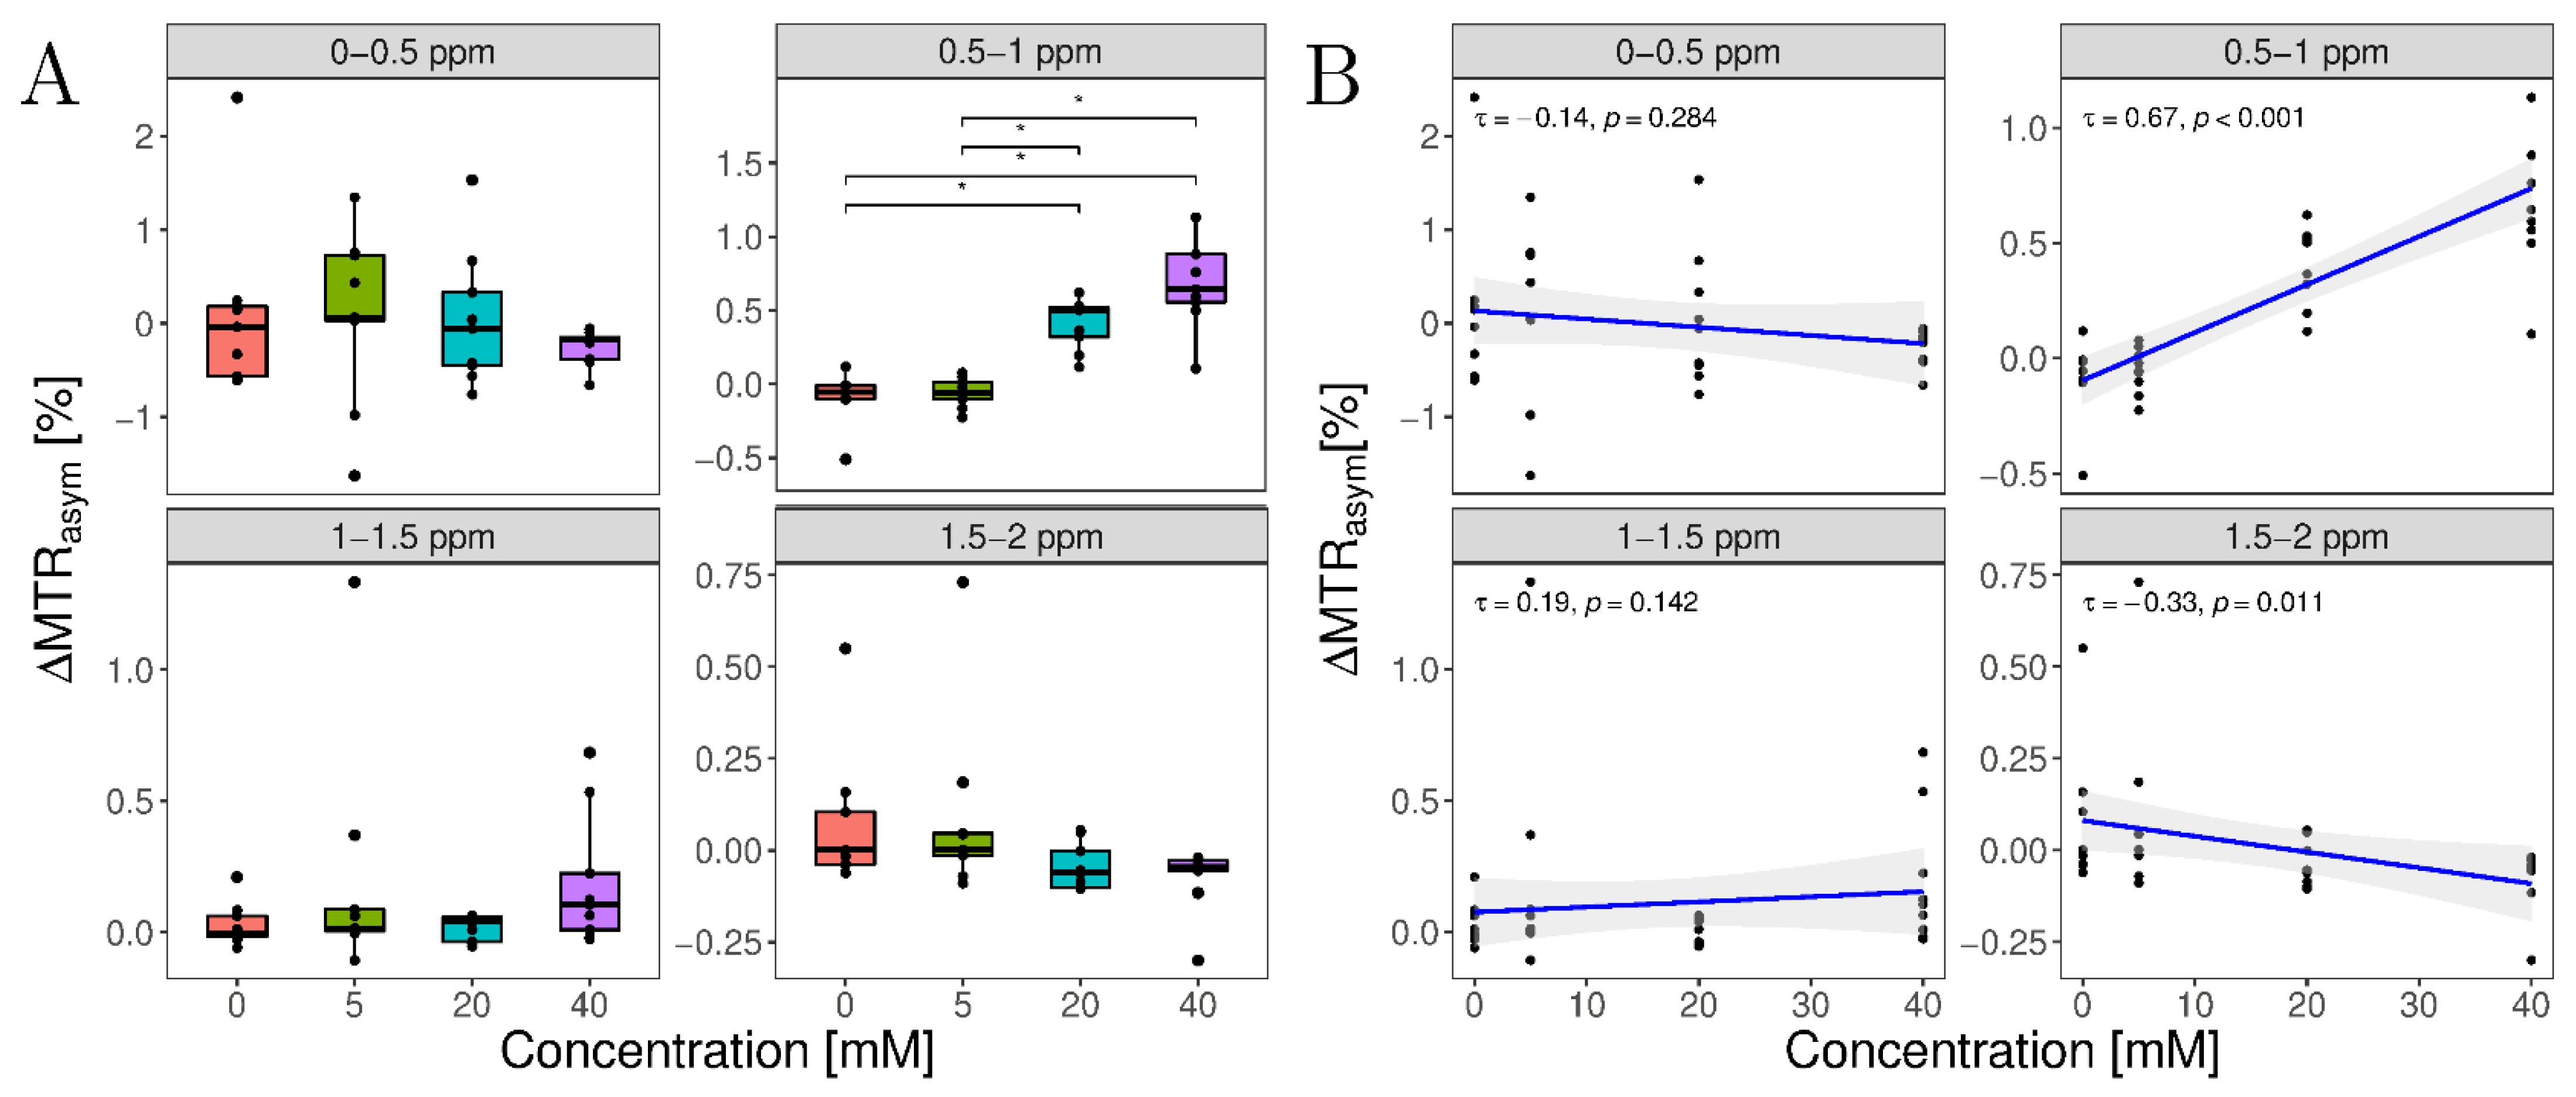
| Concentrations (mM) | ΔMTRasym (%) | |||
|---|---|---|---|---|
| 0–0.5 ppm | 0.5–1 ppm | 1–1.5 ppm | 1.5–2 ppm | |
| 0 | 0.09 ± 0.94 | −0.09 ± 0.17 | 0.03 ± 0.08 | 0.07 ± 0.19 |
| 5 | 0.09 ± 0.91 | −0.05 ± 0.10 | 0.2 ± 0.45 | 0.09 ± 0.25 |
| 20 | 0.04 ± 0.72 | 0.41 ± 0.17 | 0.02 ± 0.05 | −0.05 ± 0.06 |
| 40 | −0.26 ± 0.19 | 0.70 ± 0.32 | 0.19 ± 0.25 | −0.08 ± 0.09 |
| p-value | 0.228 | <0.001 | 0.137 | 0.017 |
Publisher’s Note: MDPI stays neutral with regard to jurisdictional claims in published maps and institutional affiliations. |
© 2022 by the authors. Licensee MDPI, Basel, Switzerland. This article is an open access article distributed under the terms and conditions of the Creative Commons Attribution (CC BY) license (https://creativecommons.org/licenses/by/4.0/).
Share and Cite
Radke, K.L.; Abrar, D.B.; Frenken, M.; Wilms, L.M.; Kamp, B.; Boschheidgen, M.; Liebig, P.; Ljimani, A.; Filler, T.J.; Antoch, G.; et al. Chemical Exchange Saturation Transfer for Lactate-Weighted Imaging at 3 T MRI: Comprehensive In Silico, In Vitro, In Situ, and In Vivo Evaluations. Tomography 2022, 8, 1277-1292. https://doi.org/10.3390/tomography8030106
Radke KL, Abrar DB, Frenken M, Wilms LM, Kamp B, Boschheidgen M, Liebig P, Ljimani A, Filler TJ, Antoch G, et al. Chemical Exchange Saturation Transfer for Lactate-Weighted Imaging at 3 T MRI: Comprehensive In Silico, In Vitro, In Situ, and In Vivo Evaluations. Tomography. 2022; 8(3):1277-1292. https://doi.org/10.3390/tomography8030106
Chicago/Turabian StyleRadke, Karl Ludger, Daniel B. Abrar, Miriam Frenken, Lena Marie Wilms, Benedikt Kamp, Matthias Boschheidgen, Patrick Liebig, Alexandra Ljimani, Timm Joachim Filler, Gerald Antoch, and et al. 2022. "Chemical Exchange Saturation Transfer for Lactate-Weighted Imaging at 3 T MRI: Comprehensive In Silico, In Vitro, In Situ, and In Vivo Evaluations" Tomography 8, no. 3: 1277-1292. https://doi.org/10.3390/tomography8030106
APA StyleRadke, K. L., Abrar, D. B., Frenken, M., Wilms, L. M., Kamp, B., Boschheidgen, M., Liebig, P., Ljimani, A., Filler, T. J., Antoch, G., Nebelung, S., Wittsack, H.-J., & Müller-Lutz, A. (2022). Chemical Exchange Saturation Transfer for Lactate-Weighted Imaging at 3 T MRI: Comprehensive In Silico, In Vitro, In Situ, and In Vivo Evaluations. Tomography, 8(3), 1277-1292. https://doi.org/10.3390/tomography8030106