
On the Mechanical Behaviour of Biomimetic Cornstalk-Inspired Lightweight Structures
 ,
,  ,
,
Abstract
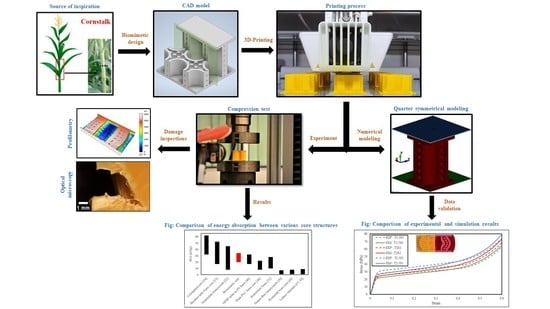
1. Introduction
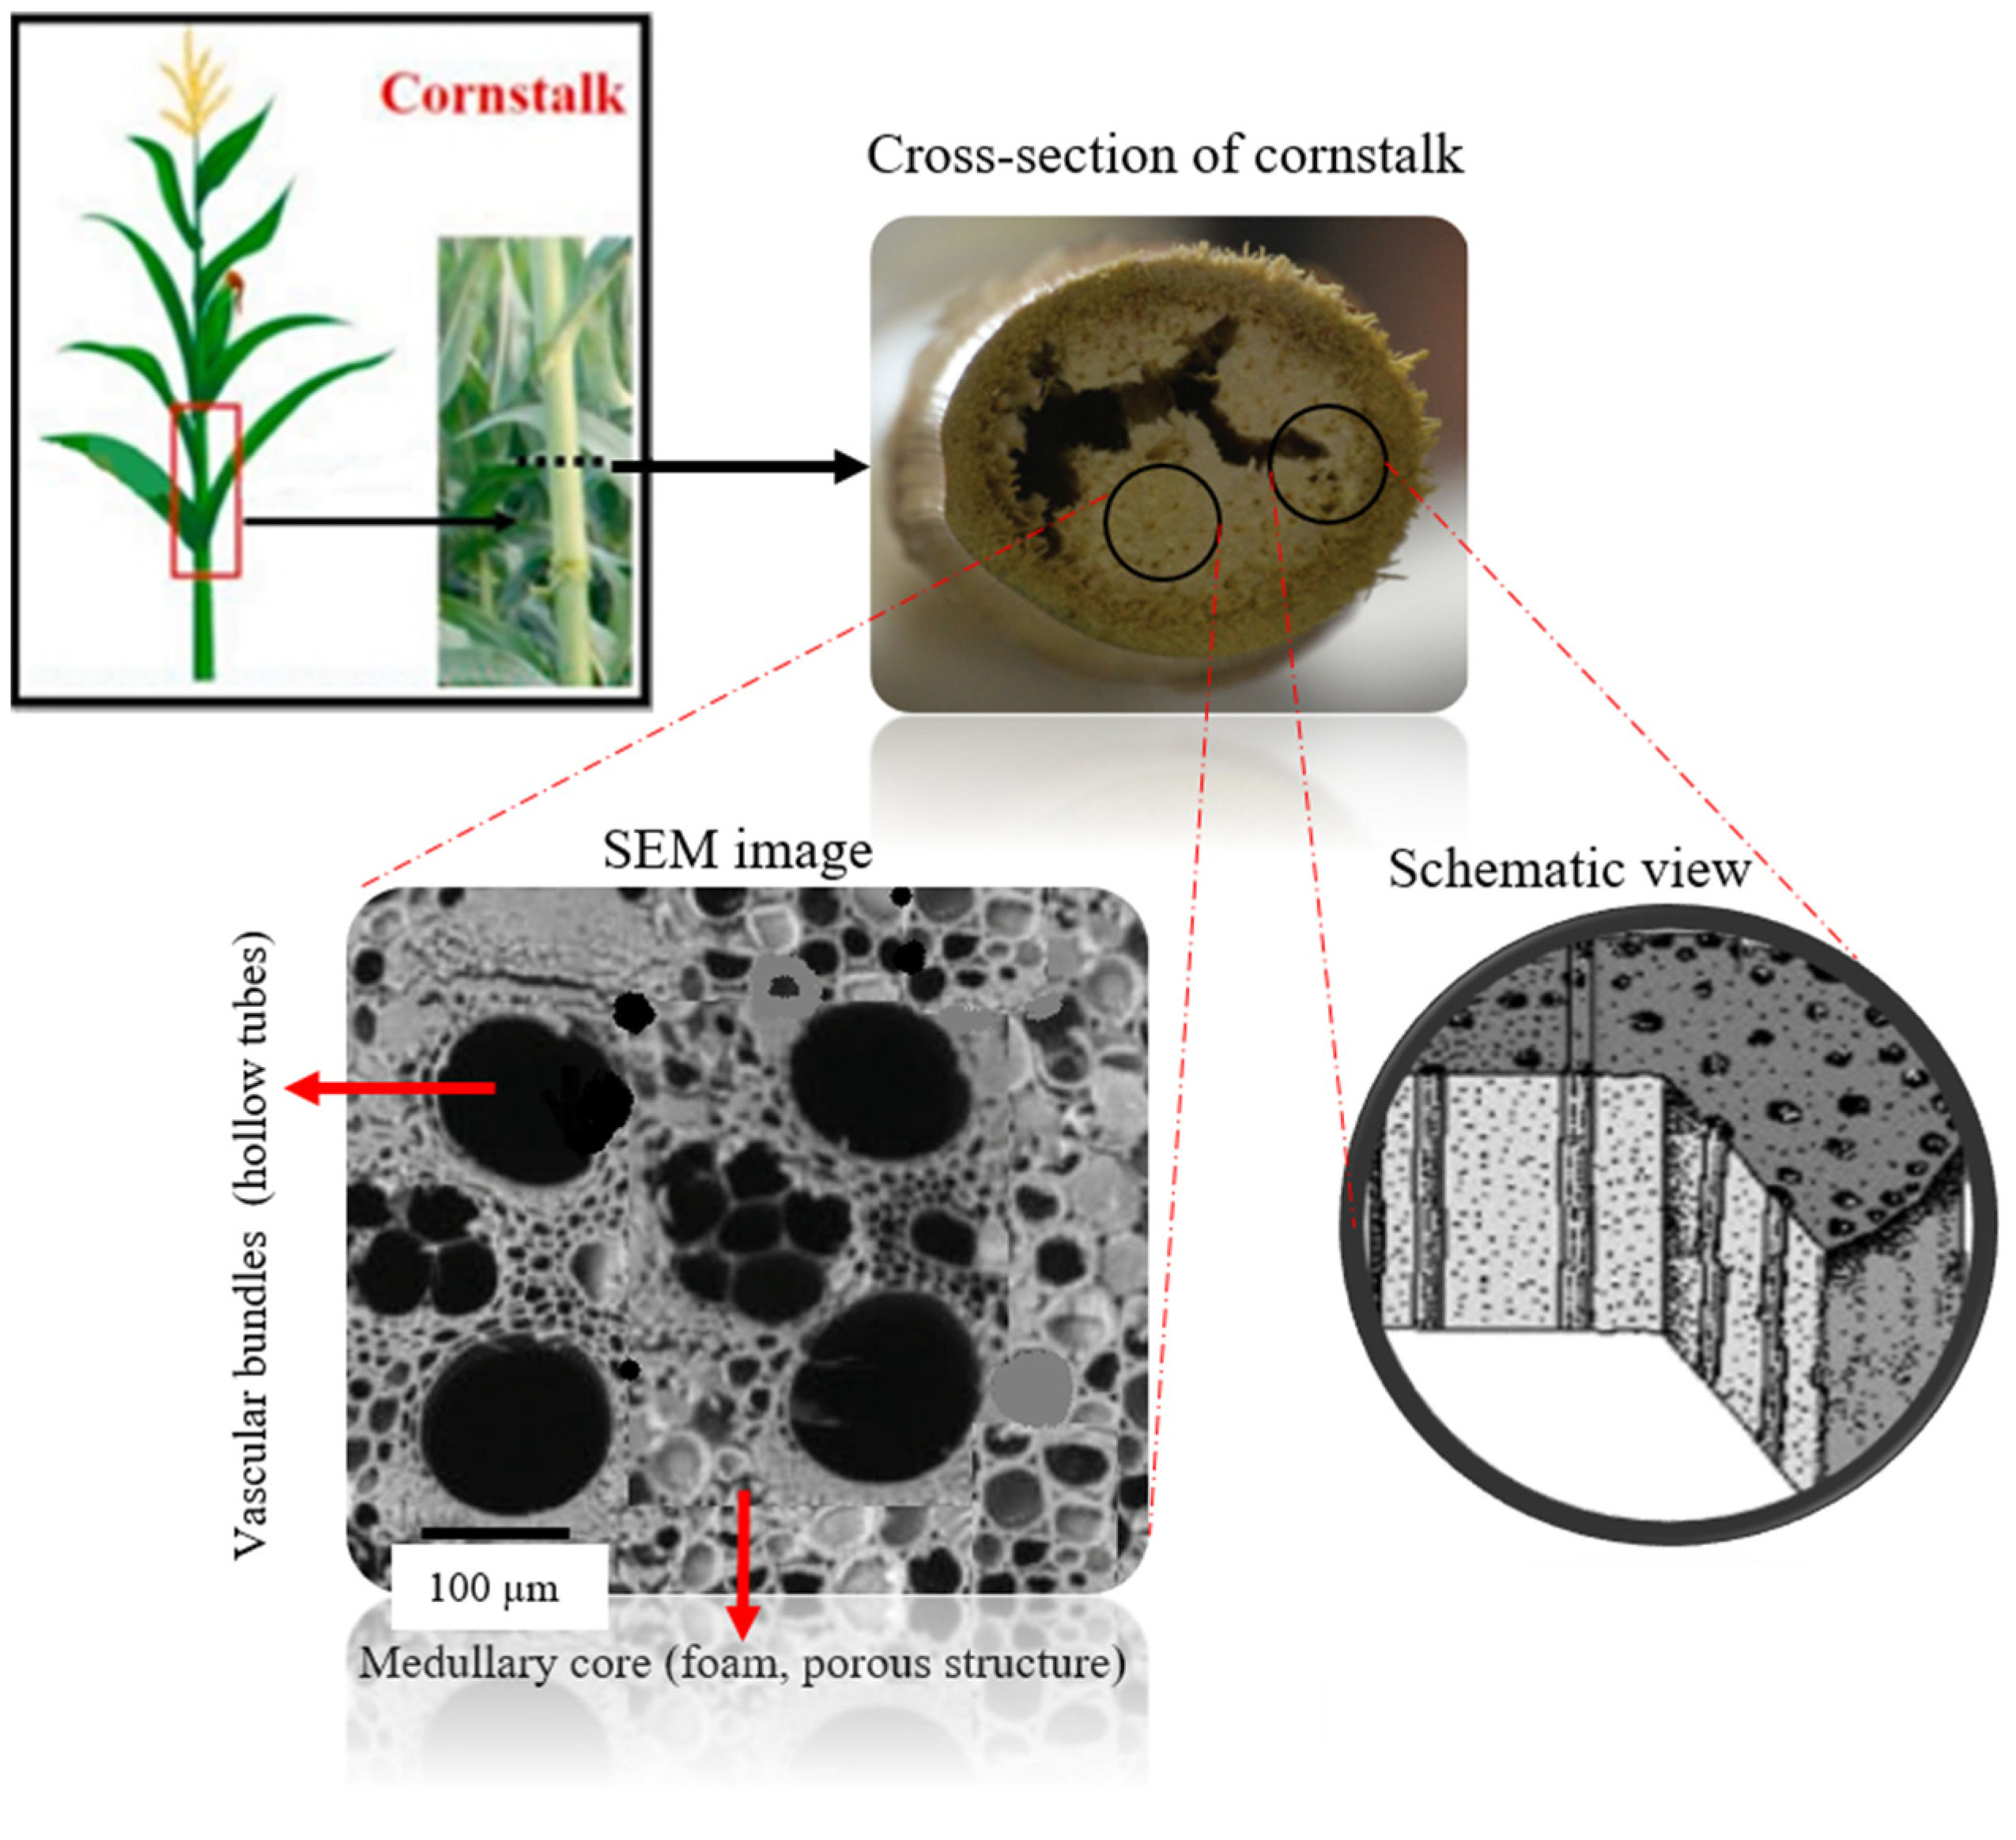
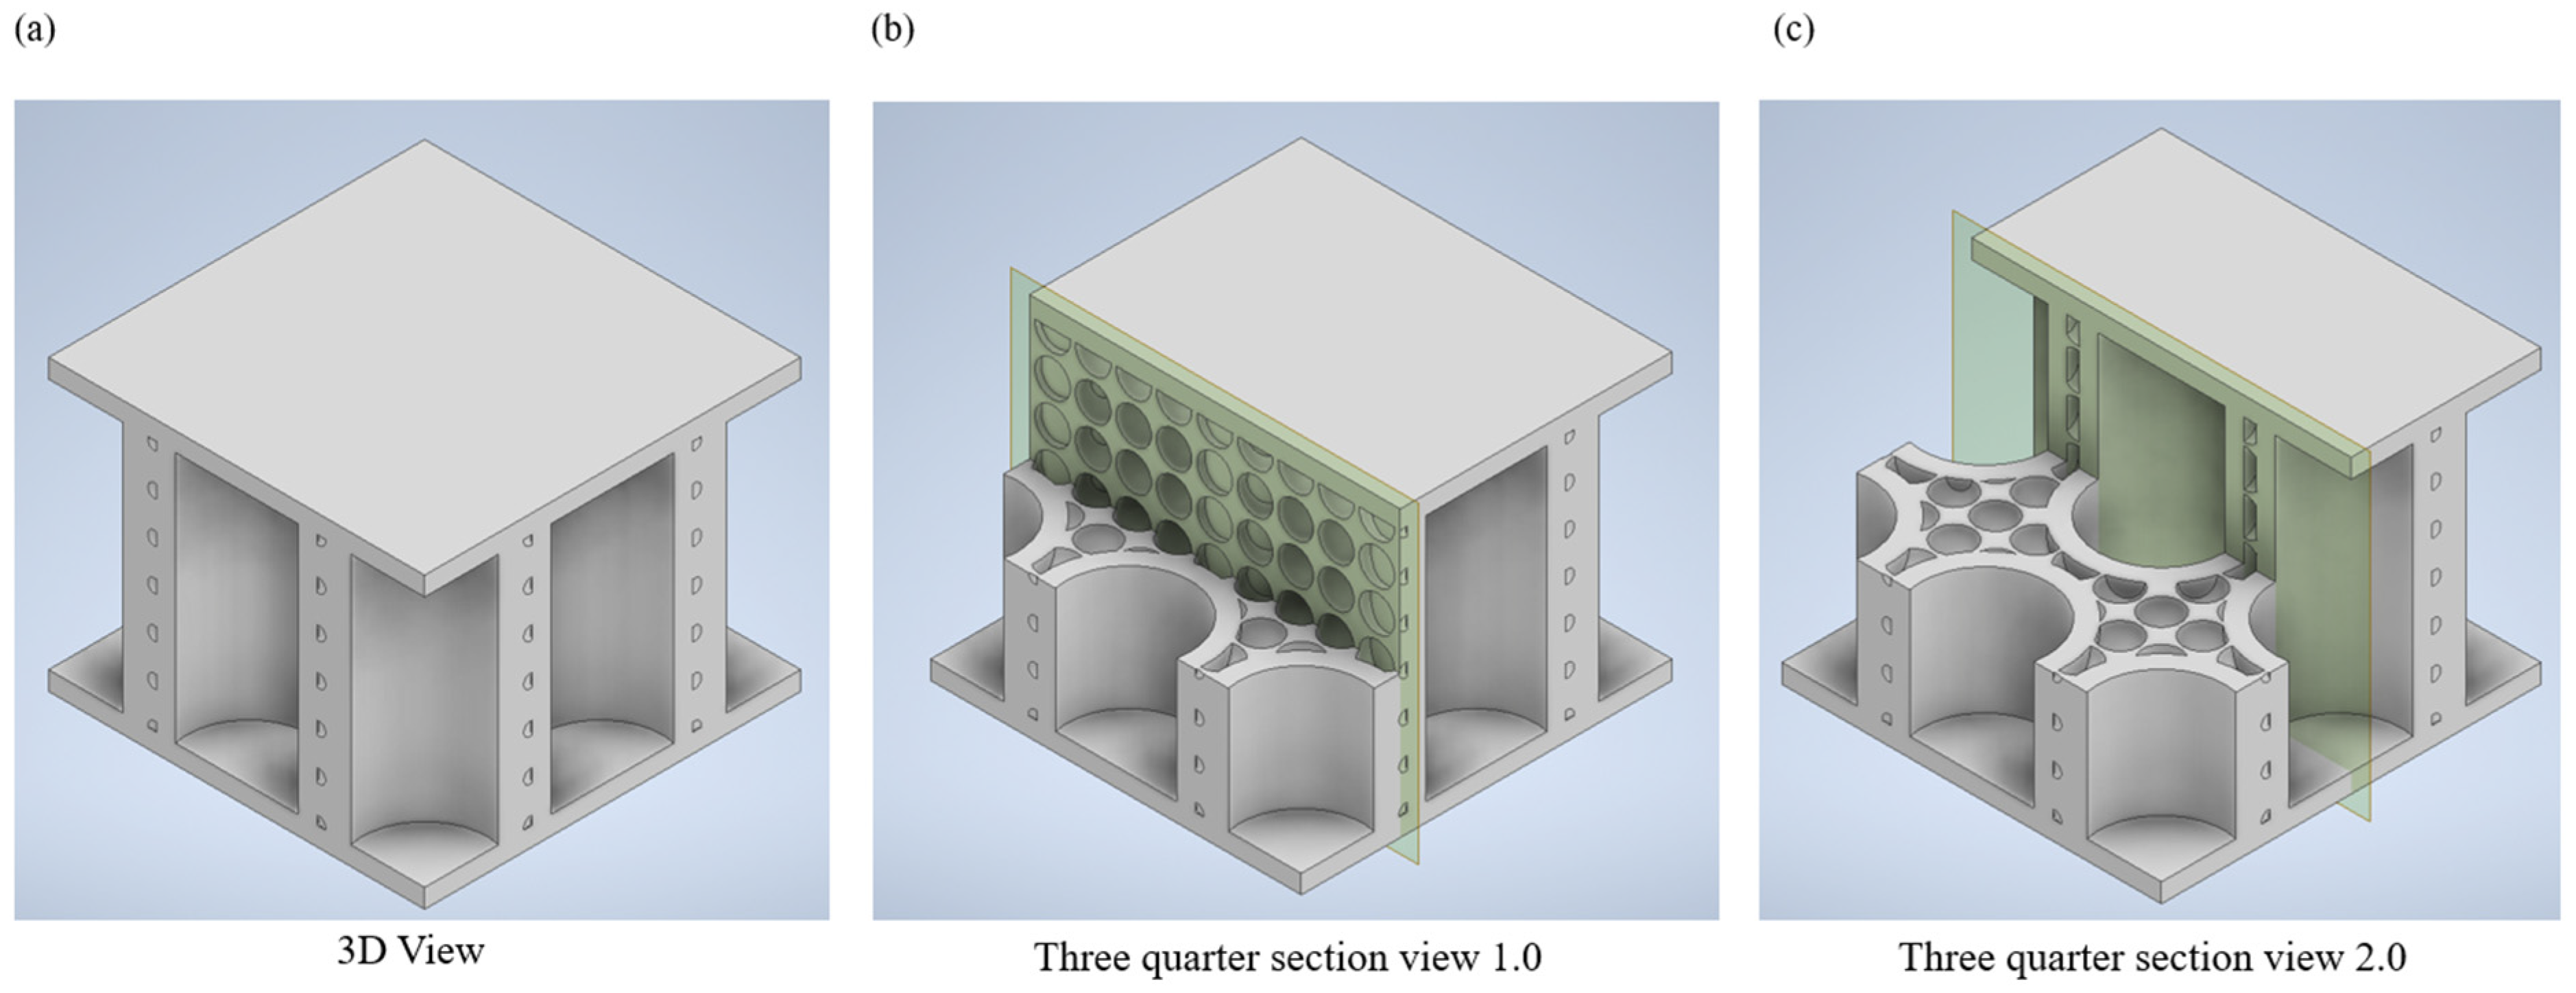
2. Biomimetic Designs and Materials
- The convenience of printing smaller parts with minimal defects or warping effects;
- Its ability to identify all the properties needed for numerical modelling;
- The yield strength () and the stiffness of ABS is suitable for studying the deformation of structures for energy absorption.
3. Methodology
3.1. Quasistatic Compression Test Design
3.2. Methodology for Damage Inspection
- Cutting and grinding: The Buehler IsoMet Low Speed cutting machine was utilised to section the specimens precisely. Upon completing the cutting process, Tegramin from Struers was used to grind the sectioned specimens finely.
- Stereo microscopy: ZEISS SV8 stereo microscope was used to identify the defects and failures in the specimens during the compression process. A Canon SLR was used to inspect the damages in the specimens and to capture images.
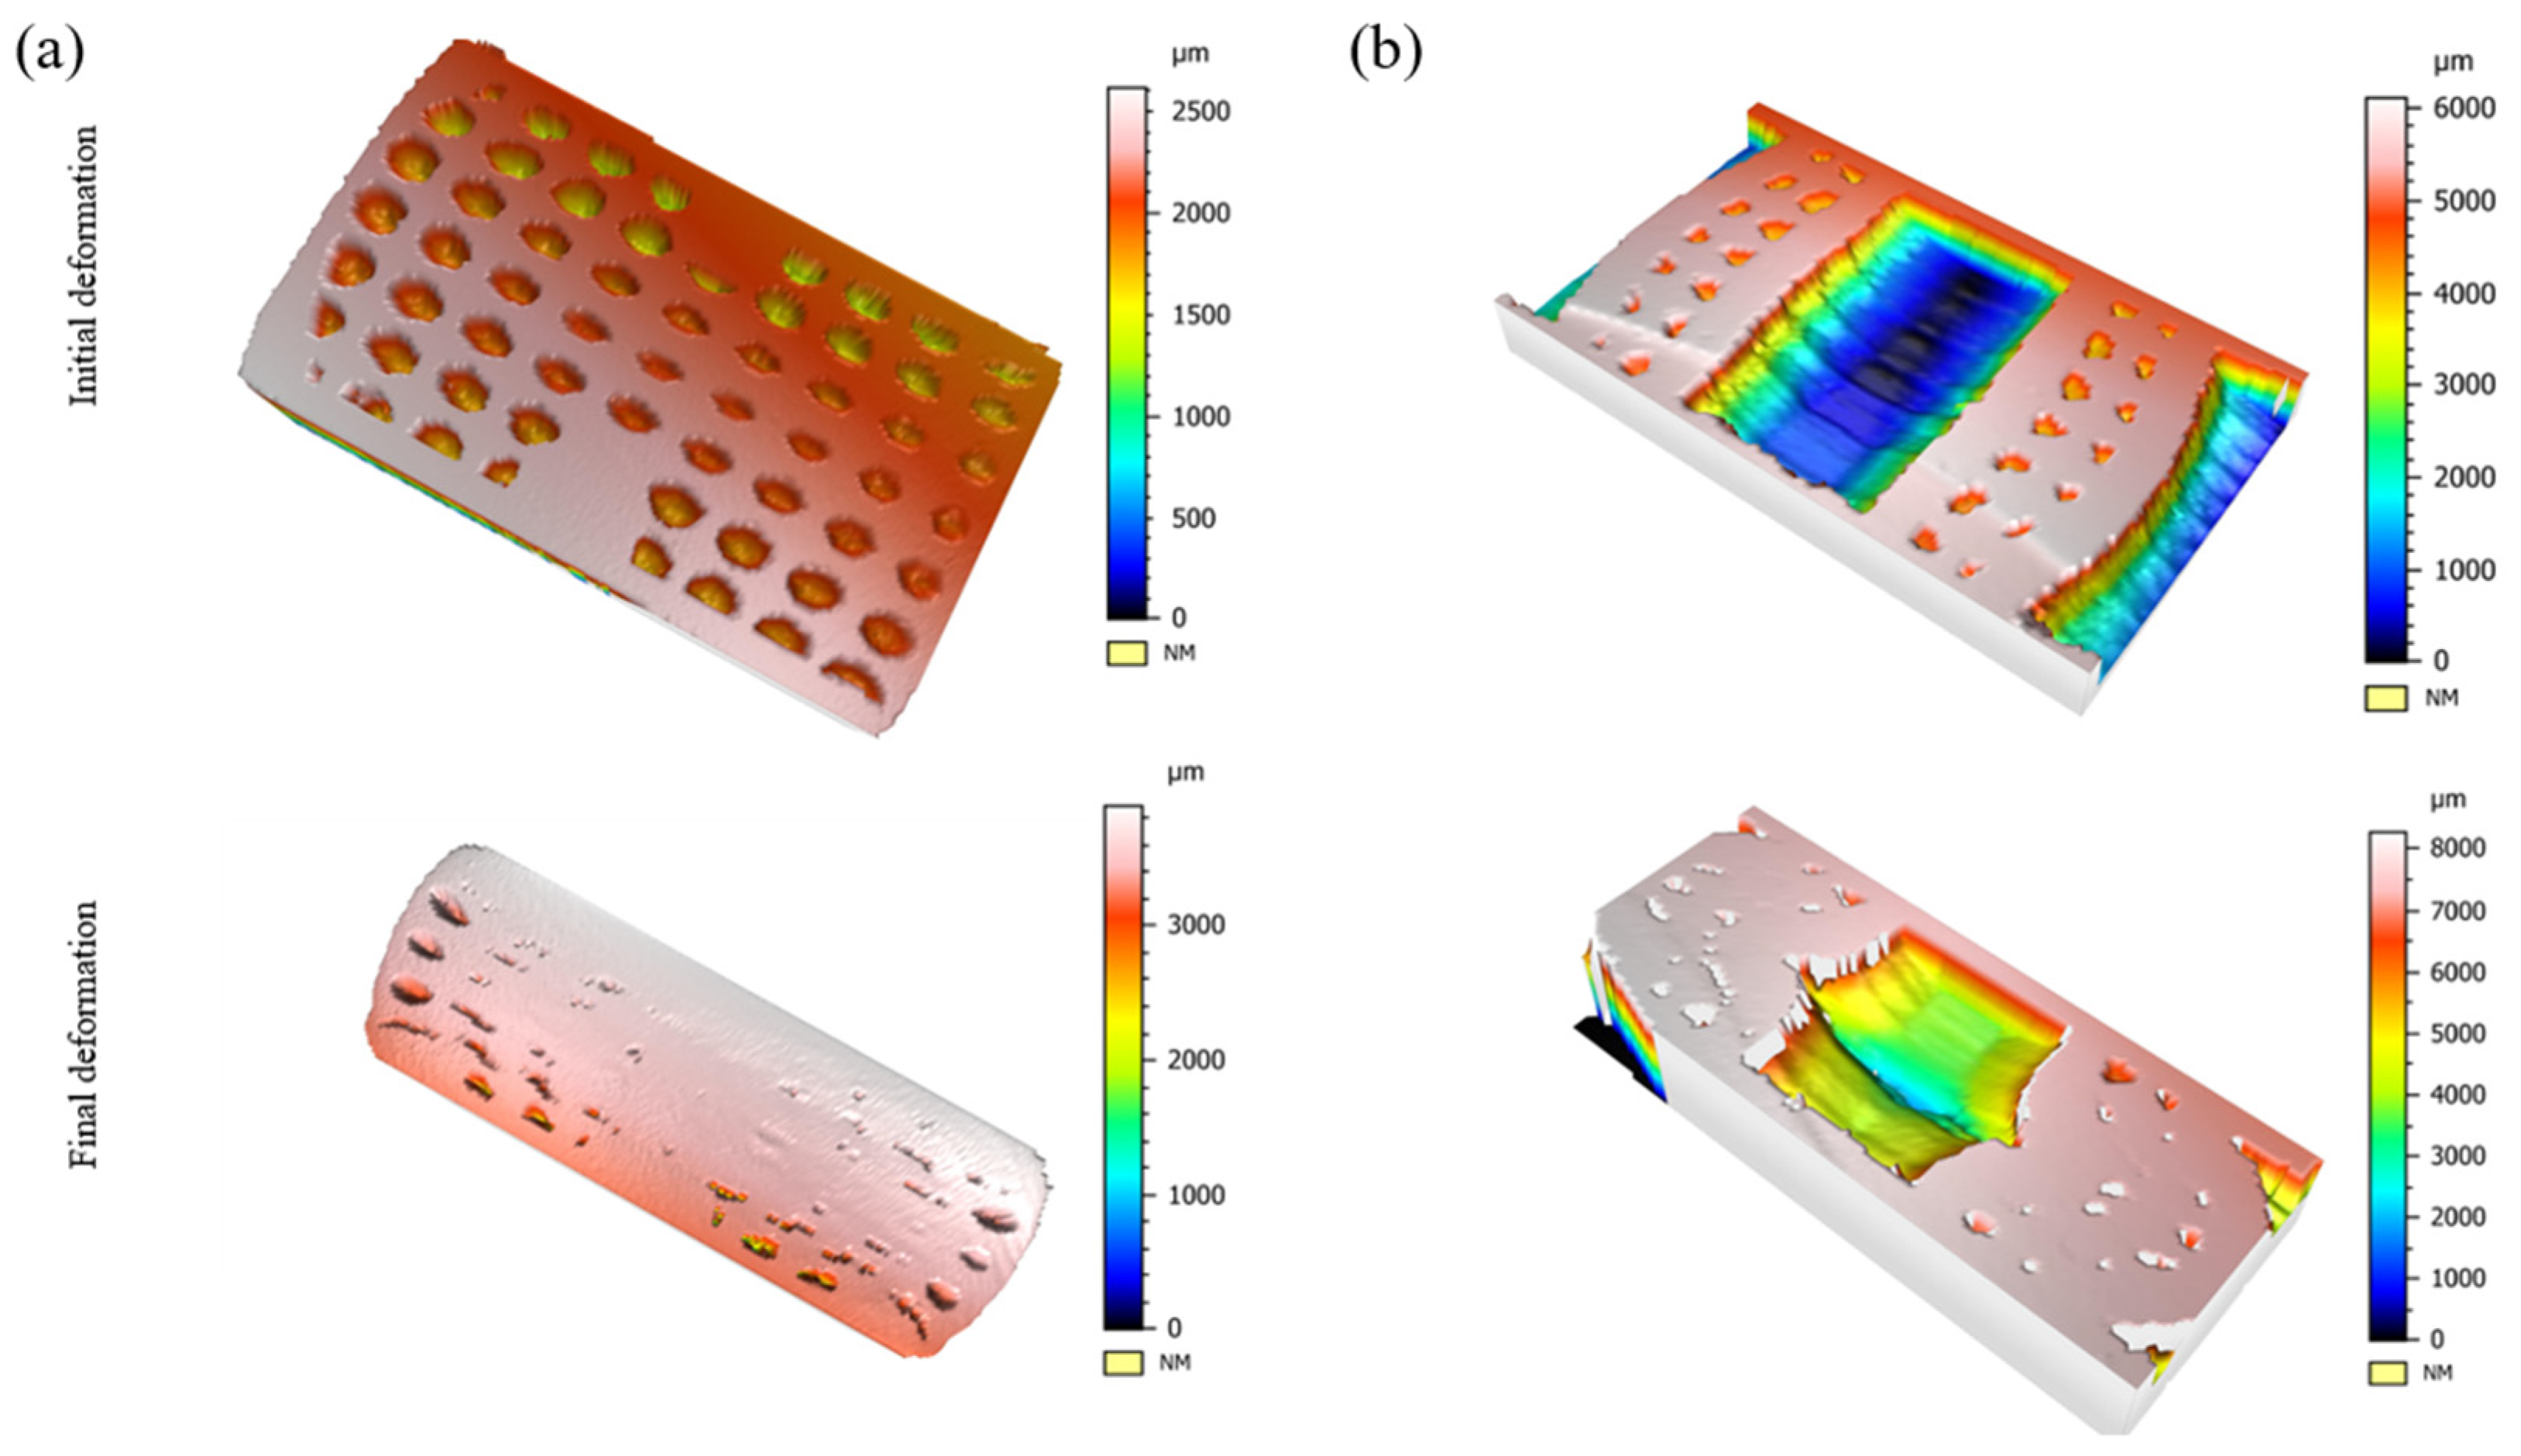
- Optical profilometry: A full 3D scan of the damaged specimens was taken using NANOVEA Optical Profiler. The purpose of the profilometry was to profile surface morphology to perform a quantifiable analysis and to understand the surface roughness after cutting the sample using a diamond blade.
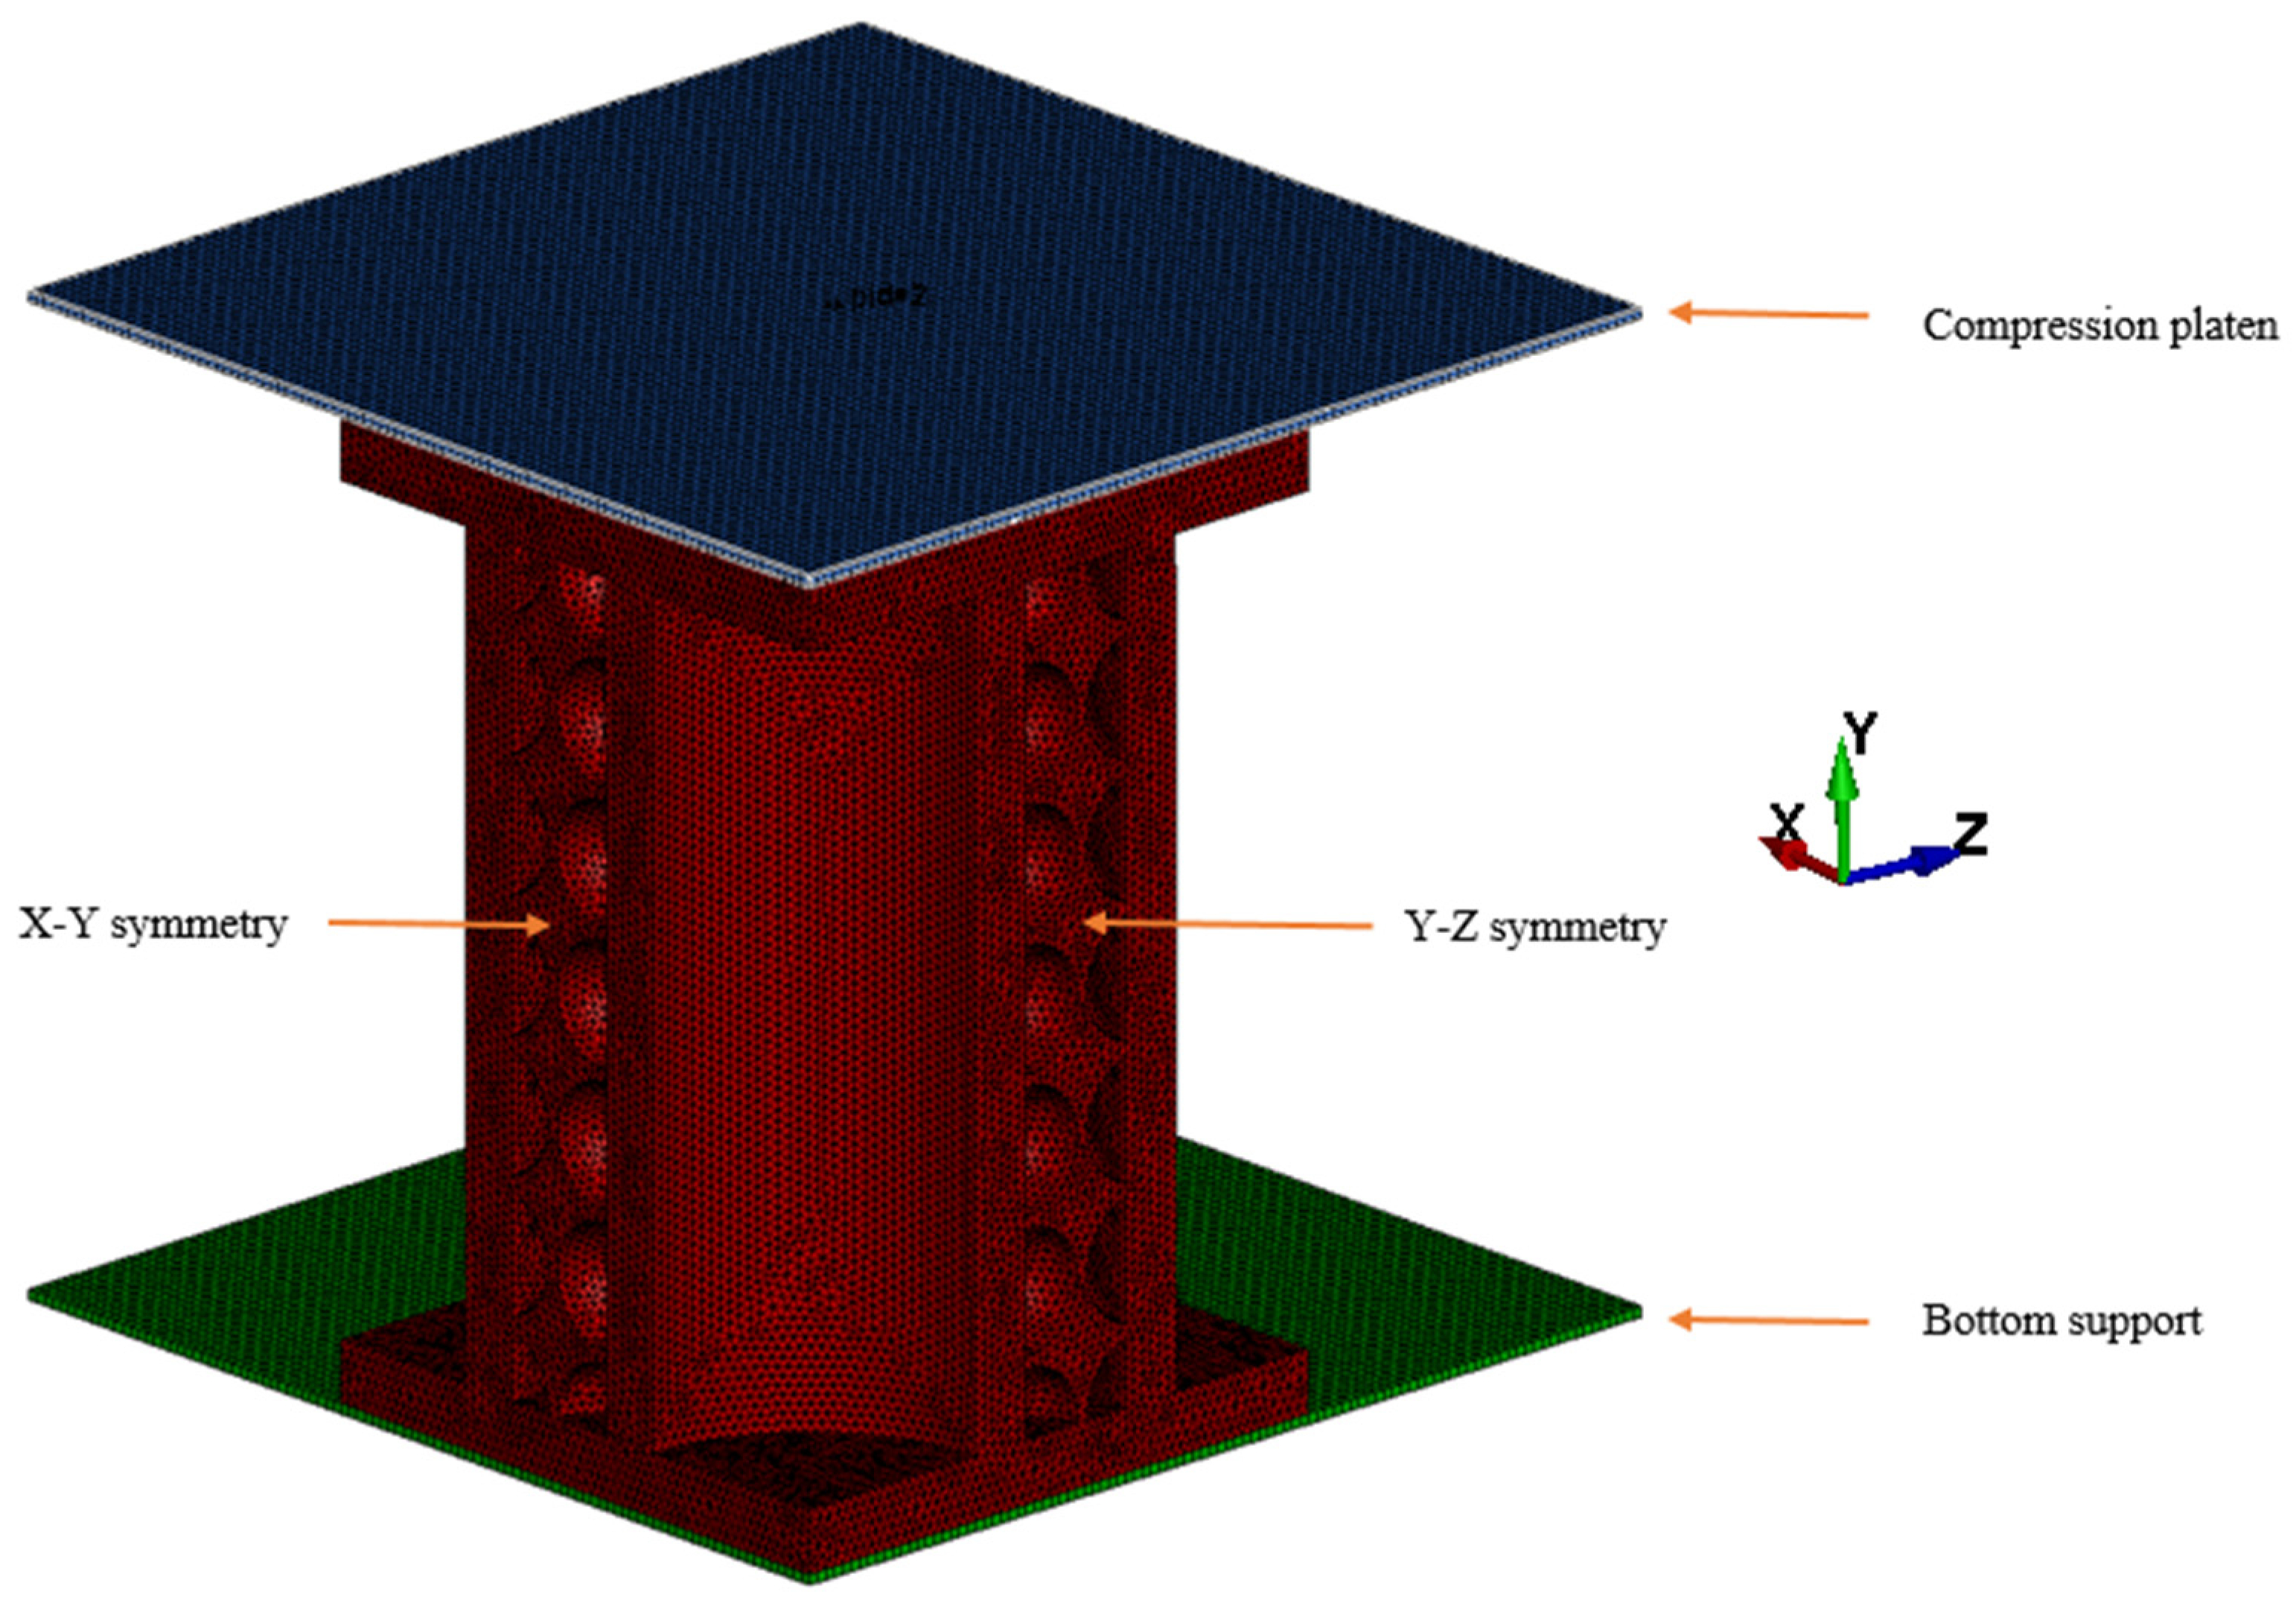
3.3. Finite Element Modelling
- Translational constraint in the local z-axis for degree for freedom (DOF)
- Rotational constraint in local x-axis for degree of freedom (DOF)
- Rotational constraint in local y-axis for degree of freedom (DOF)
4. Results and Discussion
4.1. Experimental Results
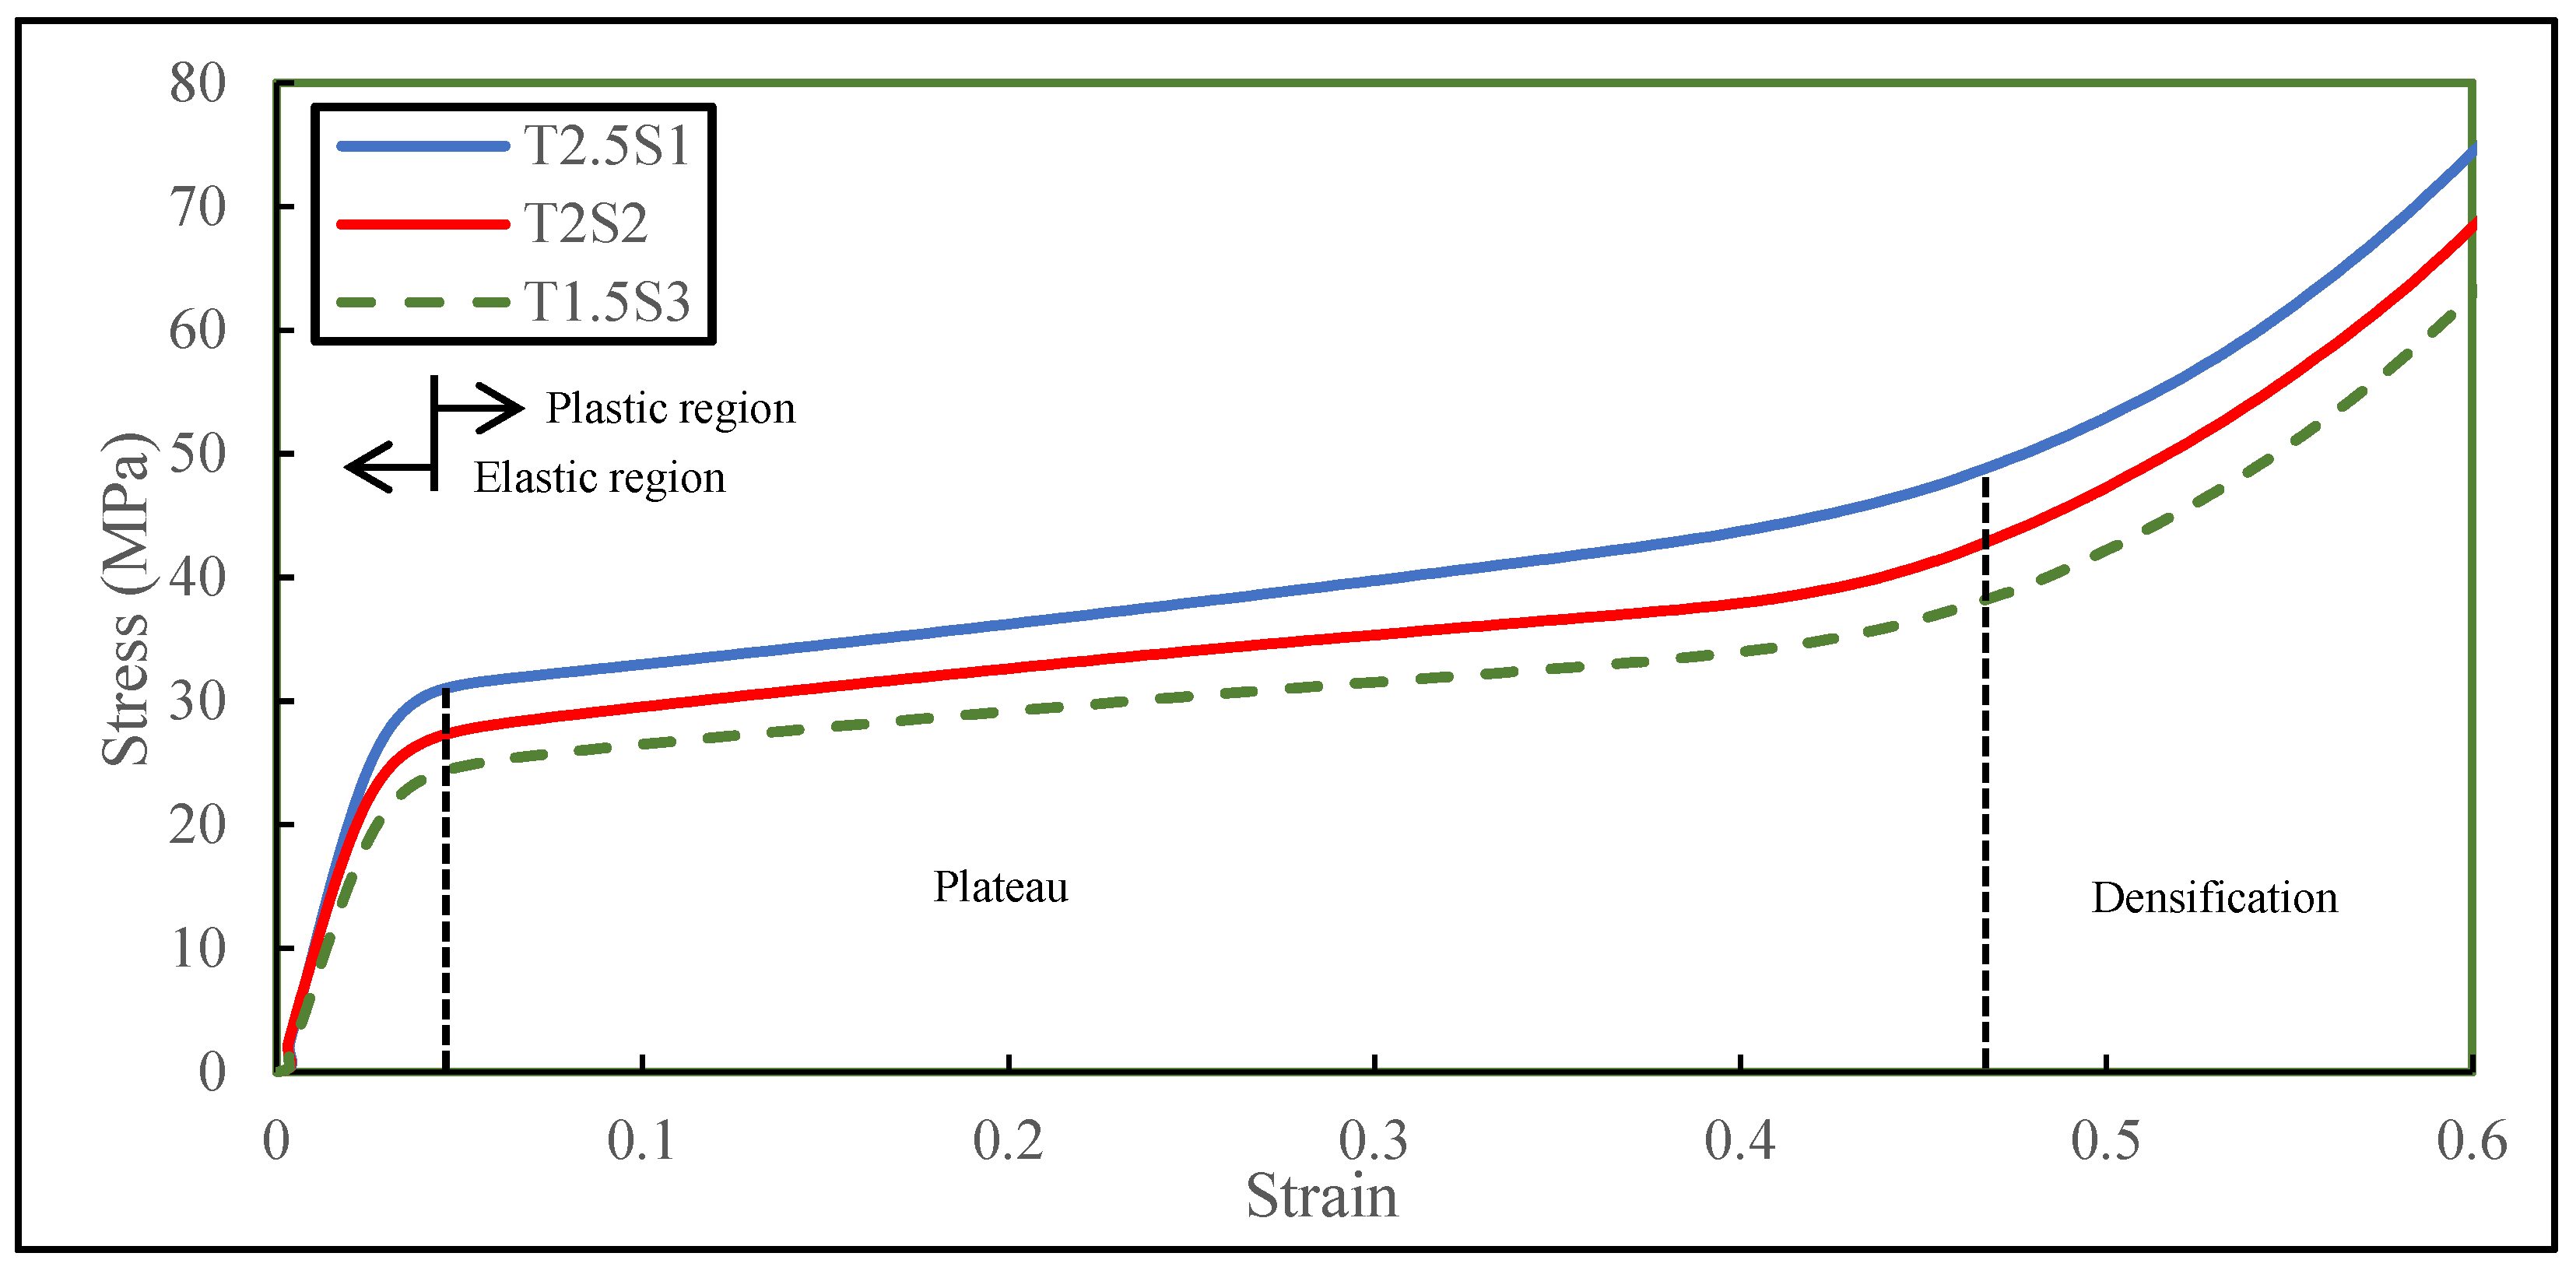
4.1.1. Elastic Behaviour
4.1.2. Plastic Behaviour
4.1.3. Properties and Their Applications
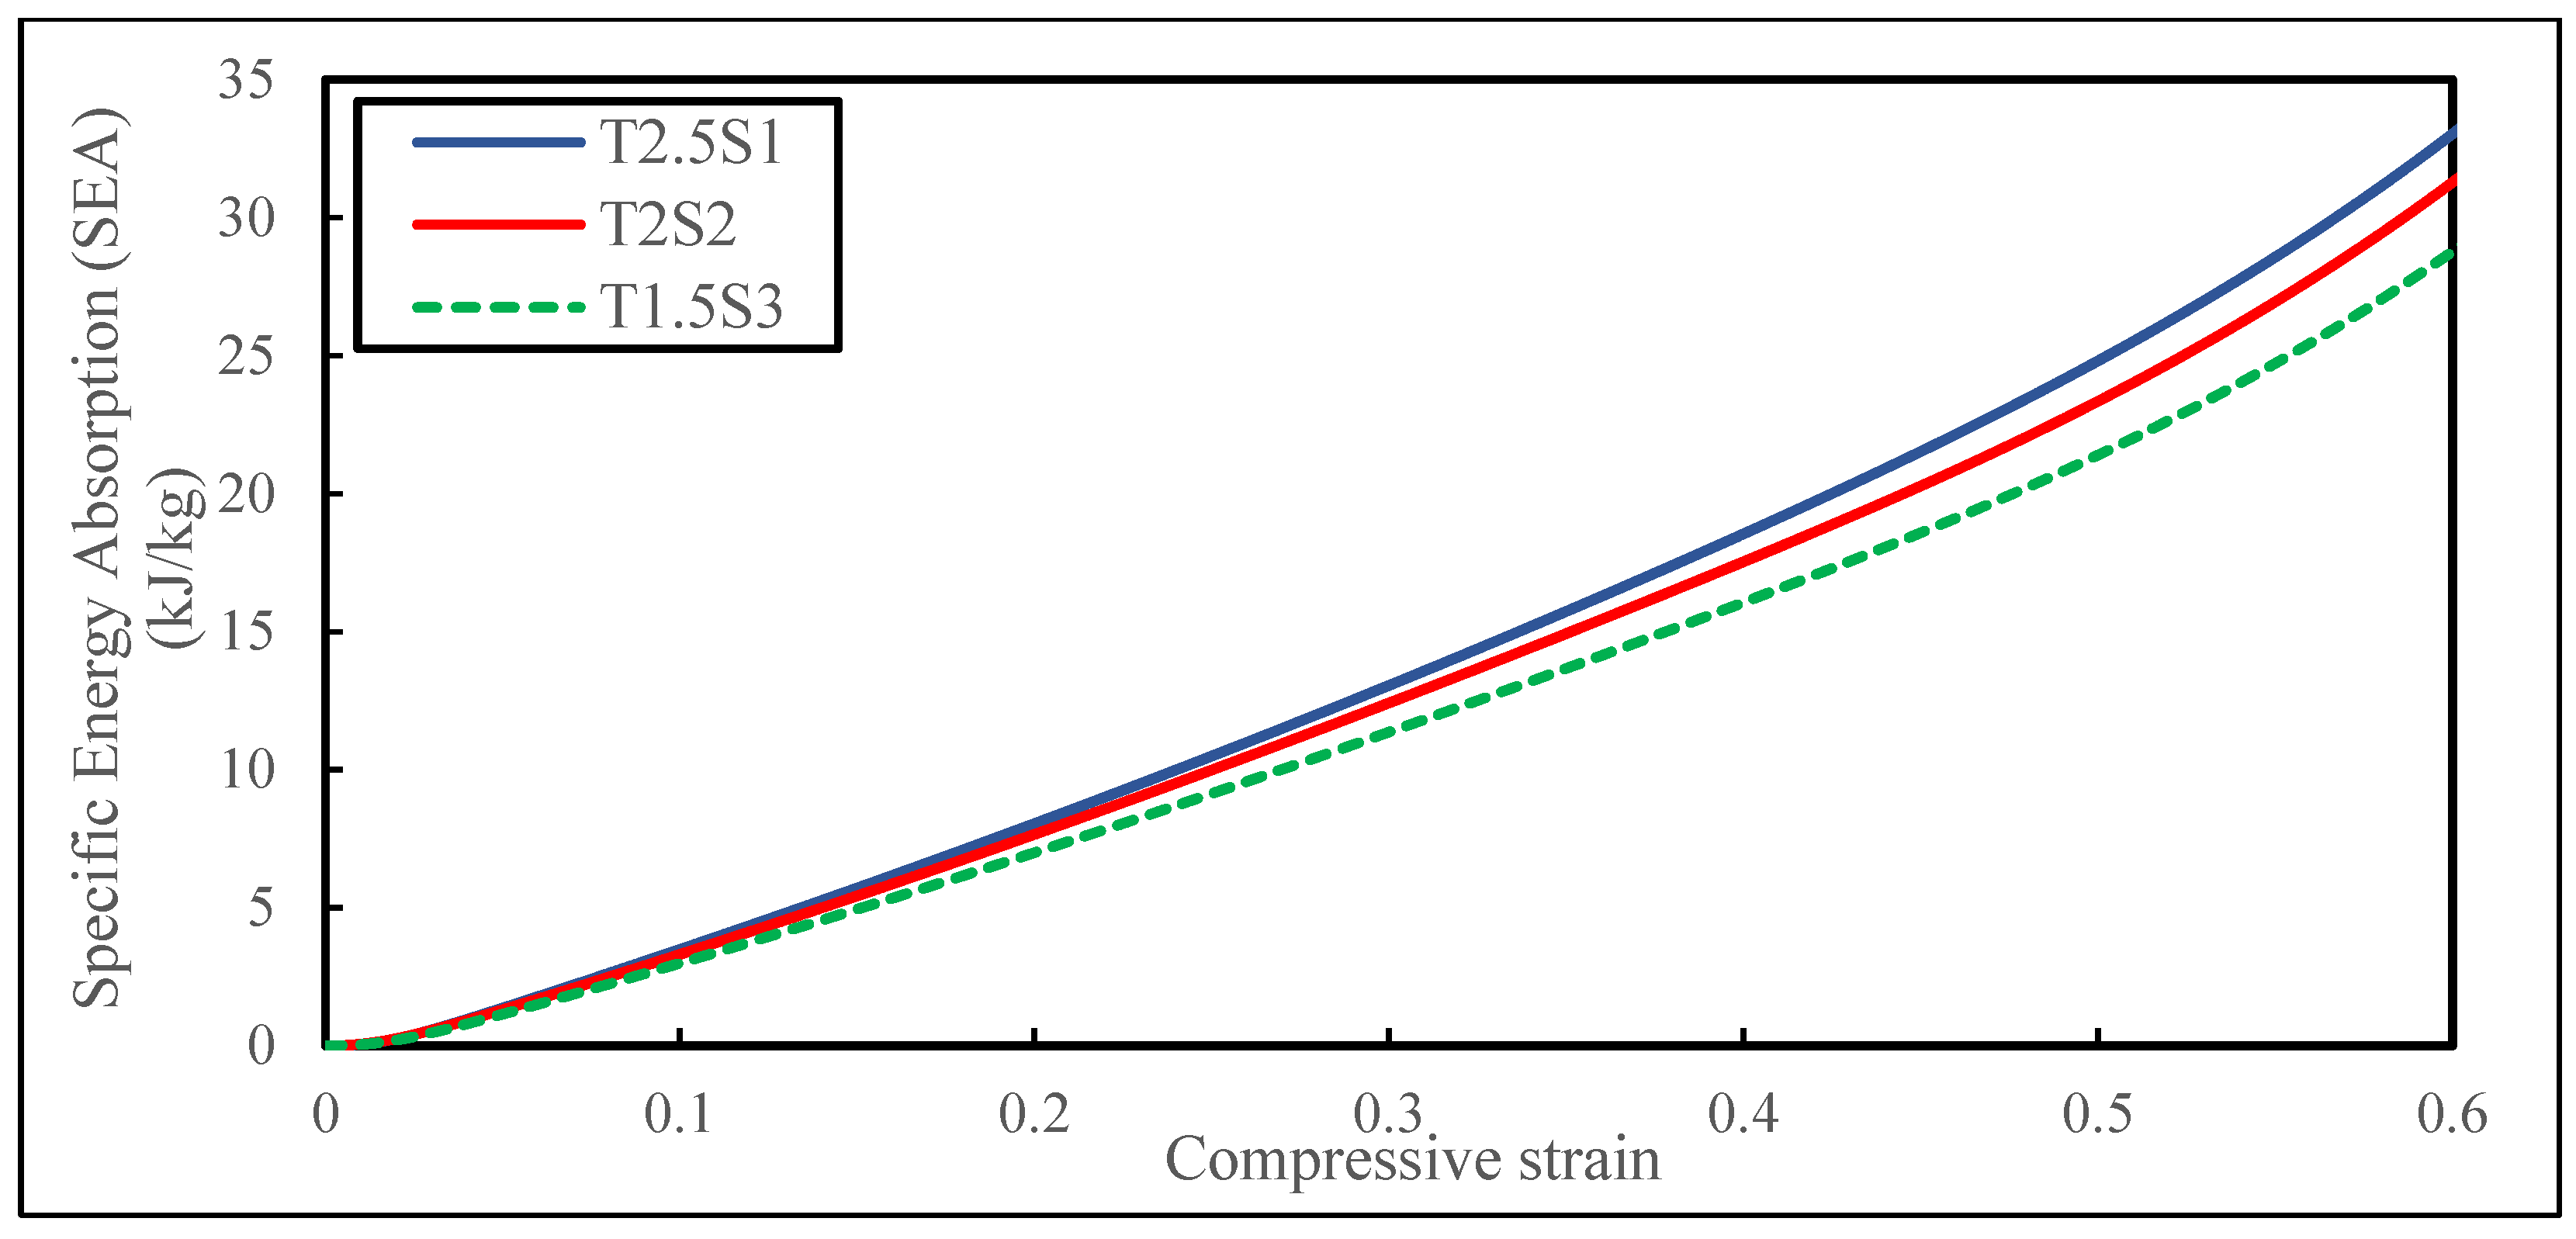
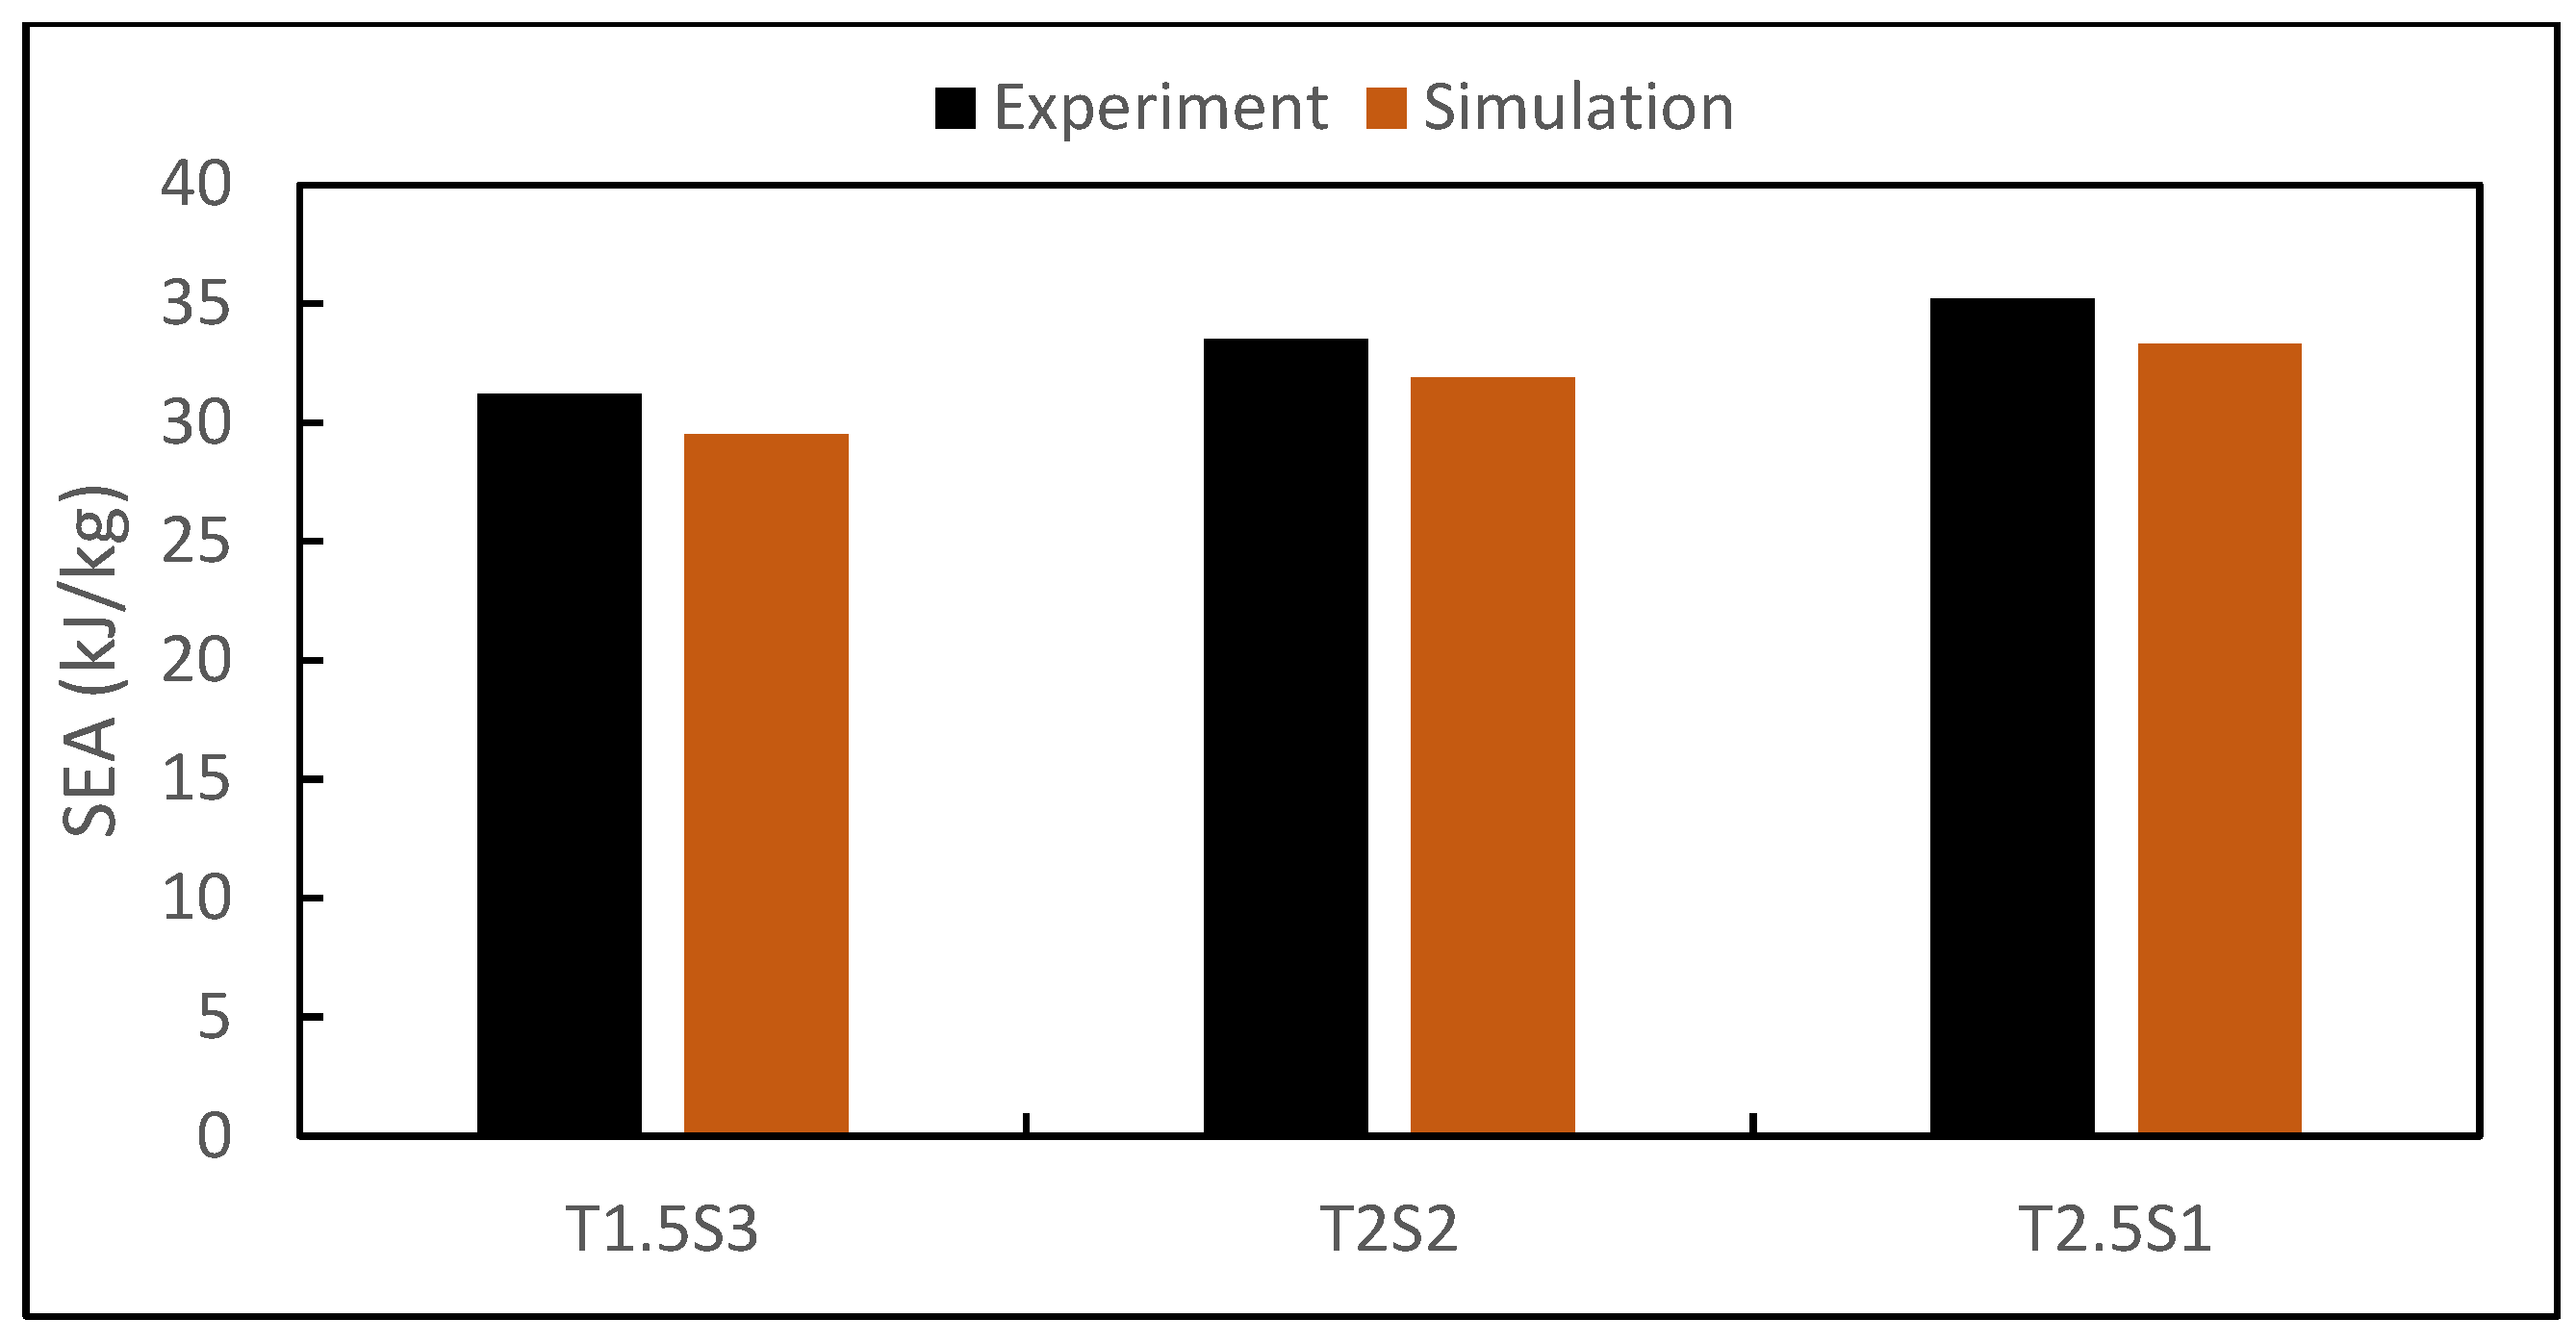
4.1.4. Energy Absorption Behaviour
4.1.5. Postmortem Damage Analysis
4.2. Numerical Results
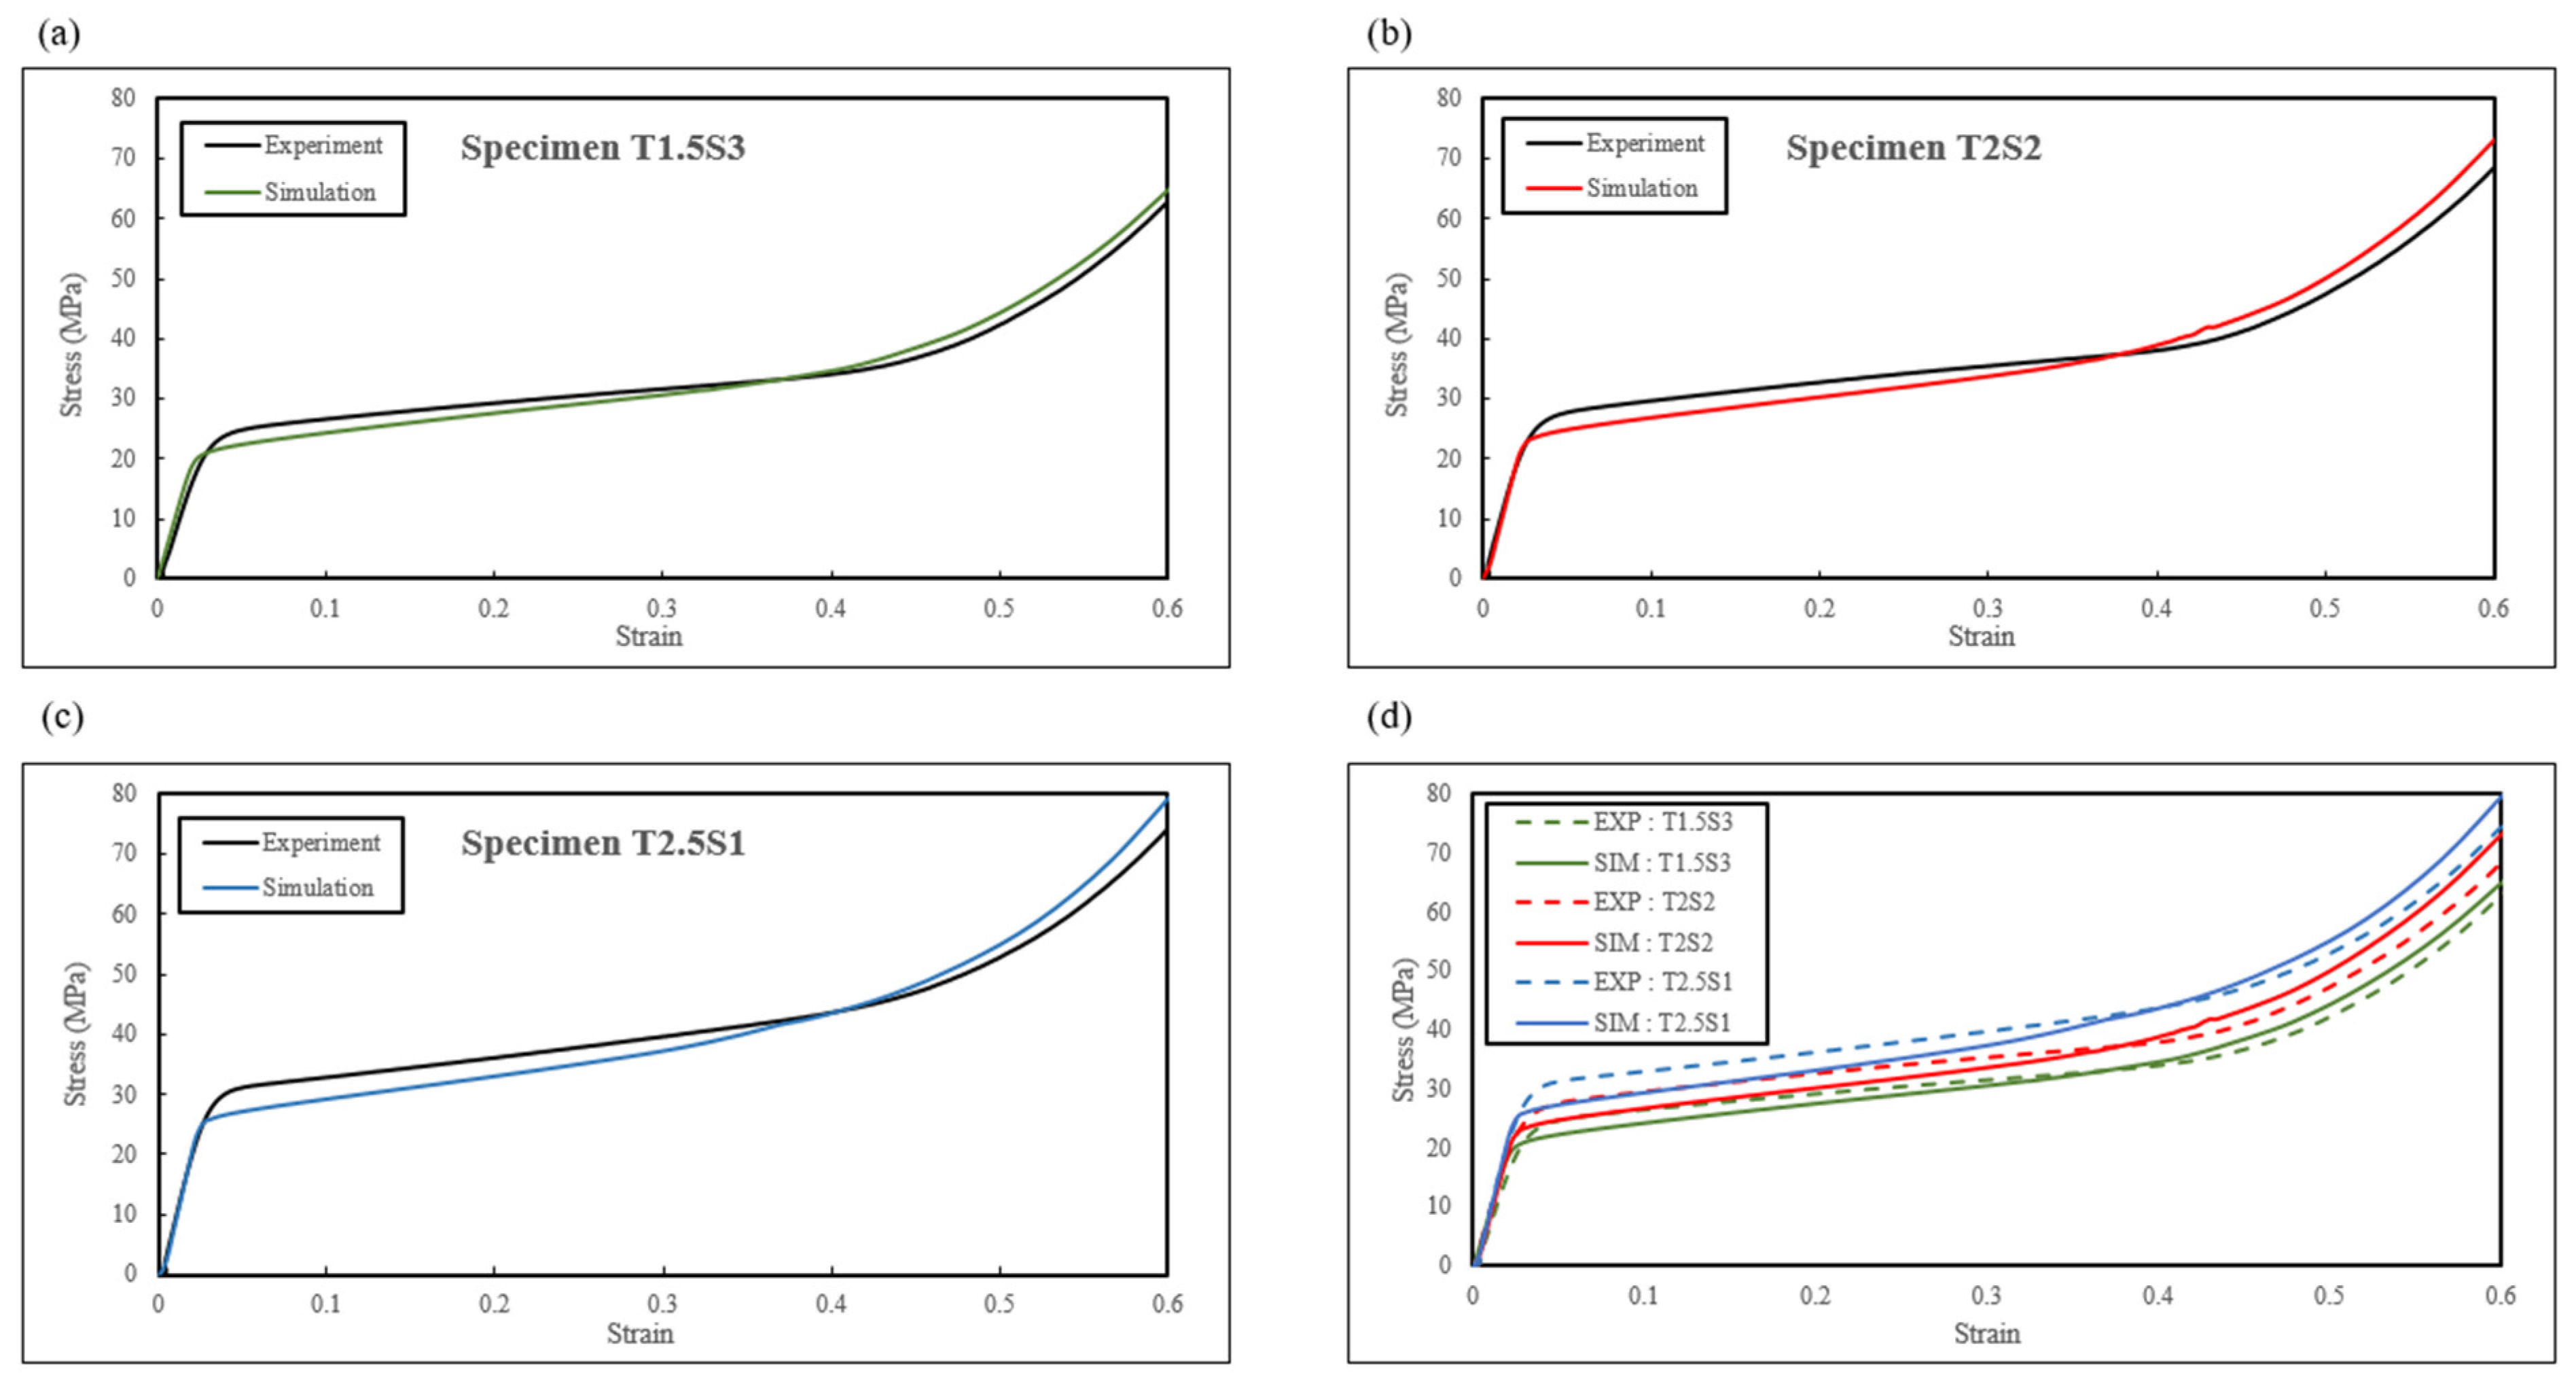
4.2.1. Validation of the FE Model
- The simulations of the compression test were run with a perfectly plastic assumption. In reality, localised defects are inevitable due to the 3D printing process. Warping and irregular surface features were some of the printed parts’ defects.
- The structure was assumed to be isotropic, i.e., a uniform base material property throughout the structure. However, this analytical model did not consider material anisotropy due to the 3D printing process.
- The structure was assumed to have a uniform relative density during modelling. However, the manufactured samples might not have had a uniform relative density due to microporosity in the printed layers.
- Given that the geometry of the designed specimens was symmetric and that force distribution was even, the quarter-symmetrical model was adopted to run the simulation reasonably, assuming the behaviour would be the same as the full model.
- The deformation of the tetrahedral solid elements underwent large distortion when the strain approached 30% and above. Two types of contact parameters were used to overcome the negative volume, and one point tetrahedron (ELFORM 10) was chosen. It was assumed that all of the elements in the sample would not have any negative volume, which could affect the numerical results.
- The compression plate was assumed to be rigid, and the material model was chosen accordingly.
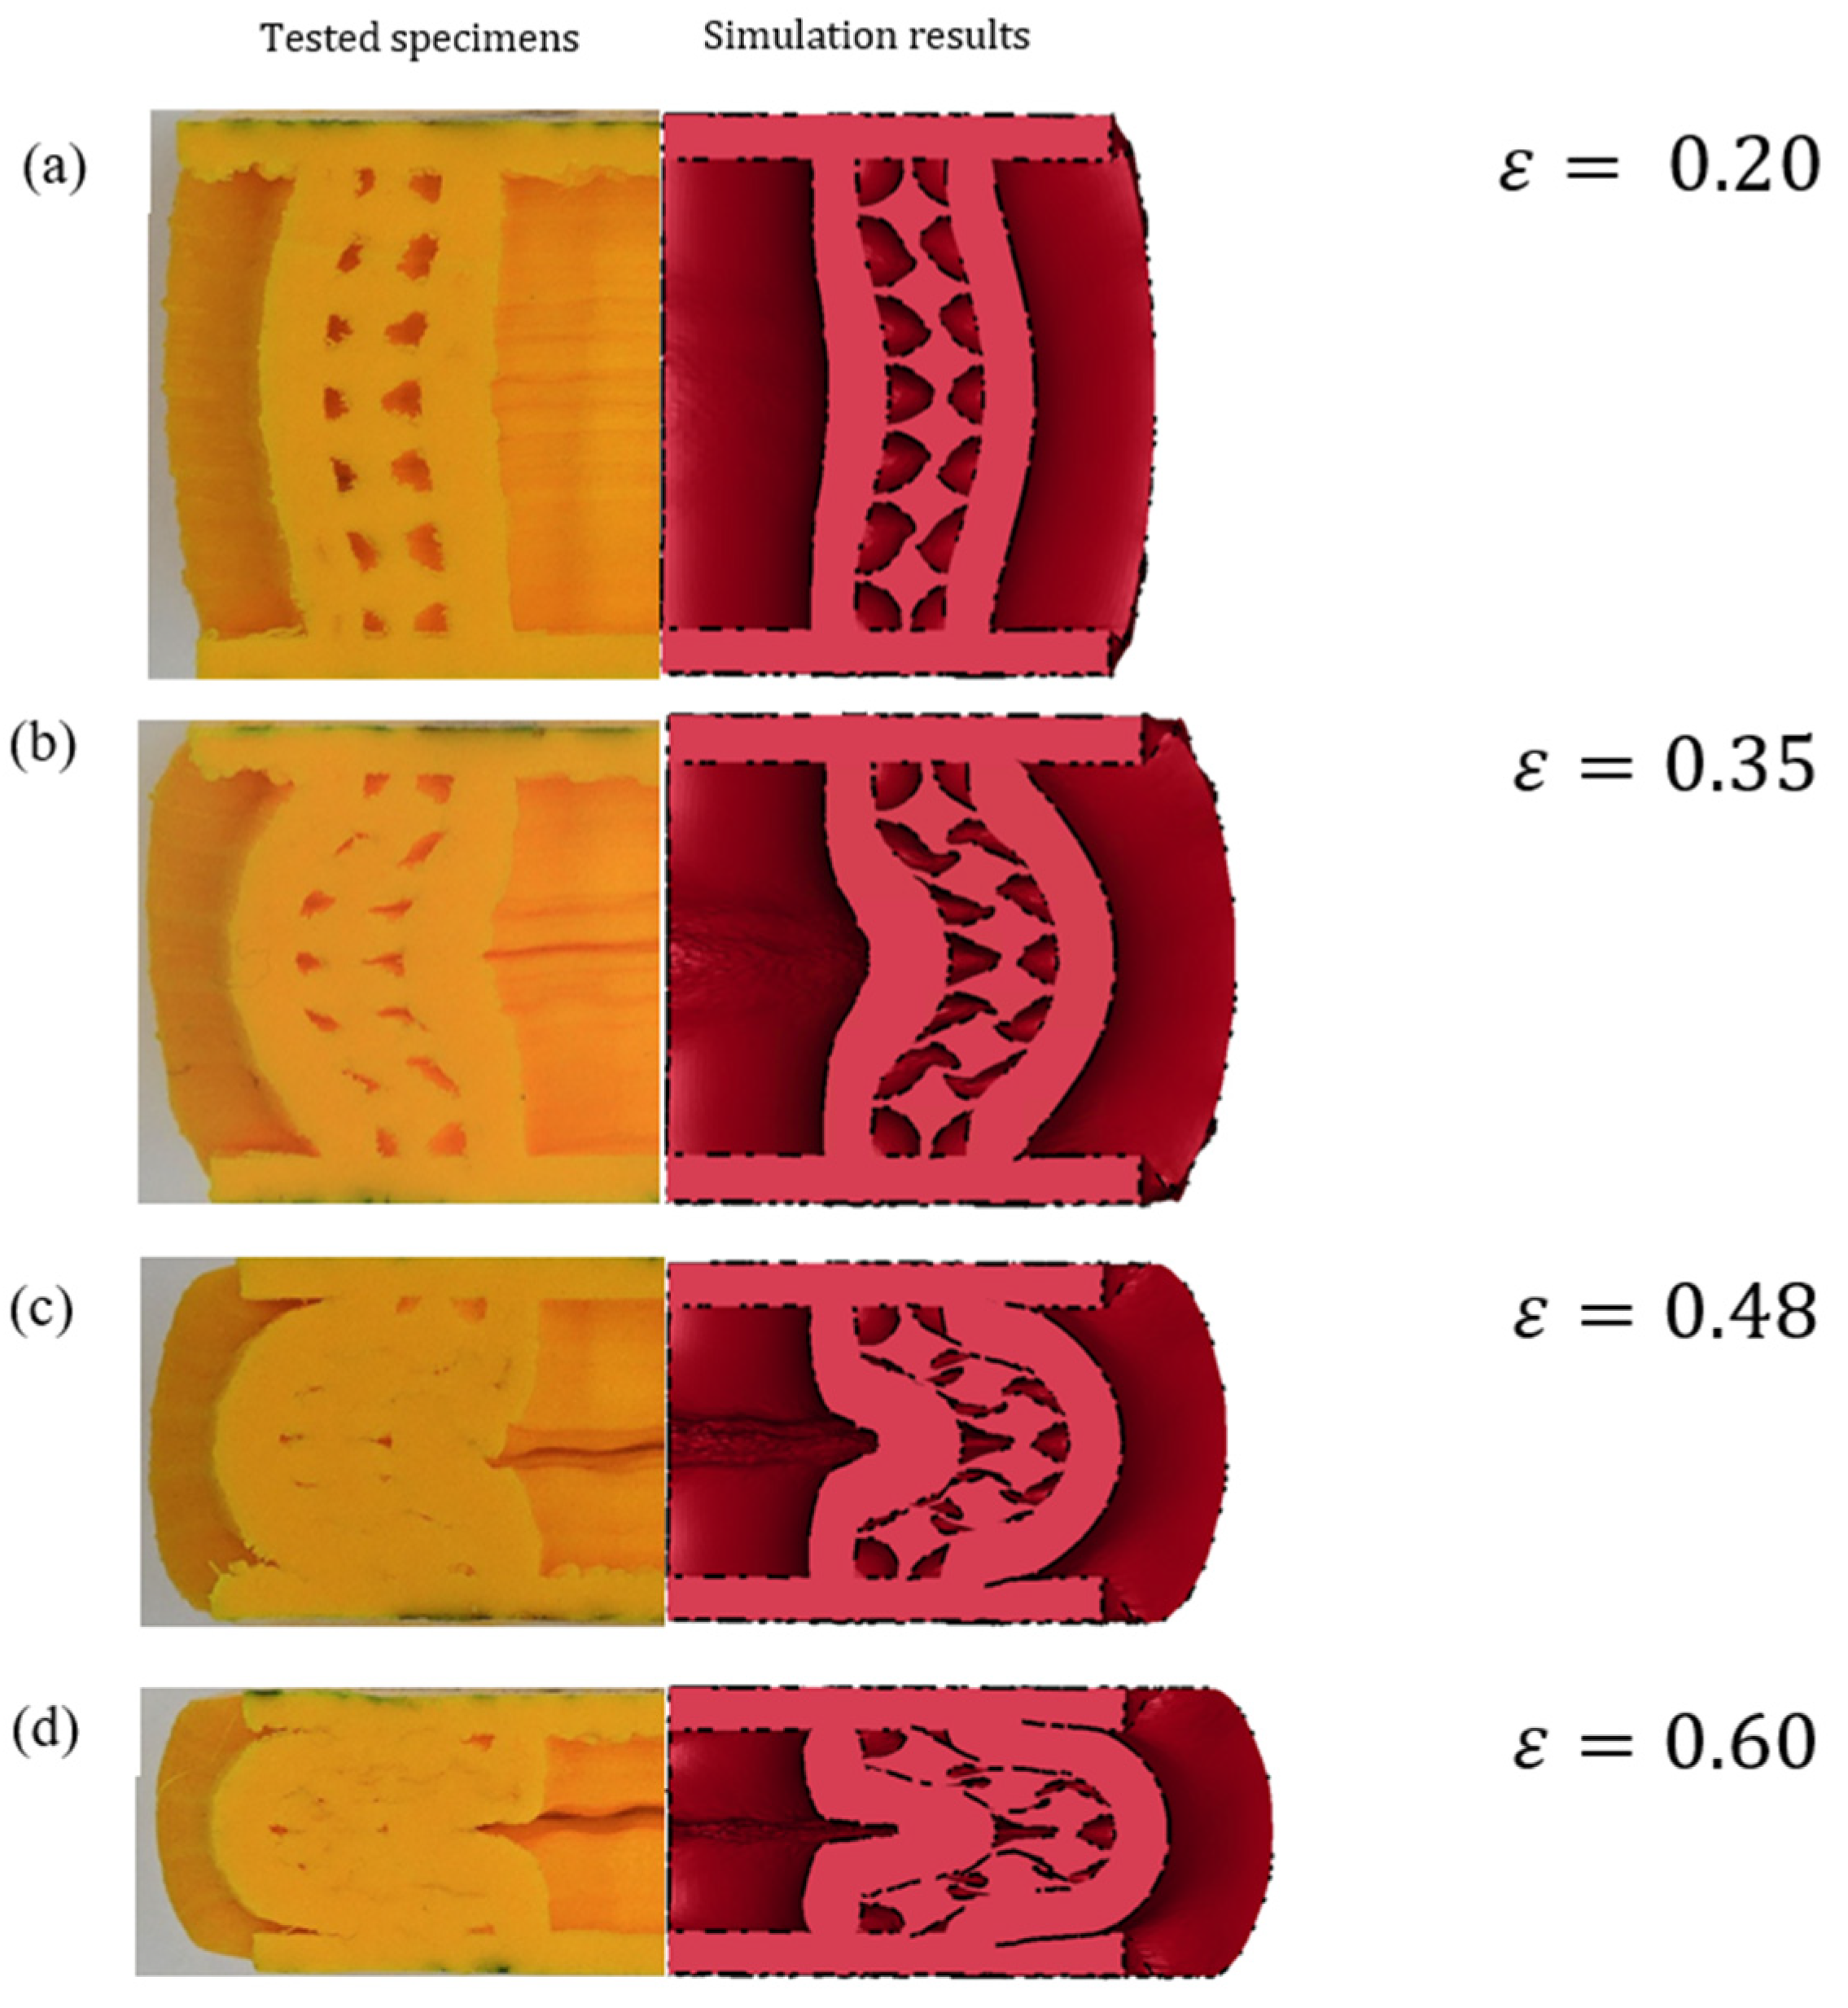
4.2.2. Deformation Mechanism
- To predict the failure/deformation behaviour of the tubes and pores embedded in the biomimetic structure as modelling ran with a perfectly plastic assumption. The deformation pattern identified during the experiment could be different from that identified during numerical modelling due to defects in the samples or any possible human errors while conducting the experiments. In the end, it was noted that the deformation pattern observed during the experiments was acceptable as it was well matched with that observed during modelling.
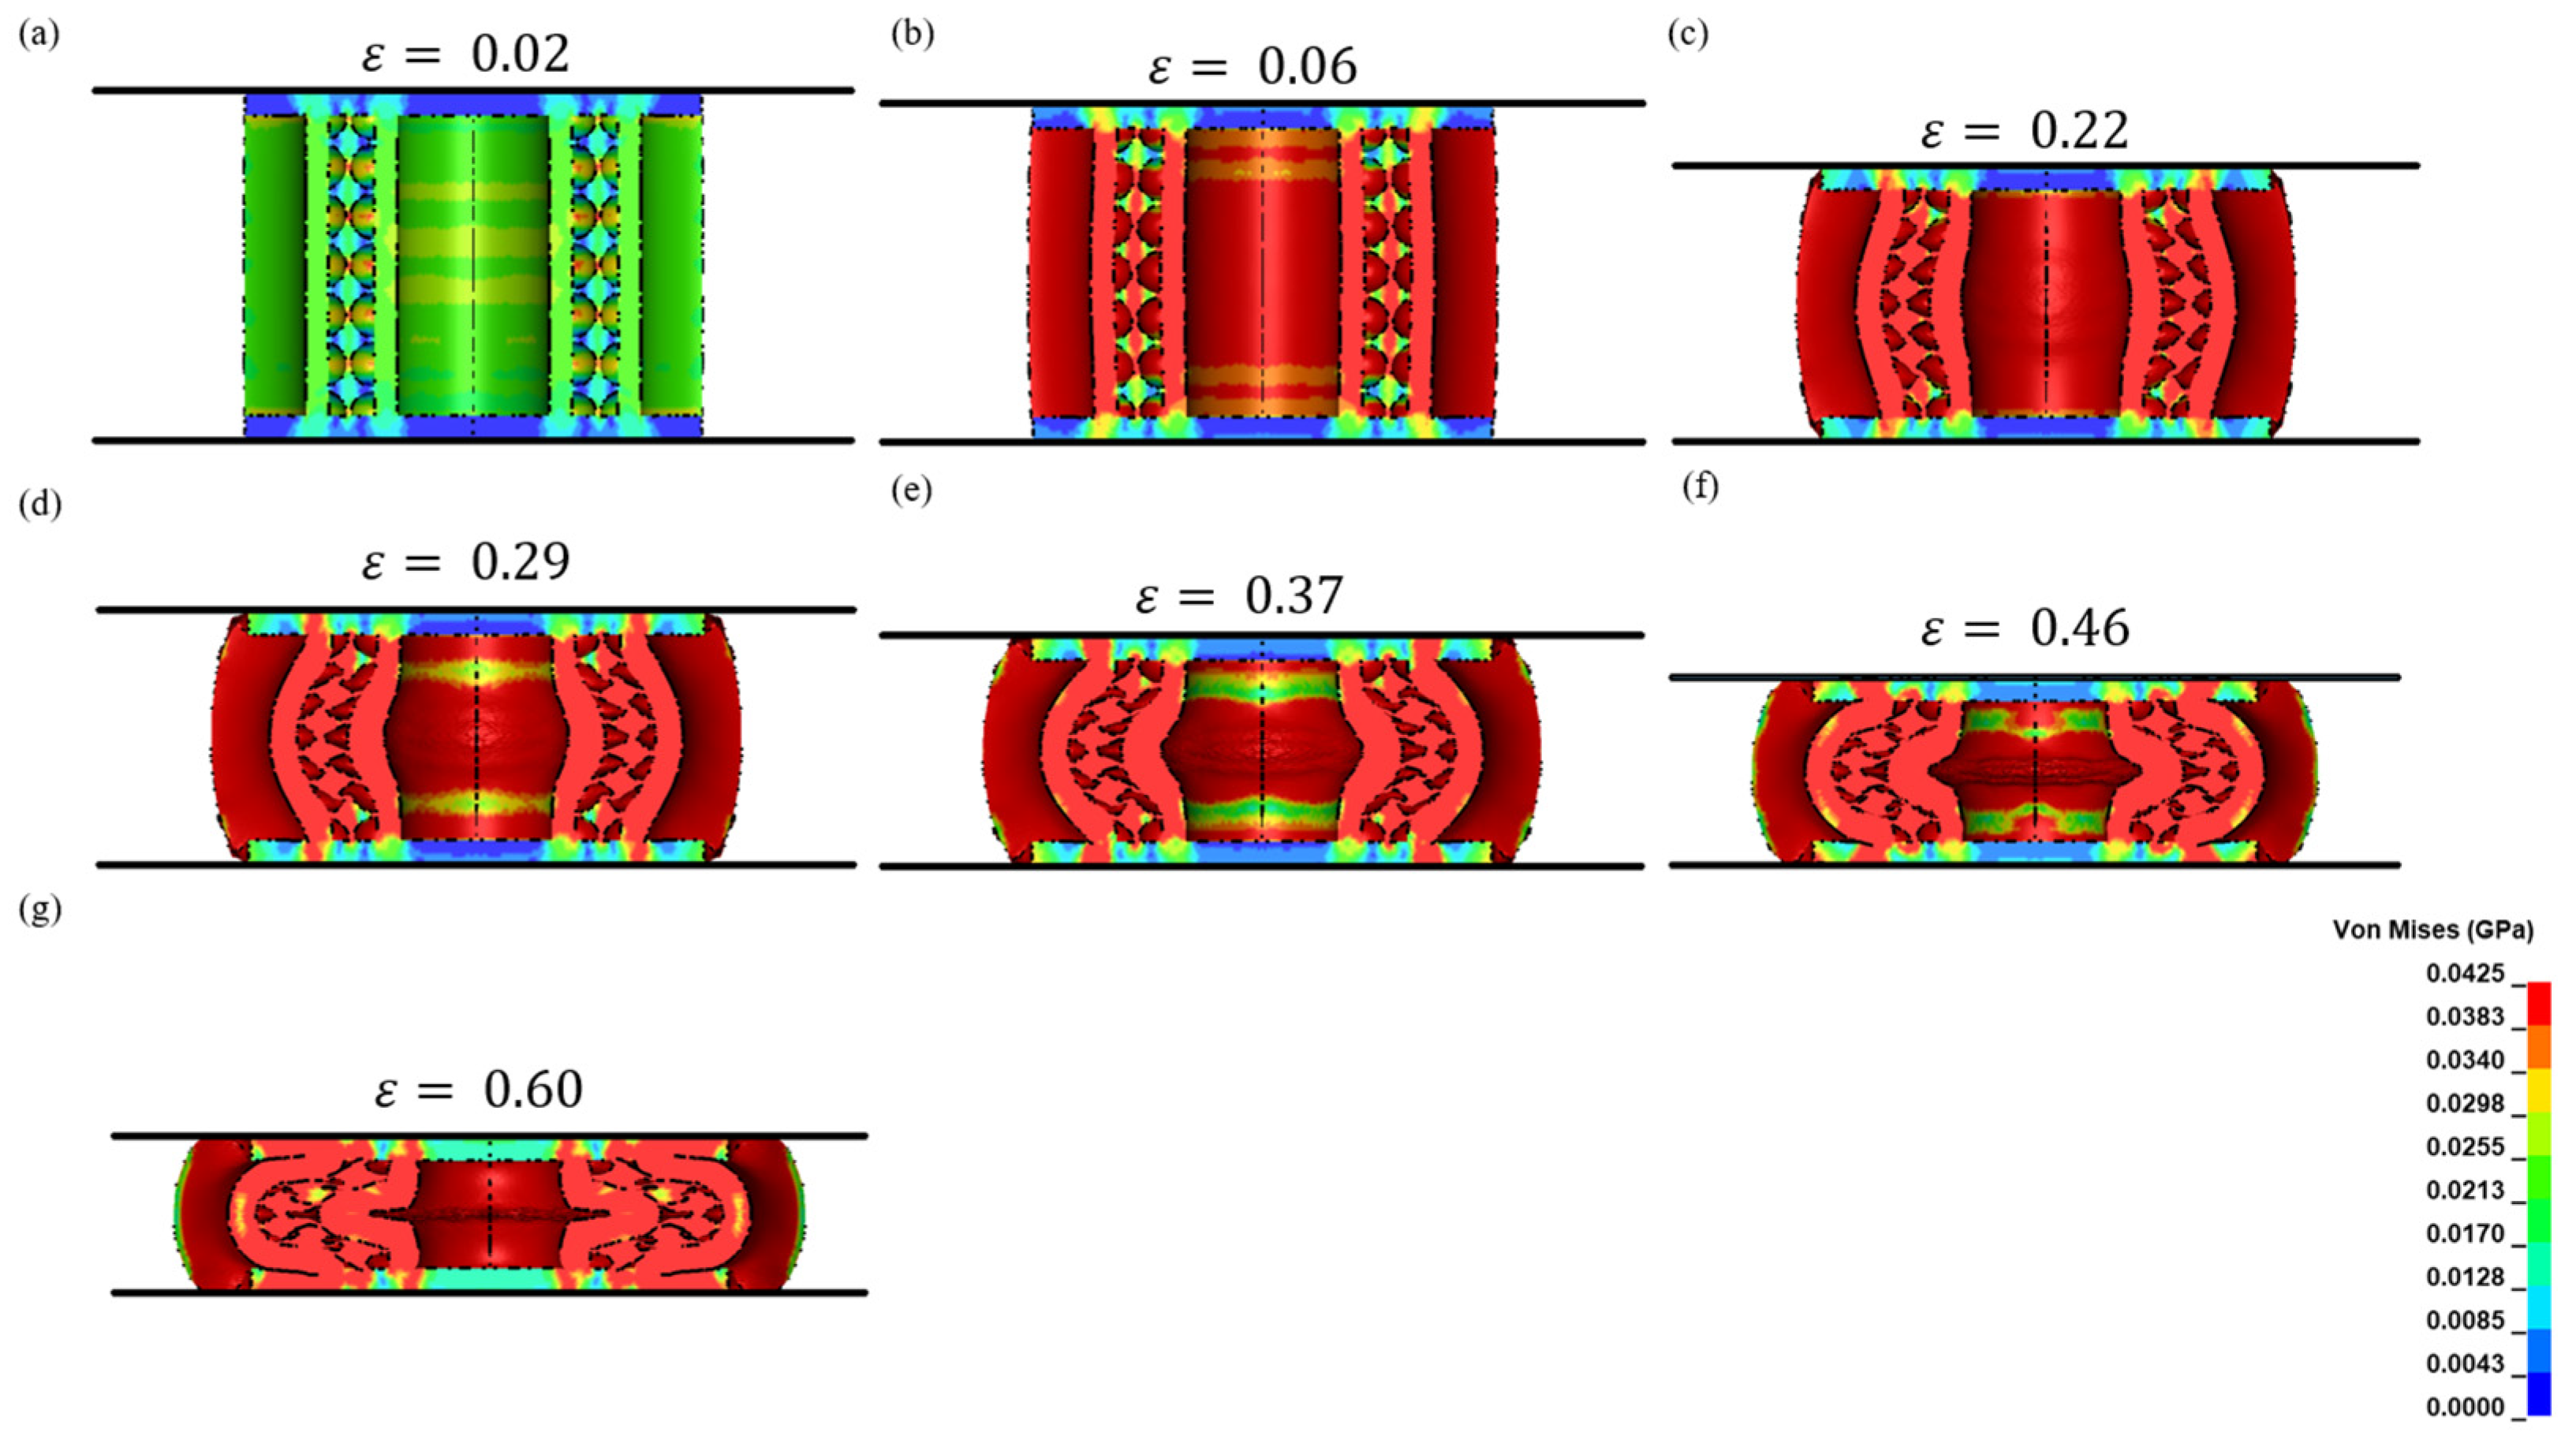
- To understand the underlying hypothesis of the deformation behaviour through stress field distribution. This adds quantitative physical data on the deformation mechanisms which authors cannot collect solely from the experiment during the deformation process.
- To obtain the stress threshold for buckling, which can be determined through simulations to provide quantitative limits on the strain range for the given structure. In our study, the stress threshold for buckling was determined to be 21.3 MPa–42.5 MPa on a strain regime between 0.02 and 0.29.
- To obtain stress contours that could be used to design better geometries for specific applications. In numerical modelling, variations can be made at relatively low costs and can be simulated rather than being made through the expense of 3D printing and being made by conducting experiments.
- To perform data validation on the stress–strain responses of the experimental and modelling results. Visualising the trendline (as shown in Figure 12) provided the authors with the justifiability of the accuracy of the printed samples and experiments.
5. Conclusions
- Specimen T1.5S3, which had the thinnest tubes in the matrix, was less stiff (737.51 ± 1.94 MPa) than the other designs. It was noted that, as the thickness of the tube increased by 33.3%, the stiffness of the biomimetic structure increased by 23%.
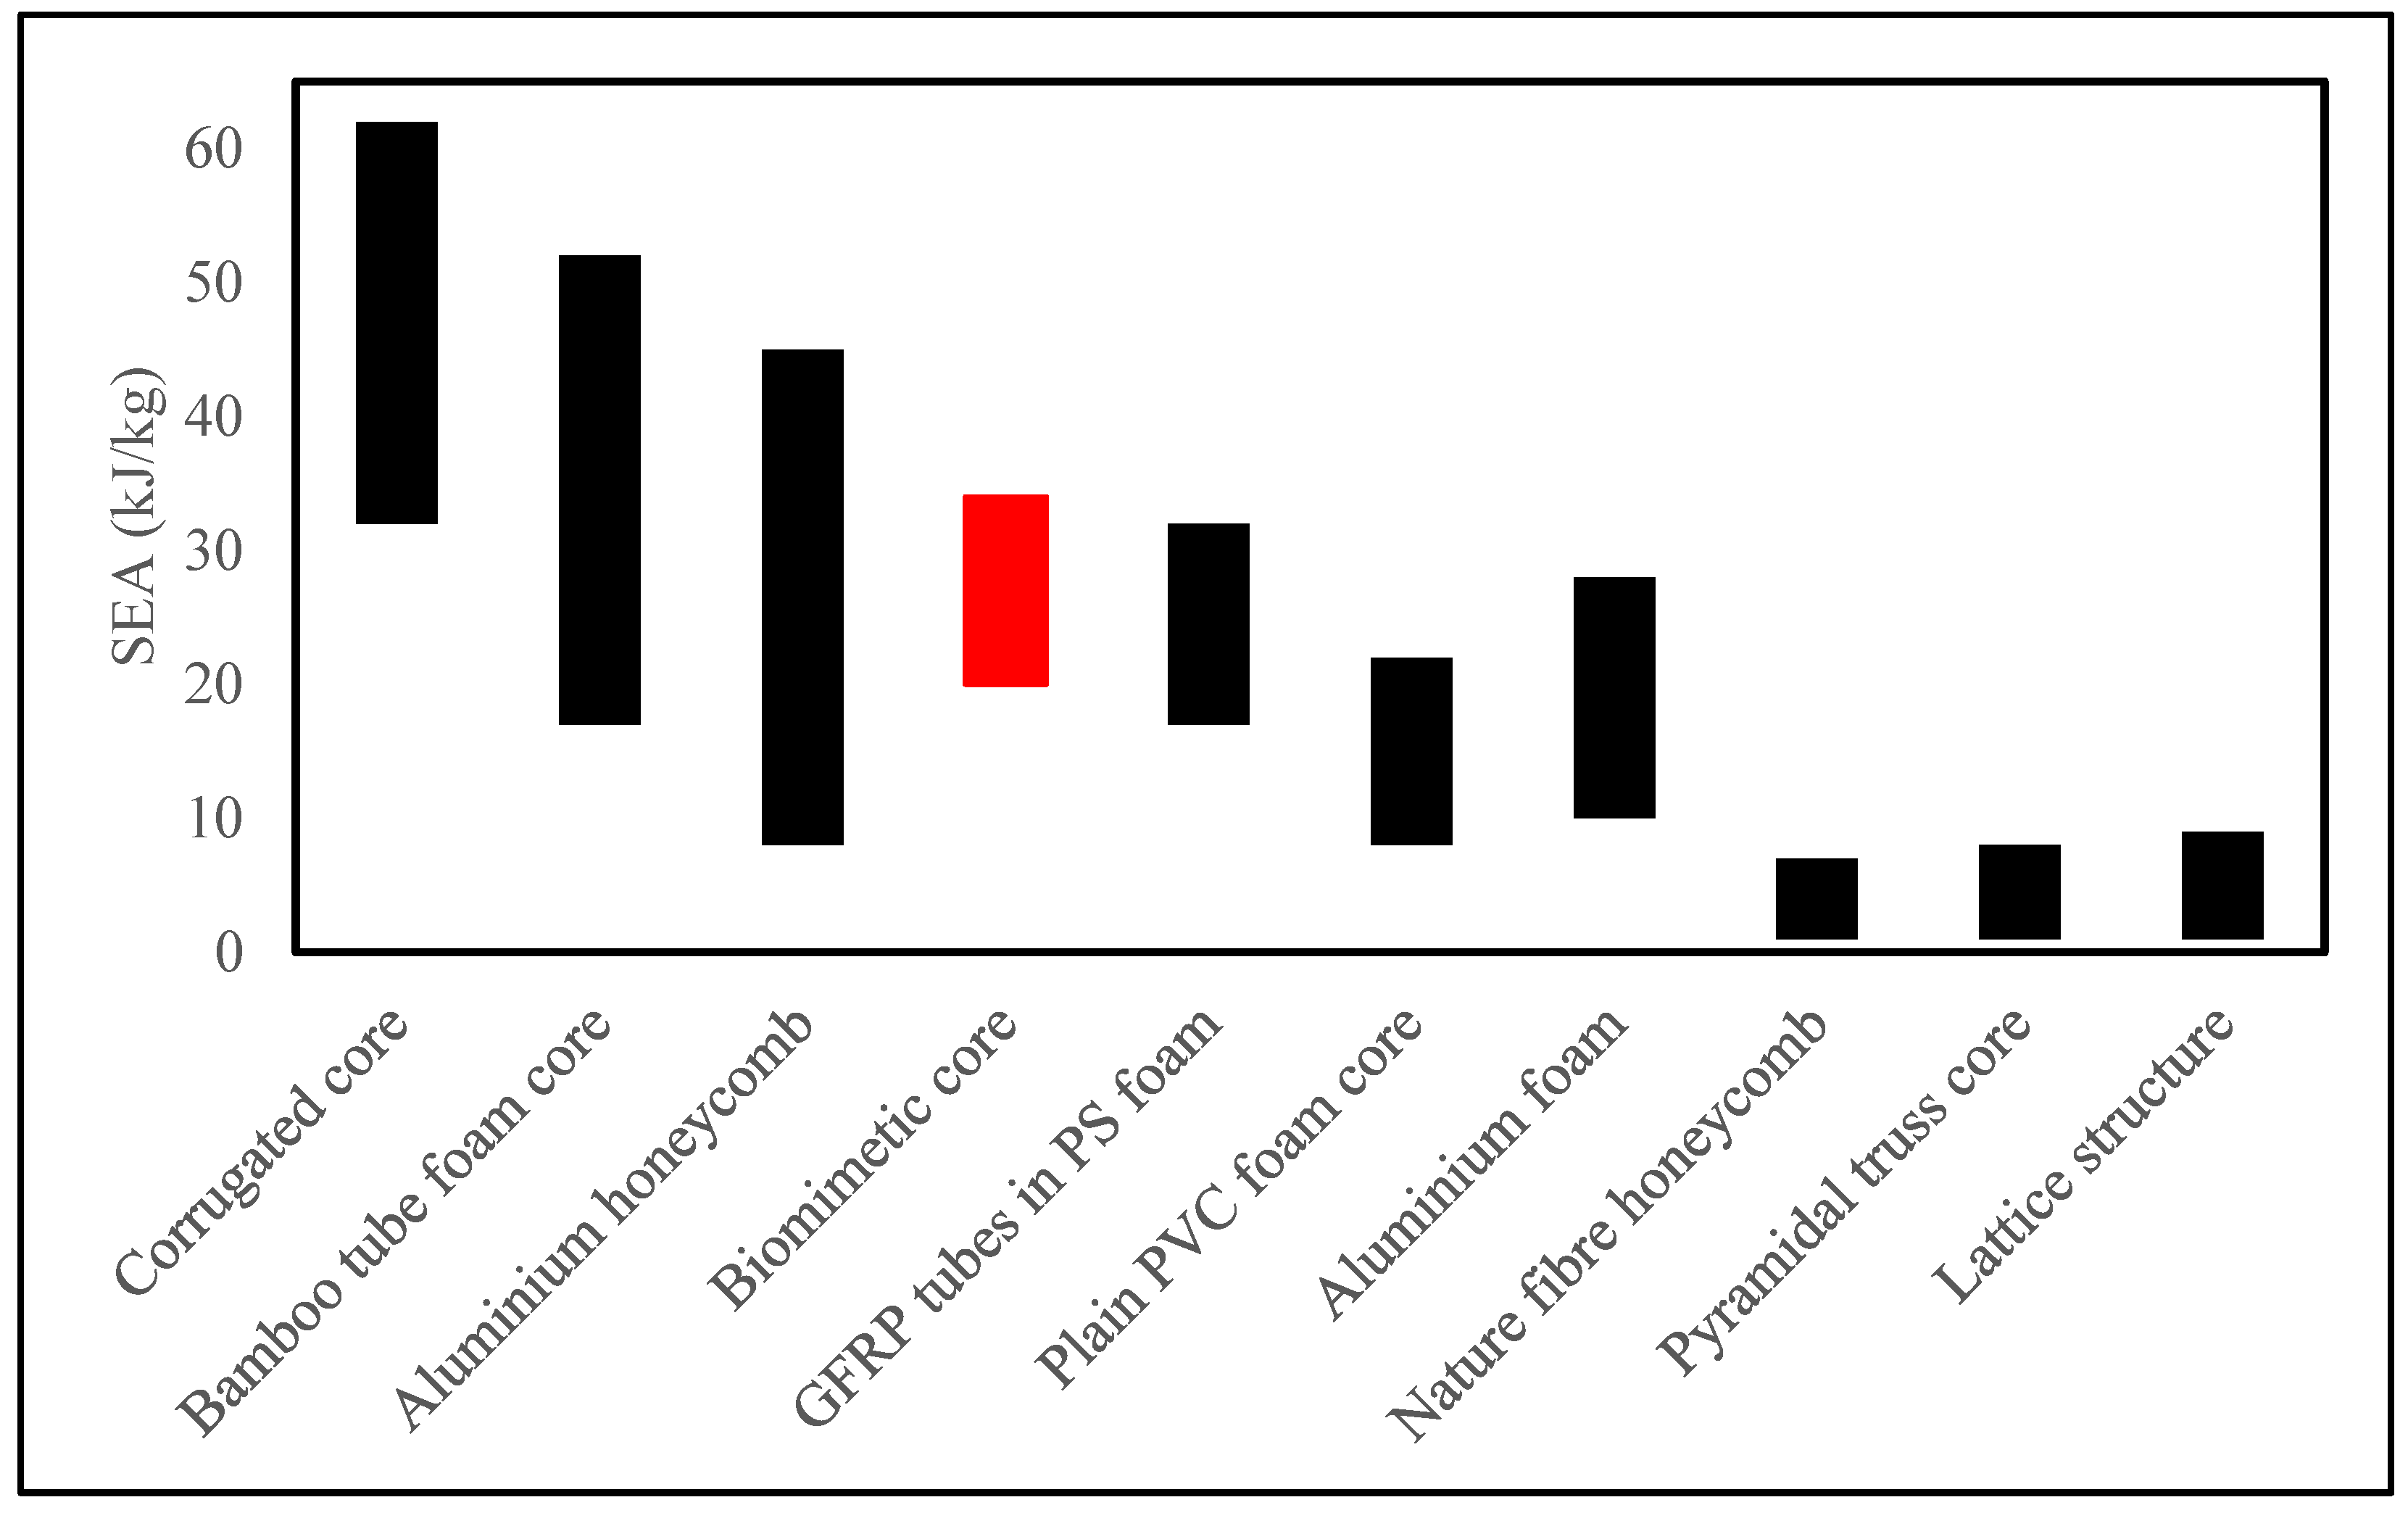
- Regarding SEA, the biomimetic-designed specimen outperformed the other types of cores, such as foams, honeycombs, lattices, and truss cores. This suggests that the proposed designs offer the potential for use in designing lightweight energy-absorbing structures.
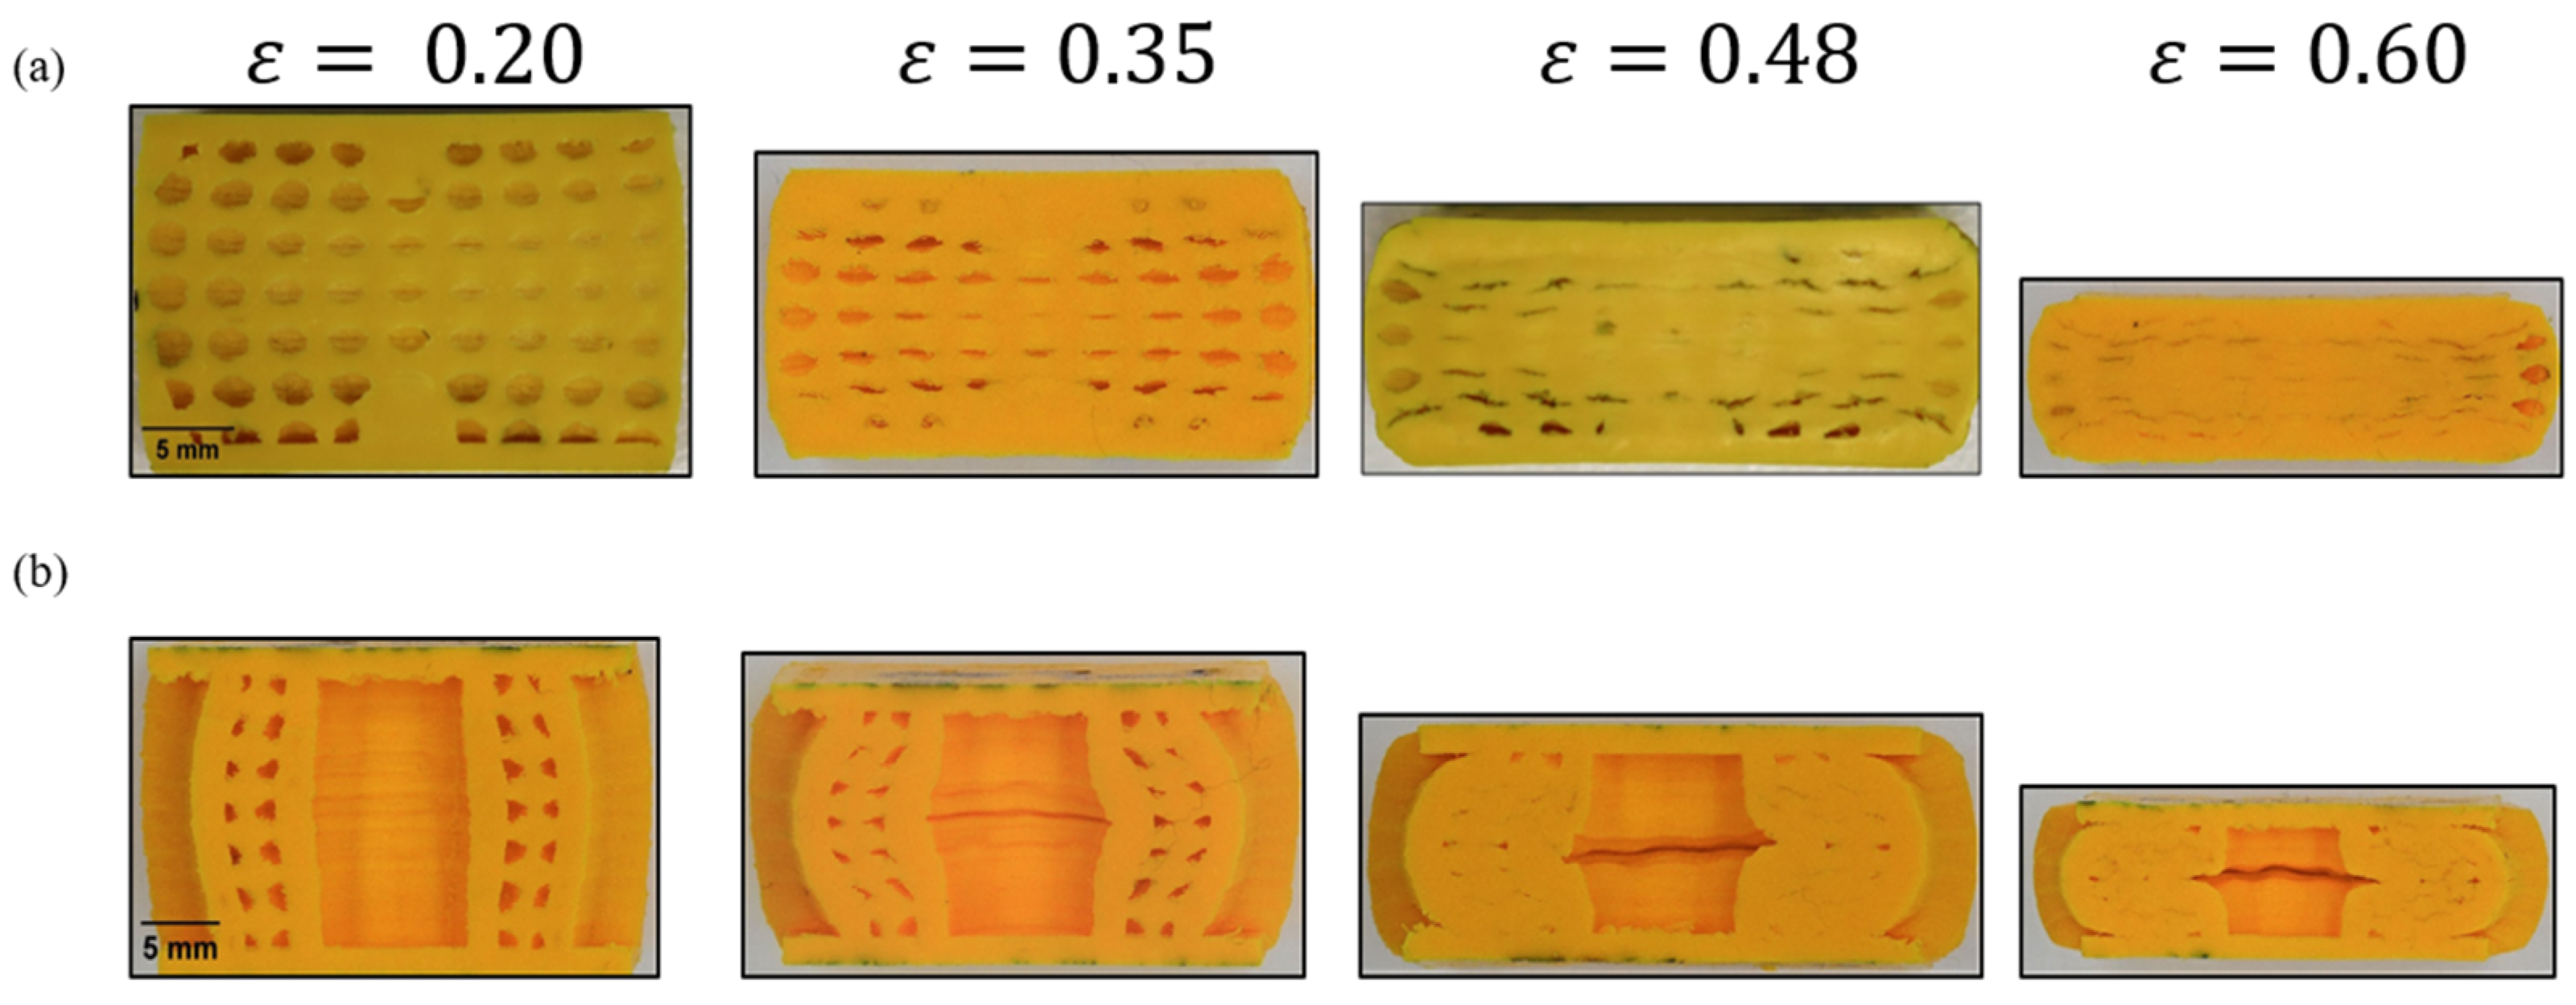
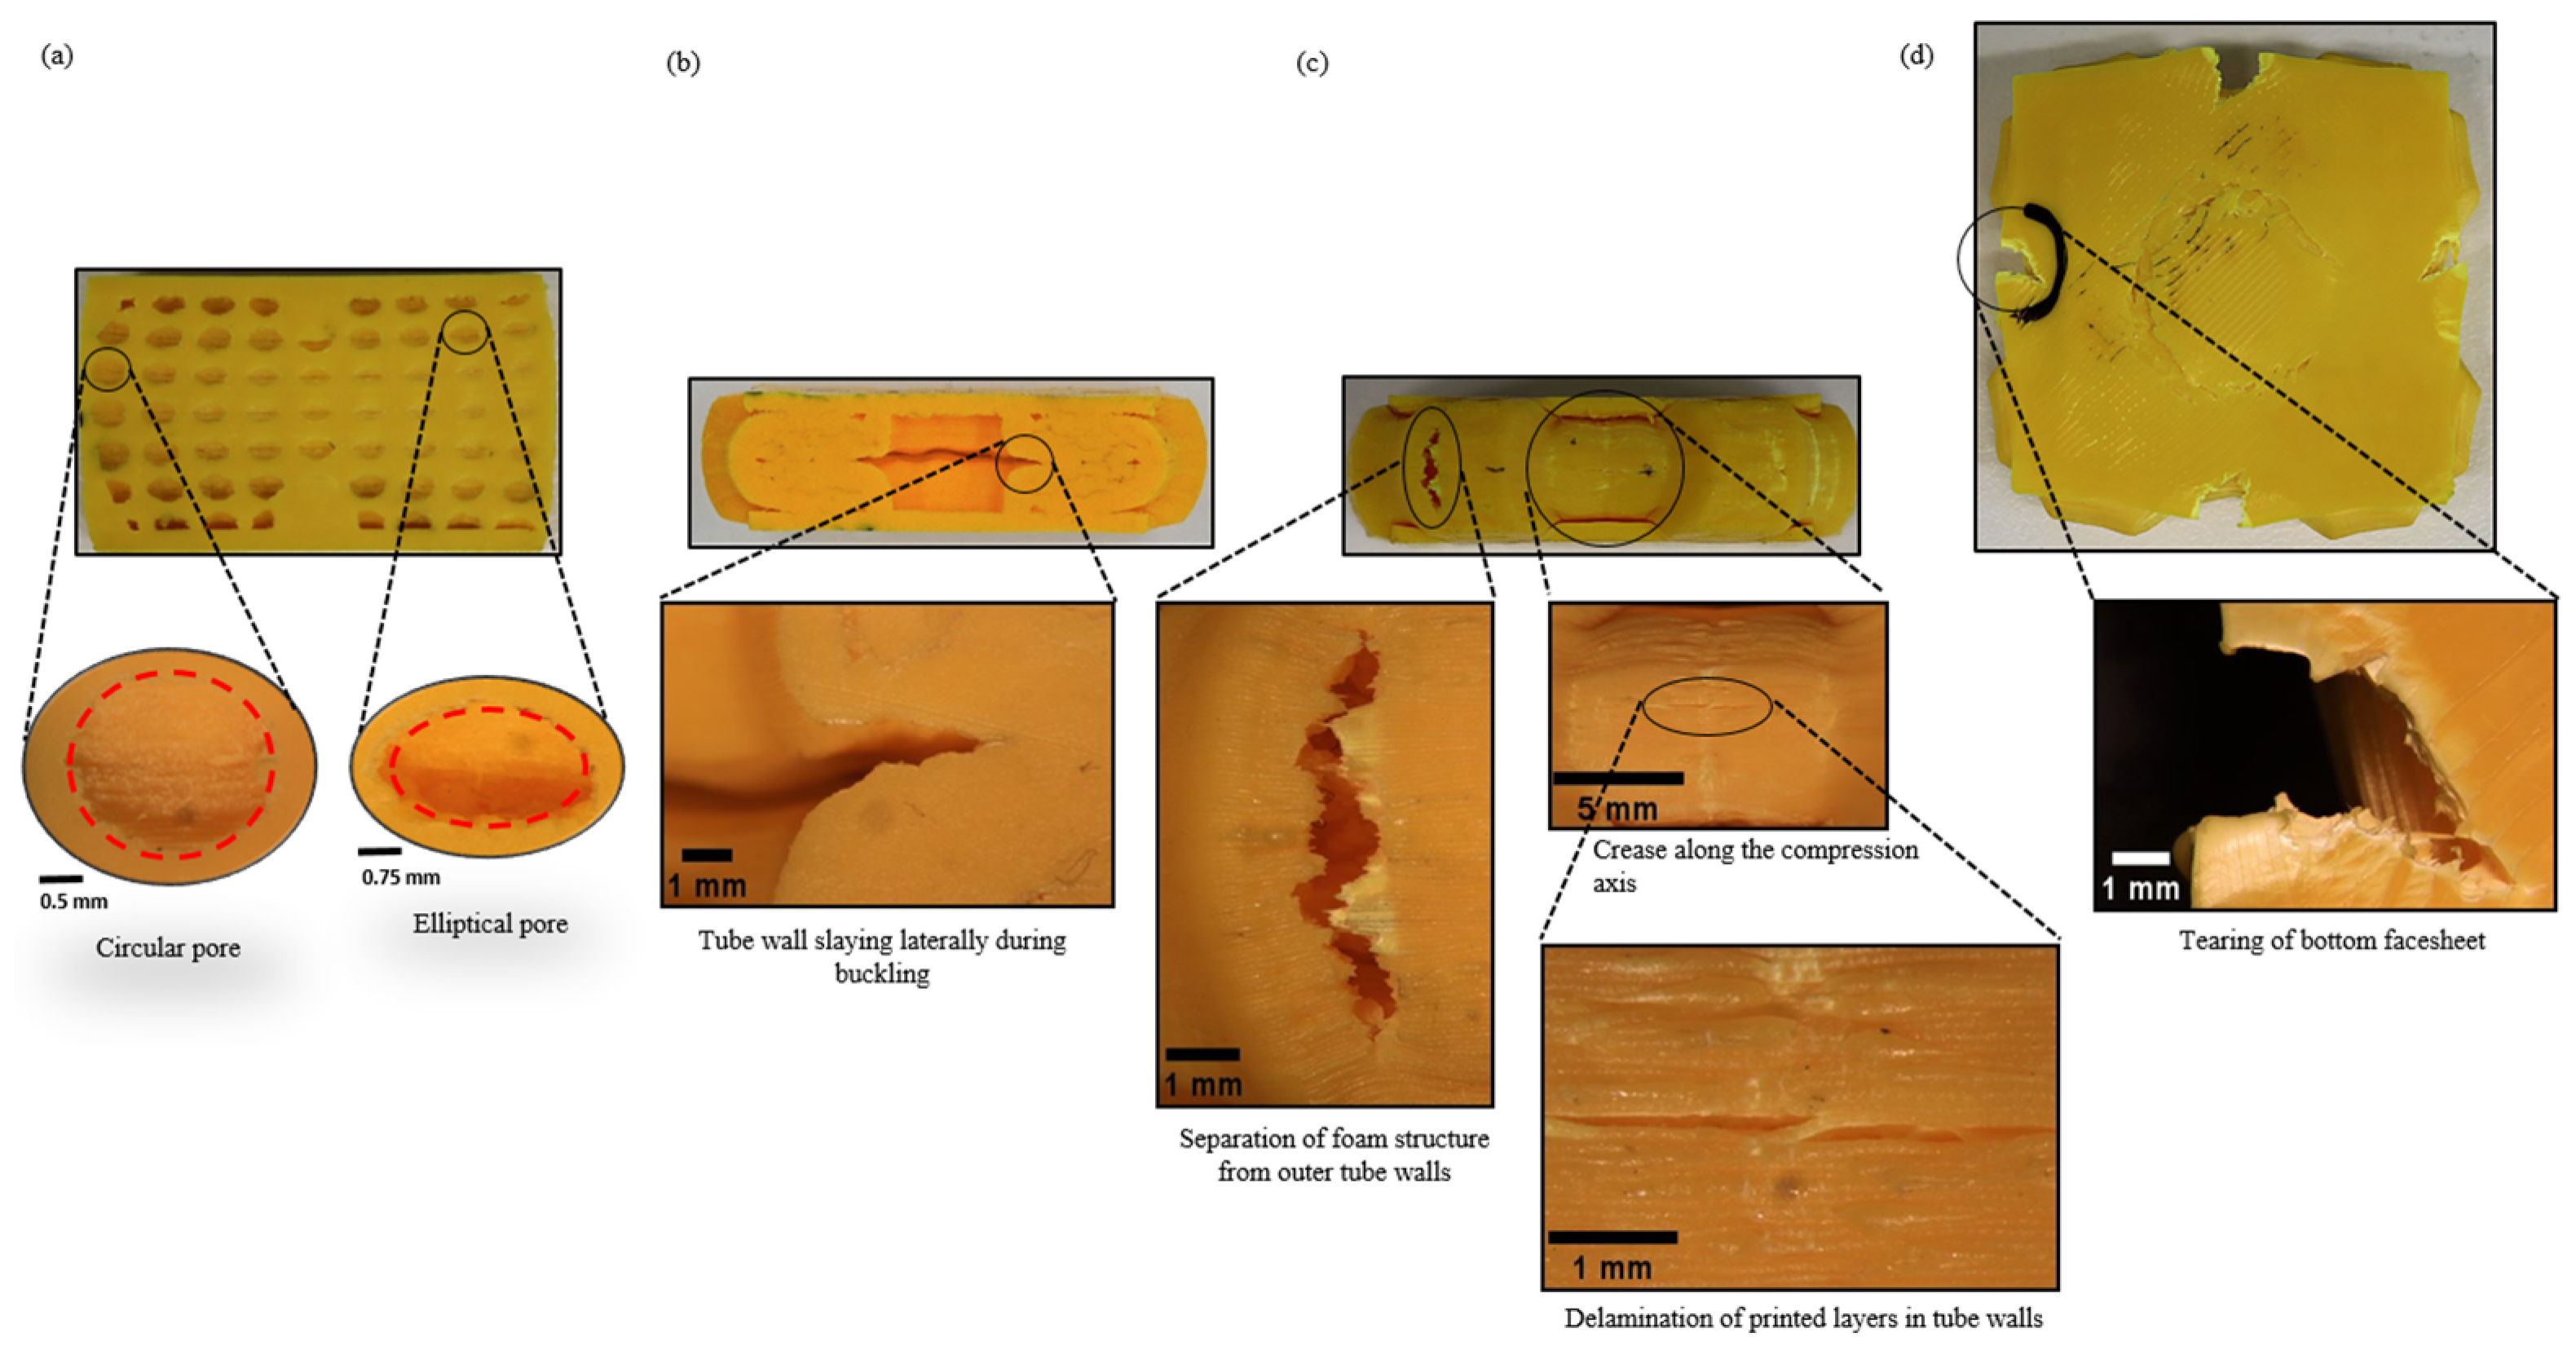
- The outer tubes failed due to the delamination of the layers in the tube walls, buckling, and crack initiation, leading to the separation of the foam core from the tube walls embedded within the matrix. Such a failure suggests that a significant amount of energy was absorbed during the compression process. The inner tube walls splayed outwards in the lateral direction during the crushing process. Localised stress was observed at the centre (perpendicular to the compressive axis) of the inner tube as the expansion propagated.
- The geometry of the pores changed and deformed plastically during the crushing process. It was noted that the vertical cell walls were more responsible for enhancing the plastic response during compression.
- The developed finite element model produced accurate and reliable results regarding the biomimetic structures’ stress–strain response, energy absorption, and deformation pattern with less than a 6% error. The difference in the results was not significantly large.
Author Contributions
Funding
Conflicts of Interest
References
- Thielen, M.; Speck, T.; Seidel, R. Viscoelasticity and compaction behaviour of the foam-like pomelo (Citrus maxima) peel. J. Mater. Sci. 2013, 48, 3469–3478. [Google Scholar] [CrossRef]
- Seki, H.; Tane, M. Effects of Pore Size Distribution and Loading Direction on Fatigue Property of Lotus-type Porous Copper. In Proceedings of the MetFoam 2007: Porous Metals and Metallic Foams: Proceedings of the Fifth International Conference on Porous Metals and Metallic Foams, Montreal, QC, Canada, 5–7 September 2007; DEStech Publications, Inc.: Lancaster, PA, USA, 2008. [Google Scholar]
- Rhee, H.; Horstemeyer, M.; Ramsay, A. A study on the structure and mechanical behavior of the Dasypus novemcinctus shell. Mater. Sci. Eng. C 2010, 31, 363–369. [Google Scholar] [CrossRef]
- Vasquez-Sancho, F.; Abdollahi, A.; Damjanovic, D.; Catalan, G. Flexoelectricity in bones. Adv. Mater. 2018, 30, 1705316. [Google Scholar] [CrossRef] [PubMed]
- Hazell, P.J. Armour: Materials, Theory, and Design; CRC Press: Boca Raton, FL, USA, 2022. [Google Scholar]
- Weerasinghe, D.; Breen, S.; Wang, H.; Mohotti, D.; Hazell, P.J.; Escobedo-Diaz, J. Impact resistance and yarn pull-out behaviour of polymer spray-coated UHMWPE fabrics. Mater. Today Commun. 2022, 33. [Google Scholar] [CrossRef]
- Serubibi, A.; Hazell, P.; Escobedo, J.; Wang, H.; Oromiehie, E.; Prusty, B. Low-velocity impact behaviours of AFP manufactured fibre metal laminate structures. Mater. Today: Proc. 2021, 59, 421–429. [Google Scholar] [CrossRef]
- Wang, C.; Su, D.; Xie, Z.; Wang, H.; Hazell, P.J.; Zhang, Z.; Zhou, M. Dynamic behaviour of Bio-inspired heterocyclic aramid Fibre-reinforced laminates subjected to Low-velocity Drop-weight impact. Compos. Part A Appl. Sci. Manuf. 2021, 153, 106733. [Google Scholar] [CrossRef]
- Tane, M.; Zhao, F.; Song, Y.; Nakajima, H. Formation mechanism of a plateau stress region during dynamic compression of porous iron: Interaction between oriented cylindrical pores and deformation twins. Mater. Sci. Eng. A 2013, 591, 150–158. [Google Scholar] [CrossRef]
- Rhee, H.; Tucker, M.T.; Whittington, W.R.; Horstemeyer, M.F.; Lim, H. Structure-property responses of bio-inspired synthetic foams at low and high strain rates. Sci. Eng. Compos. Mater. 2015, 22. [Google Scholar] [CrossRef]
- An, X.; Fan, H. Hybrid design and energy absorption of luffa-sponge-like hierarchical cellular structures. Mater. Des. 2016, 106, 247–257. [Google Scholar] [CrossRef]
- Bührig-Polaczek, A.; Fleck, C.; Speck, T.; Schüler, P.; Fischer, S.F.; Caliaro, M.; Thielen, M. Biomimetic cellular metals—Using hierarchical structuring for energy absorption. Bioinspiration Biomim. 2016, 11, 045002. [Google Scholar] [CrossRef]
- Yi, Z.; Si-Yuan, H.; Jia-Gui, L.; Wei, Z.; Xiao-Lu, G.; Jin, Y. Density gradient tailoring of aluminum foam-filled tube. Compos. Struct. 2019, 220, 451–459. [Google Scholar] [CrossRef]
- Islam, M.K.; Hazell, P.J.; Escobedo, J.P.; Wang, H. Biomimetic armour design strategies for additive manufacturing: A review. Mater. Des. 2021, 205, 109730. [Google Scholar] [CrossRef]
- Ahamed, M.K.; Wang, H.; Hazell, P.J. From biology to biomimicry: Using nature to build better structures—A review. Constr. Build. Mater. 2022, 320, 126195. [Google Scholar] [CrossRef]
- Siddique, S.H.; Hazell, P.J.; Wang, H.; Escobedo, J.P.; Ameri, A.A. Lessons from nature: 3D printed bio-inspired porous structures for impact energy absorption—A review. Addit. Manuf. 2022, 58. [Google Scholar] [CrossRef]
- Song, J.; Xu, S.; Xu, L.; Zhou, J.; Zou, M. Experimental study on the crashworthiness of bio-inspired aluminum foam-filled tubes under axial compression loading. Thin-Walled Struct. 2020, 155, 106937. [Google Scholar] [CrossRef]
- Sun, G.; Chen, D.; Wang, H.; Hazell, P.J.; Li, Q. High-velocity impact behaviour of aluminium honeycomb sandwich panels with different structural configurations. Int. J. Impact Eng. 2018, 122, 119–136. [Google Scholar] [CrossRef]
- Sun, G.; Huo, X.; Wang, H.; Hazell, P.J.; Li, Q. On the structural parameters of honeycomb-core sandwich panels against low-velocity impact. Compos. Part B: Eng. 2021, 216, 108881. [Google Scholar] [CrossRef]
- Shah, D.U.; Reynolds, T.; Ramage, M.H. The strength of plants: Theory and experimental methods to measure the mechanical properties of stems. J. Exp. Bot. 2017, 68, 4497–4516. [Google Scholar] [CrossRef]
- Chen, H. Lignocellulose Biorefinery Engineering: Principles and Applications; Woodhead Publishing: Cambridge, UK, 2015. [Google Scholar]
- Bueckert, R.A. Simulated hail damage and yield reduction in lentil. Can. J. Plant Sci. 2011, 91, 117–124. [Google Scholar] [CrossRef]
- Vollmer, J.; Johnson, B.L.; Deckard, E.L.; Rahman, M. Evaluation of simulated hail damage on seed yield and agronomic traits in canola (Brassica napus L.). Can. J. Plant Sci. 2020, 100, 597–608. [Google Scholar] [CrossRef]
- Li, Y.; Qin, T.; Chen, J.; Zhao, Z. Experiments and analysis on mechanical property of corn stalk reciprocating cutting. Trans. Chin. Soc. Agric. Eng. 2011, 27, 160–164. [Google Scholar]
- Robertson, D.J.; Julias, M.; Gardunia, B.W.; Barten, T.; Cook, D.D. Corn Stalk Lodging: A Forensic Engineering Approach Provides Insights into Failure Patterns and Mechanisms. Crop Sci. 2015, 55, 2833–2841. [Google Scholar] [CrossRef]
- He, X.; Wang, D. Tensile property of corn stalk rind based on analysis of fiber morphology. Trans. Chin. Soc. Agric. Eng. 2015, 31, 92–98. [Google Scholar]
- Liu, L.; Bing, Y.; Dong, X.; Ai, Q.; Yang, X. Effects of loading conditions on cracks of corn stalk and power consumption of machine. Trans. Chin. Soc. Agric. Eng. 2014, 30, 163–169. [Google Scholar]
- Chen, Y.; Wu, K.; Zhang, J.; Nong, K.; Li, J.; Li, W. Relationship between corn lodging resistance and mechanical parameters. Nongye Jixie Xuebao=Trans. Chin. Soc. Agric. Mach. 2011, 42, 89–92. [Google Scholar]
- Yuming, G.; Hongmei, Y.; Yan, Y. Biomechanical evaluation and grey relational analysis of lodging resistance of stalk crops. Trans. Chin. Soc. Agric. Eng. 2007, 23, 14–18. [Google Scholar]
- Yu, Y.; Mao, M.; Pan, J. Study on the moisture content and tensile properties of corn straw. Chin. Agric. Mech. 2012, 4, 75–77. [Google Scholar]
- Zhang, T.; Zhao, M.; Liu, F.; Tian, H.; Wulan, T.; Yue, Y.; Li, D. A discrete element method model of corn stalk and its mechanical characteristic parameters. Bioresources 2020, 15, 9337. [Google Scholar] [CrossRef]
- Jia, H.; Li, C.; Zhang, Z.; Wang, G. Design of Bionic Saw Blade for Corn Stalk Cutting. J. Bionic Eng. 2013, 10, 497–505. [Google Scholar] [CrossRef]
- Zhang, K.; He, Y.; Zhang, H.; Li, H. Research on mechanical properties of corn stalk. AIP Conf. Proc. 2017, 1808, 50007. [Google Scholar] [CrossRef]
- du Plessis, A.; Razavi, S.M.J.; Benedetti, M.; Murchio, S.; Leary, M.; Watson, M.; Bhate, D.; Berto, F. Properties and applications of additively manufactured metallic cellular materials: A review. Prog. Mater. Sci. 2022, 125, 100918. [Google Scholar] [CrossRef]
- Hoffmann, K.G.; Haag, K.; Müssig, J. Biomimetic approaches towards lightweight composite structures for car interior parts. Mater. Des. 2021, 212, 110281. [Google Scholar] [CrossRef]
- Ebrahimi, F.; Qaderi, S. Stability analysis of embedded graphene platelets reinforced composite plates in thermal environment. Eur. Phys. J. Plus 2019, 134, 349. [Google Scholar] [CrossRef]
- Qaderi, S.; Ebrahimi, F.; Seyfi, A. An investigation of the vibration of multi-layer composite beams reinforced by graphene platelets resting on two parameter viscoelastic foundation. SN Appl. Sci. 2019, 1, 399. [Google Scholar] [CrossRef]
- du Plessis, A.; Broeckhoven, C. Chapter 10—Functional synergy of biomimicry and additive manufacturing: Toward a bio-enhanced engineering approach. In Biomimicry for Materials, Design and Habitats; Eggermont, M., Shyam, V., Hepp, A.F., Eds.; Elsevier: Amsterdam, The Netherlands, 2022; pp. 269–289. [Google Scholar]
- du Plessis, A.; Broeckhoven, C.; Yadroitsava, I.; Yadroitsev, I.; Hands, C.H.; Kunju, R.; Bhate, D. Beautiful and Functional: A Review of Biomimetic Design in Additive Manufacturing. Addit. Manuf. 2019, 27, 408–427. [Google Scholar] [CrossRef]
- Du Plessis, A.D.; Broeckhoven, C.; Yadroitsev, I.; Yadroitsava, I.; le Roux, S. Analyzing nature’s protective design: The glyptodont body armor. J. Mech. Behav. Biomed. Mater. 2018, 82, 218–223. [Google Scholar] [CrossRef]
- Abdel-Wahab, A.A.; Maligno, A.R.; Silberschmidt, V.V. Micro-scale modelling of bovine cortical bone fracture: Analysis of crack propagation and microstructure using X-FEM. Comput. Mater. Sci. 2011, 52, 128–135. [Google Scholar] [CrossRef]
- Motta, J.D.C.; Qaderi, S.; Farina, I.; Singh, N.; Amendola, A.; Fraternali, F. Experimental characterization and mechanical modeling of additively manufactured TPU components of innovative seismic isolators. Acta Mech. 2022, 1–12. [Google Scholar] [CrossRef]
- Standard, A. Standard test method for tensile properties of plastics, D 638–08. Annu. Book ASTM Stand. 2009, 8, 1–17. [Google Scholar]
- Gorana, F.; Sahu, K.K.; Modi, Y.K. Parameter optimization for dimensional accuracy of fused deposition modelling parts. Mater. Today Proc. 2022, in press. [Google Scholar] [CrossRef]
- Sun, G.; Wang, E.; Wang, H.; Xiao, Z.; Li, Q. Low-velocity impact behaviour of sandwich panels with homogeneous and stepwise graded foam cores. Mater. Des. 2018, 160, 1117–1136. [Google Scholar] [CrossRef]
- Zhou, J.; Guan, Z.; Cantwell, W. The energy-absorbing behaviour of composite tube-reinforced foams. Compos. Part B Eng. 2018, 139, 227–237. [Google Scholar] [CrossRef]
- Smith, M.; Guan, Z.; Cantwell, W. Finite element modelling of the compressive response of lattice structures manufactured using the selective laser melting technique. Int. J. Mech. Sci. 2012, 67, 28–41. [Google Scholar] [CrossRef]
- McKown, S.; Shen, Y.; Brookes, W.; Sutcliffe, C.; Cantwell, W.; Langdon, G.; Nurick, G.; Theobald, M. The quasi-static and blast loading response of lattice structures. Int. J. Impact Eng. 2008, 35, 795–810. [Google Scholar] [CrossRef]
- Xiong, J.; Vaziri, A.; Ma, L.; Papadopoulos, J.; Wu, L. Compression and impact testing of two-layer composite pyramidal-core sandwich panels. Compos. Struct. 2012, 94, 793–801. [Google Scholar] [CrossRef]
- Zuhri, M.Y.; Guan, Z.W.; Cantwell, W.J. The mechanical properties of natural fibre based honeycomb core materials. Compos. Part B Eng. 2014, 58, 1–9. [Google Scholar] [CrossRef]
- Altenaiji, M.; Guan, Z.; Cantwell, W.; Zhao, Y.; Schleyer, G. Characterisation of aluminium matrix syntactic foams under drop weight impact. Mater. Des. 2014, 59, 296–302. [Google Scholar] [CrossRef]
- Heimbs, S. Energy absorption in aircraft structures. In International Workshop on Hydraulic Equipment and Support Systems for Mining; Trans Tech Publ. Ltd.: Zurich, Switzerland, 2012. [Google Scholar]
- Umer, R.; Balawi, S.; Raja, P.; Cantwell, W.; Cantwell, W. The energy-absorbing characteristics of polymer foams reinforced with bamboo tubes. J. Sandw. Struct. Mater. 2013, 16, 108–122. [Google Scholar] [CrossRef]
- Rejab, M.; Cantwell, W. The mechanical behaviour of corrugated-core sandwich panels. Compos. Part B Eng. 2012, 47, 267–277. [Google Scholar] [CrossRef]
- Boria, S. 13—Lightweight design and crash analysis of composites. In Lightweight Composite Structures in Transport; Njuguna, J., Ed.; Woodhead Publishing: Cambridge, UK, 2016; pp. 329–360. [Google Scholar]
- Kader, M.; Hazell, P.; Brown, A.; Tahtali, M.; Ahmed, S.; Escobedo, J.; Saadatfar, M. Novel design of closed-cell foam structures for property enhancement. Addit. Manuf. 2019, 31, 100976. [Google Scholar] [CrossRef]
- Neff, C.; Hopkinson, N.; Crane, N.B. Experimental and analytical investigation of mechanical behavior of laser-sintered diamond-lattice structures. Addit. Manuf. 2018, 22, 807–816. [Google Scholar] [CrossRef]
- Bonatti, C.; Mohr, D. Large deformation response of additively-manufactured FCC metamaterials: From octet truss lattices towards continuous shell mesostructures. Int. J. Plast. 2017, 92, 122–147. [Google Scholar] [CrossRef]


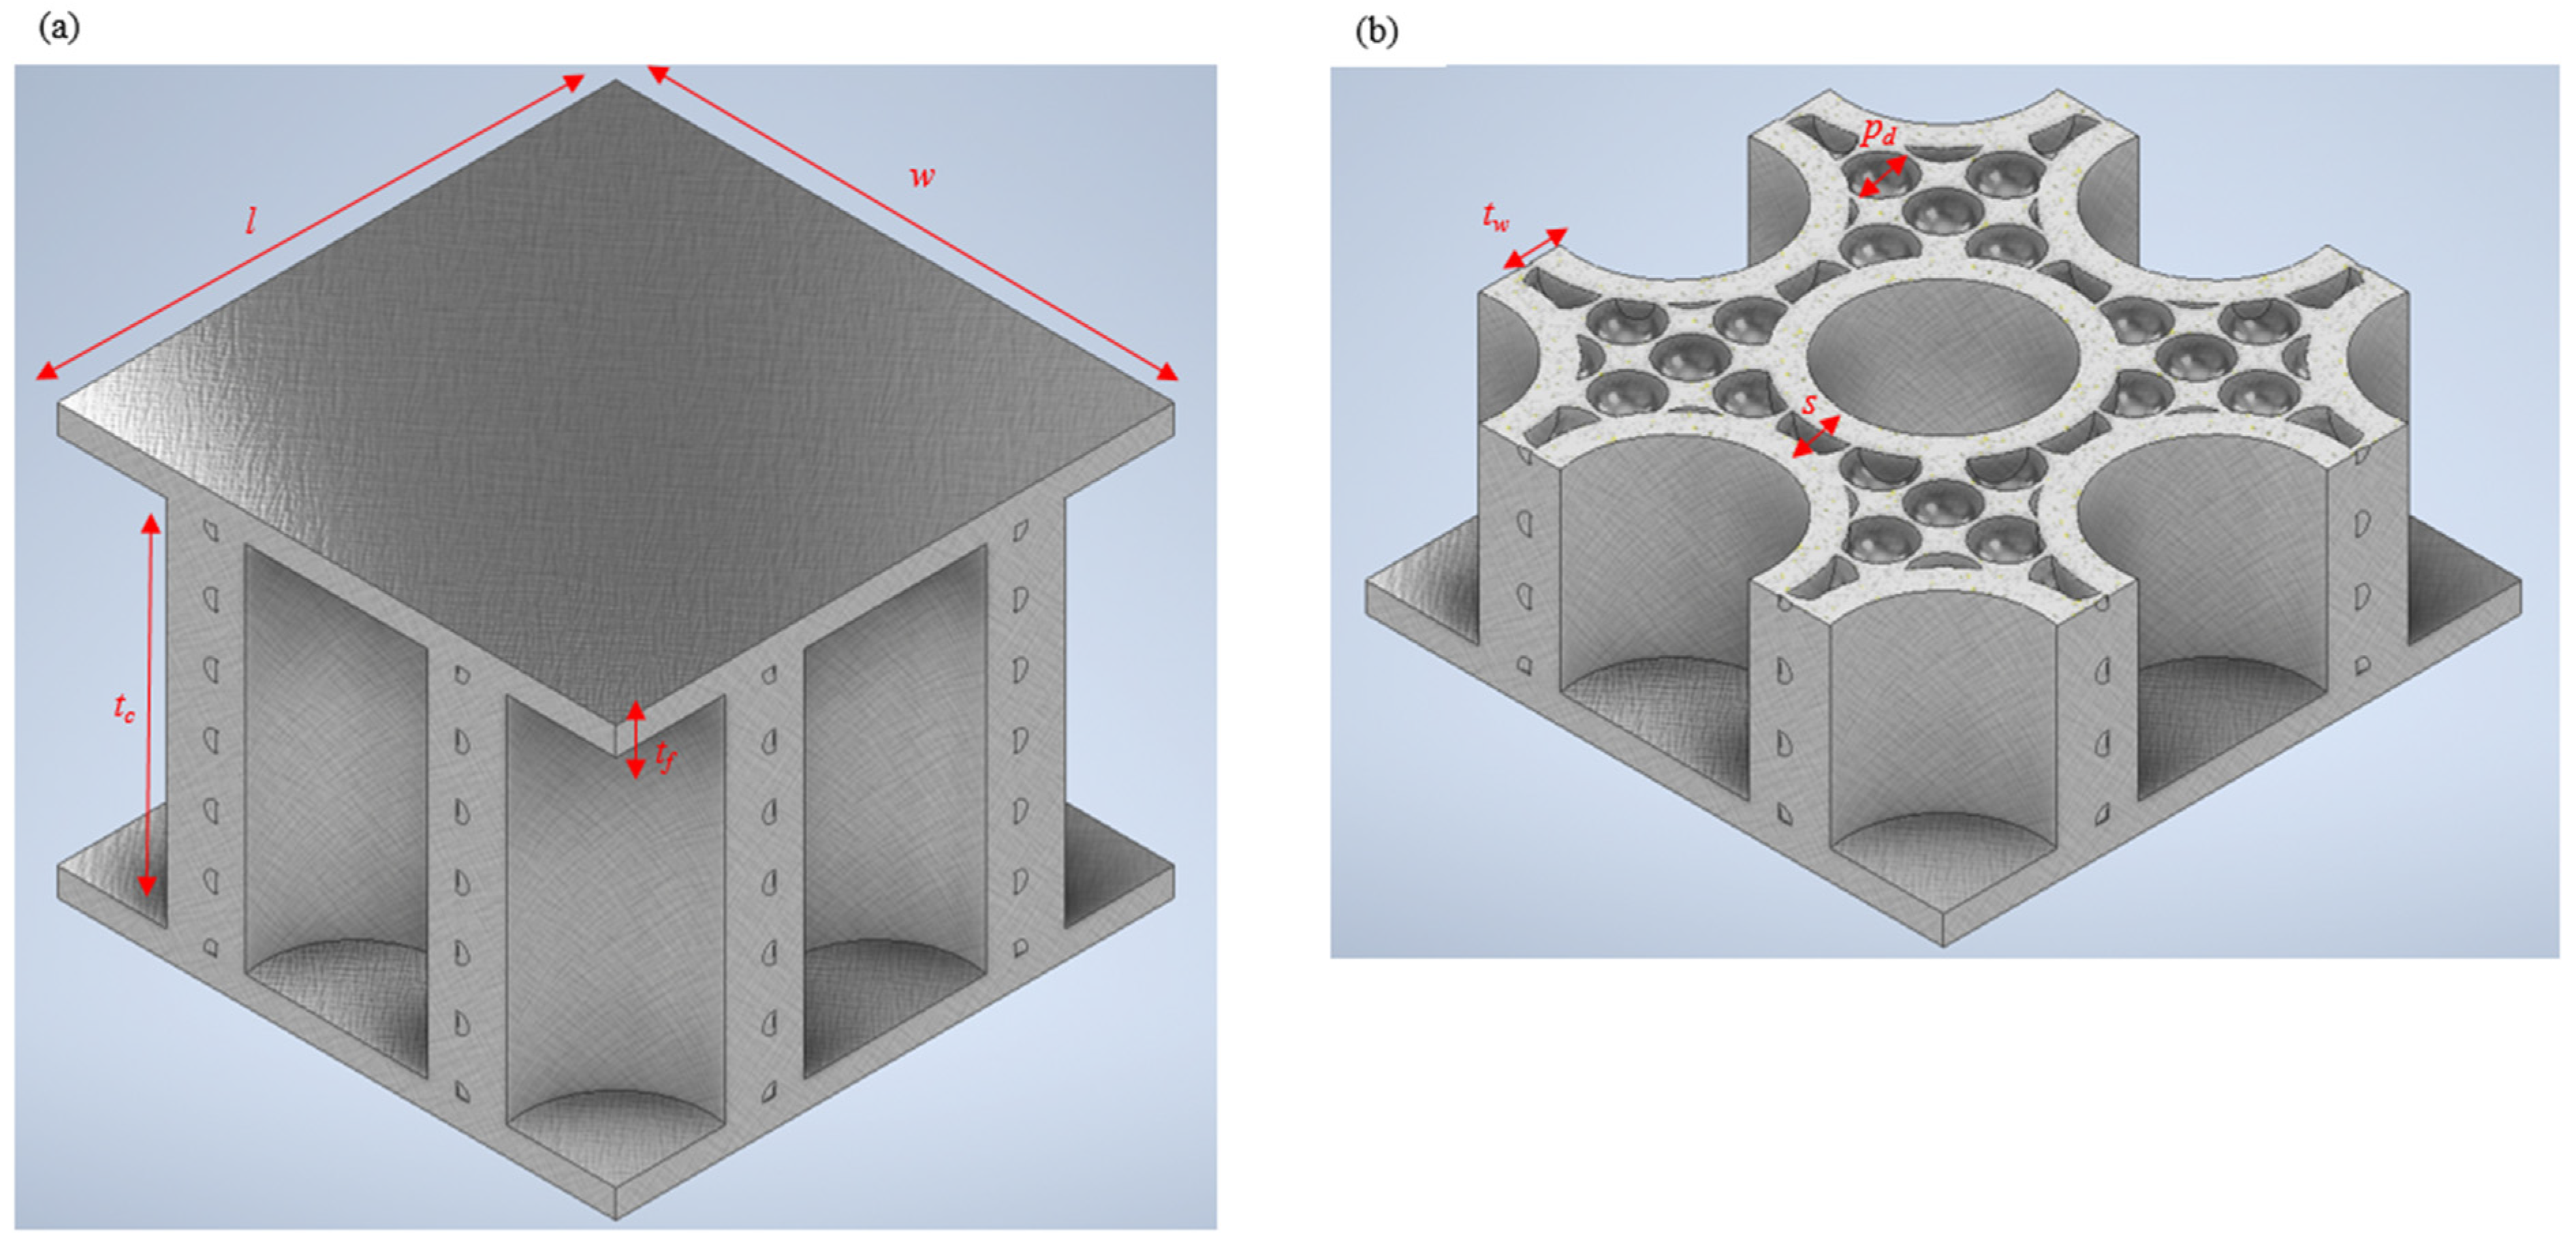
| Length (l) | Width (w) | Core Thickness (tc) | Facesheet Thickness (tf) | Total Thickness (t) | |
|---|---|---|---|---|---|
| Dimensions | 30 | 30 | 20 | 1.5 | 23 |
| Specimen ID | Wall Thickness (tw) | Outer Diameter (do) | Inner Diameter (di) | Spacing (s) | Pore Diameter (pd) | Mass | Relative Density, |
|---|---|---|---|---|---|---|---|
| T1.5S3 | 1.5 | 13 | 10 | 3 | 3 | 14.8 | 0.58 |
| T2S2 | 2 | 14 | 10 | 2 | 3 | 15.1 | 0.62 |
| T2.5S1 | 2.5 | 15 | 10 | 1 | 3 | 16.2 | 0.65 |
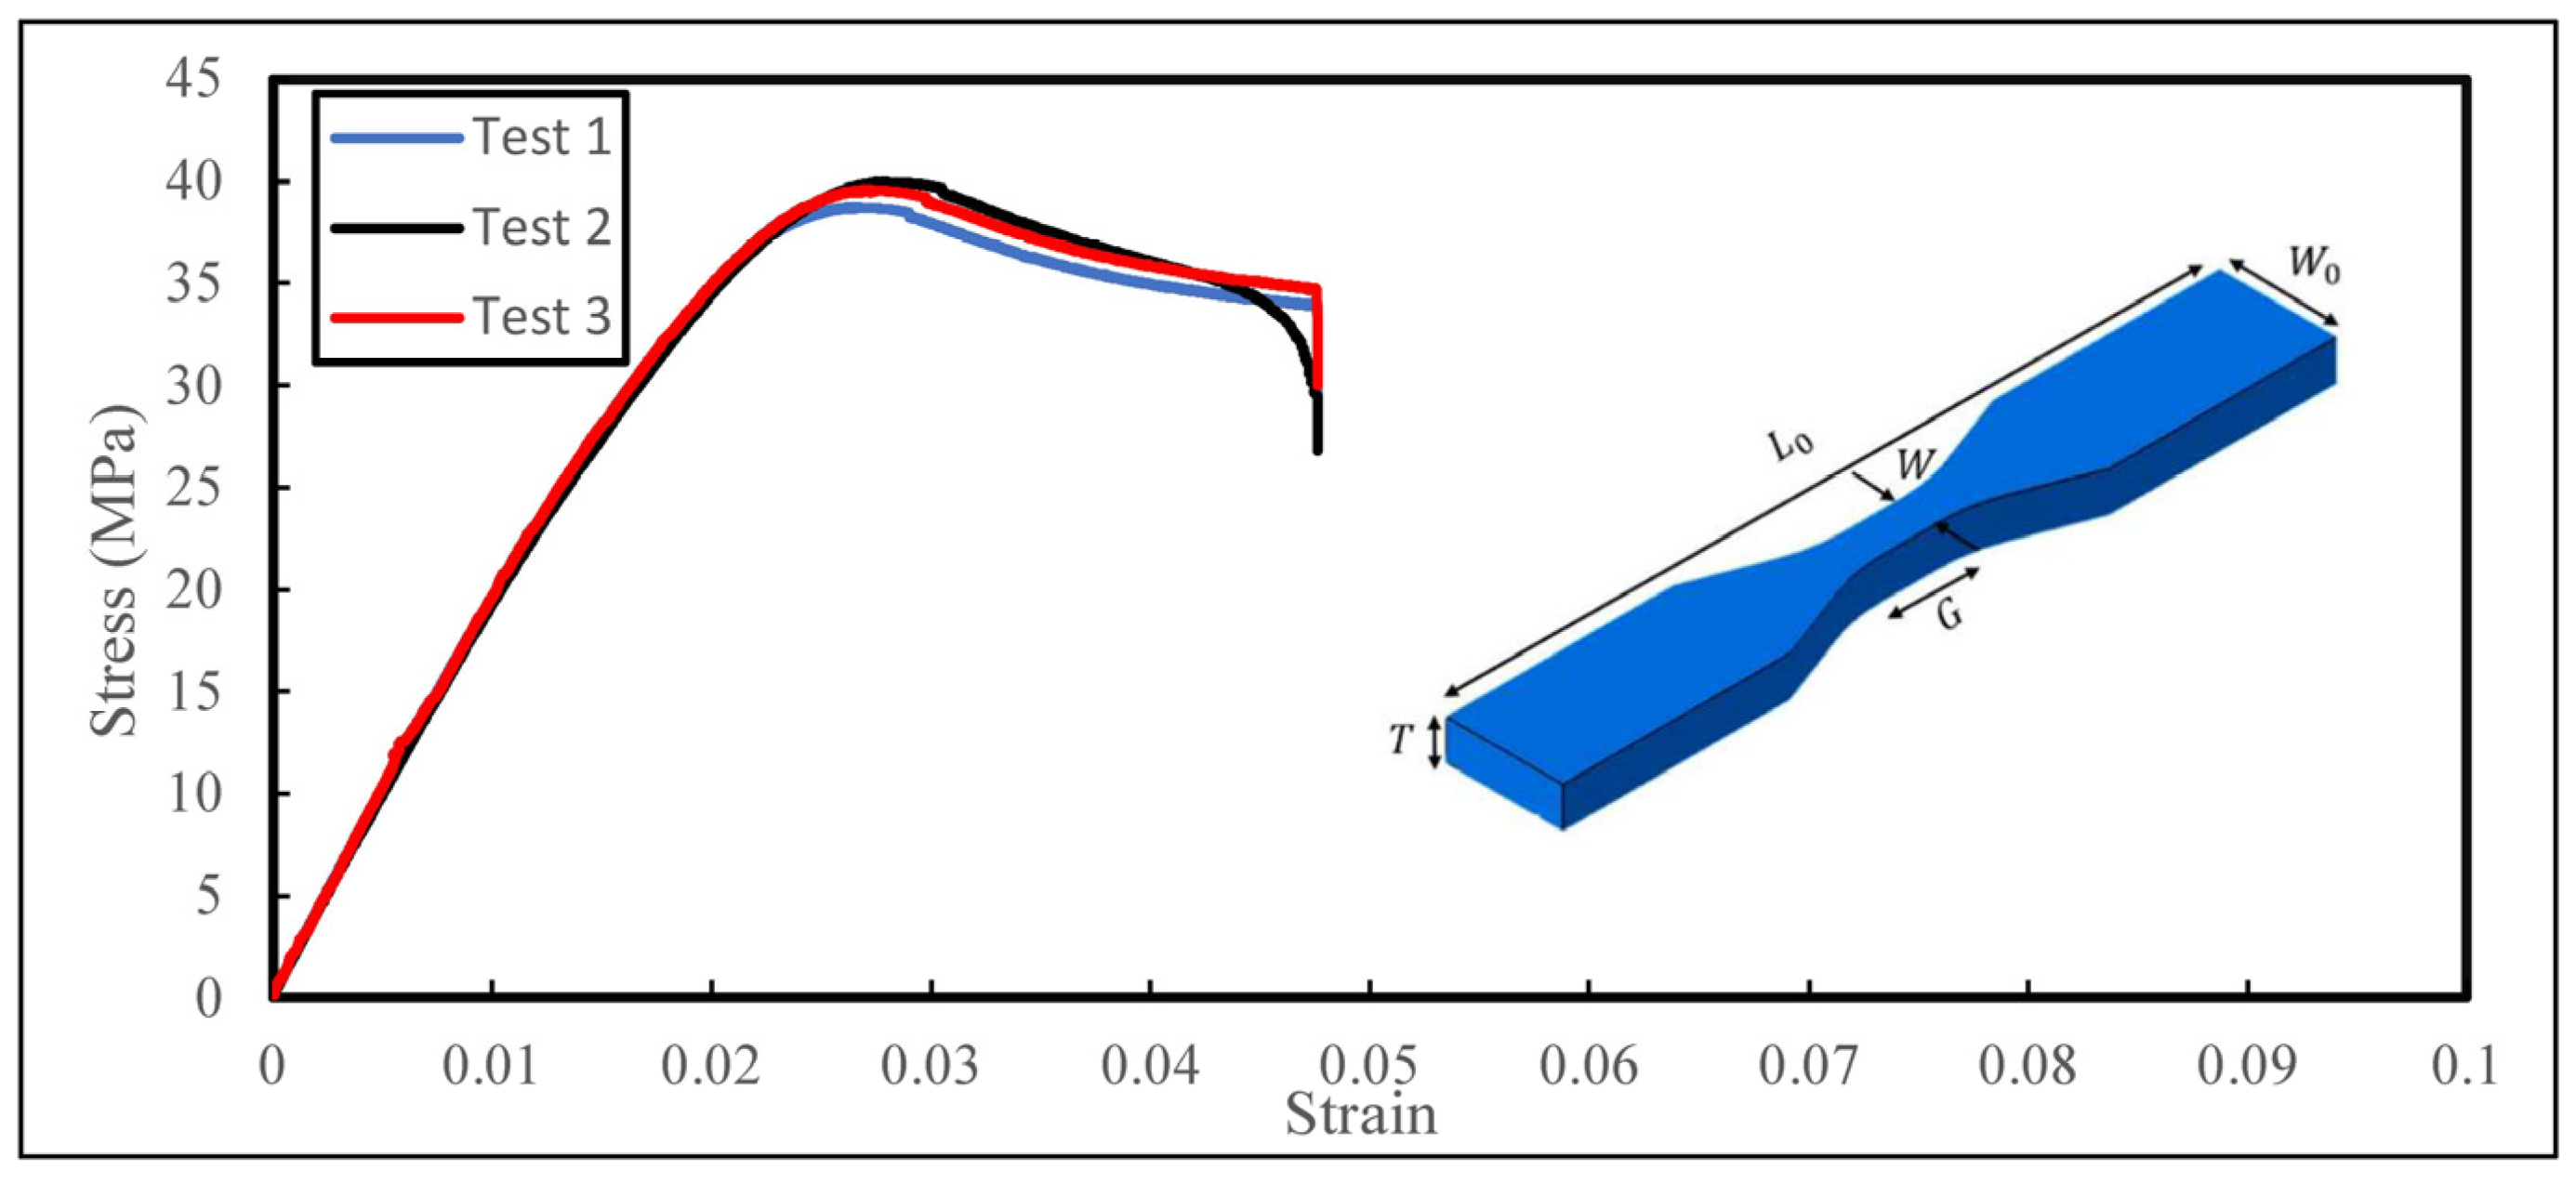
| Length | Width of Narrow Section (W) | Gauge Length (G) | Width Overall | Thickness (T) | |
|---|---|---|---|---|---|
| Dimensions | 115 | 6 | 25 | 19 | 4 |
| Properties | ABS |
|---|---|
| Density (g/cm3) | 1068 |
| Young’s modulus (GPa) | 1.85 |
| Yield strength (MPa) | 36 |
| Ultimate strength (MPa) | 40 |
| Poisson’s ratio | 0.35 |
| Failure strain at break | 0.047 |
| Hardness (shore D) | 76 |
| Printing Conditions | Parameters |
|---|---|
| Layer height (mm) | 0.1 |
| Infill (%) | 100 |
| Printing speed (mm/s) | 55 |
| Size of nozzle head (mm) | 0.25 |
| Nozzle head temperature °C | 250 |
| Build platform temperature °C | 85 |
| Brim (mm) | 4 |
| Maximum Compressive Stress (MPa) | |||
|---|---|---|---|
| Displacement Limit | T2.5S1 | T2S2 | T1.5S3 |
| 1 mm (4%) Elastic | 30.6 ± 0.3 | 27.0 ± 0.3 | 23.7 ± 0.3 |
| 10 mm (43%) Plateau | 43.5 ± 0.3 | 37.8 ± 0.3 | 33.8 ± 0.3 |
| 14 mm (60%) Densification | 74.3 ± 0.3 | 68.6 ± 0.3 | 62.7 ± 0.3 |
| Specimen | |||
|---|---|---|---|
| T2.5S1 | T2S2 | T1.5S3 | |
| Stiffness (MPa) | 989.79 ± 1.70 | 914.01 ± 1.55 | 737.51 ± 1.94 |
| Densification Strain () | 0.52 ± 0.006 | 0.47 ± 0.006 | 0.47 ± 0.006 |
| Specimens | |||
|---|---|---|---|
| T2.5S1 | T2S2 | T1.5S3 | |
| SEA (kJ/kg) | 33.7 ± 0.05 | 31.9 ± 0.05 | 29.7 ± 0.05 |
| Mass (g) | 15.7 ± 0.06 | 14.8 ± 0.06 | 14.4 ± 0.06 |
| Specific Energy Absorption (SEA) | |||
|---|---|---|---|
| Specimen | Experimental Data (kJ/kg) | Simulation Data (kJ/kg) | Error (%) |
| T1.5S3 | 31.2 | 29.5 | −5.45% |
| T2S2 | 33.5 | 31.9 | −4.78% |
| T2.5S1 | 35.2 | 33.3 | −5.40% |
Disclaimer/Publisher’s Note: The statements, opinions and data contained in all publications are solely those of the individual author(s) and contributor(s) and not of MDPI and/or the editor(s). MDPI and/or the editor(s) disclaim responsibility for any injury to people or property resulting from any ideas, methods, instructions or products referred to in the content. |
© 2023 by the authors. Licensee MDPI, Basel, Switzerland. This article is an open access article distributed under the terms and conditions of the Creative Commons Attribution (CC BY) license (https://creativecommons.org/licenses/by/4.0/).
Share and Cite
Siddique, S.H.; Hazell, P.J.; Pereira, G.G.; Wang, H.; Escobedo, J.P.; Ameri, A.A.H. On the Mechanical Behaviour of Biomimetic Cornstalk-Inspired Lightweight Structures. Biomimetics 2023, 8, 92. https://doi.org/10.3390/biomimetics8010092
Siddique SH, Hazell PJ, Pereira GG, Wang H, Escobedo JP, Ameri AAH. On the Mechanical Behaviour of Biomimetic Cornstalk-Inspired Lightweight Structures. Biomimetics. 2023; 8(1):92. https://doi.org/10.3390/biomimetics8010092
Chicago/Turabian StyleSiddique, Shakib Hyder, Paul J. Hazell, Gerald G. Pereira, Hongxu Wang, Juan P. Escobedo, and Ali A. H. Ameri. 2023. "On the Mechanical Behaviour of Biomimetic Cornstalk-Inspired Lightweight Structures" Biomimetics 8, no. 1: 92. https://doi.org/10.3390/biomimetics8010092
APA StyleSiddique, S. H., Hazell, P. J., Pereira, G. G., Wang, H., Escobedo, J. P., & Ameri, A. A. H. (2023). On the Mechanical Behaviour of Biomimetic Cornstalk-Inspired Lightweight Structures. Biomimetics, 8(1), 92. https://doi.org/10.3390/biomimetics8010092