1. Introduction
In fluent field, erosion is the main reason for failure in important machine parts. Solid particles, such as sand, with a fluid medium move, impact a machine parts’ surface. With the fluid’s high speed, solid particles gain high kinetic energy that damages equipment [
1,
2,
3]. Therefore, researchers have become increasingly interested in how to resist erosion so to protect materials, reduce energy consumption, and increase economic benefit. To resist the erosion of components, using materials with high strength, stiffness, and toughness to replace standard material is common practice [
4,
5]. However, such practices are not economical. Another alternative method is to add a special structure that changes the flow pattern [
6,
7]. Researchers control a flow pattern by these structures so as to change the situation in which contact between solid particles and surfaces occur, thereby protecting the materials [
8].
In nature, animals and plants have undergone tens of millions of years of evolution so that their physical characteristics can be perfectly adapted to the environment [
9]. Researchers can realize these features by studying and analyzing the mechanisms in natural situations that achieve the functions on demand [
10]. In recent years, researchers have become increasingly interested in bionic structures.
Researchers have shown that adding a non-smooth surface can reduce erosion with solid particles. Kazemi et al. focused on a coast that was protected from solid erosion by mangroves roots with complicated hydrodynamics [
11], finding the fluid parameters, such as velocity, vorticity, shear stresses, and turbulence intensity decreased with the porosity of mangroves roots. Yin et al. [
12] presented that, due to the grooves of tamarisk surface, tamarisk was protected from sand and wind erosion. A convex pattern and groove were designed and compared with that of a smooth surface to test the property of gas–solid erosion in these studies [
6,
7,
13,
14]. Qian et al. proved that a convex pattern increased the anti-erosion property and the maximum erosion rate was reduced due to the more dispersed distribution of sand particles around the pressure side and suction side, which caused the number of solid particles impacting the surface to be reduced [
15]. Zhang et al. designed a bionic fan blade with grooves based on a desert scorpion and found that the fluid formed a vortex in the grooves [
16]. In the research of Chen et al. and Zhang et al., the microstructure and microstrain of bionic samples after being eroded were observed by XRD and SEM, and were compared to a smooth sample [
17,
18]. These studies suggest that the bionic structure enhanced rotational flow in the fluid field, causing a decrease in the number and momentum of particles hitting the surface. Therefore, the corrosion damage of the bionic surface was reduced.
However, each of these previous studies adopted only a single biological feature and could not obtain perfect erosion resistance [
19,
20,
21,
22]. Artificiality cannot be designed and manufactured with the same precision and adaptability as animals and plants [
23,
24,
25]. These features were not repaired automatically once they had been destroyed [
26]. Thus, many studies pay attention to coupling bionic [
25,
27]. Zhang et al. presented a new approach that adopted coupling bionics to resist erosion. The desert scorpion was researched for the microstructure’s mechanism, for which which a new bionic surface was designed that combined the grooves and convex pattern. After the experiment, this structure proved to be more resistant to erosion than a single bionic structure [
28]. Huang et al. focused on the tissue structure of a desert lizard’s dorsal skin (
Laudakin stoliczkana) which combined the hard structure and groove structure [
29]. On this basis, Zhang et al. simulated single particle impact on a bionic and standard surface [
30]. It confirms that the bionic surface could reduce erosion by absorbing the kinetic energy of particles.
In the field of fluid mechanics, experimental techniques for the velocity measurement of flow play a crucial role [
31]. Particle image velocimetry (PIV), a non-intrusive technique, continues to develop year-on-year with the development of high-speed optical capture equipment. The water hydraulic components are normally made by metals, whose body is opaque. To visually investigate the flow process inside, transparent bodies have tried to be used to capture the image information inside the pressure vessel [
32,
33,
34]. Banaś et al. built a plastic throttle valve made by poly to track moving air bubbles in two dimensions with the help of the PIV technique [
33]. The valve port field in this study had an opaque valve core, which results in a portion of the fluid domain to be blocked. This experiment process is essentially three dimensional, because one or two-dimensional techniques such as hot-wire anemometry and planar particle image velocimetry (PIV) cannot fully capture it [
35]. Then, a three dimensional imaging technology [
36] combined with the PIV technique was applied and its experimental platform was built in this paper.
The purpose of this paper is to adopt three biological features to make up for this shortcoming and obtain a better anti-erosion structure. Moreover, through computational and experimental research, the bionic structure’s ability to alleviate solid erosion better than other bionic structures will be verified.
2. Multi-Source Coupling Bionic Design
The survival of living beings lies in the ability to actively adapt to changing circumstances. For animals or plants, they may have a unique morphological structure and behavior to adapt to their harsh environments. This provides valuable inspiration for the resolution of engineering problems. However, with the complexity of engineering problems and the in-depth study of bionics, it is no longer sufficient to refer to only one biological model. This paper presents a design case of using multi-source coupling bionic based on the unit bionics. It integrates the structural and functional features of conch, romanesco broccoli, and pine cone, and designs a hydraulic valve core with anti-erosion performance.
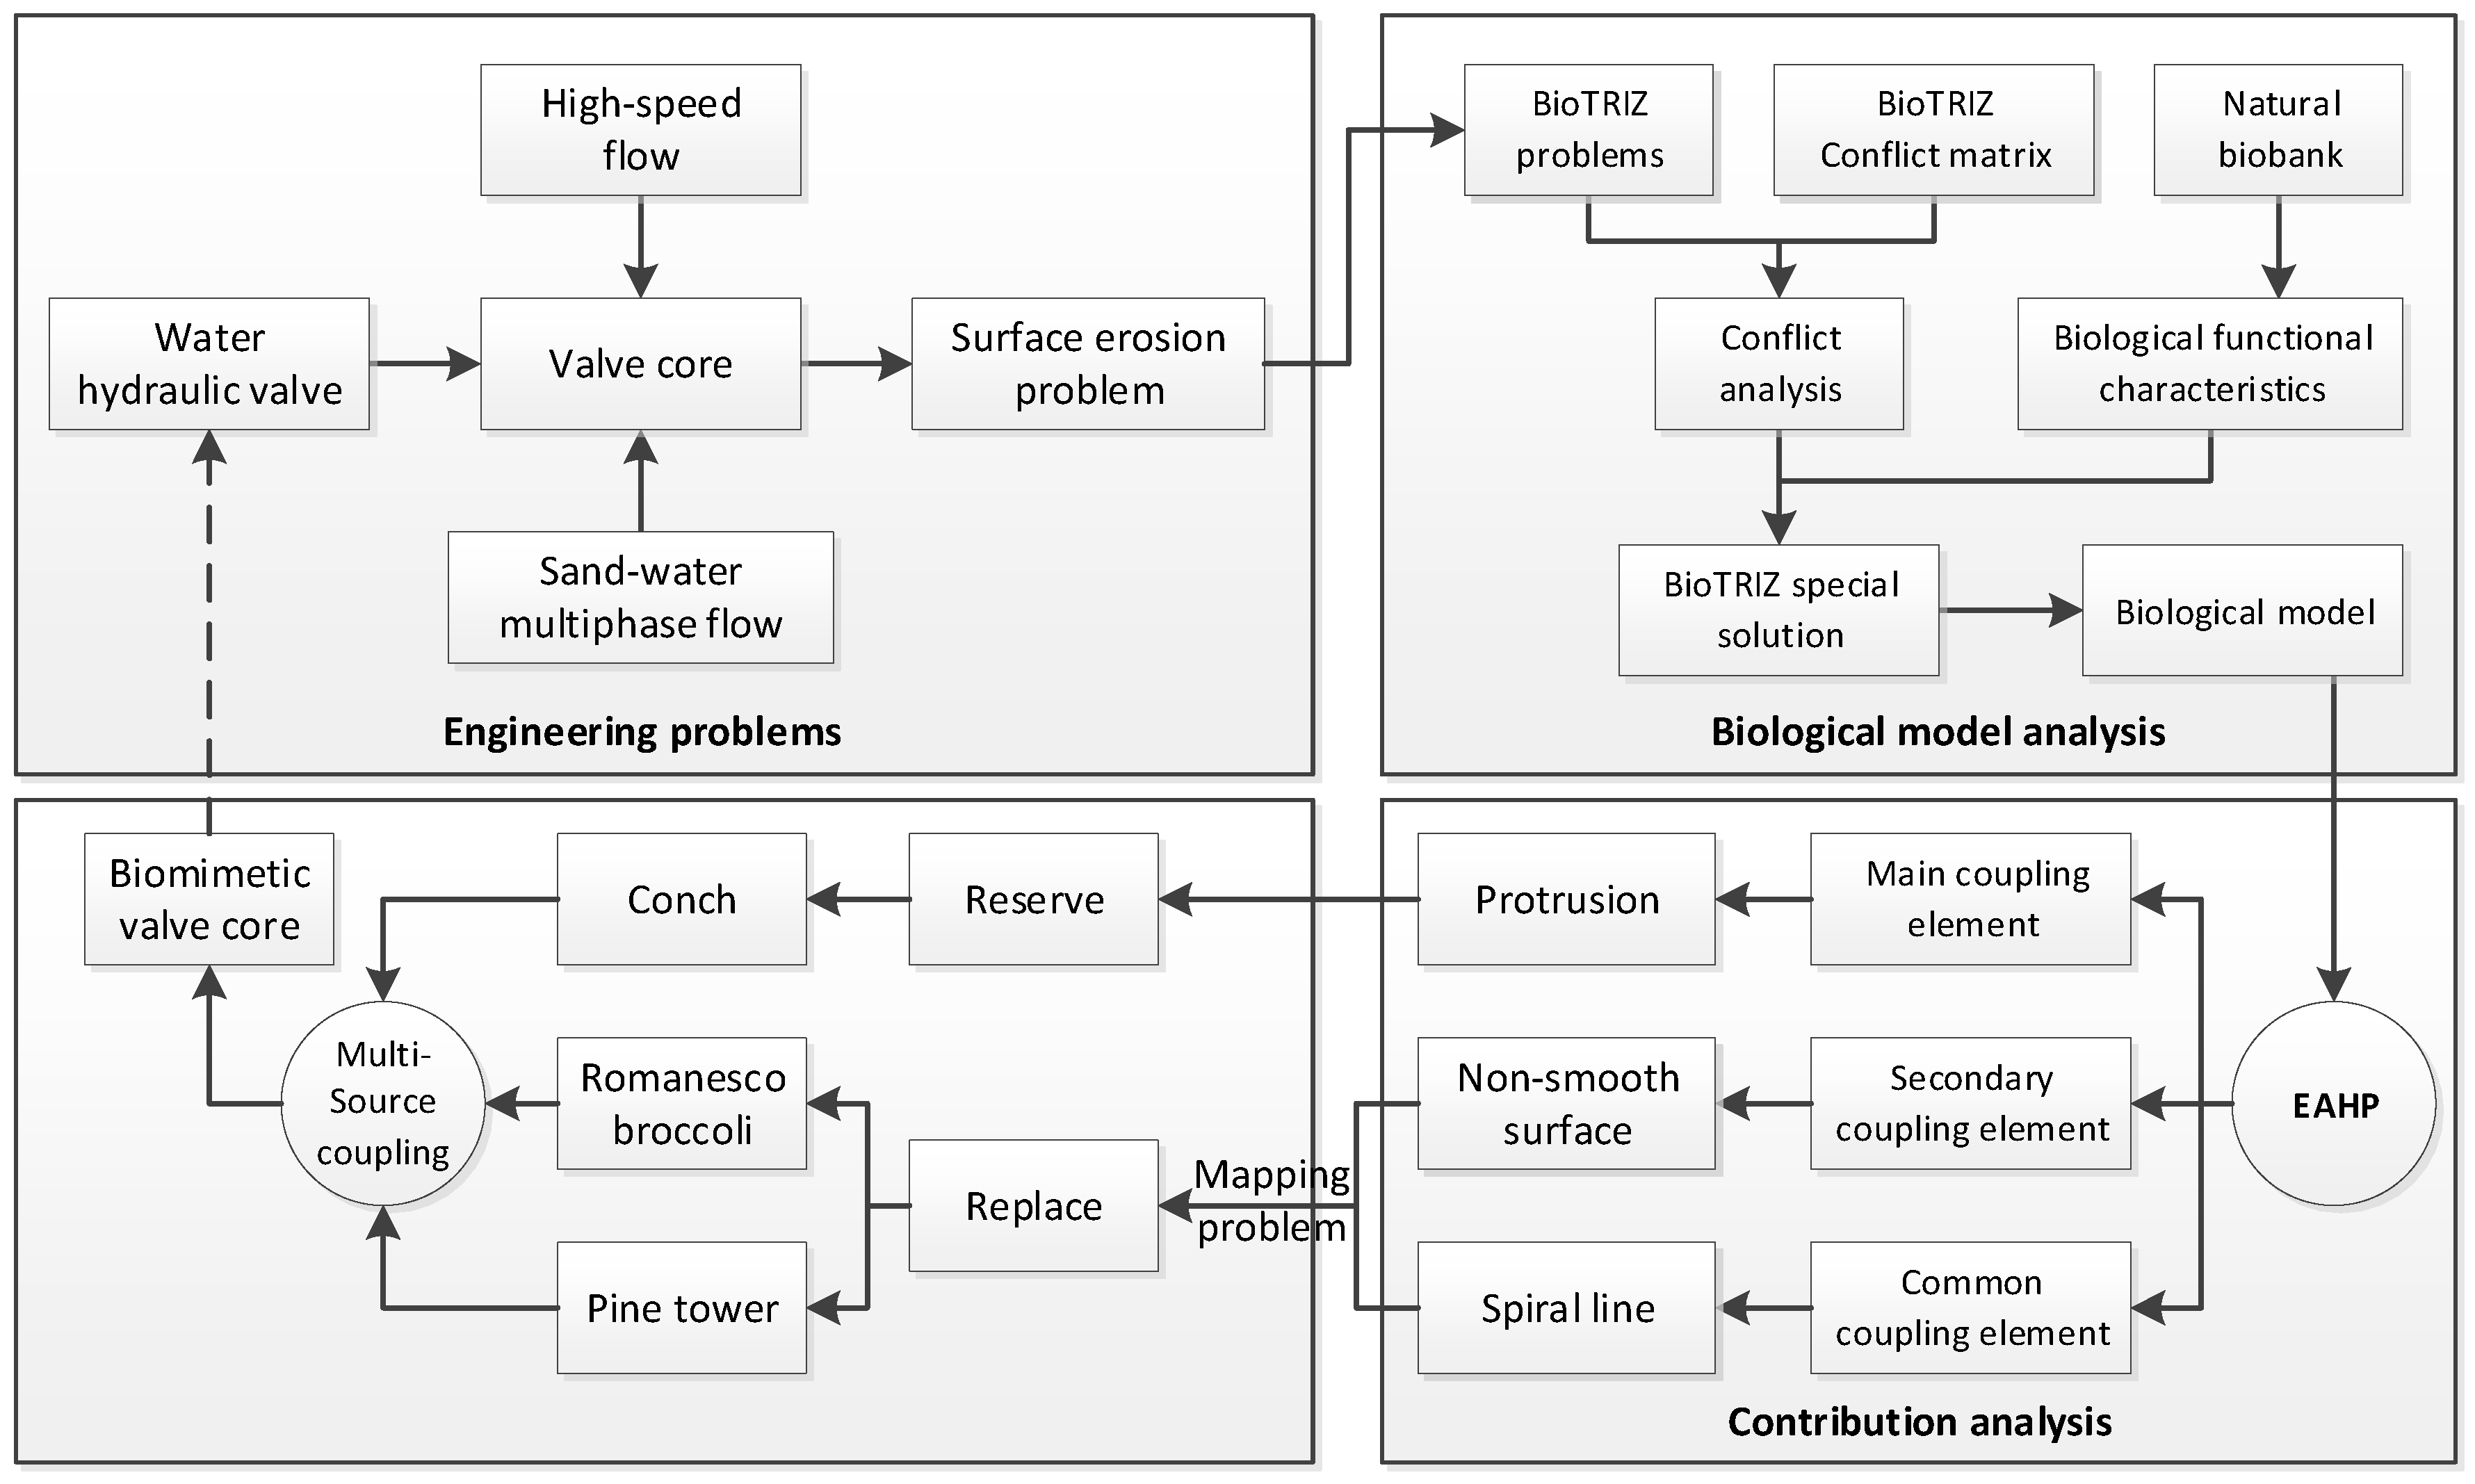
Figure 1 presents the framework of the valve core’s biomimetic design. The erosion of the high-speed sand-water multiphase flow will cause a surface erosion problem for the water hydraulic valve core. To improve the erosion resistance of the valve core, the BioTRIZ method was used to address engineering contradictions and guide the search for biomimetic models in this paper. The BioTRIZ special solution was obtained by comprehensive biological functional characteristics and invention principle solutions given by conflict analysis. The preliminary biomimetic prototype was obtained by BioTRIZ and then the extension hierarchy process analytic was used to obtain the bionic prototyping coupling contribution to obtain the main coupling element. The primary coupling element was retained while the secondary coupling element which could have a better fractal structure and the common coupling element, whose features are difficult to map, were transformed onto other organisms. As a result, the conch convex anti-erosion structure, the fractal shape of the romanesco broccoli, and the rosette spiral structure of the pine cone were integrated to the design of a novel biomimetic anti-erosion valve core.
2.1. Search of the Biological Model Based on BioTRIZ
Vincent et al. [
37] combined TRIZ with bionics and used TRIZ theory to make use of the advantages of historical design cases and experience, proposing the BioTRIZ theory that supports bionic design. BioTRIZ can be used to access biological strategies for solving engineering problems [
38]. It can more clearly reflect the process of using biological examples to solve engineering technical contradictions.
When the hydraulic valve is under working condition, the pressure and flow at the valve port (the key field among valve seat and valve core) greatly changes. When the amount of sands in the water is large, the high-speed water flow will drive the sand to impact the valve core, which causes the valve core to wear. To improve the valve core’s particle erosion resistance, the valve core structure of a water hydraulic valve was optimally designed and bio-inspired by several natural creatures.
BioTRIZ conflict matrix is different from Altshuller’s TRIZ conflict matrix. From the perspective of biological function realization, the BioTRIZ theory reorganizes and condenses the TRIZ technology conflict matrix. The BioTRIZ theory uses six operational domains as the rows and columns of the collision matrix: Substance, structure, space, time, energy, and information. It uses 40 principles of invention as the values of the matrix. In engineering problems, reducing the grinding will improve energy efficiency and the complicity of the structure. Thus, improving energy efficiency will deteriorate the structure. According to the conflict matrix, the corresponding invention principle, the BioTRIZ special solution can be obtained, as shown in the
Table 1.
The BioTRIZ special solution was combined with the biological instance library for bionic instance search. The biological case database was combined for biological case search. The result is shown in
Table 2.
It is found that the shellfish non-smooth convex shell in principle No. 3 is an ideal valve core bionic model. The macroscopic non-smooth structure can improve its anti-erosion performance. Meanwhile, considering the structural characteristics of the valve core, the shuttle shape conch was selected as the original biological model.
2.2. Biological Model Analysis
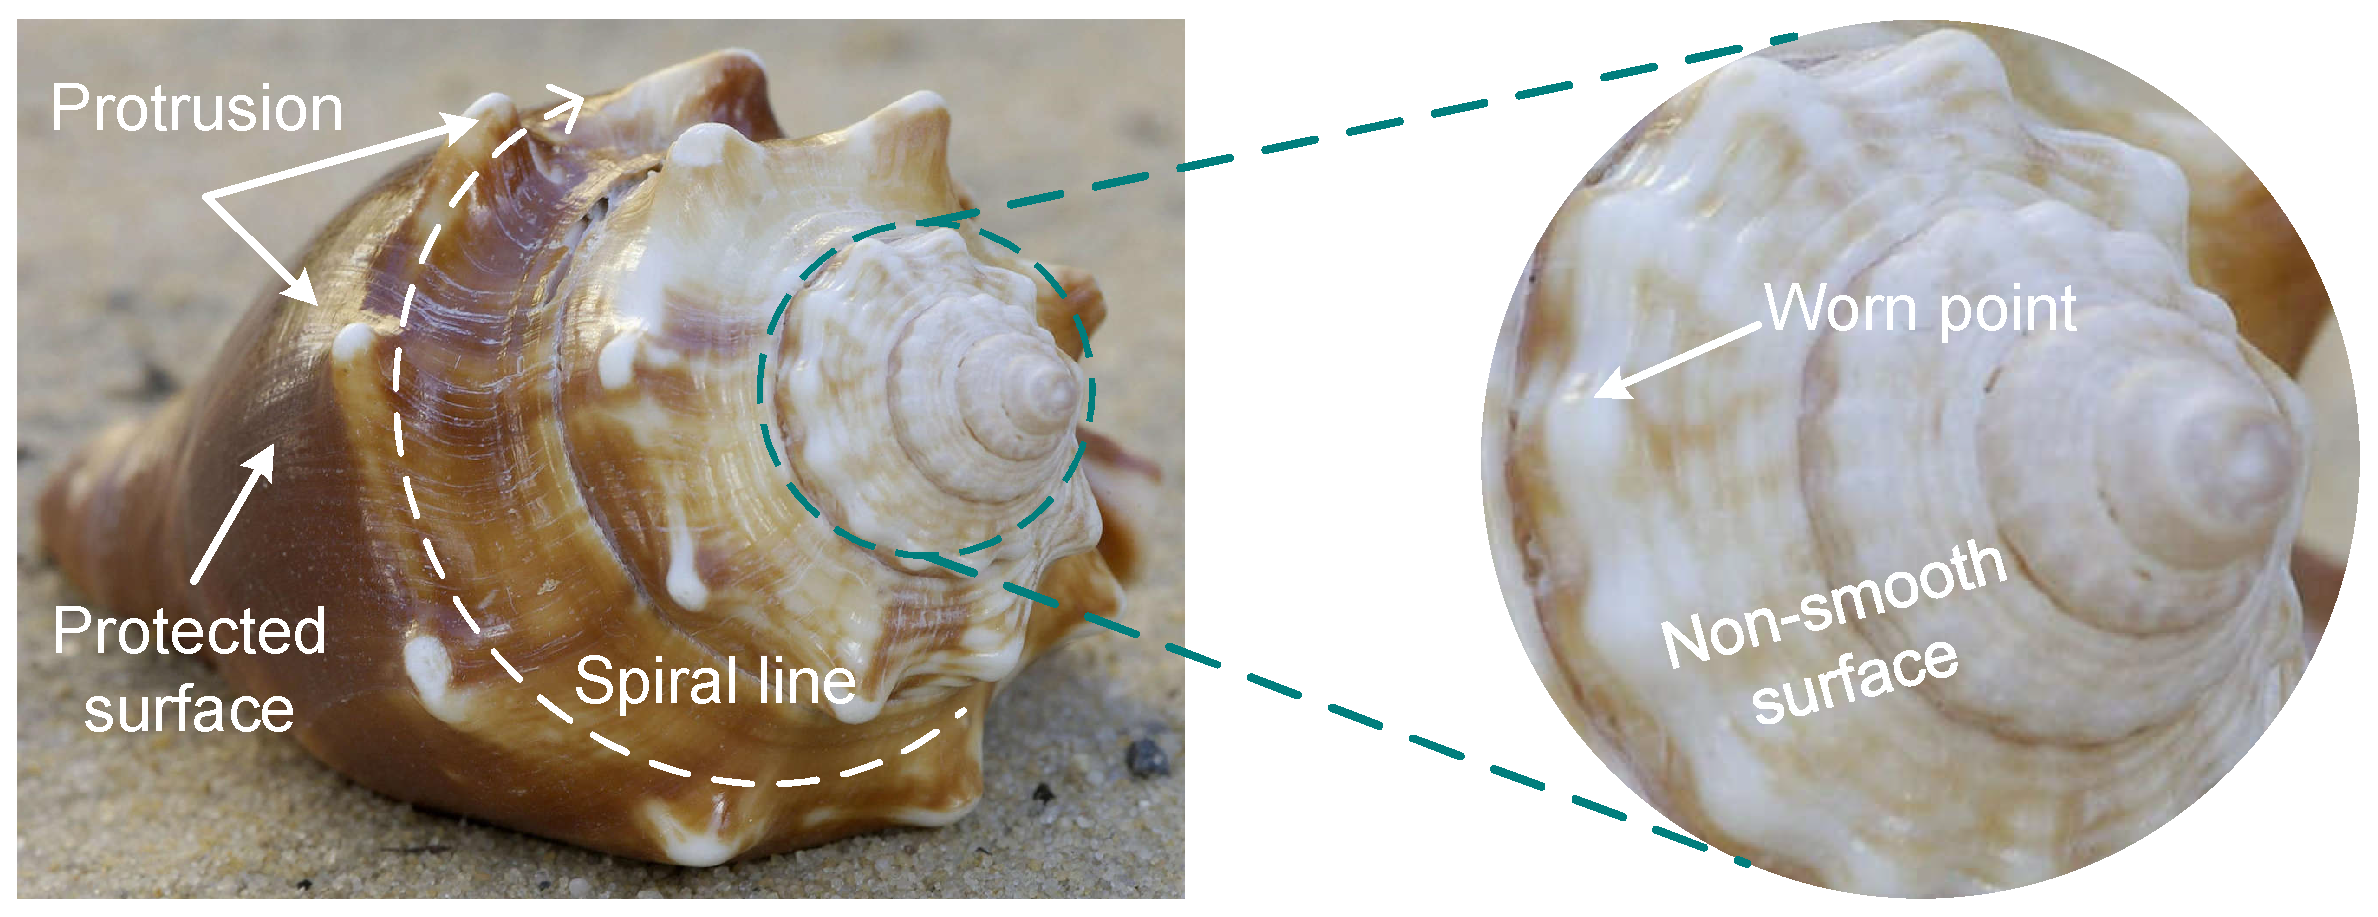
Conchs mainly live in the shallow seabed of a coastal area and are spread all over the world. Most of populations are concentrated in the Pacific Rim and the Indian Ocean. Like other animals, mollusks such as conchs have adapted to the ever-changing environment. From the rocks washed by the sea to the deep, muddy bottom of the sea, all forms of habitat have their own special mollusk. At the sea beach and river bank where the sand is mixed in water, a large number of conchs can often be found. Conch activity is slow and often adsorbs on the reef. As shown in
Figure 2, the conch is generally fusiform and the middle shoulder is raised. The overall screw shell presents a non-smooth surface. A spiral emits from the tail and extends all the way to the shoulder. There are prominent protrusions on the spiral line. Several turns of ribs and small nodules are among the spirals that give the conical outer shell a non-smooth surface. Comprehensive analysis shows that these protrusions, spirals, and non-smooth surface morphology can reduce the erosion of sediment. The outer shell of the conch is well protected against abrasion and erosion.
2.3. Coupling Element Contribution Analysis
Extension analytic hierarchy process (EAHP) [
39] is based on the theory and method of extension set. EAHP studies the method of constructing a judgment matrix and evaluating it when the relative importance is uncertain. In this paper, the extension analytic hierarchy process is used for the coupling contribution analysis. The specific analysis steps are as follows.
The expert compares all the
N coupling elements to give the judgment value and uses the extension interval number to quantitatively express their relative importance, thus constructing an extension interval number judgment matrix
.
is the standard judgment matrix, which is given by an expert. The element
is an interval.
is the lower limit of the interval and
is the upper limit of the interval.
i and
j represent different influencing factors. In order to quantify it, the median of interval numbers
are represented by the integers 1 to 9. 1 indicates that the two factors are equally important. 9 means one is more extremely important than the other.
, given to calculate the comprehensive matrix, is the judgment interval for the
expert.
is the lower limit of the interval and
is the upper limit. The number of comprehensive extensions given by
T experts is obtained as follows:
Thus, a comprehensive extension judgment matrix M, which combines the judgments of several experts, can be obtained.
According to the comprehensive judgment matrix M, find the weight vector that satisfies the consistency, which are:
Solve the feature vectors , , which are respectively the normalized eigenvector with a positive component of the largest eigenvalues of the square matrixes and ;
According to the value of
,
,
Calculate weight vector .
According to theorem 2 presented by Gao et al. [
39], the ordering weight vector
p of each coupling element to the coupling target was calculated and the coupling analysis of the initial bio-model conch anti-erosion multi-coupling was performed. Before calculating the vector
p, we need to sort weight vector
. Define
to be the probability that
is greater than
. The algorithm is as follows:
If is not negative, then , . is to get the ordering weight vector p.
The coupling elements are respectively a clad-like protrusion, a non-smooth surface morphology, and a radioactive spiral. The experts analyzed the non-smooth surface shape and the radioactive spiral coupling element that affects the anti-erosion function and obtains the extension interval number judgment matrix
of the function of the coupling layer. Then the extension judgment matrix is:
where,
Normalization gives the weight vector of each coupling element to the functional target as .
It can be seen that the convex hull structure, non-smooth surface morphology and spiral curve are the coupling elements, and the contribution of the 3 coupling elements are respectively . Therefore, the convex hull structure is the main coupling element, the non-smooth surface morphological coupling element is the secondary main coupling element, and the spiral curve is a common coupling element.
2.4. Multi-Source Coupling Biomimetic Design
Through the above methods, we found a primary model for solving engineering problems: Conch. However, when constructing the core, the non-smooth surface morphology and spiral curve of the conch are difficult to map to the valve core. However, these two coupling elements are not the main coupling elements and can be simplified in a certain way. Thus it is necessary to continue to search for new bio-models to replace the non-smooth surfaces and spiral curves of a conch.
2.4.1. Replacement of the Common Coupling Element
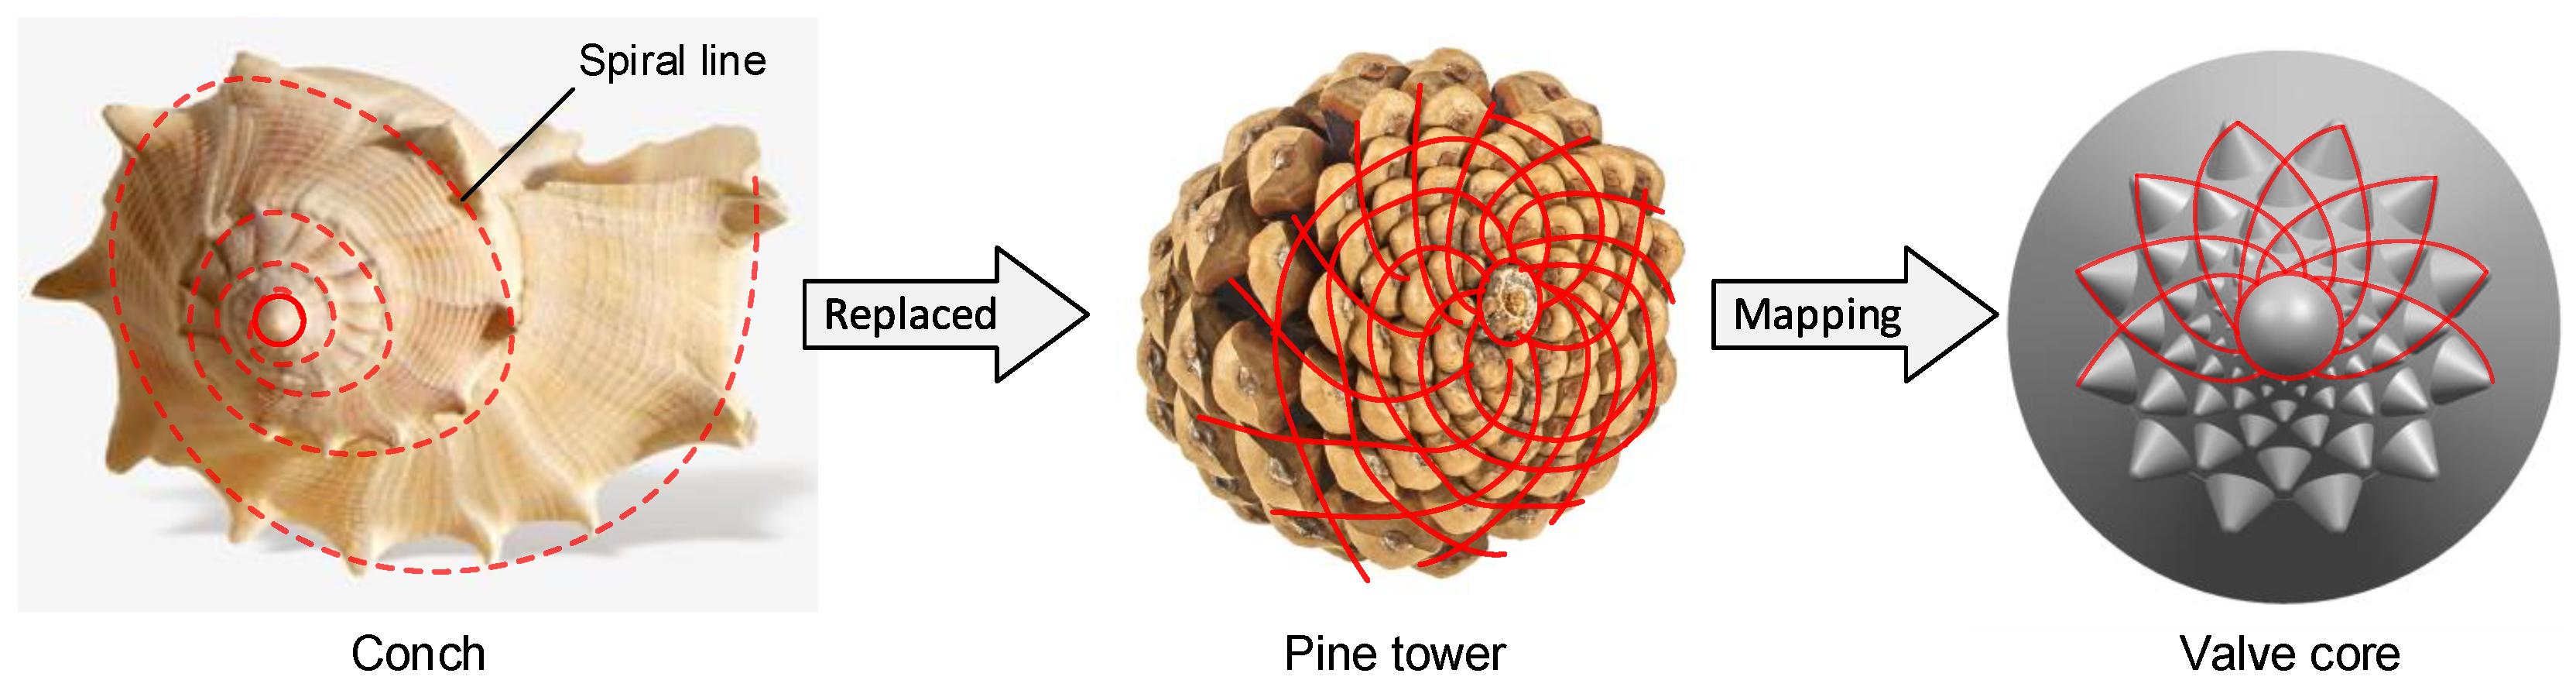
When mapping the conch to the valve core, it was found that the spiral line of the protrusions greatly decrease the amount of protrusions and result in unnecessary structural complexity. Therefore, it is necessary to find another biometric model to replace the spiral line of the conch.
Pine tower, the fruit of the pine tree, has brown, multi-layered scales with pine nuts sandwiched between the scales. The scales of fresh pine towers have small thorns. When mature, the skin is lignified and forms a hard-outer shell. As shown in
Figure 3, the arrangement of the scales on the pine tower is a rosette type, and the scales of each layer are mutually fitted and the structure is stable. The pine tower has a simple spiral structure and can arrange more pine nuts in a limited space. Therefore, the Fibonacci spiral arrangement of the pine cone can simplify the modeling process, densify the main coupling element, and strengthen the main coupling element strength.
2.4.2. Replacement of the Secondary Coupling Element
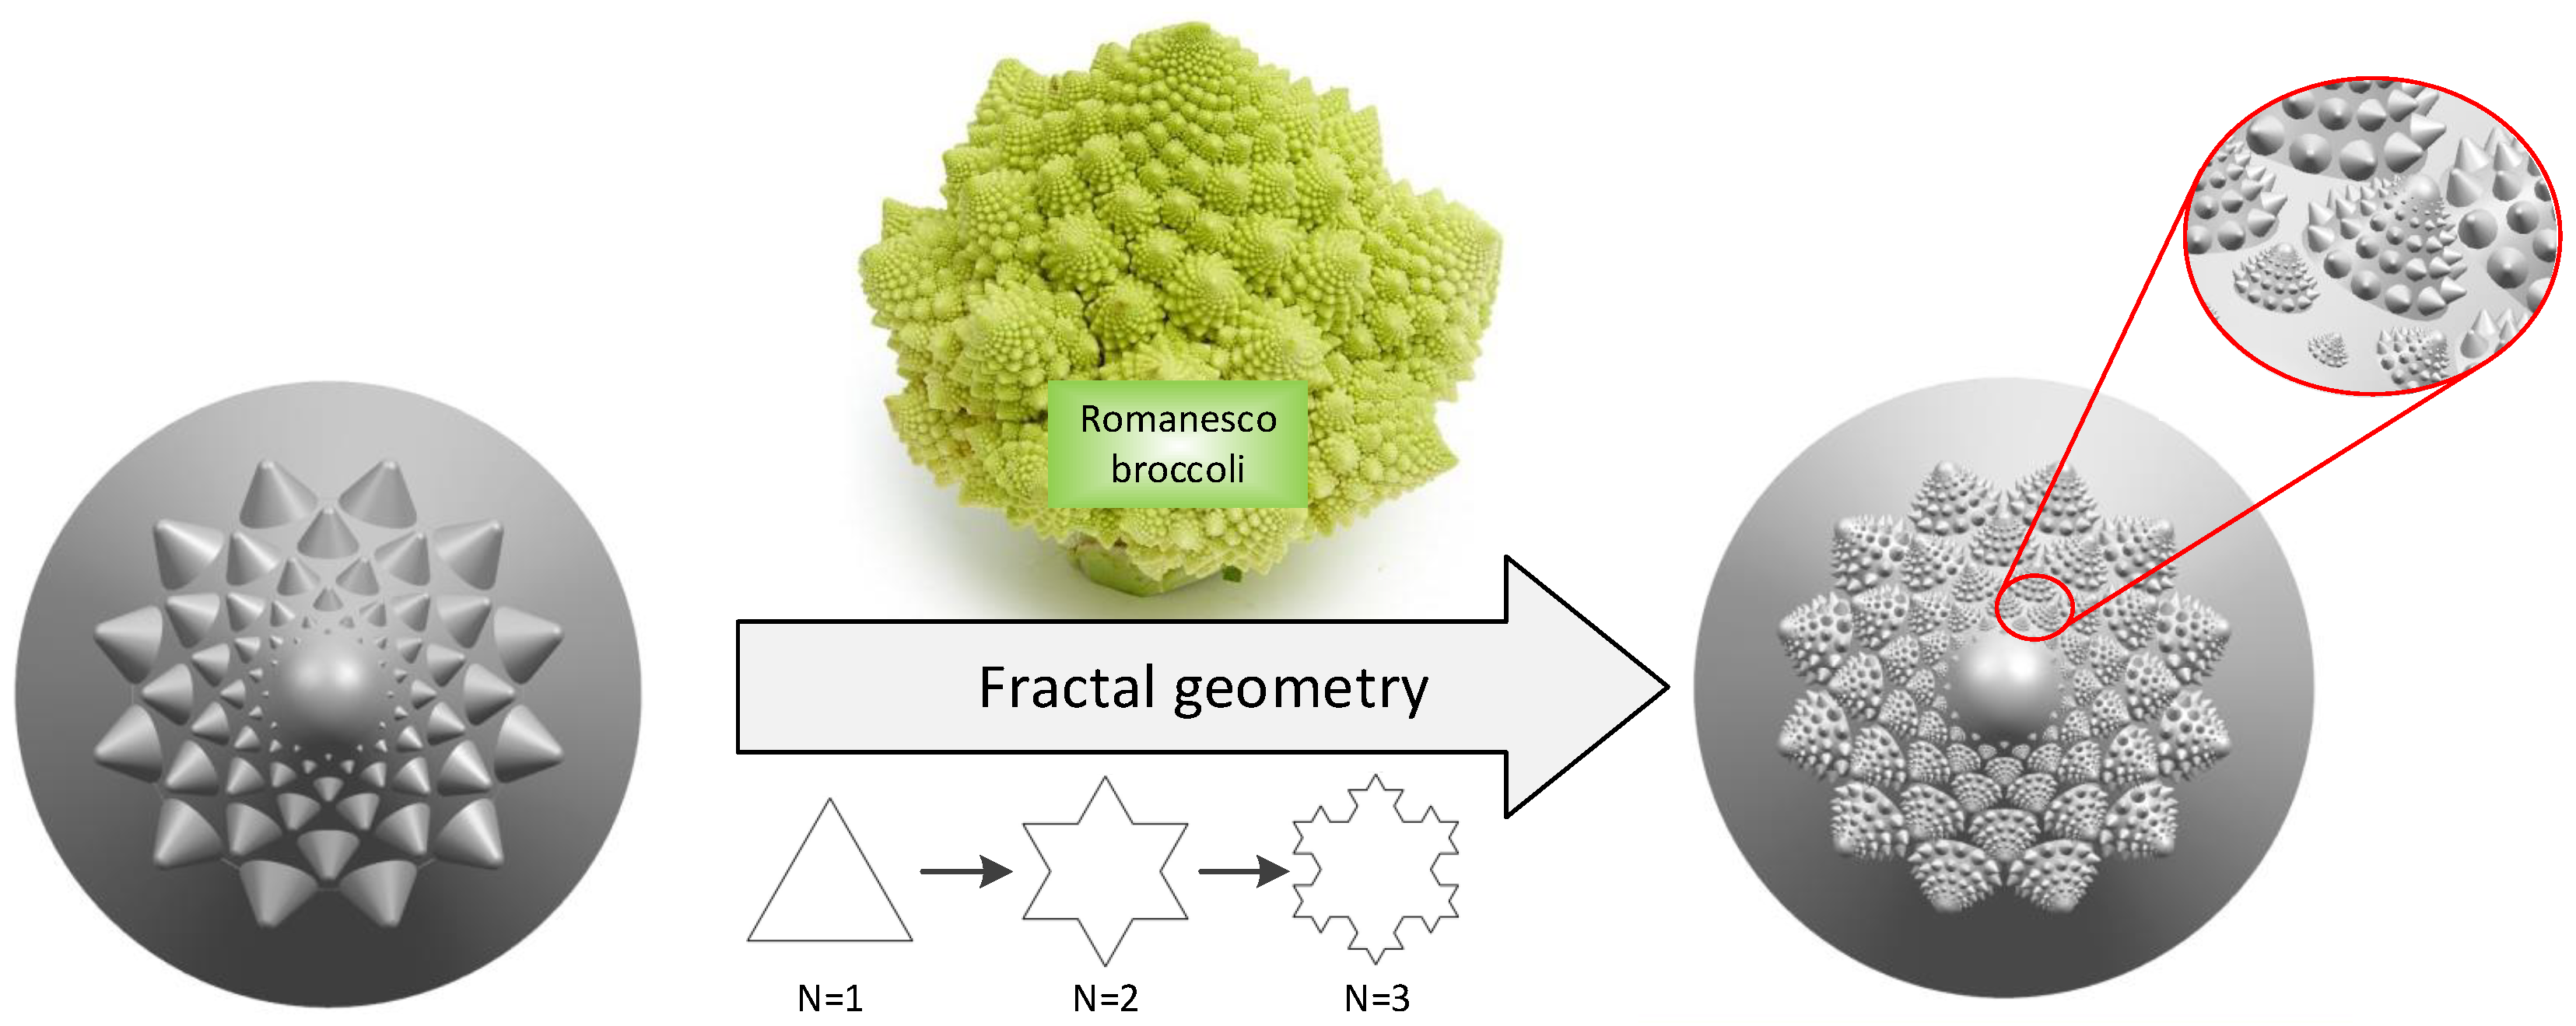
The fractal geometry theory proposed by Benoit B. Mandelbrot [
40] presented a branch of mathematics that explores the complex forms of nature. There are many complex objects in nature, such as coastlines, mountain contours, floating clouds, and stars. It is difficult to describe them using traditional geometric methods and can only be approximated by regular shapes. Fractal geometry is a geometry with irregular geometry as the object of study. It can deal with the appearance of non-smooth and irregular self-similarity and feature length without appearance in nonlinear systems. It can also more deeply describe the natural forms which may be disorganized in nature [
41]. The fractals of nature are divided into regular fractals and random fractals. Regular fractals are carefully constructed by mathematicians, which strictly satisfy self-similarity such as the Koch snowflake curve [
42] and the Shelbinski sierpinski rug curve [
43]. The vast majority of the rest are random fractals. They are extremely irregular and extremely matte, but they are self-similar in appearance.
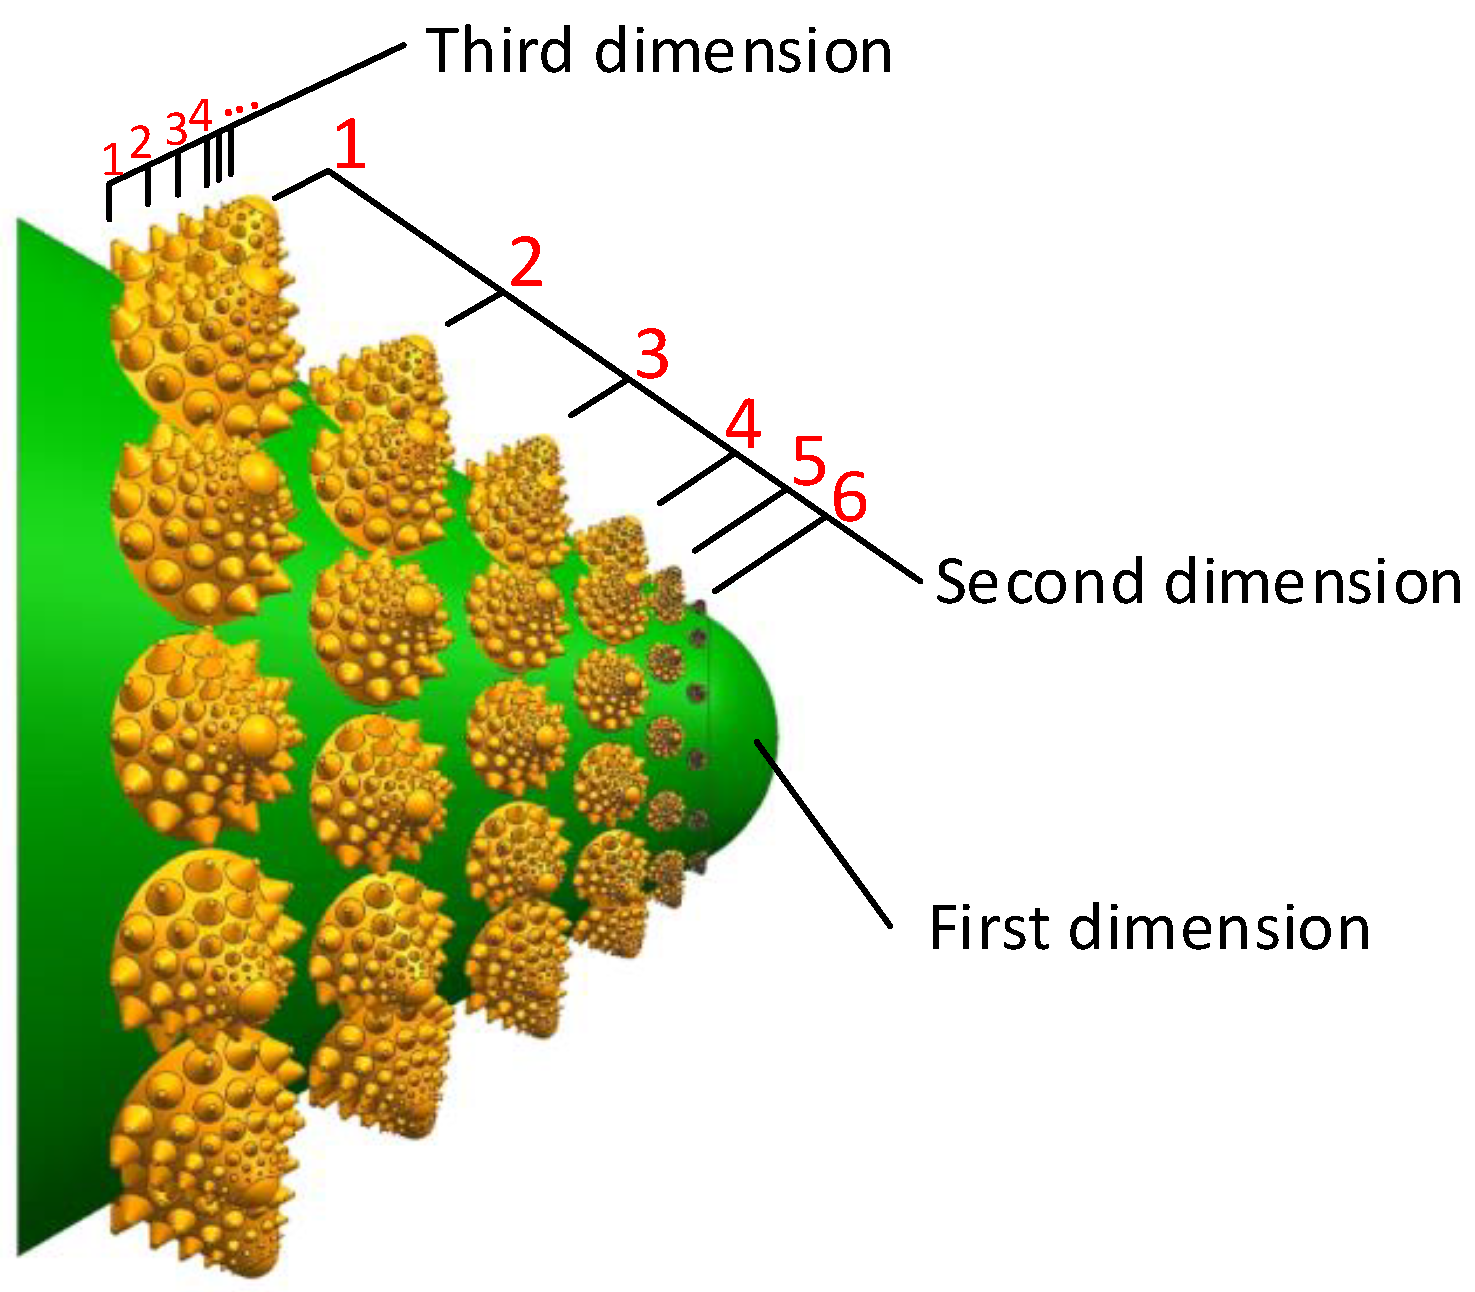
When using a fractal model to characterize an object, a random process (or recursive model) was constructed and iterated step by step until the richness of the generated texture details are met. Therefore, a regular fractal structure is used to replace the non-smooth surface morphology of the surface of the conch. There is a broccoli growing in the northern part of the Mediterranean Sea, called a romanesco broccoli. Its shape resembles a pagoda and has a fractal structure, as shown in
Figure 4. Each romanesco broccoli is composed of the same tower-shaped pagoda and each cluster of romanesco broccoli is made up of smaller shapes. Each cluster of romanesco broccoli is arranged according to the Fibonacci spiral.
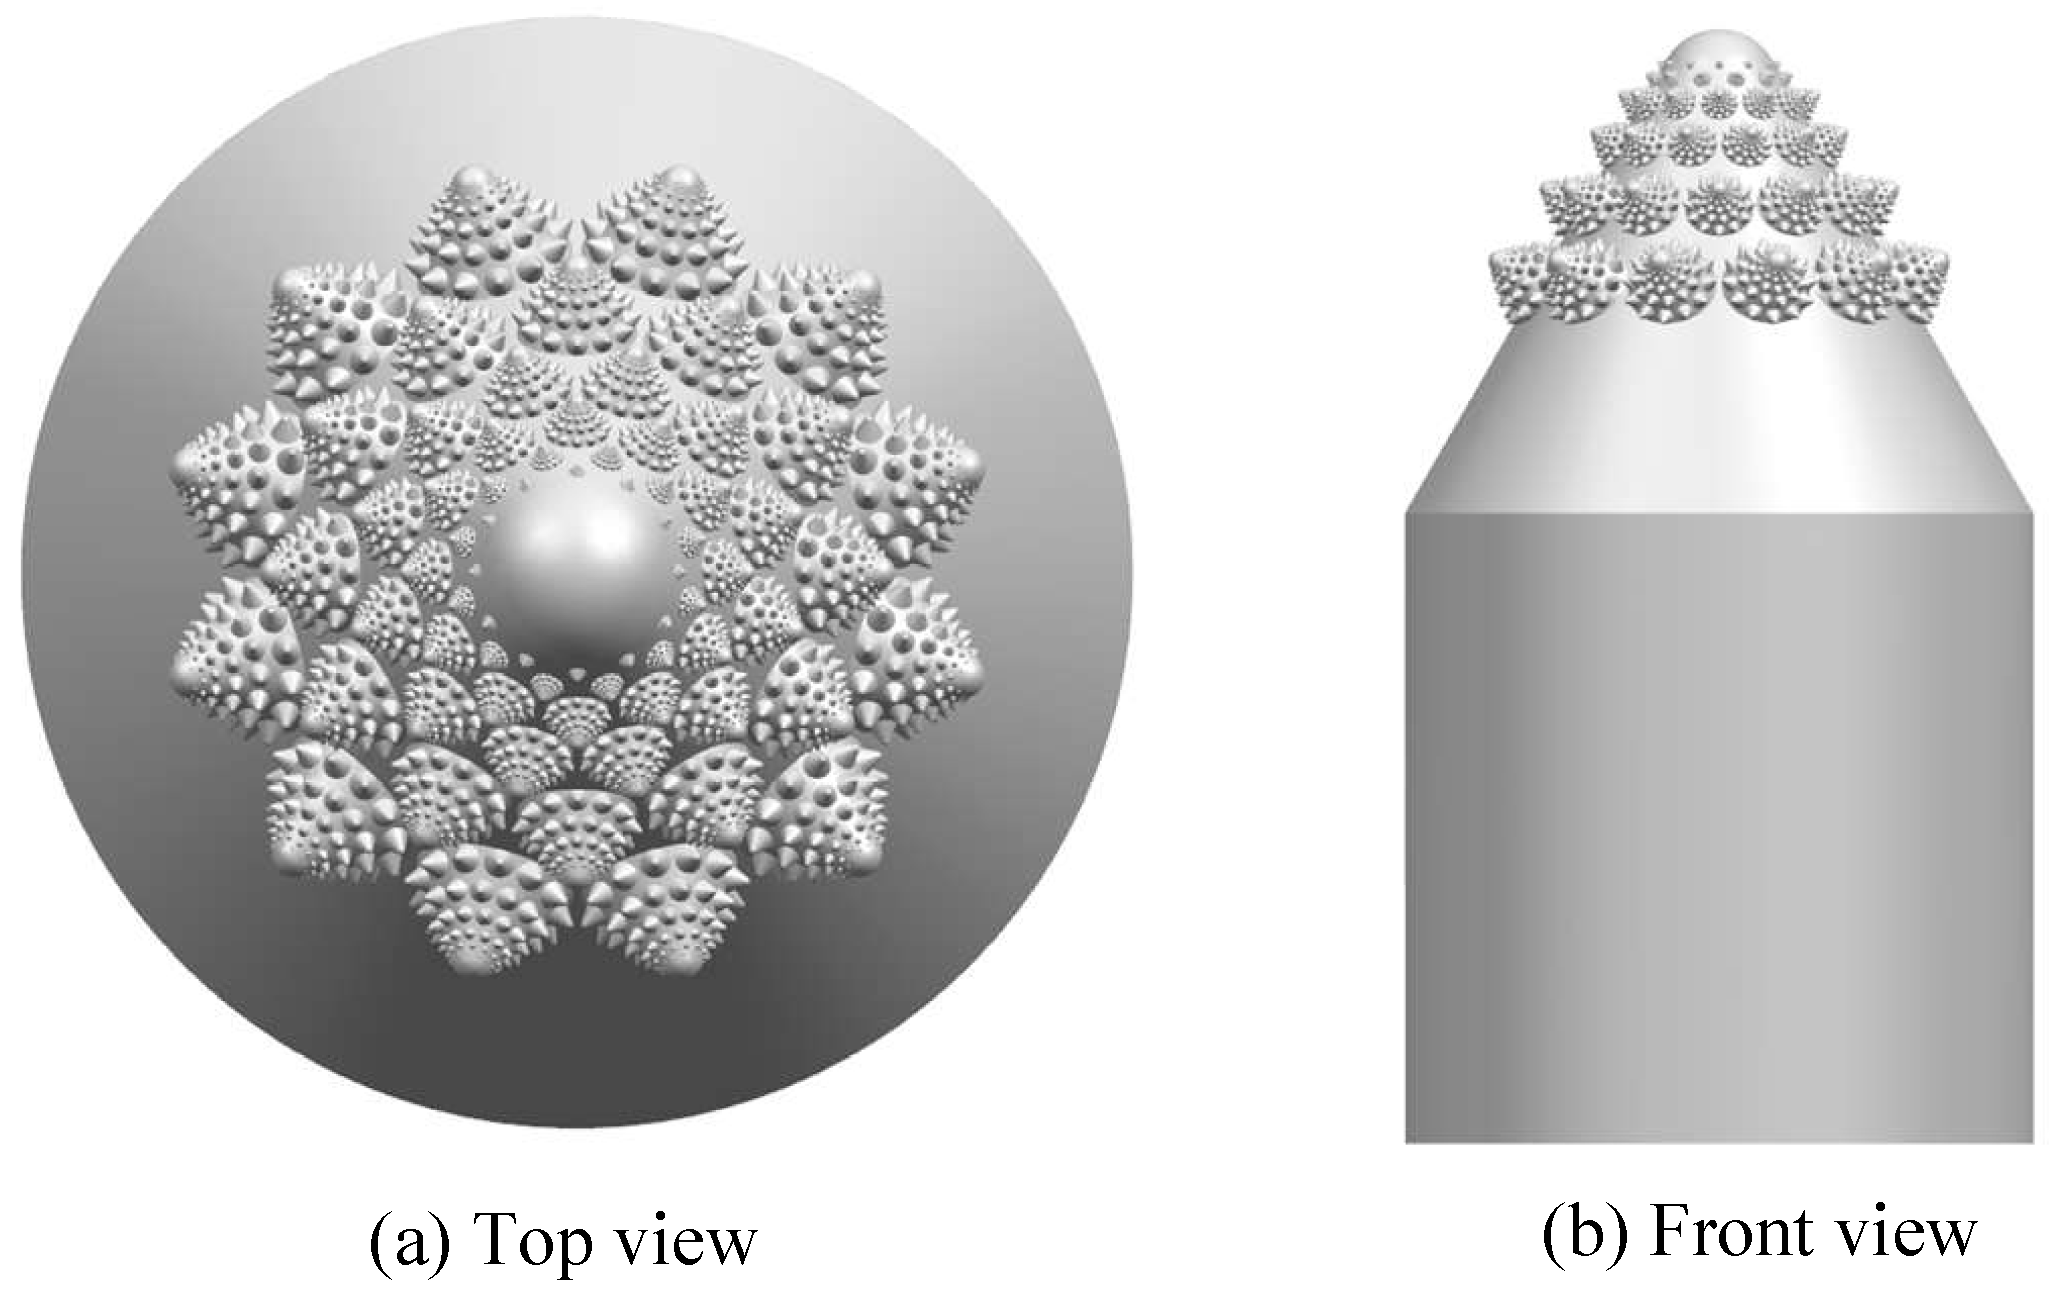
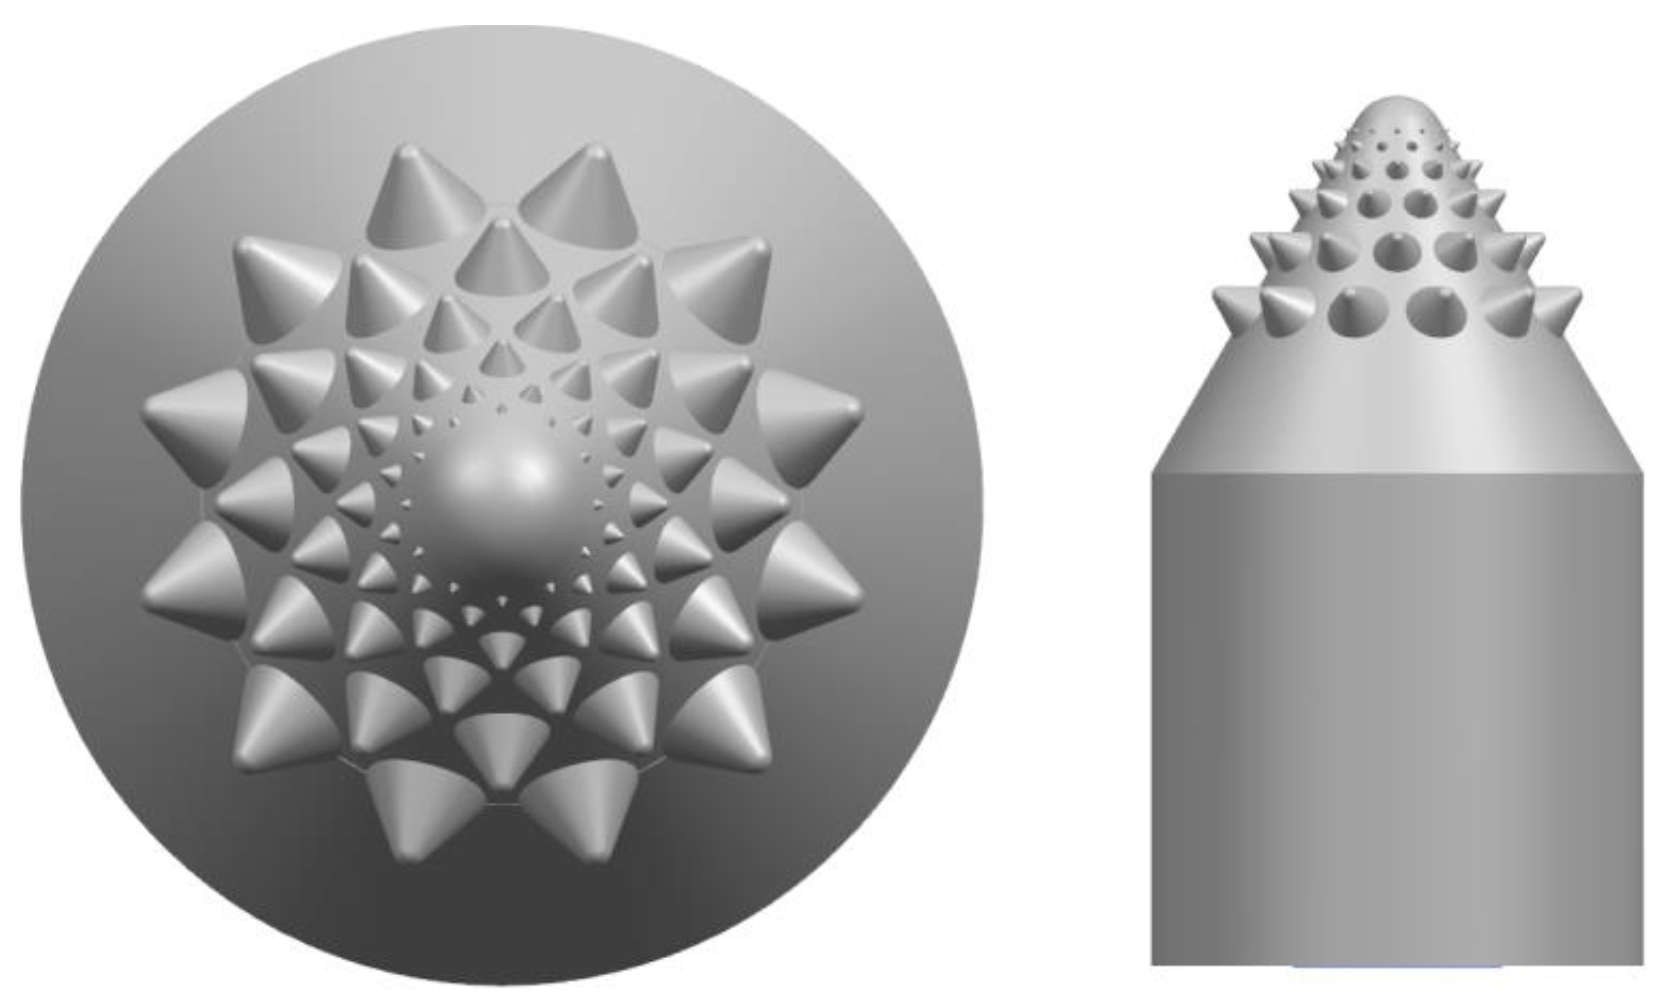
The tower-like structure of this romanesco broccoli is similar to the telescopic protrusion of the conch and its multi-level self-similarity can approximate the non-smooth surface texture of the conch shell. The fractal structure also greatly increases the spatial density of the main coupling element and can further enhance the ability to resist erosion. As shown in
Figure 4, a multi-source coupling bionic valve core was designed combined with the anti-erosion function of the conch, the spiral curve of the pine tower, and the fractal shape of the romanesco broccoli.
4. Experimental Results and Discussion
4.1. Experiment Equipment
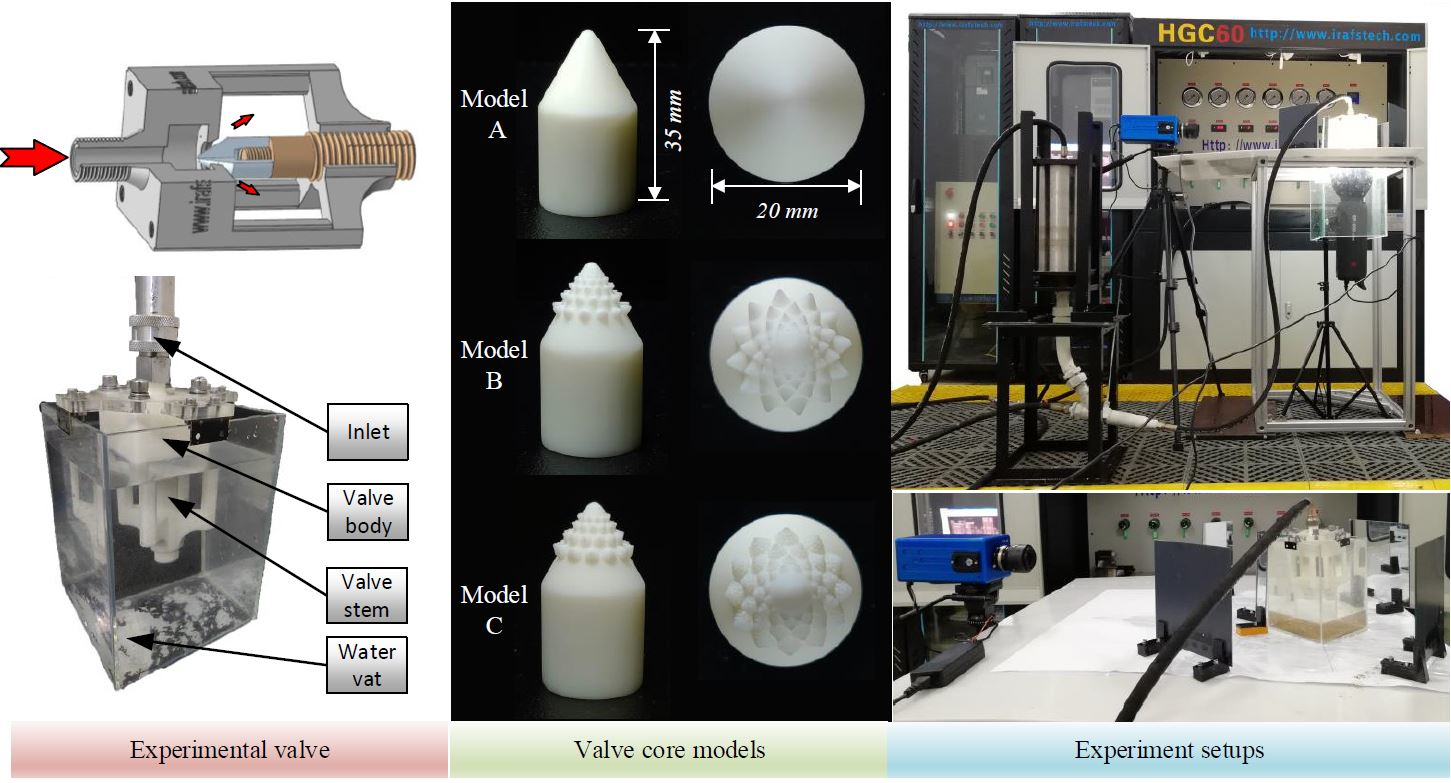
In order to test the valve core’s effectiveness, a hydraulic test bench was established, which was divided into a water hydraulic transmission subsystem, an electrical control subsystem, and an experimental signal acquisition subsystem. The frequency inverter (Schneider Altivar 610, Paris, France) ensured suitable power for the hydraulic test bench through the adequate control of the water pumps working frequency (input pressure). The water pump used in the transmission system allowed for a constant supply of pressured water, which eliminated the shortcomings in terms of pressure fluctuations owing to subsequent improvements in AC frequency conversion technology. The hydraulic pump provided 0.2–6 MPa pressure. The hydraulic control system was controlled by the electric control subsystem, the initial parameters of the experiment were set, the experimental data acquisition subsystem was used to obtain experimental data, and the experimental results were analyzed. The experimental schematic and experimental setup are shown in
Figure 12.
A high-speed camera (Revealer 5KF10, Hefei, China) with a 60 mm Nikkor lens (Tokyo, Japan) was used to get high-speed sand and water flow. The three valve core models were manufactured by using 3D printing technology. Its 3D printing accuracy was 0.025 mm, which meet the structure requirement of model C. The 3D printer used in this research is Formlabs Form 2 produced by Formlabs Inc., Somerville, MA, USA. Solid particles in the fluid were added through a mixer. Since the upper and lower pressures were uniform, the sand particles were mixed into the fluid under the force of gravity. The experimental sand-water flow conditions are listed in
Table 4.
The thread on the upper part of the valve body was used to connect the water hydraulic test bench to the inlet of the valve. The narrow passage at the front end of the valve core and the large chamber greatly stabilized the flow of water into the flow before the valve core. In order to observe the flow of fluid through the valve, the valve body needed to use highly transparent plexiglass. However, under sand erosion, the transparency of the plexiglass valve body was easily destroyed, resulting in an inefficient recycling of the valve body. In order to solve this problem, a semi-hollow valve body was proposed. Putting the valve body into the water tank not only helped to carry out the anti-corrosion test, but also to observe the speed at which the erosion particles passed through the valve core.
4.2. Experiment Result
Using the high-speed camera and one-camera-multi-mirror three-dimensional imaging method [
36], the videos from the four sides of the valve were captured and saved. For example,
Figure 13 shows a frame of the experiment videos. Its resolution is 1344 ∗ 628 pixels. The frame rate of the selected experiment video to be analyzed is 1794 frames per second. The exposure time was 400 μs. So, the time difference between two consecutive frames of image was only about 0.557 ms.
Through the observation of the experiment’s images, the sand mixed in water was so little in size that the resolution of the images could not provide clear information on the sand track. Meanwhile, the sealing surface could not be captured by camera due to the valve port’s structure limitation. There were plenty of air bubbles generated among the valve port field. Thus, the authors chose the velocity of the air bubbles in the water flow as a reference to the sand velocity. The erosion caused by the kinetic energy of the sands mixed in water flow. The energy of the sands hitting the sealing surface depended on sand velocity, when the other flow or particle conditions were the same. So, the measurement of the velocity vector of bubble cluster near the sealing surface could provide a credible reference for the potential erosion on the sealing surface of the valve core. The flow pattern and preformation of the valve can be discussed.
4.3. Result Analysis
Using PIV technology [
46], the experiment’s images of the valve port field were analyzed, which mapped flow quantitatively, and got the velocity of the bubble or little sands (just a little part) fixed in water flow. The resolution of each frame of the observed area from four views were all 204 ∗ 282 pixels. In the PIV algorithm, the important settings were as follows: The correlation algorithm, fast Fourier transform (FFT) correlation with multiple passes and deforming windows, was used. The interrogation area in Pass 1 was 32 pixels, the step for image detection was 16 pixels, which is 50% of the interrogation area. The interrogation area in Pass 2 was 16 pixels, with a step of 8 pixels. In Pass 3, the interrogation area was 8 pixels with a step of 4 pixels. Due to the low resolution of the experiment images, 5 times repeated correlation function was used to enhance the data yield.
After PIV analysis, the lateral velocity u and vertical velocity v were limited in the interval between −2 px/frame to 2 px/frame. The few velocity vectors beyond this interval were considered to be inconsistent with the actual flow rate and were eliminated as errors. If v is less than zero, it means that the direction of this velocity vector on the longitudinal axis is upward, which means the bubbles on there are the floating ones driven by buoyant force. If v is more than zero, it means that the direction of this velocity vector on the longitudinal axis is downward, which means the bubbles on there are the floating ones driven by flow force.
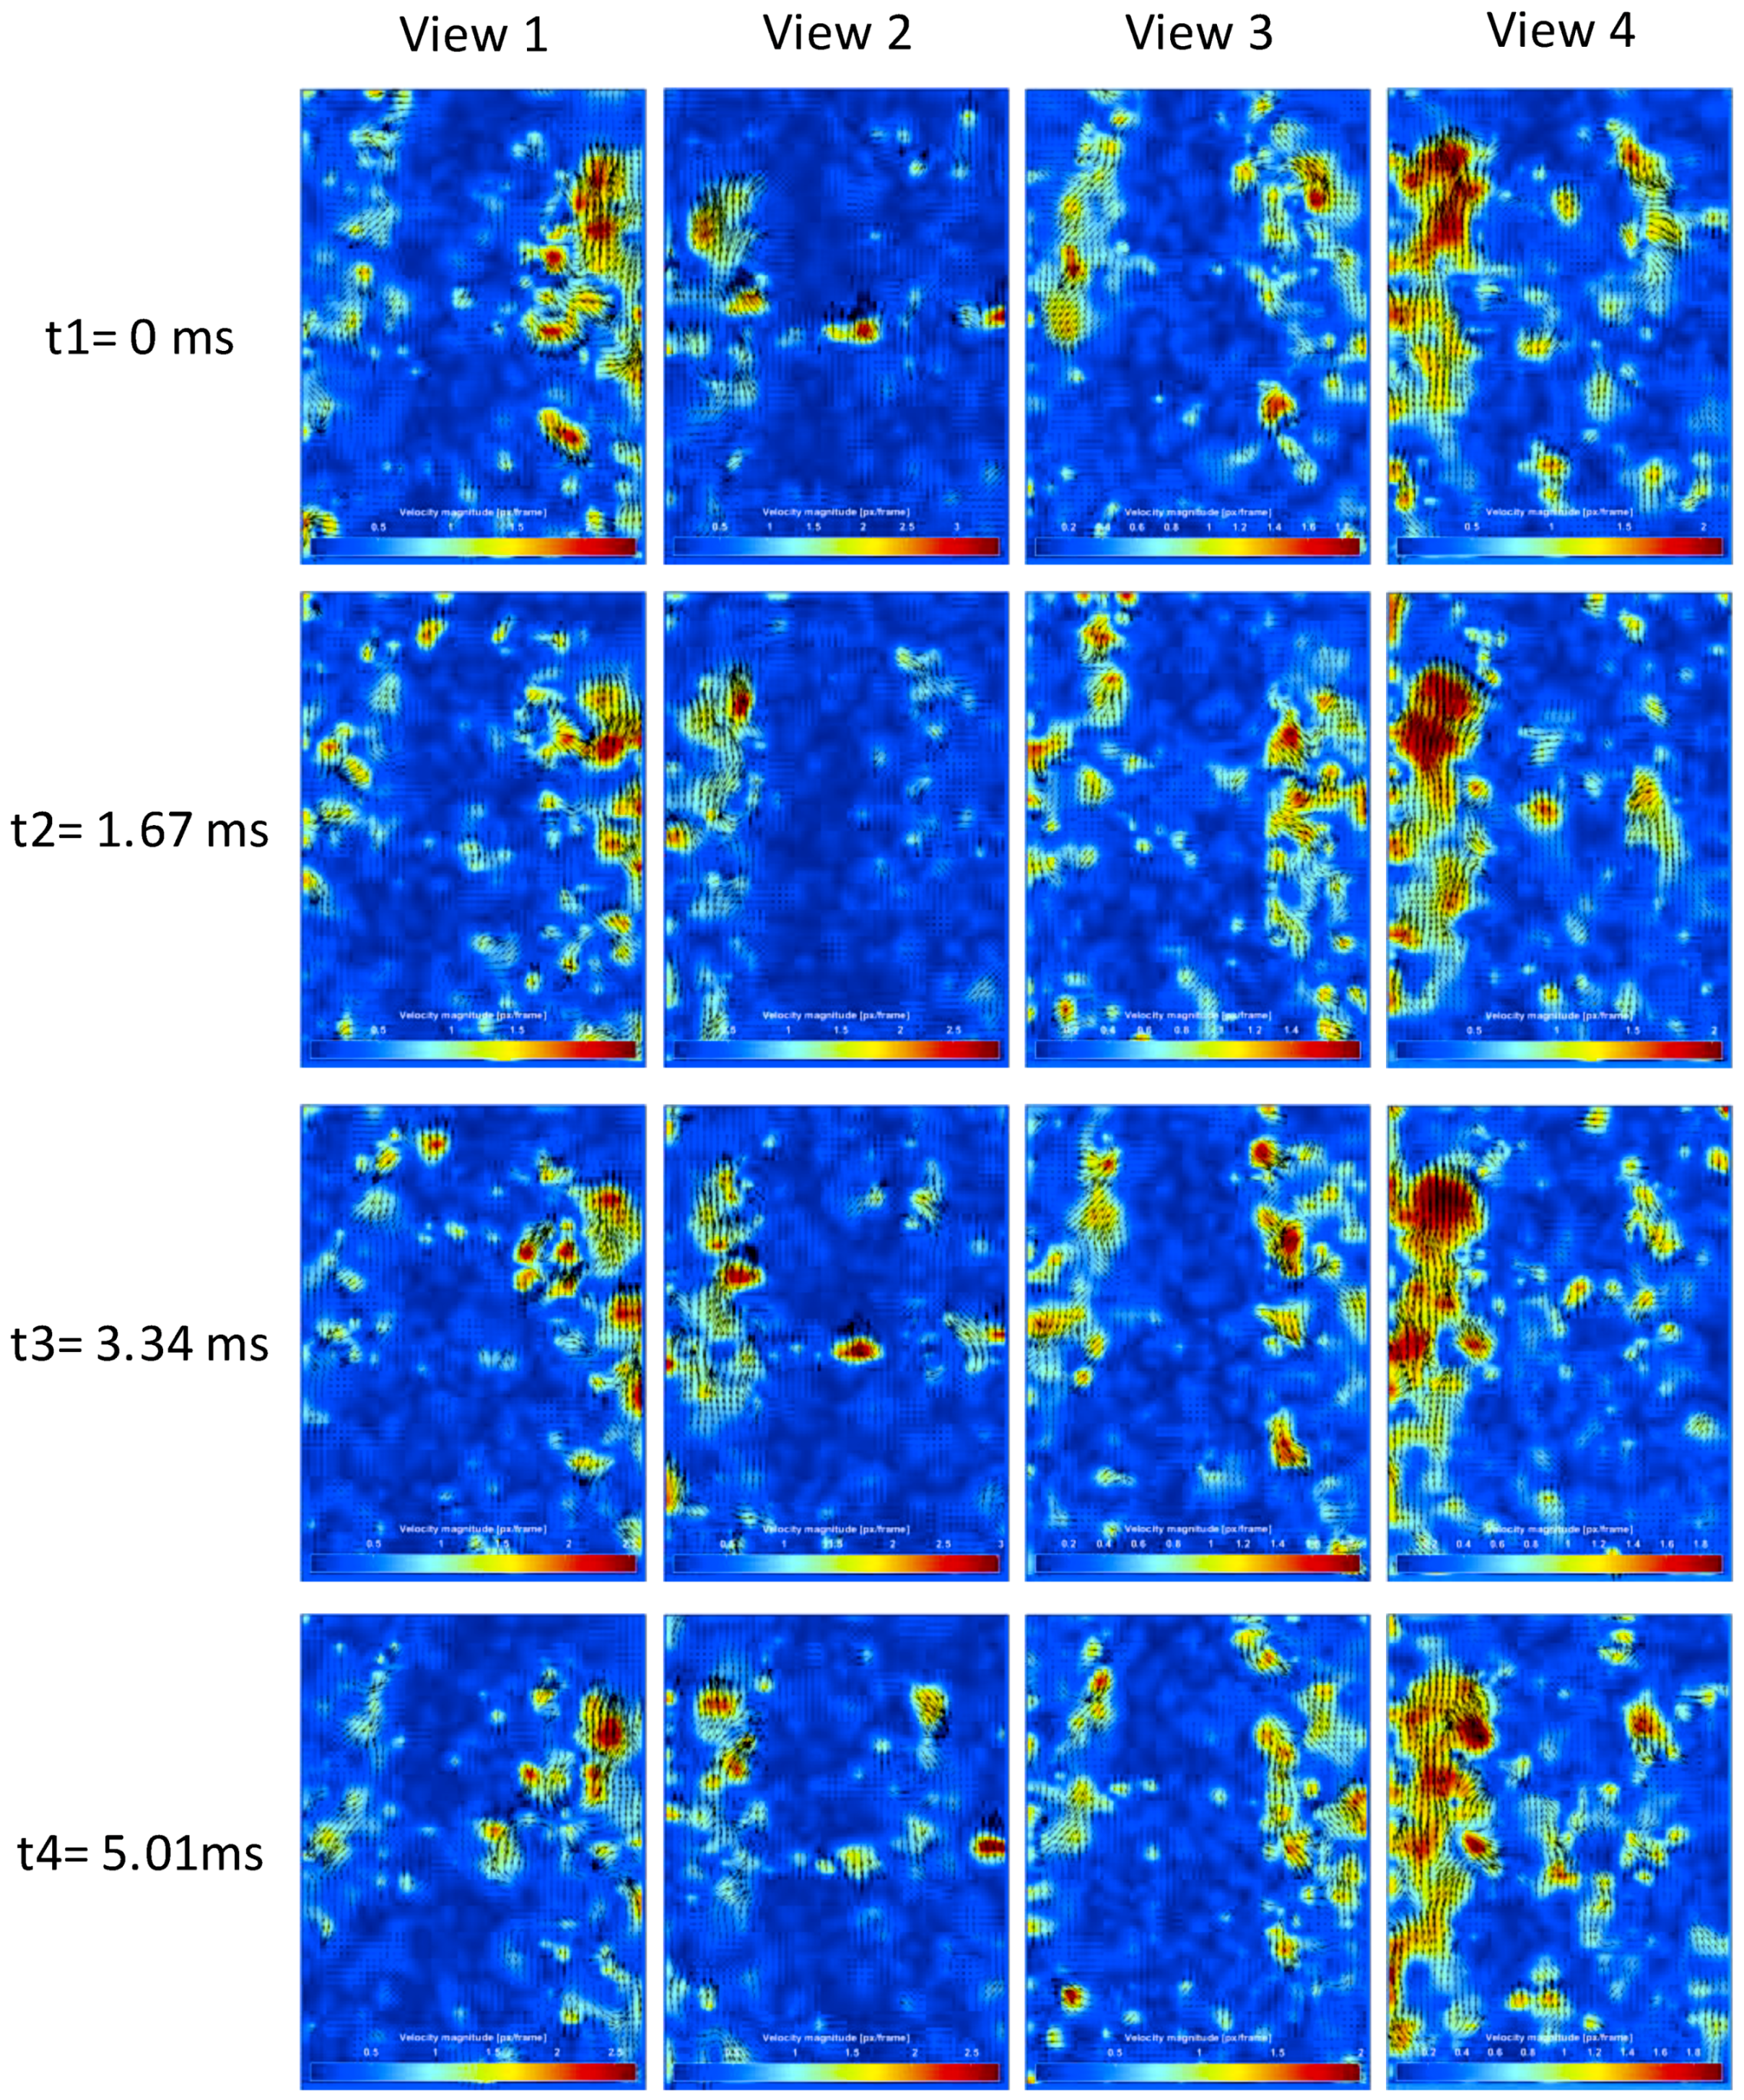
To present the PIV analysis process, four frames of image were selected as an example, whose time interval of each other is only 1.67 ms. The PIV analysis results of the selected four frames are presented in
Figure 14.
The velocity of the top area bubbles was bigger than that of the lower area. It got the maximum on the valve port area, where the water mixed with sands flows out of the cabined gap between valve seat and valve core. The bubble motion direction were partly upward because of the buoyancy of water. The jetting bubbles were quite small, which maybe shelter from the outside floating bubbles.
Figure 15 shows the velocity magnitude distribution of the PIV results in
Figure 14. It clearly presents the clusters distribution of the moving bubbles and their velocity. Based on the analysis results of
Figure 15, the moving bubbles among the center area of the images were rarely detected, due to the background (opaque valve core) and light interference. The bubble cluster among the valve port field were randomly distributed around the valve core. Using the three-dimensional imaging method, the bubbles missing tracking from one view could further be detected from another view. Then, the moving bubbles in the experiment images were fully tracked.
The velocity vector of
row
column from view
d is defined as
. The velocity vector matrix of a frame is defined as
.
.
,
m.
j = 1, 2, …,
n.
m is the lateral vector number of the PIV velocity results, which is equal to 50. And
n is the vertical vector number, which is equal to 69.
is the sum of
of the velocity vectors whose
in a frame of image. So, the floating bubbles’ velocity will not be considered in
.
In order to analyze the vertical velocity distribution, 50 frames of original experimental images from four views were randomly selected from 4 ∗ 5 experiment videos. These five high-speed experiment videos were the selected fragments whose multiphase flow were clear, stable and lasted for 5 ∗ 3 s in total.
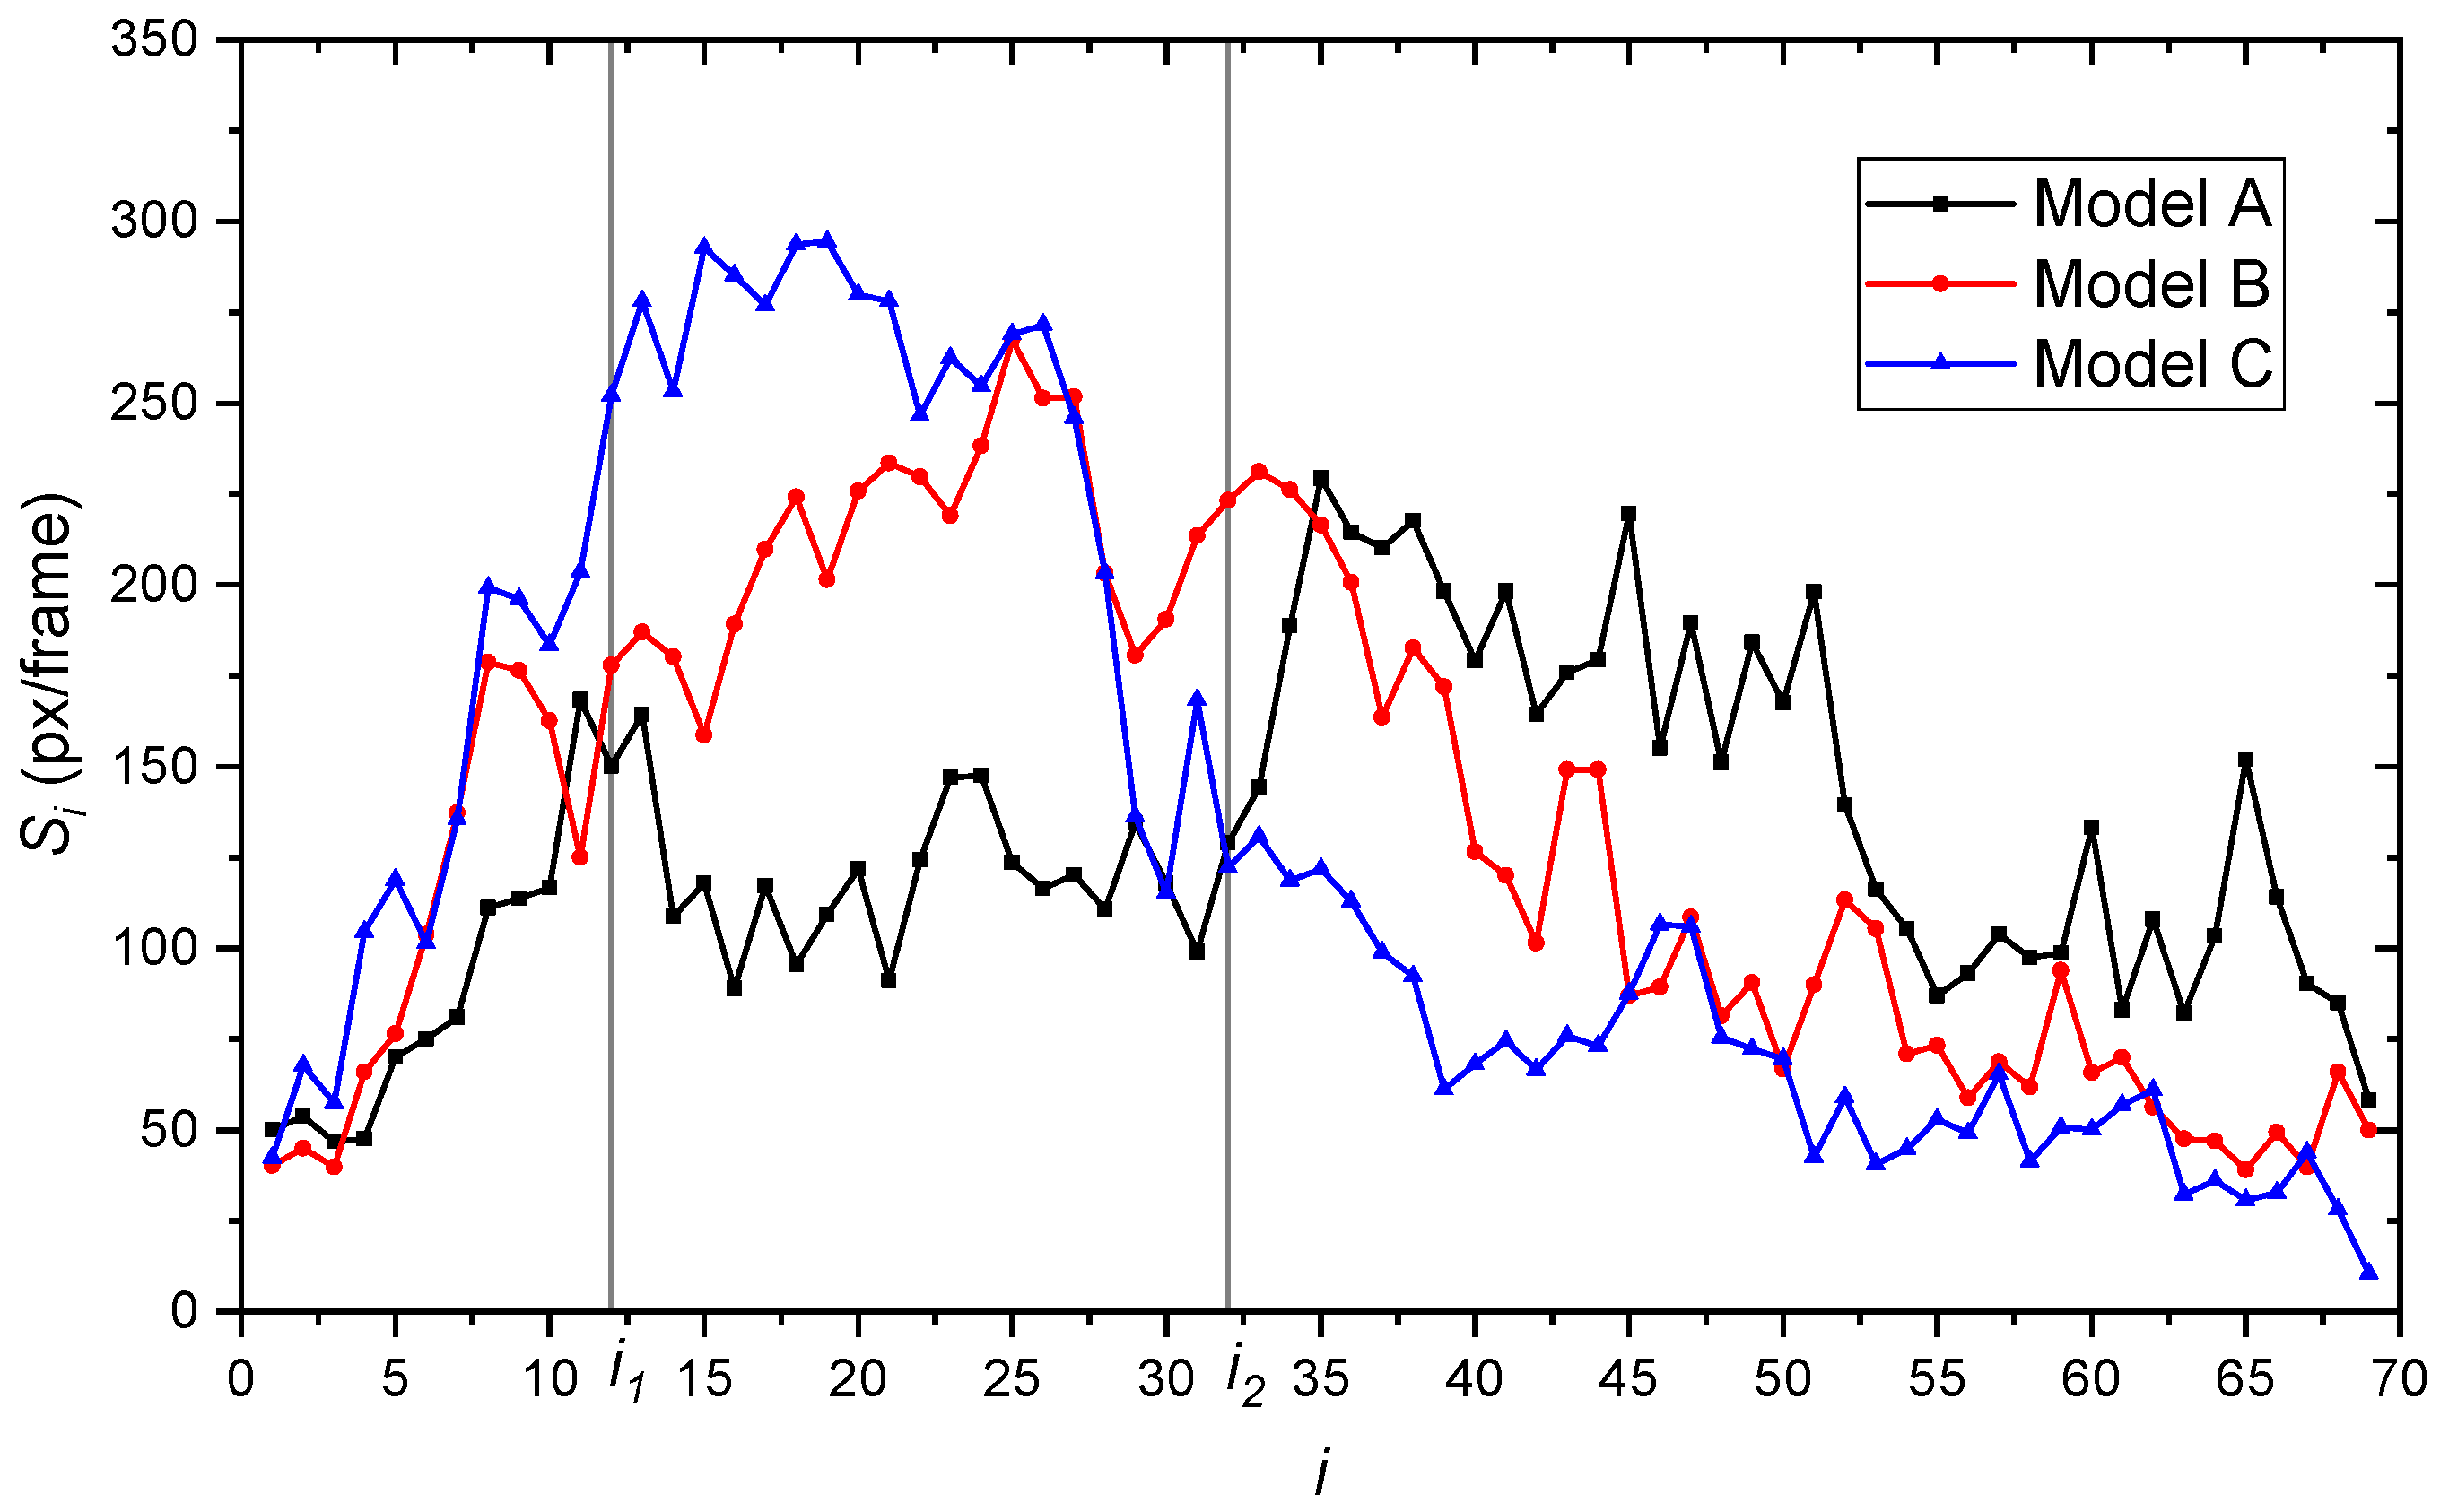
can represent the common vertical velocity on the depth of i. As i increases, the velocity of the bubbles will be smaller and smaller due to resistance of water and the buoyancy of the bubbles. There are also fewer and fewer bubbles that can reach the deeper position, which corresponds to a lower .
Figure 16 shows the
changes in the
i interval between 1 to 69. The interval can be roughly divided into three subintervals based on the changes of
, which are 1-
,
-
, and
-69.
.
. It is noticed that from 1 to
, all the
of the three models greatly increase. This subinterval is near the outlet of valve port. Thus, the bubbles size and position are limited around the valve port field. The bubbles rapidly expand in size and grow into bubble cluster. After the growing interval, model C had the largest
at a shallower position, compared with model A and B. Its
decreased when
. When
, the
of model C began to fall generally to less than 11 px/frame at the bottom of the experiment’s images. Compared with model A and B, the velocity condition of model C was the best. The number of fast moving bubbles at the interval from
to the bottom was less than the others in common. This proves that the bionic structure on the valve core plays a positive role in reducing the flow velocity and further improve the service time of the sealing face. Compared with model C, the
of model A and B had a longer distance to growing the bubbles. This may be concerned with the fractal structure of model C. The non-smooth structure on the valve core significantly influenced the flow velocity and direction. The trend on vertical velocity of model B and C was similar, with a better performance from model C. Compared with model B and C, model A with the original structure had more numbers of fast moving bubbles. This means that when the water flows out into valve and through sealing surface, the sand mixed in the water will correspondingly have more energy. Overall, the experiment results testified the effectiveness of the multi-source coupling bionic design of the valve core structure.


