ACPOA: An Adaptive Cooperative Pelican Optimization Algorithm for Global Optimization and Multilevel Thresholding Image Segmentation
Abstract
1. Introduction
- (1)
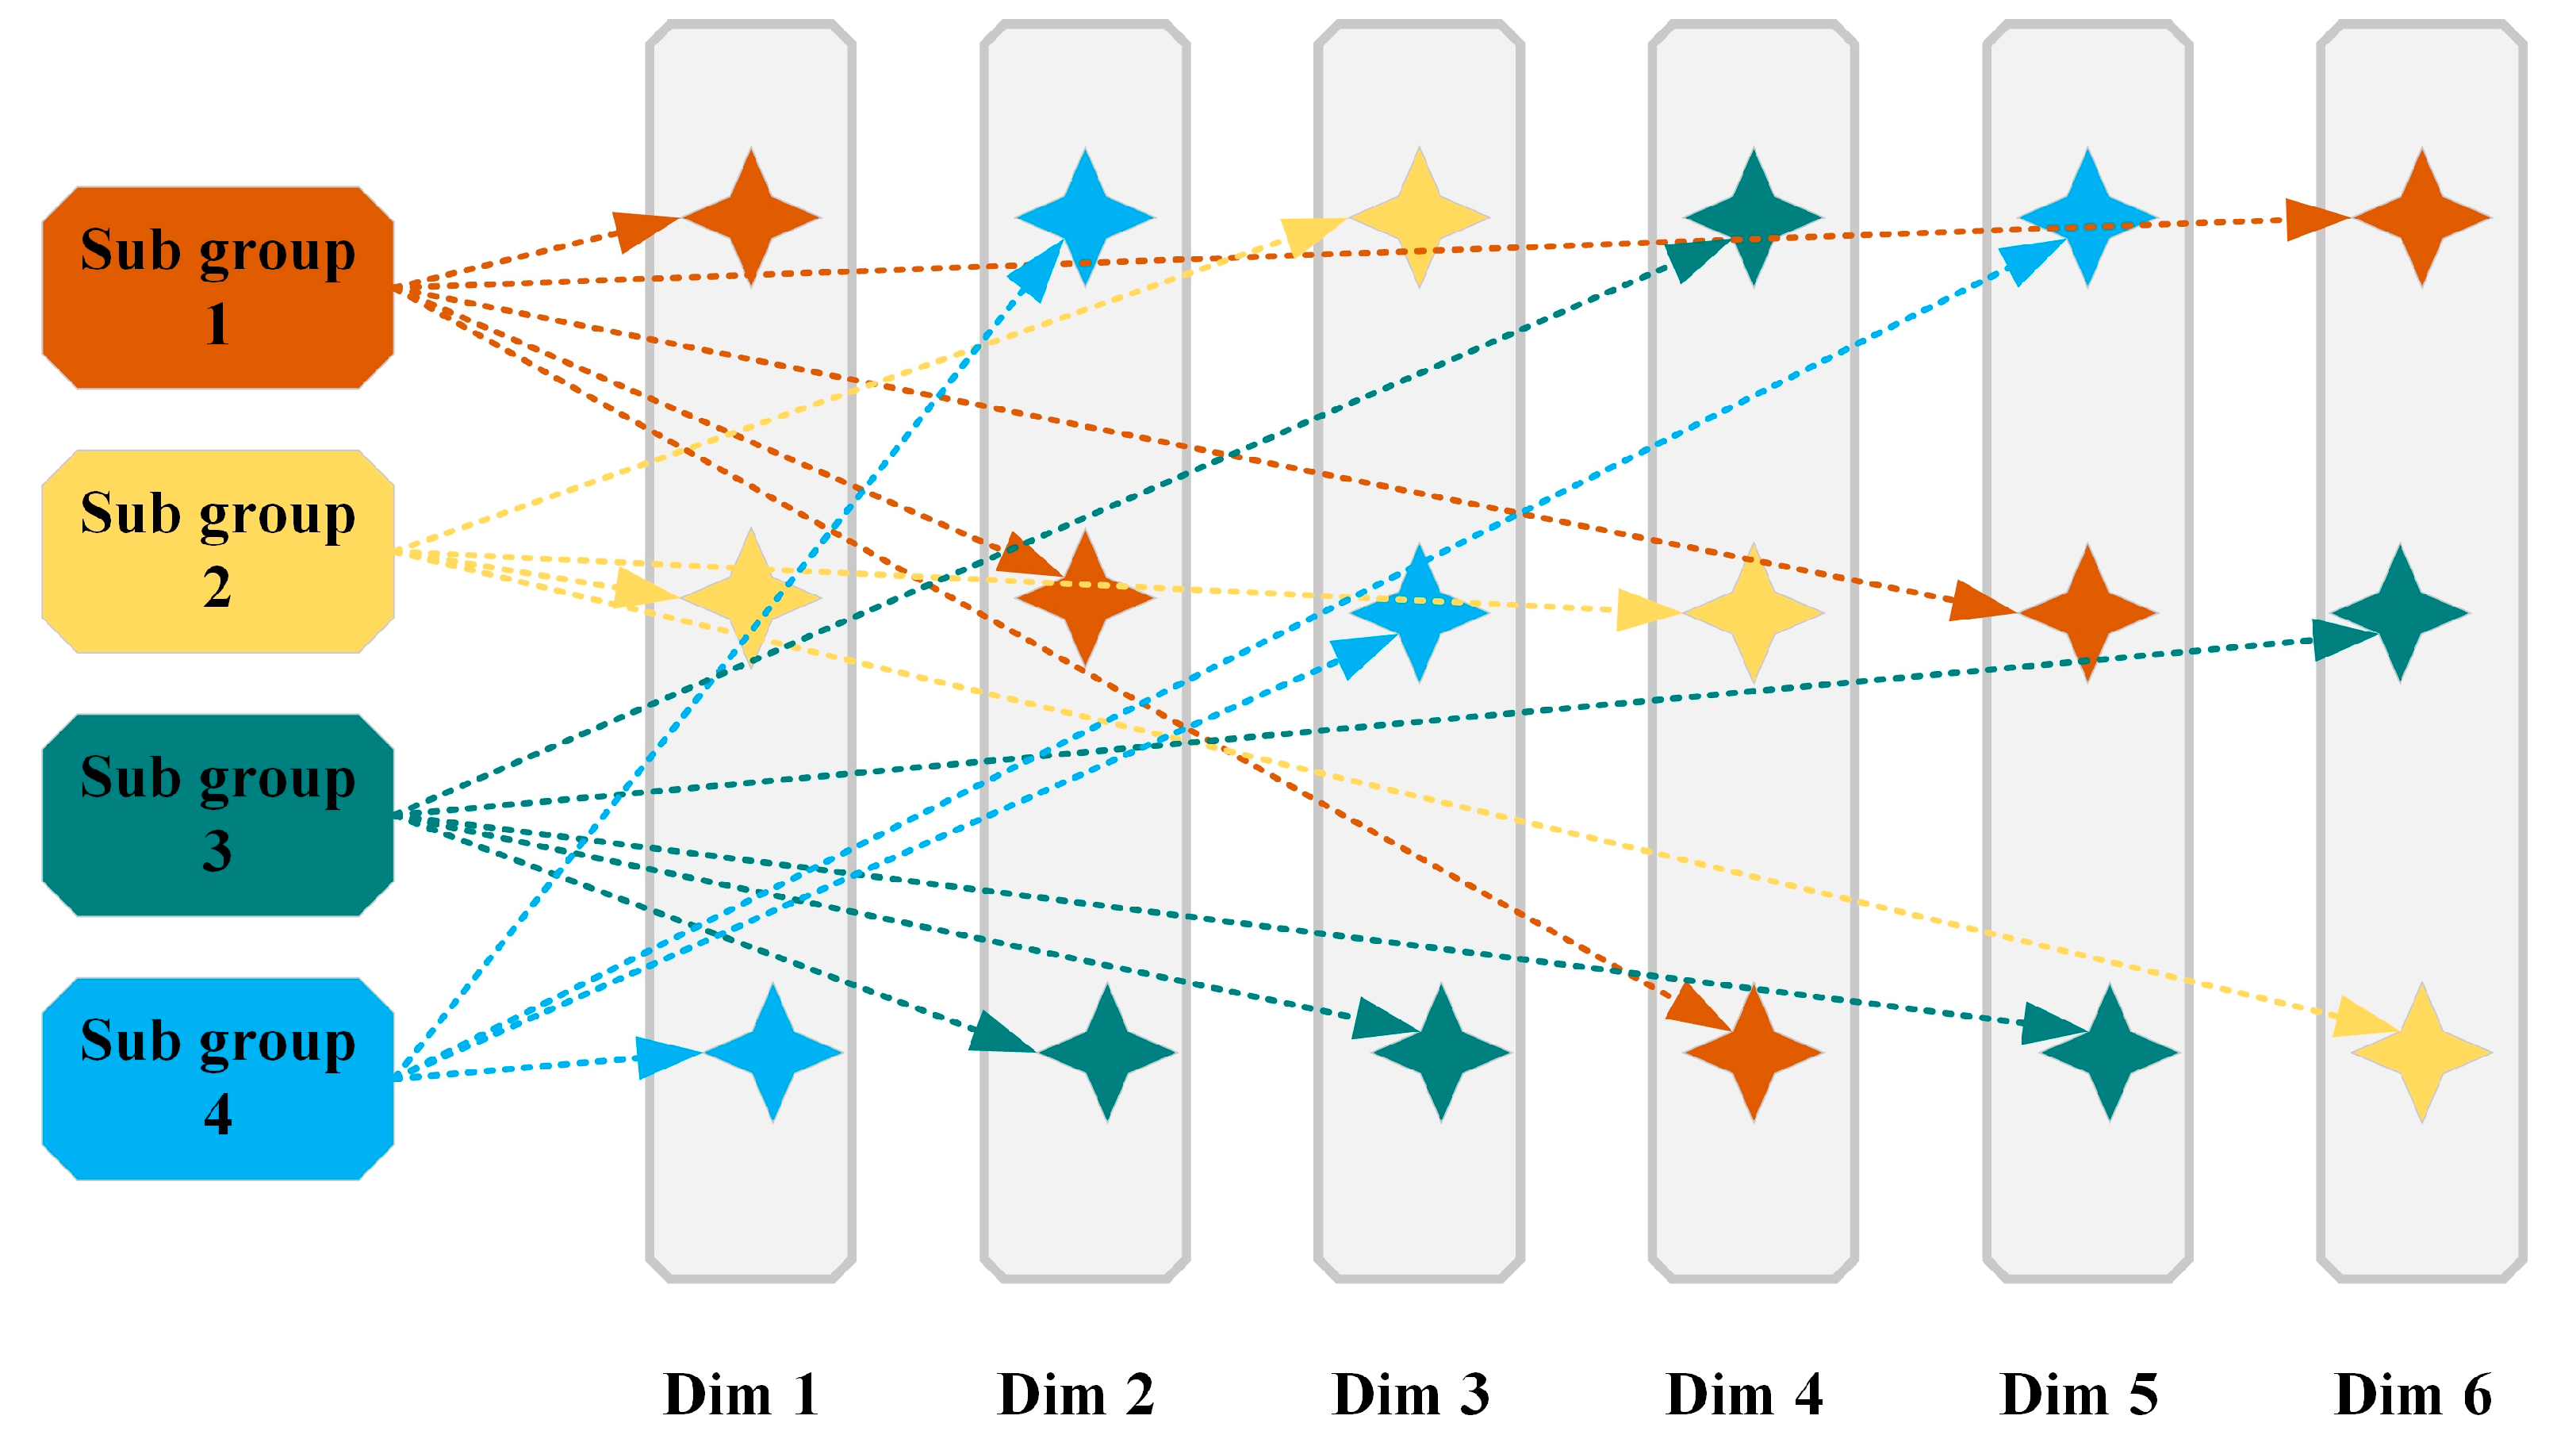
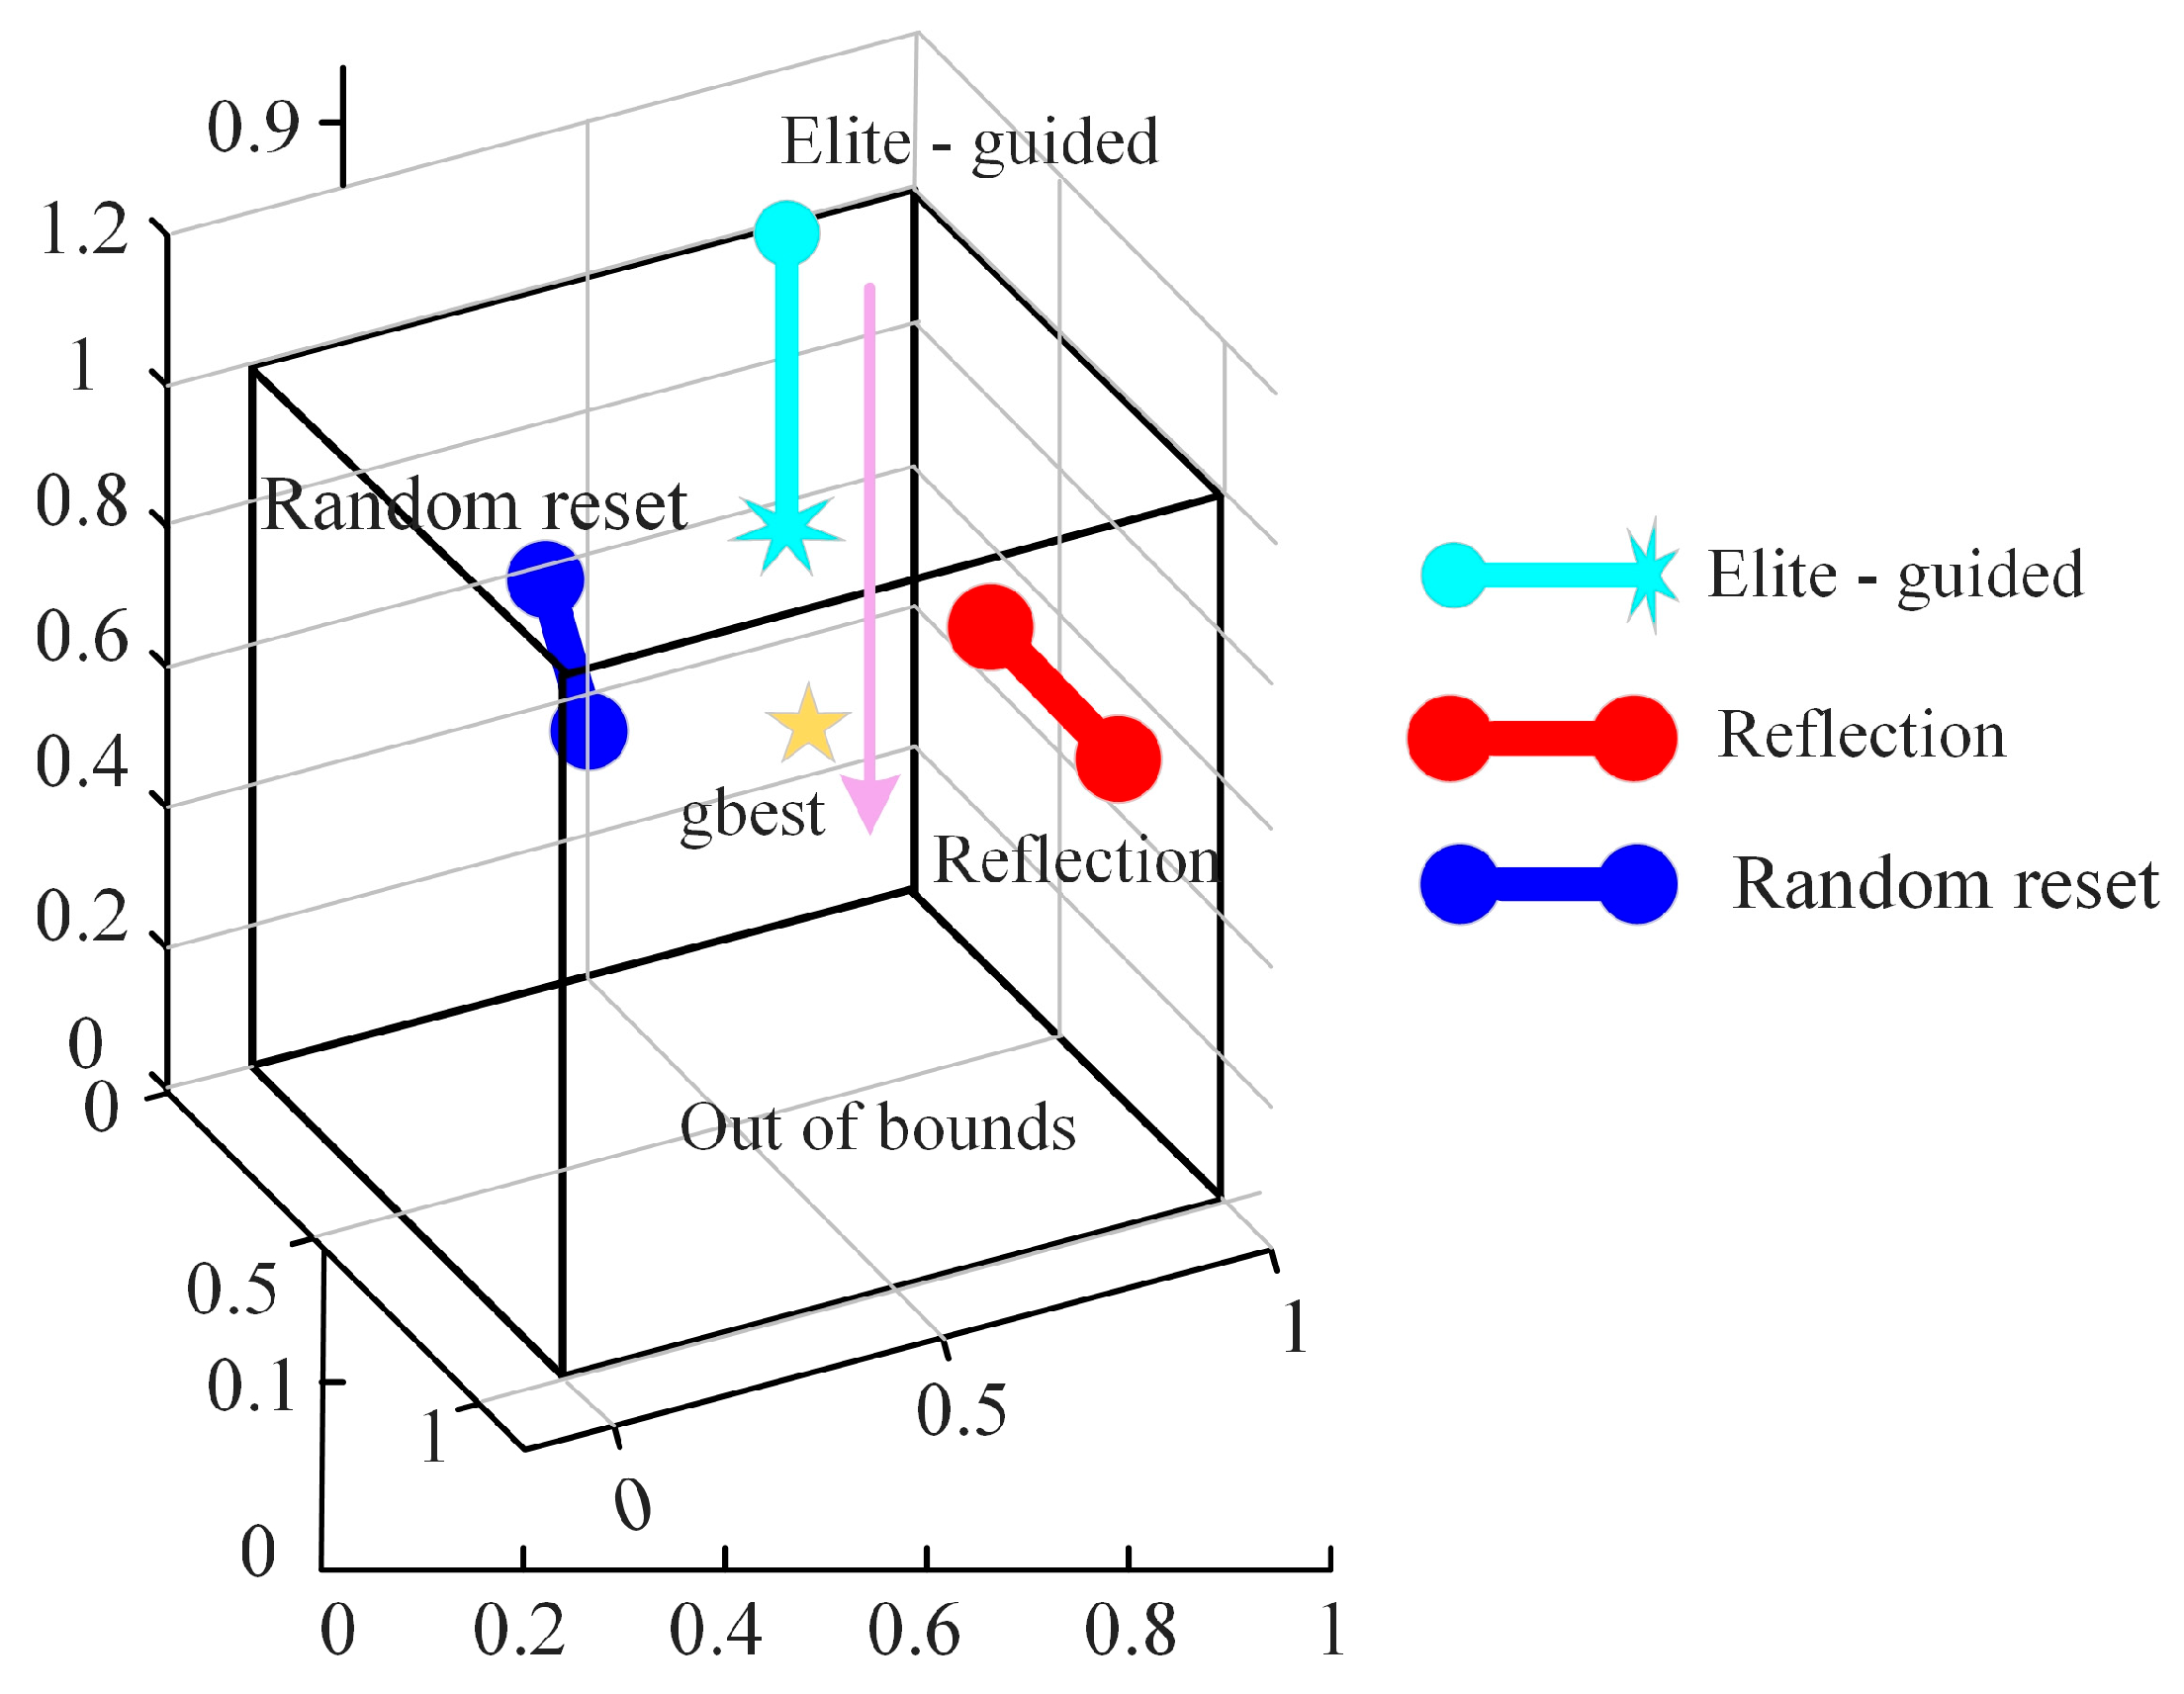
- Proposal of the improved algorithm ACPOA: By integrating three innovative strategies into the Pelican Optimization Algorithm (POA), an Adaptive Cooperative Pelican Optimization Algorithm (ACPOA) is proposed. These strategies—namely the elite pool mutation strategy, adaptive cooperative mechanism, and hybrid boundary handling technique—effectively enhance the algorithm’s global exploration ability, local exploitation accuracy, high-dimensional search efficiency, and boundary processing capability. Together, they address the limitations of standard POA, such as premature convergence to local optima and rapid loss of population diversity in complex optimization problems;
- (2)
- Validation of optimization performance: The performance of ACPOA is evaluated on the CEC2017 and CEC2022 benchmark test suite, in comparison with eight state-of-the-art algorithms (such as Particle Swarm Optimization (PSO), Grey Wolf Optimizer (GWO), Whale Optimization Algorithm (WOA), etc.). Statistical indicators including mean, standard deviation, and ranking are used to comprehensively demonstrate the superiority of ACPOA in solving optimization problems of various dimensions and function types, particularly in terms of convergence speed, solution accuracy, and stability;
- (3)
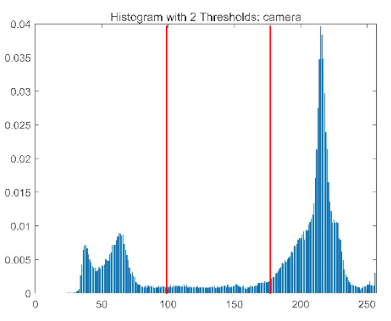
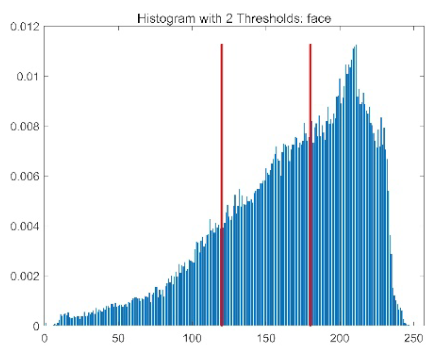
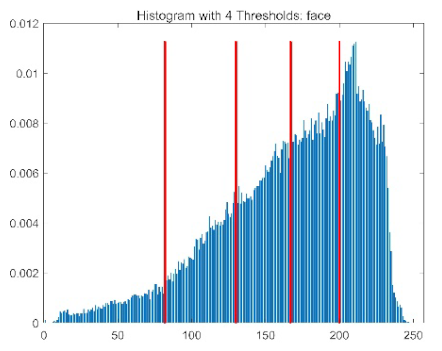
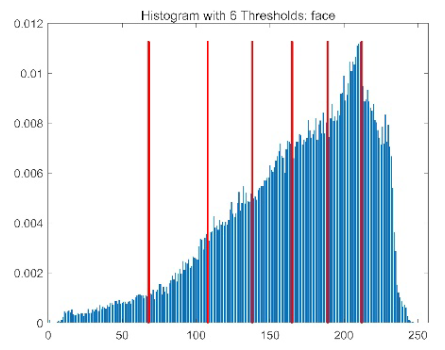
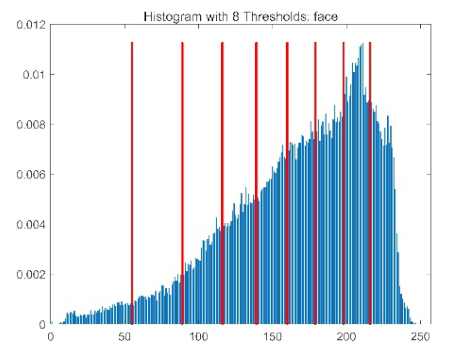
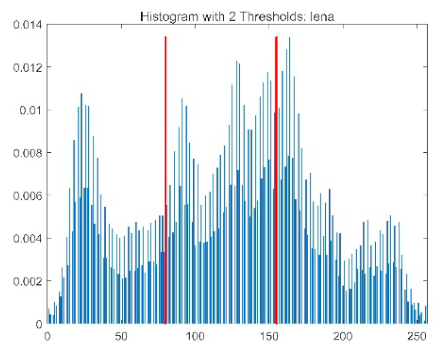
- Application to multilevel threshold image segmentation: ACPOA is applied to multilevel threshold image segmentation tasks using Otsu’s method as the objective function. Segmentation is performed at 2, 4, 6, and 8 threshold levels on five benchmark images. The results, evaluated by Peak Signal-to-Noise Ratio (PSNR), Structural Similarity Index (SSIM), and Feature Similarity Index (FSIM), show that ACPOA outperforms the comparison algorithms, confirming its effectiveness in practical image processing applications.
2. Pelican Optimization Algorithm and the Proposed Methodology
2.1. Pelican Optimization Algorithm
2.1.1. Inspiration of POA
2.1.2. Mathematical Model of POA
- (1)
- Exploration Phase: Movement Toward the Prey
- (2)
- Exploitation Phase: Spreading Wings on the Water Surface
2.2. Adaptive Cooperative Pelican Optimization Algorithm
2.2.1. Elite-Pool Mutation Strategy
2.2.2. Adaptive Cooperative Mechanism
2.2.3. Hybrid Boundary Handing
| Algorithm 1 Pseudo-Code of ACPOA. |
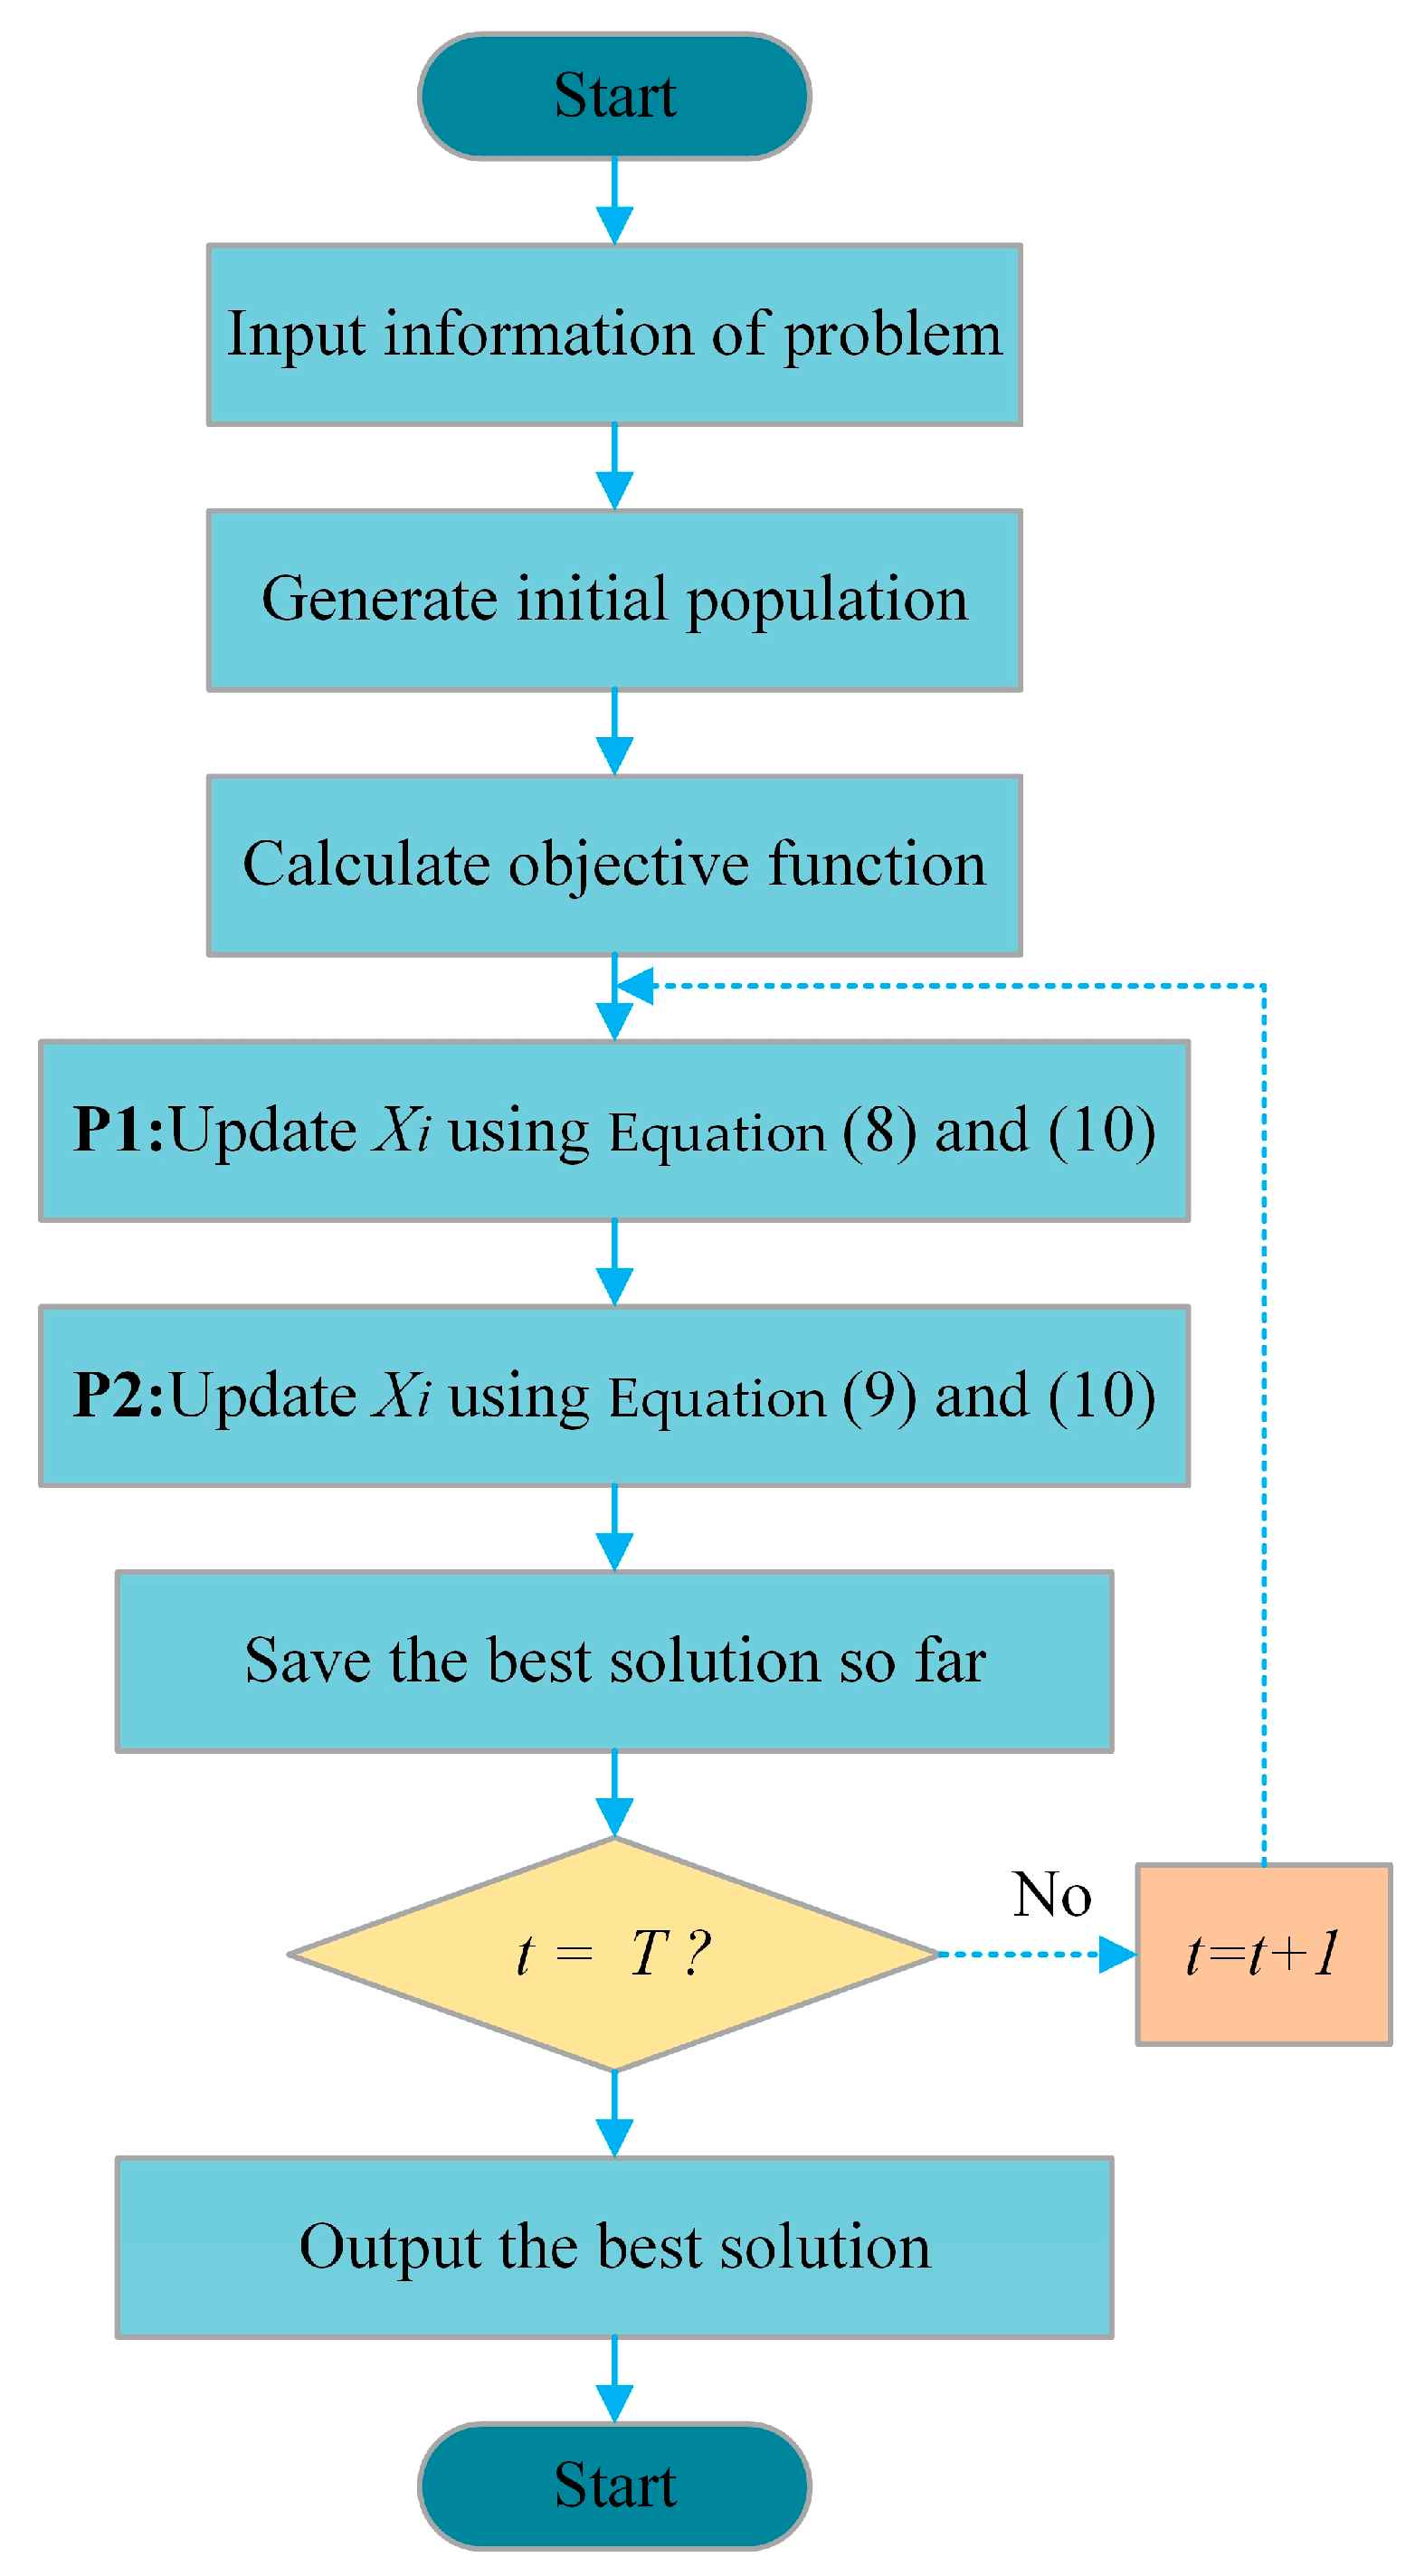
| individuals sorted by fitness. 6: Generate the position of the prey at random 8: Phase 1: Moving towards prey (exploration phase) 9: Calculate new status of Pelican using Equation (8) 10: Update the population member of Pelican using Equation (4) 11: Boundary handing using Equation (10) 12: Phase 2: Winging on the water surface (exploitation phase) 13: Calculate new status of Pelican using Equation (9) 14: Update the population member of Pelican using Equation (4) 15: Boundary handing using Equation (10) 16: end 17: Update the best candidate solution 19: end 20: end for 21: Output |
3. Experimental Results and Analysis
3.1. Test Function and Compare Algorithms Parameter Settings
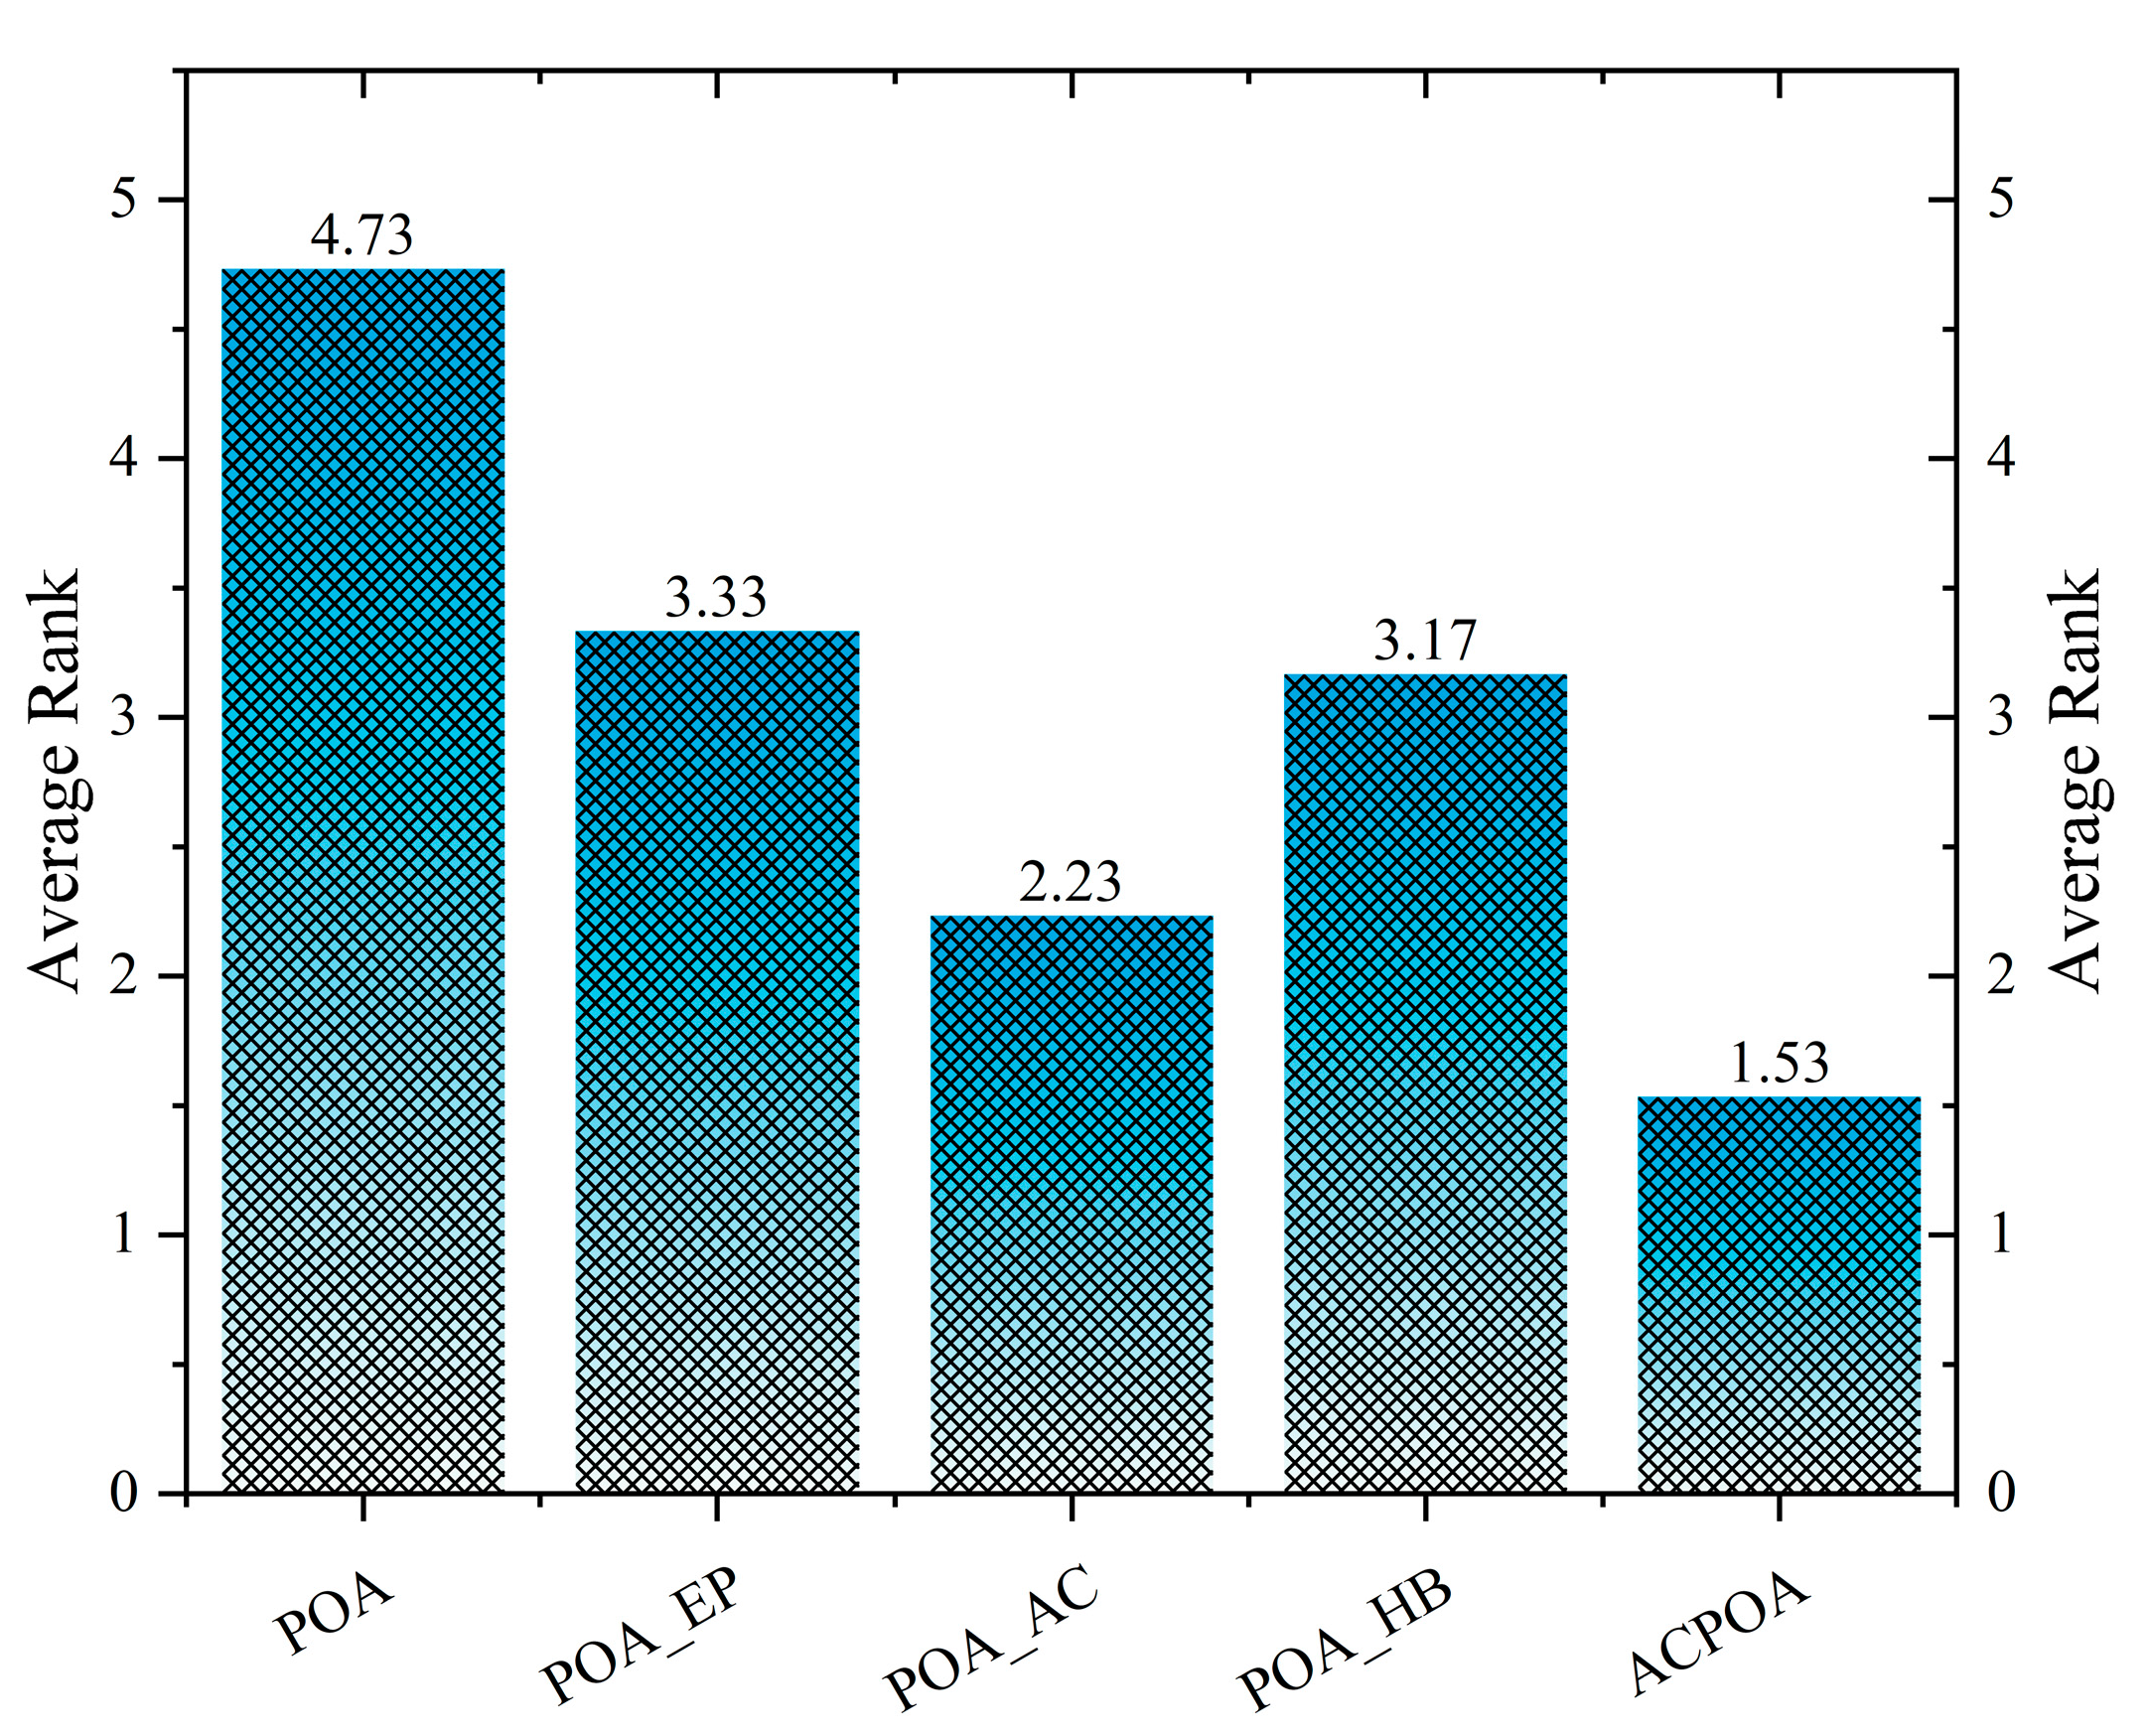
3.2. Ablation Experiment
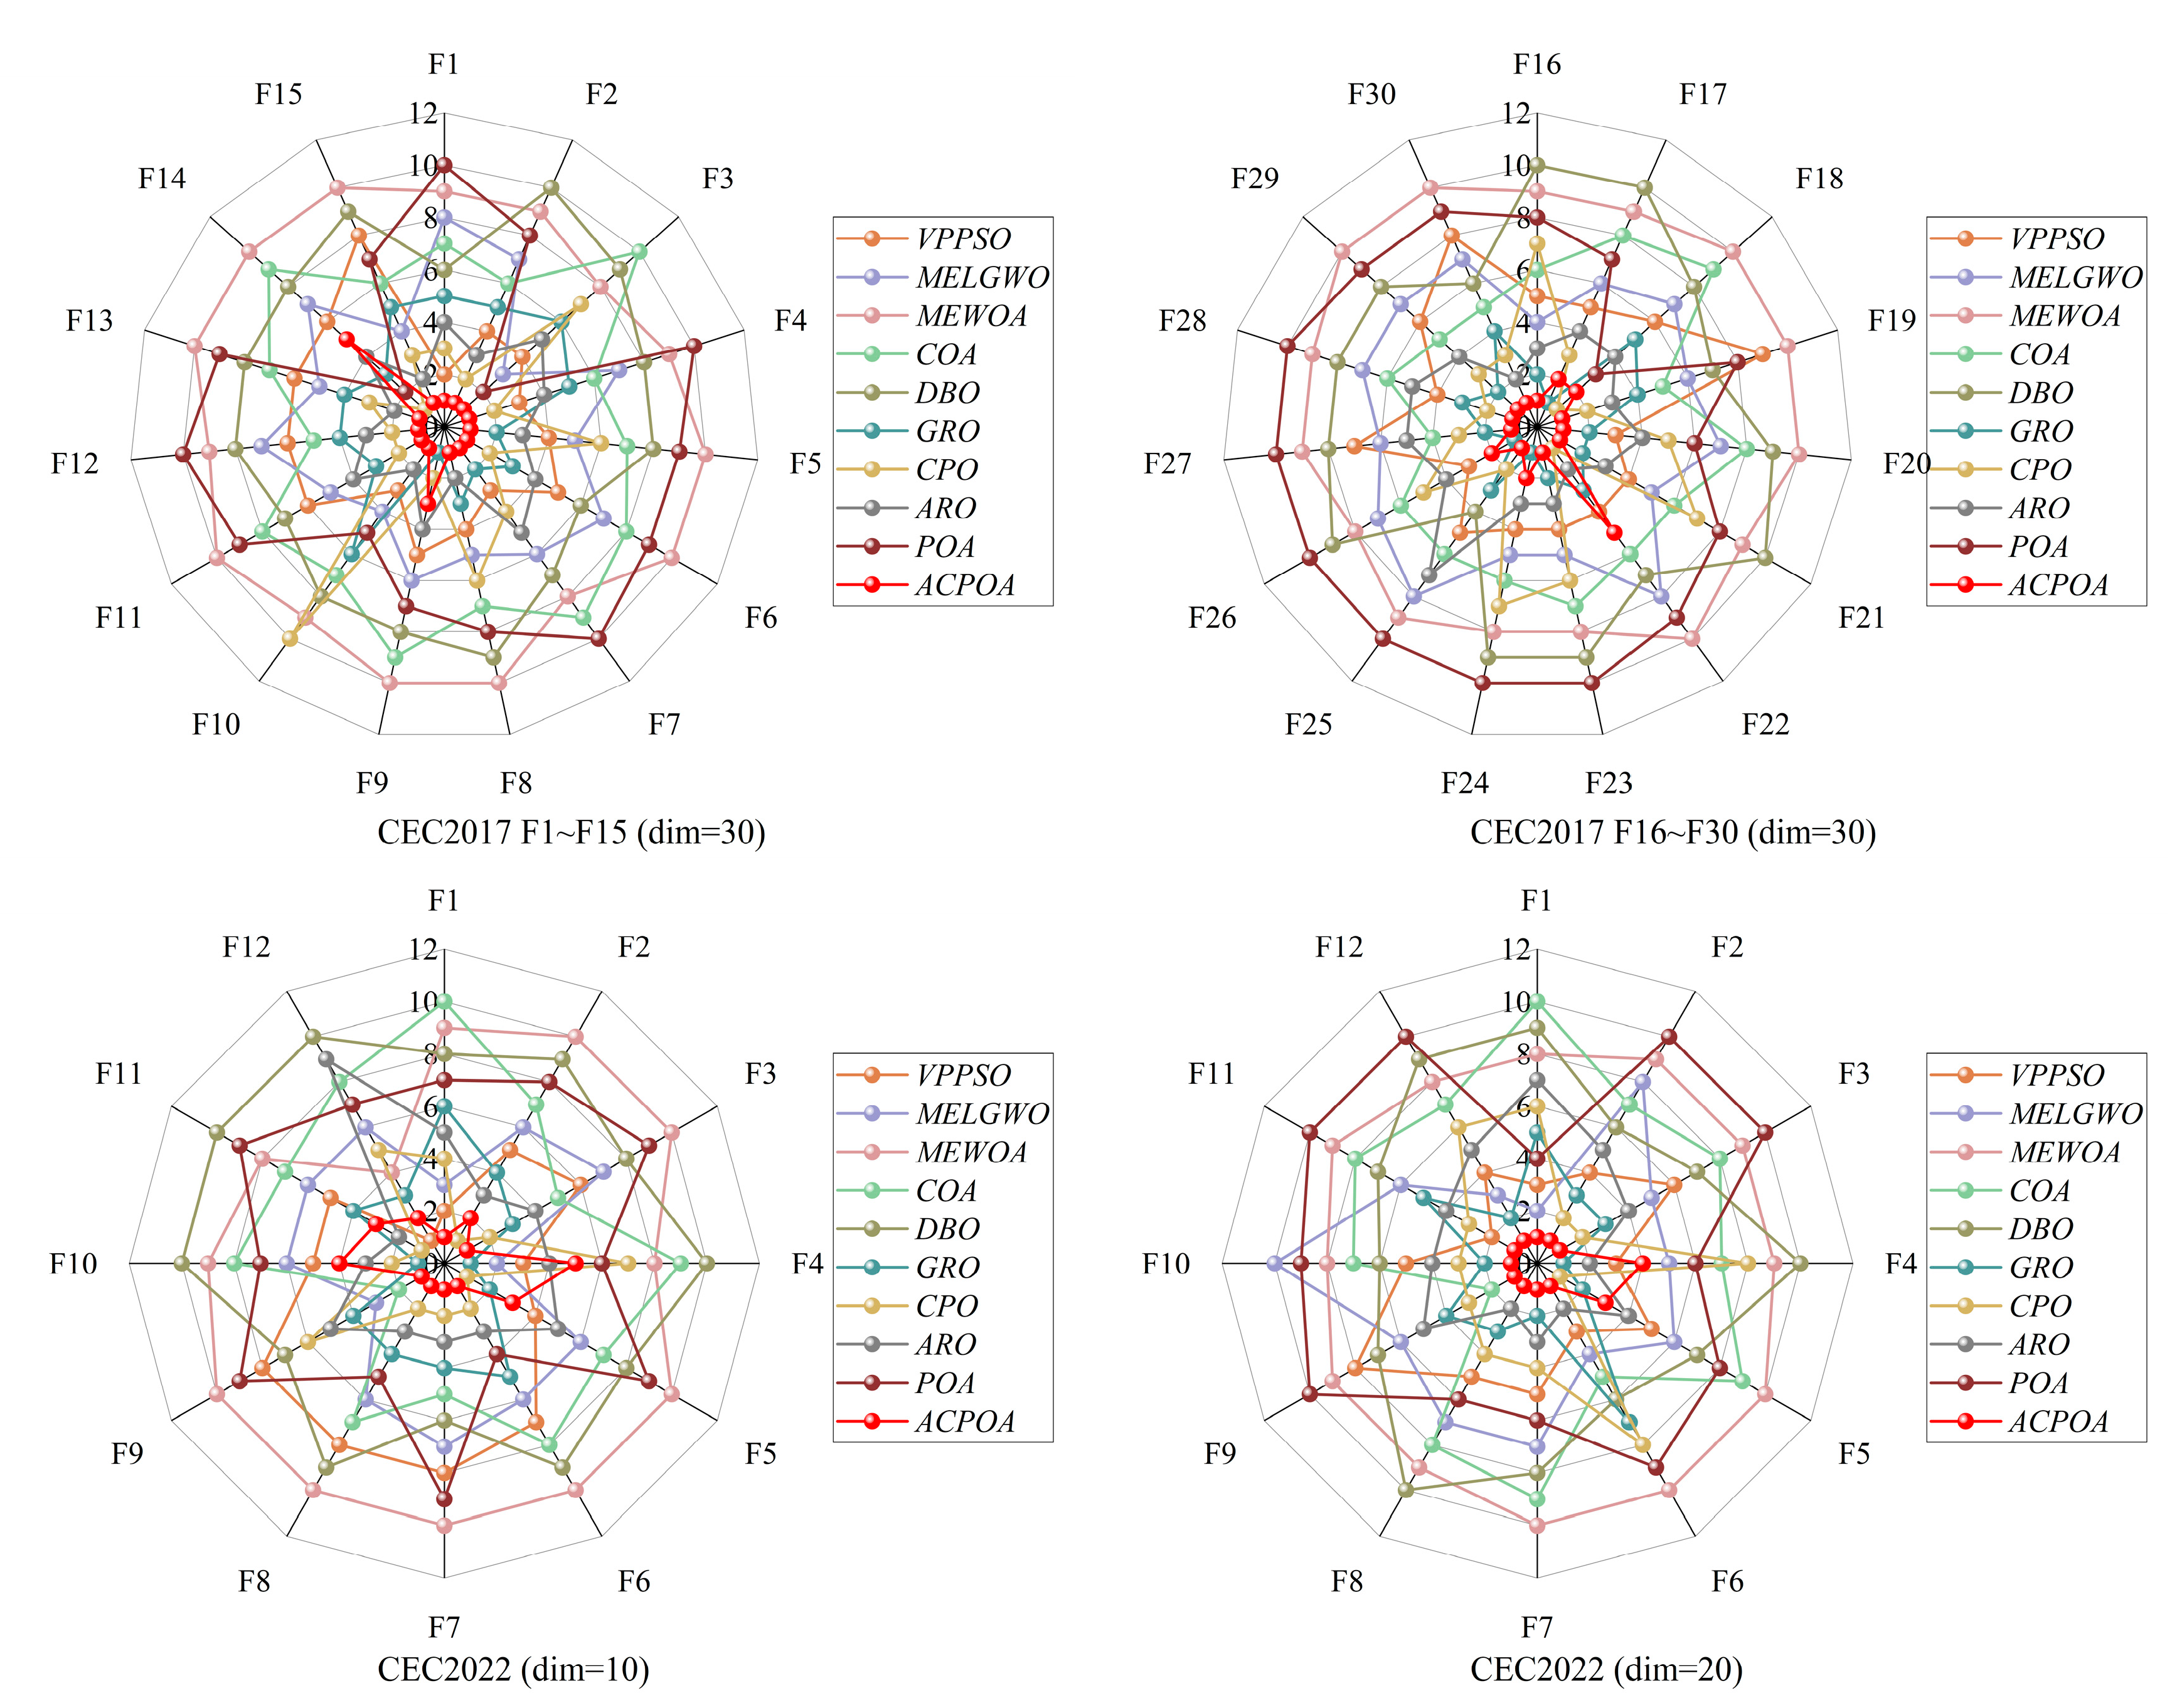
3.3. Assessing Performance with CEC2017 and CEC2022 Test Suite
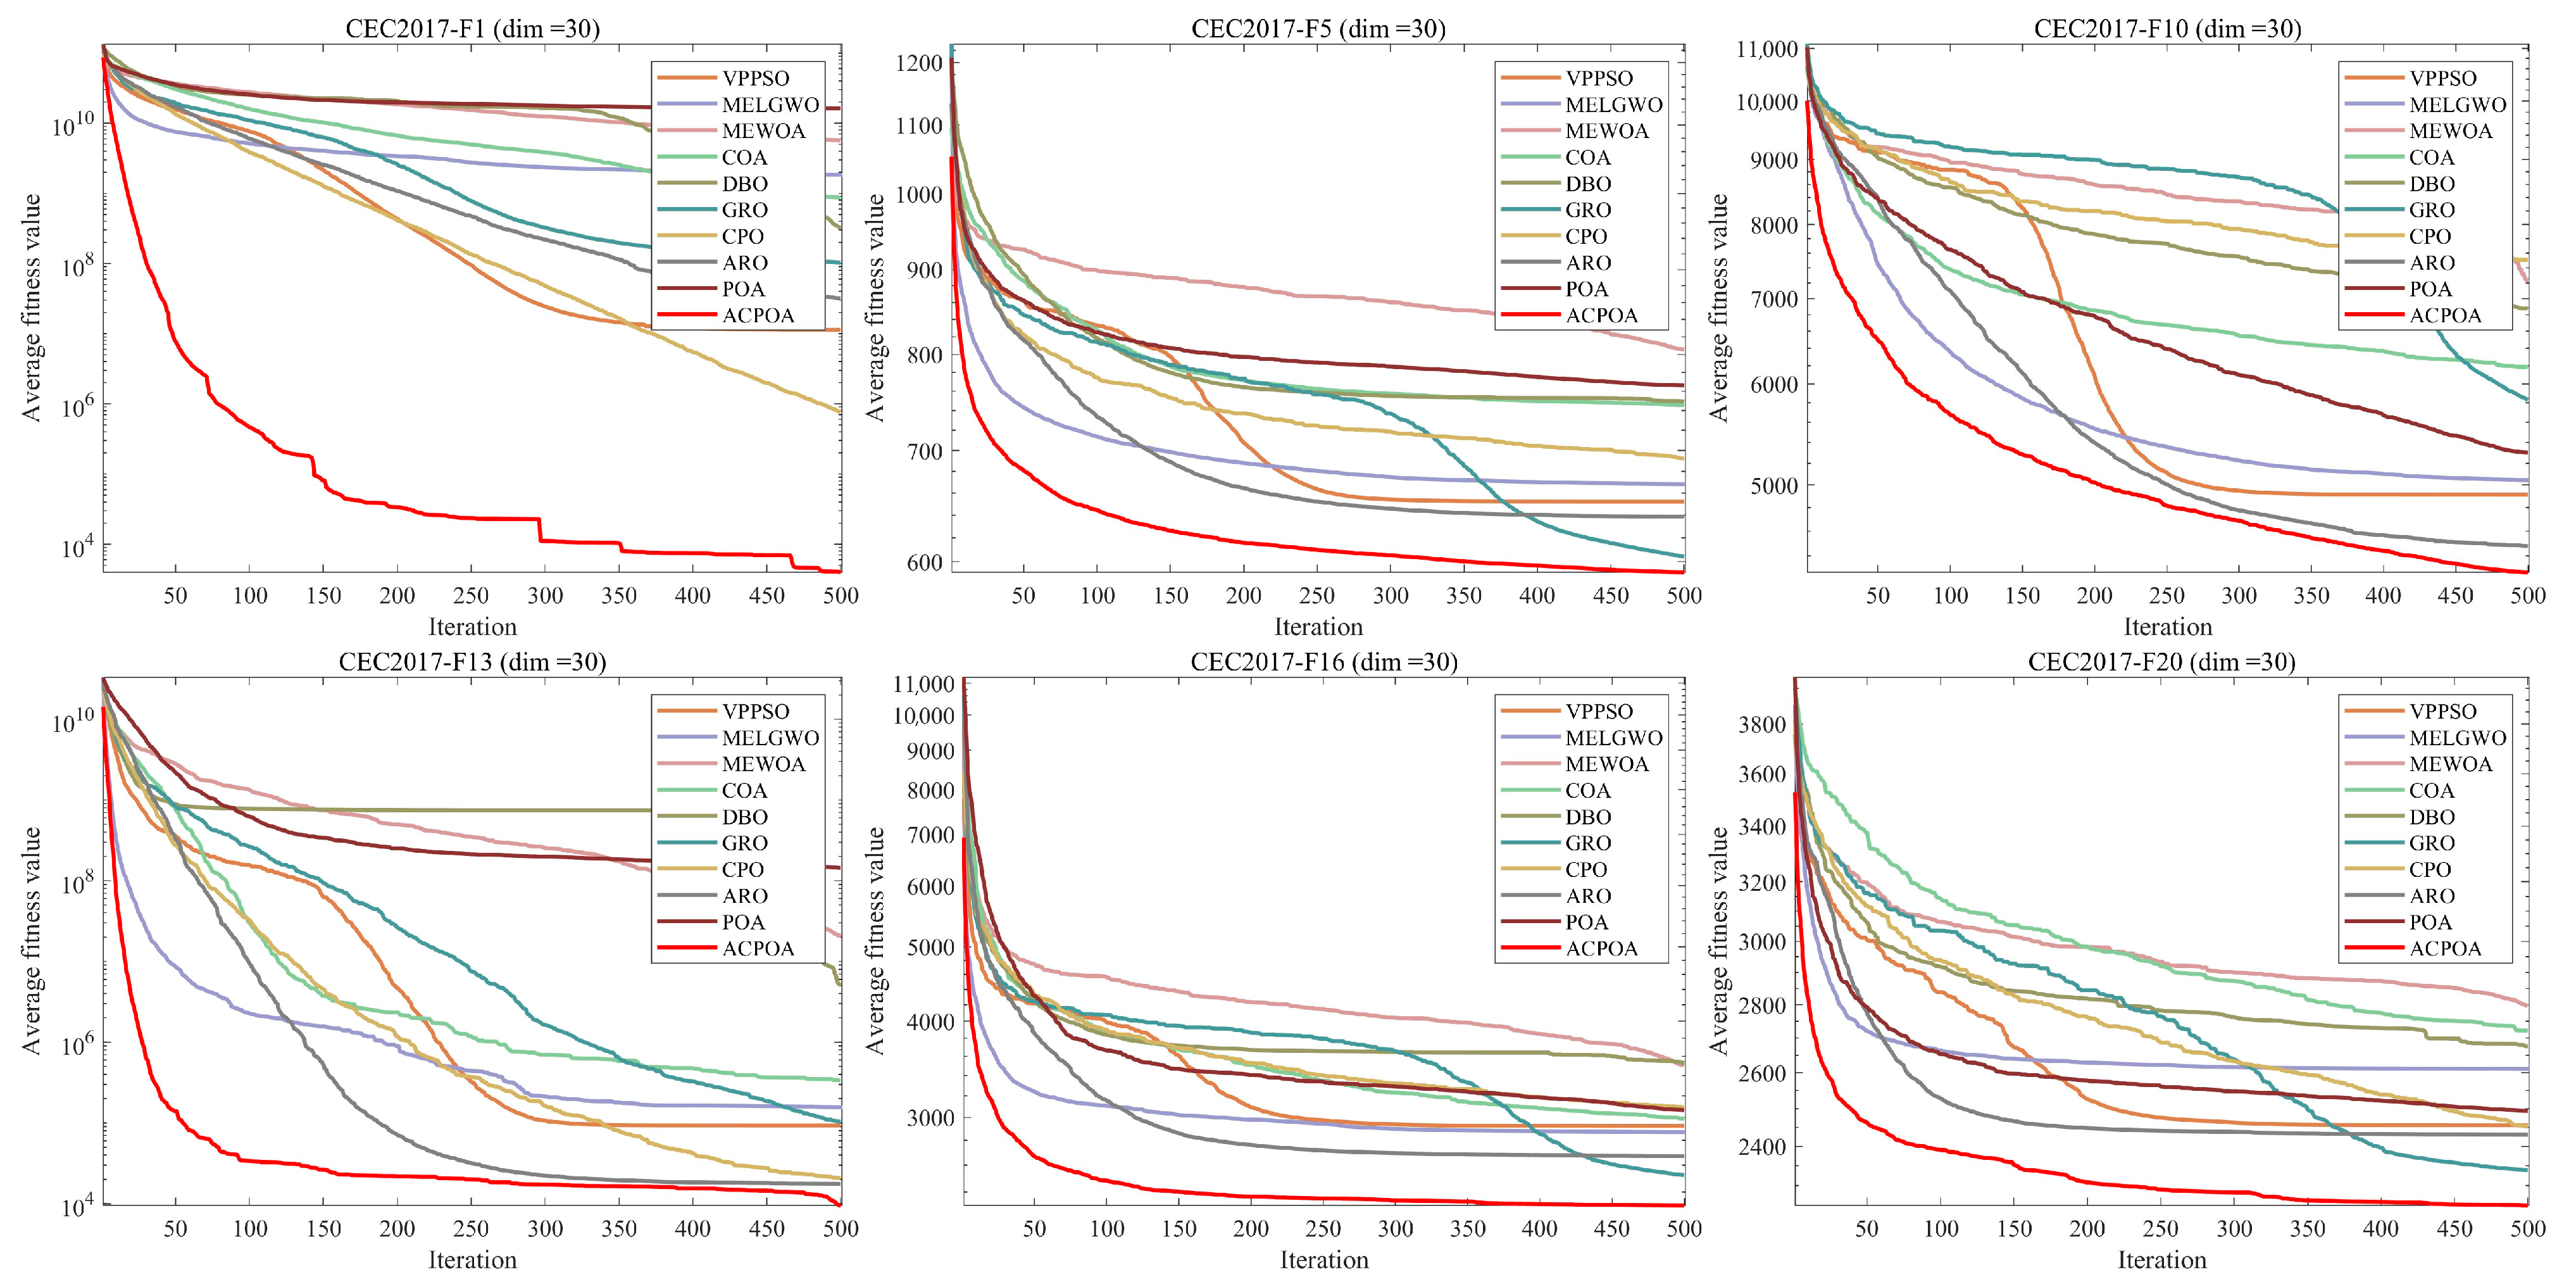
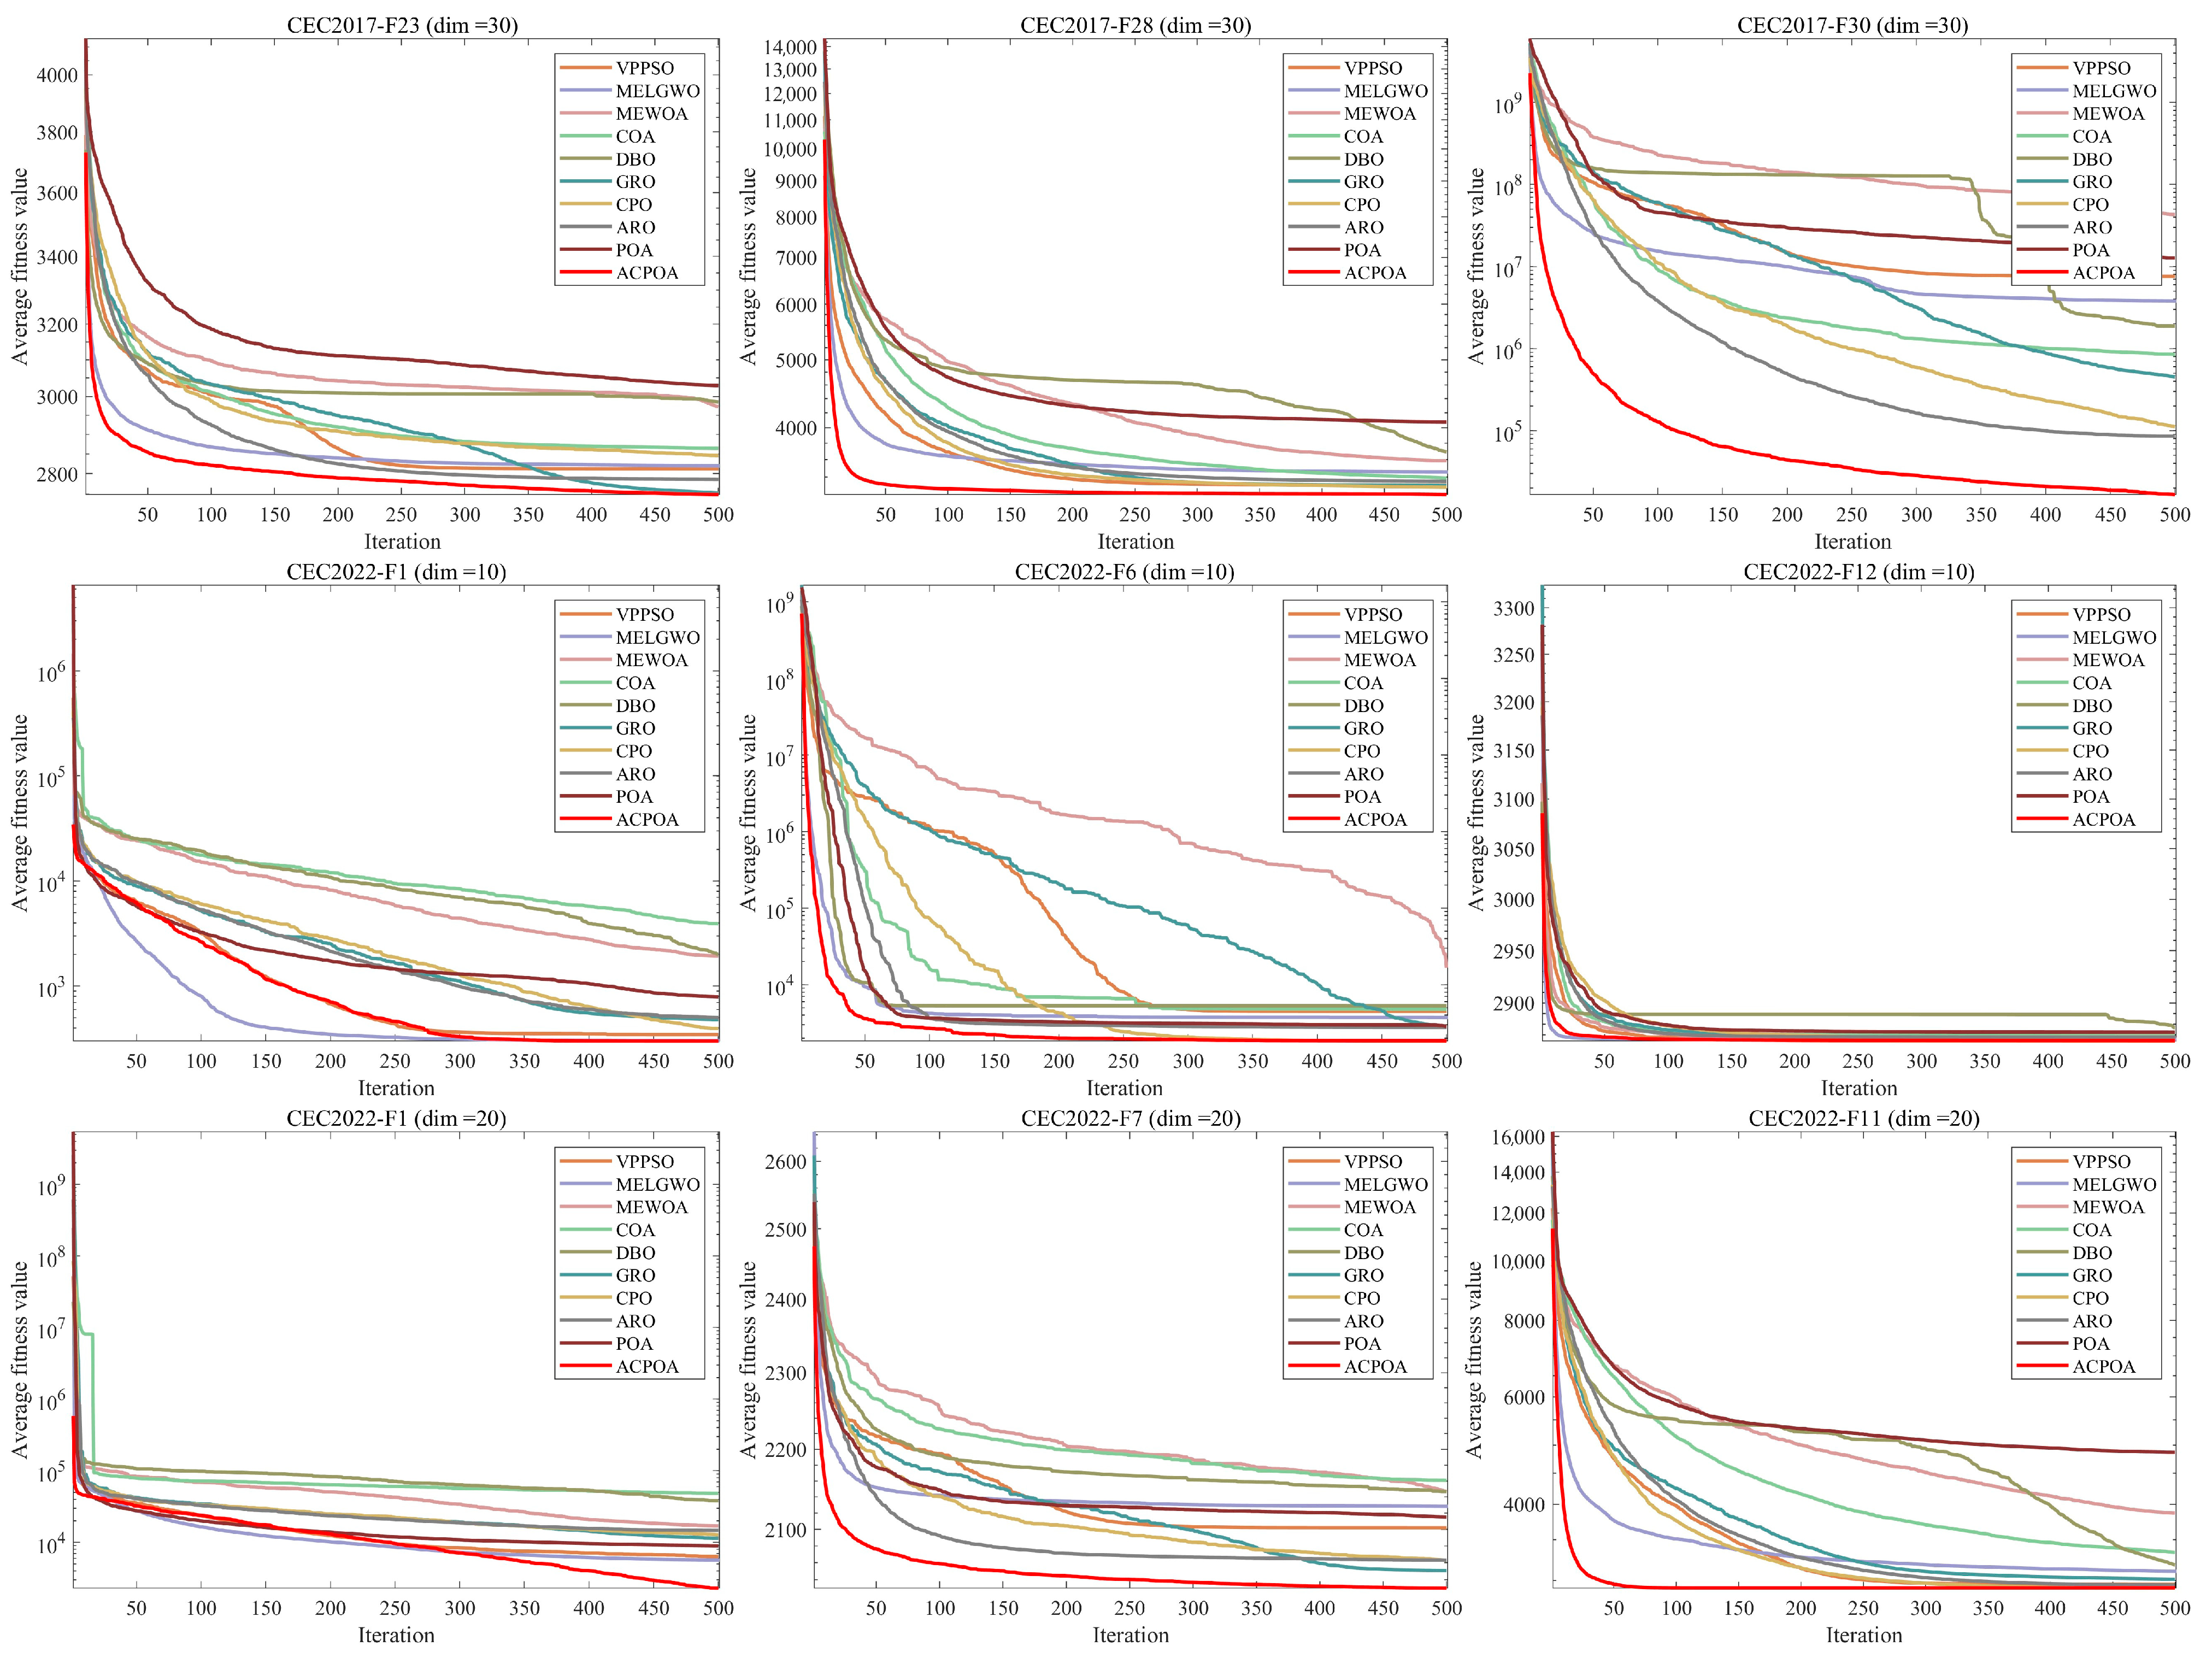
3.4. Convergence Behavior Analysis
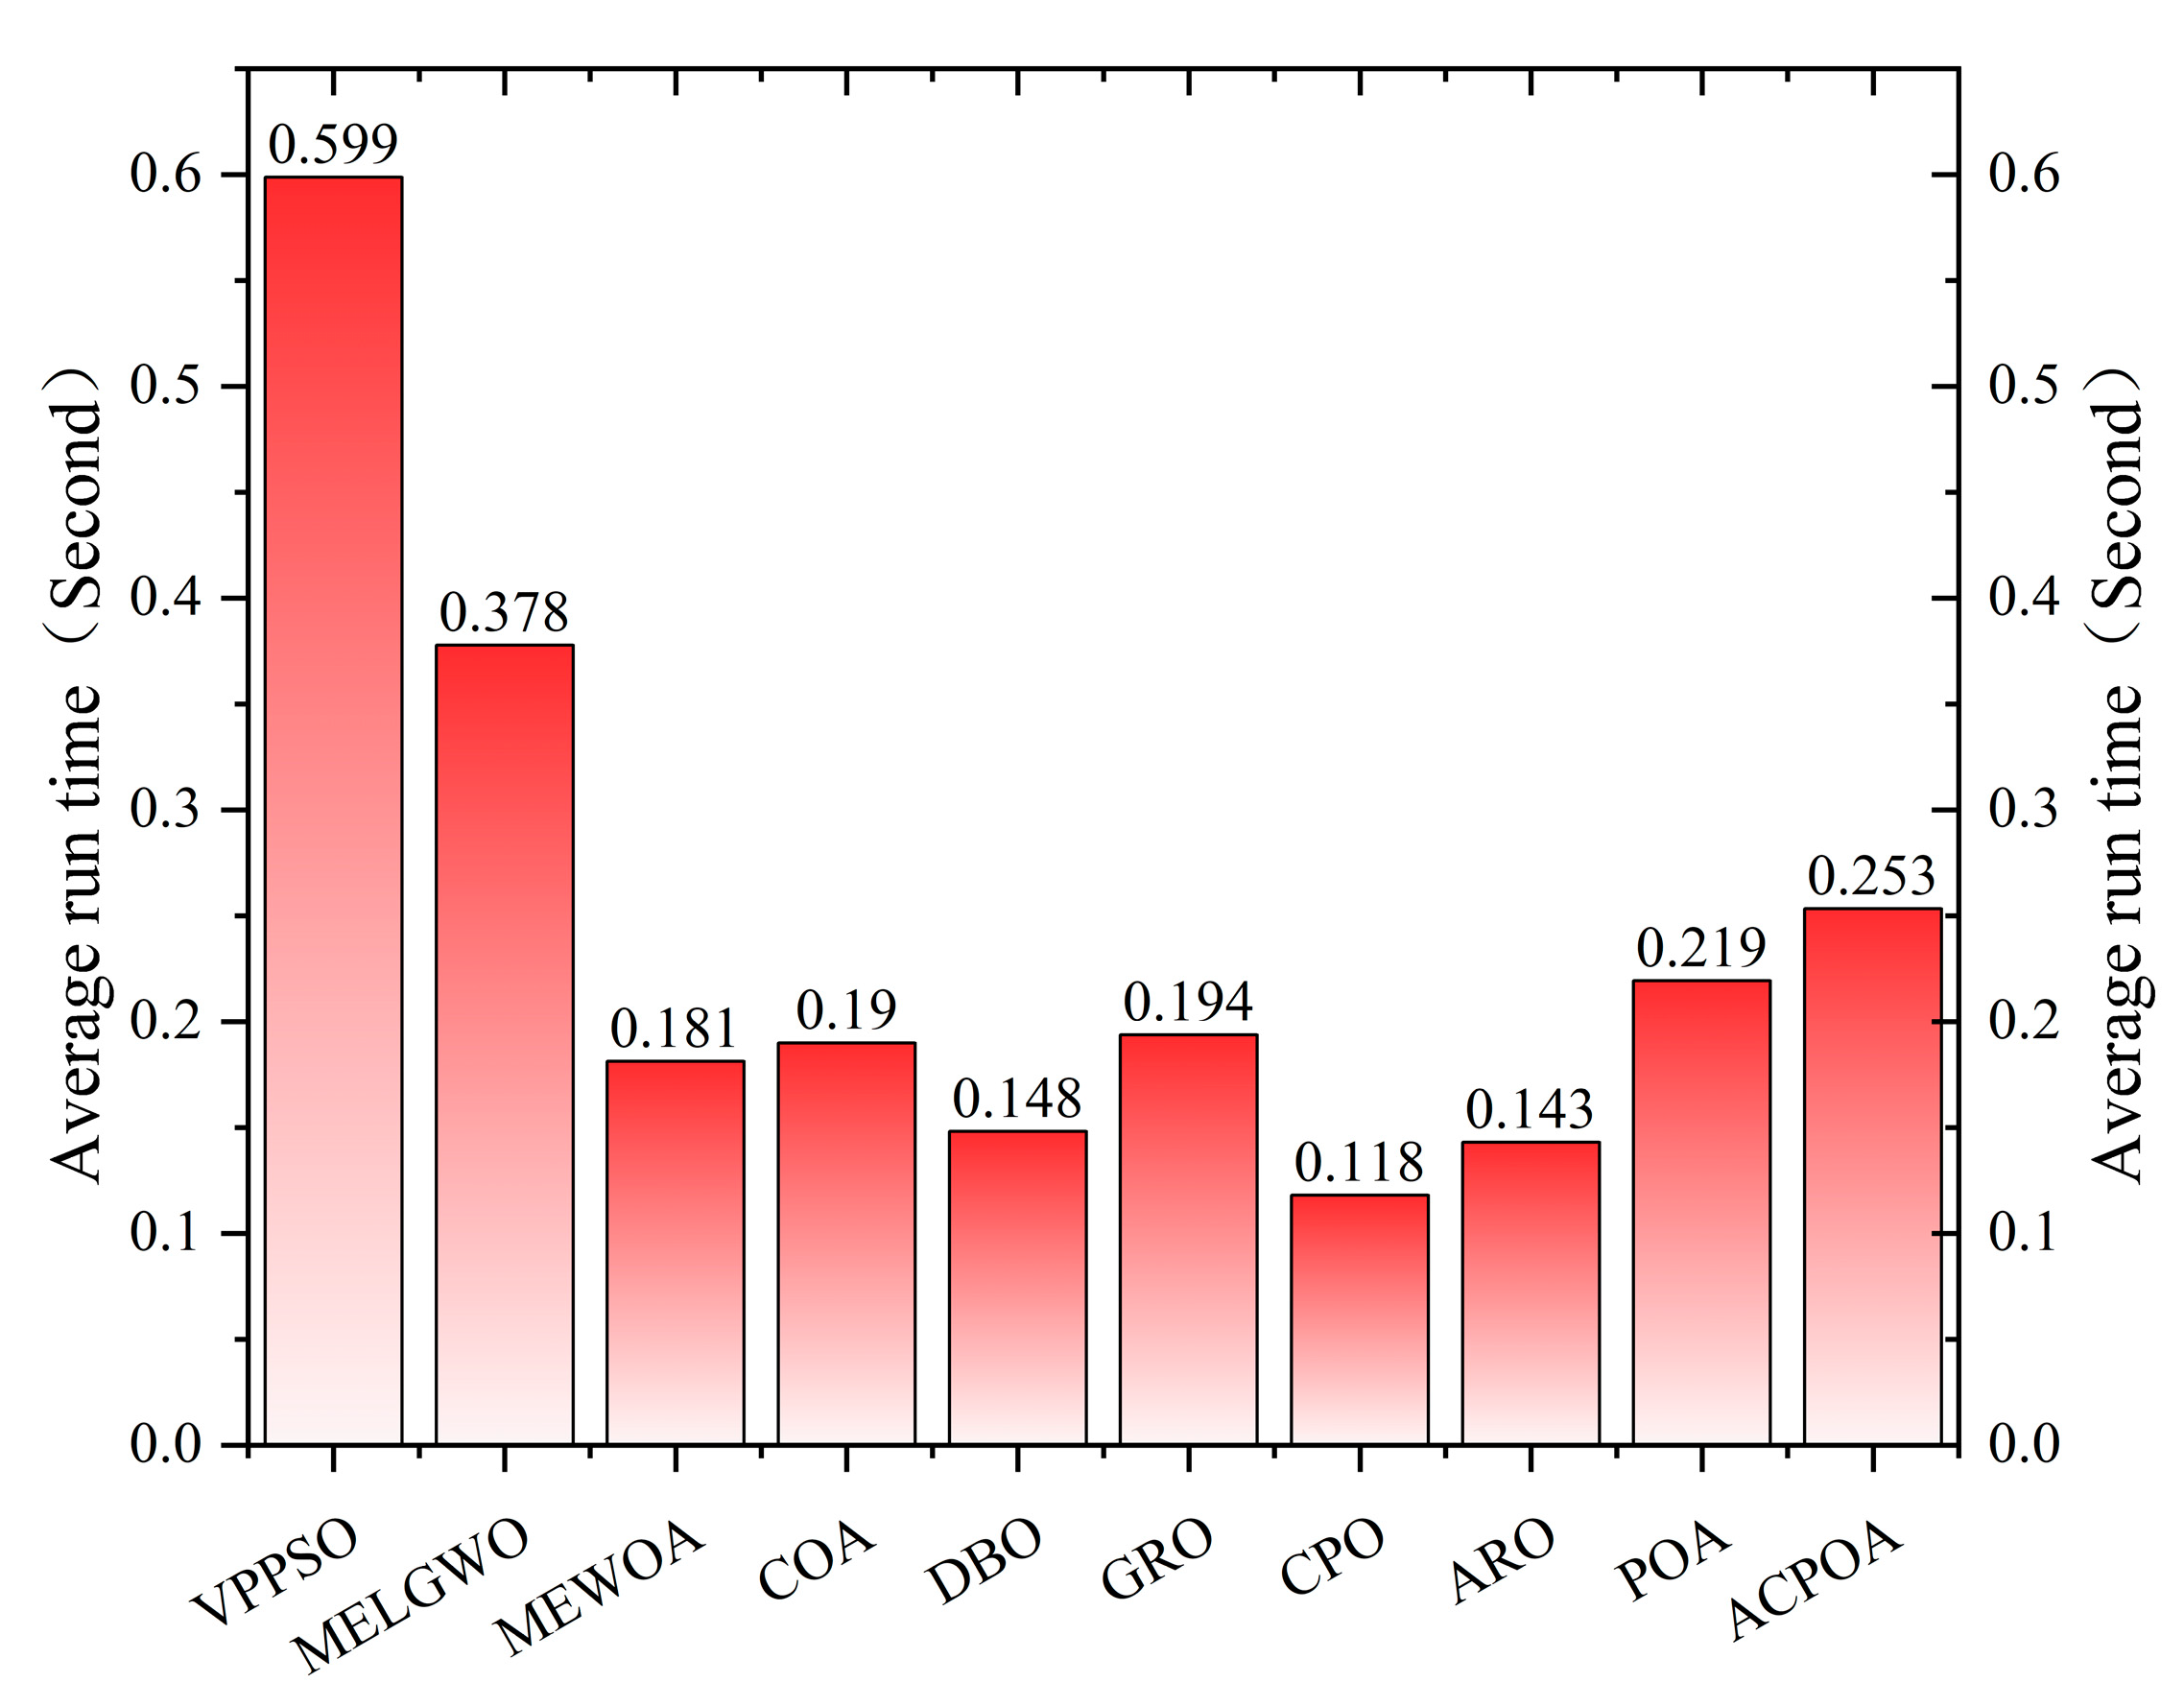
3.5. Computing Time Analysis
3.6. Time Complexity Analysis
4. Experimental Results for Multilevel Thresholding
4.1. Evaluation Index
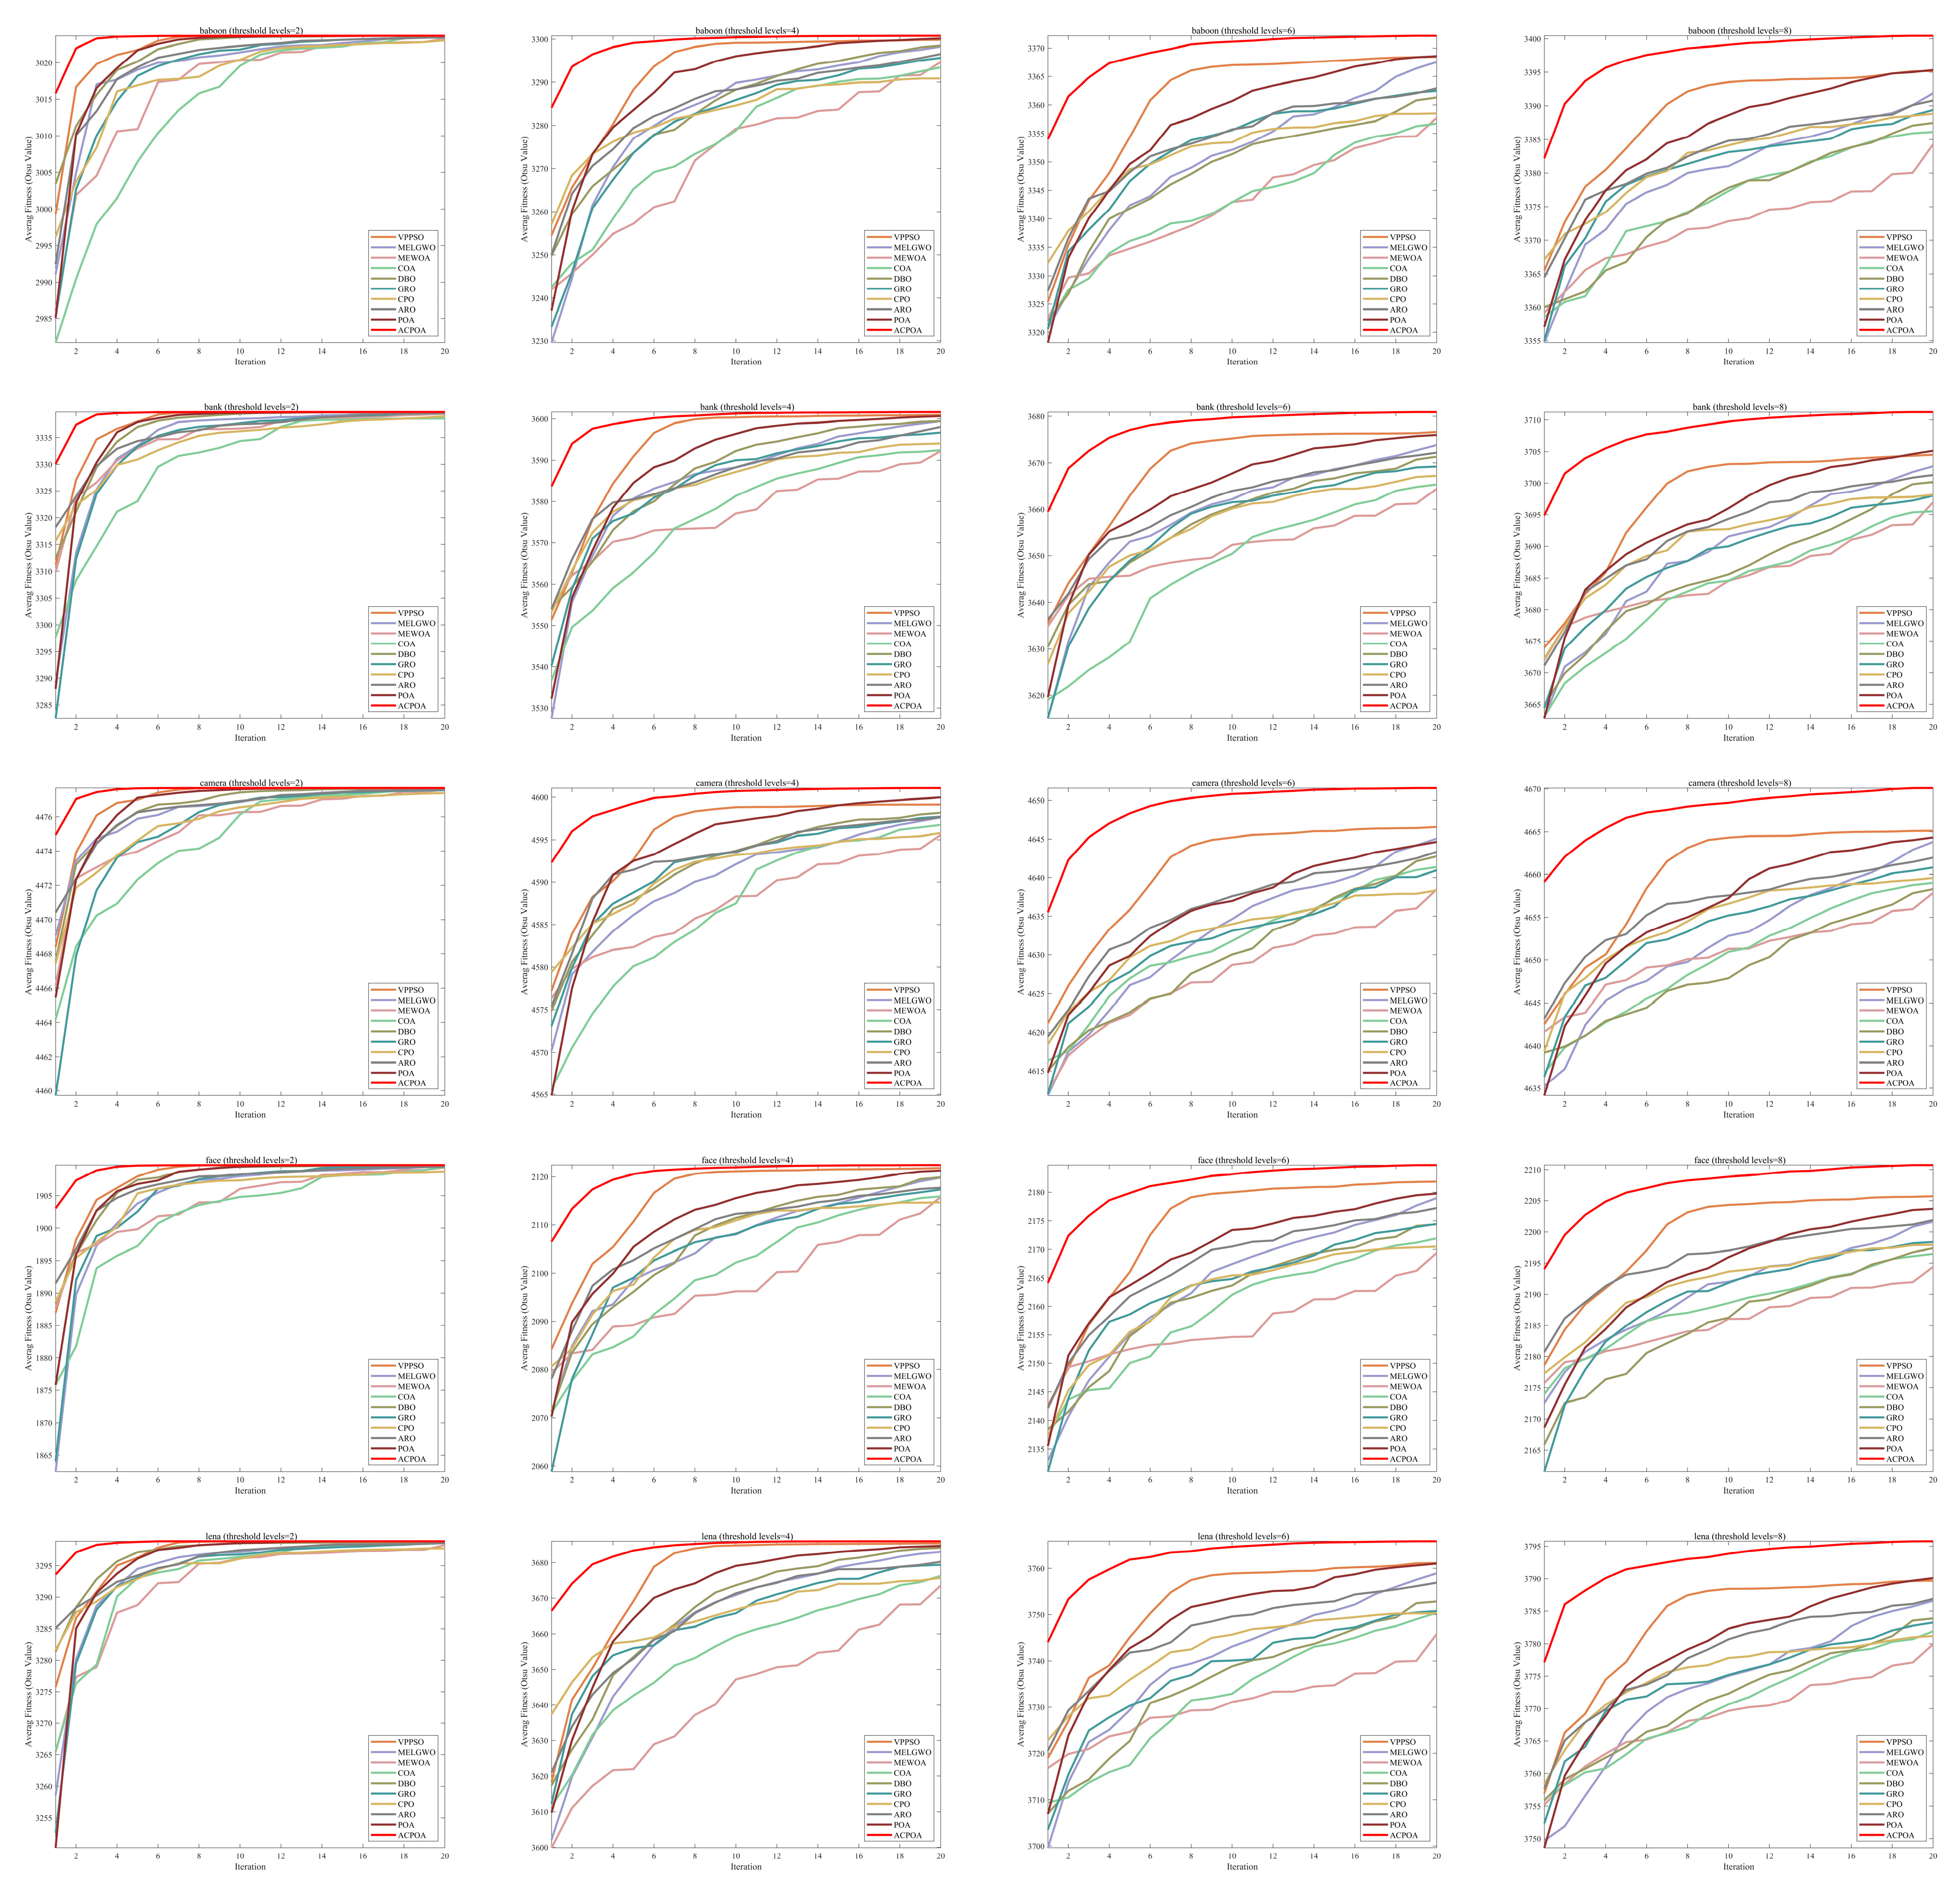
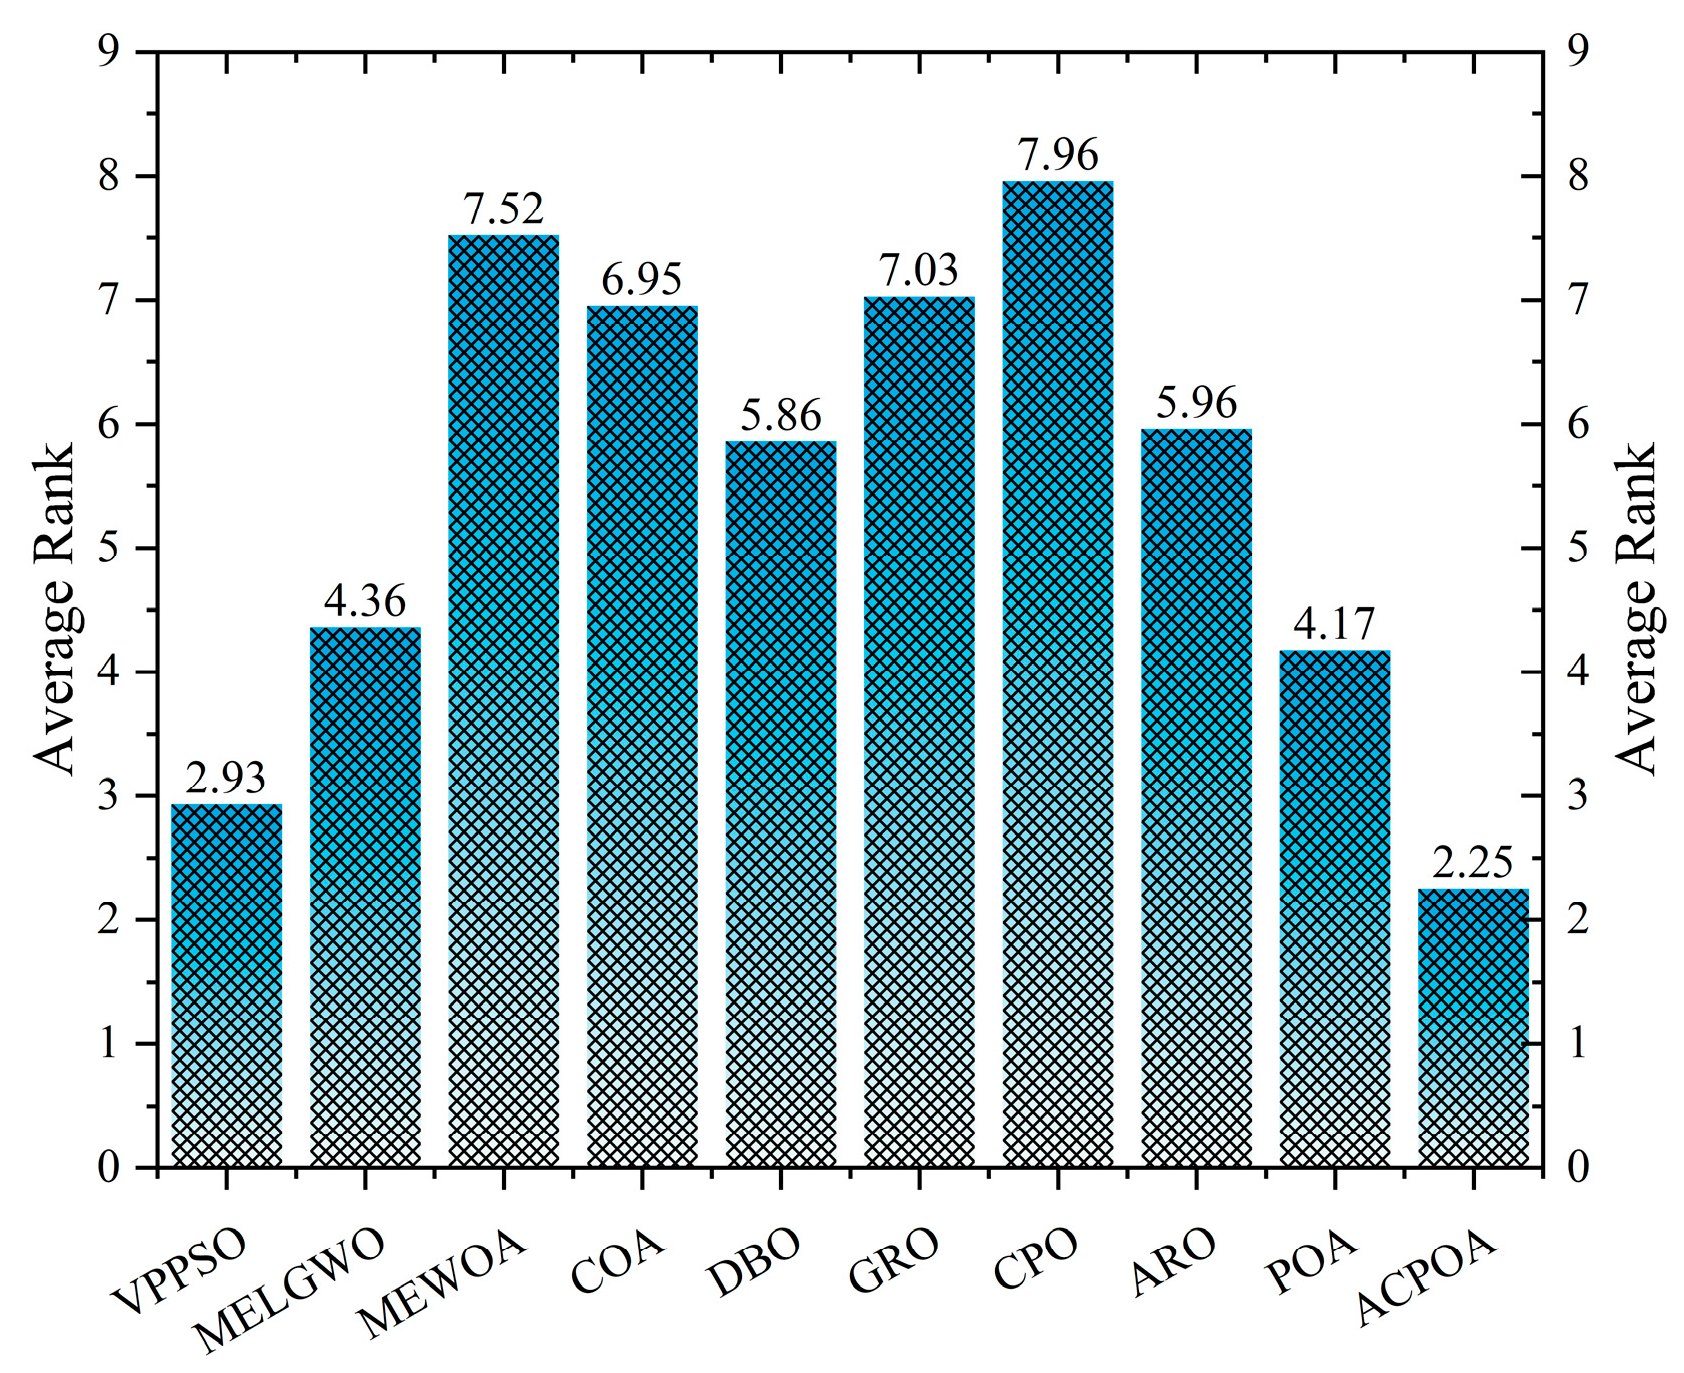
4.2. Analysis of Otsu Results Based on ACPOA
5. Summary and Prospect
Author Contributions
Funding
Data Availability Statement
Conflicts of Interest
References
- Chen, L.; Bentley, P.; Mori, K.; Misawa, K.; Fujiwara, M.; Rueckert, D. DRINet for Medical Image Segmentation. IEEE Trans. Med. Imaging 2018, 37, 2453–2462. [Google Scholar] [CrossRef]
- LaLonde, R.; Xu, Z.; Irmakci, I.; Jain, S.; Bagci, U. Capsules for biomedical image segmentation. Med. Image Anal. 2020, 68, 101889. [Google Scholar] [CrossRef] [PubMed]
- Huang, C.; Li, X.; Wen, Y. AN OTSU image segmentation based on fruitfly optimization algorithm. Alex. Eng. J. 2020, 60, 183–188. [Google Scholar] [CrossRef]
- Li, Y.; Feng, X. A multiscale image segmentation method. Pattern Recognit. 2016, 52, 332–345. [Google Scholar] [CrossRef]
- Mohan, Y.; Yadav, R.K.; Manjul, M. EECRPOA: Energy efficient clustered routing using pelican optimization algorithm in WSNs. Wirel. Netw. 2025, 31, 3743–3769. [Google Scholar] [CrossRef]
- Wang, J.; Bei, J.; Song, H.; Zhang, H.; Zhang, P. A whale optimization algorithm with combined mutation and removing similarity for global optimization and multilevel thresholding image segmentation. Appl. Soft Comput. 2023, 137, 110130. [Google Scholar] [CrossRef]
- Abd Elaziz, M.; Bhattacharyya, S.; Lu, S. Swarm selection method for multilevel thresholding image segmentation. Expert Syst. Appl. 2019, 138, 112818. [Google Scholar] [CrossRef]
- Ben Ishak, A. A two-dimensional multilevel thresholding method for image segmentation. Appl. Soft Comput. 2016, 52, 306–322. [Google Scholar] [CrossRef]
- Chen, Y.; Wang, M.; Heidari, A.A.; Shi, B.; Hu, Z.; Zhang, Q.; Chen, H.; Mafarja, M.; Turabieh, H. Multi-threshold Image Segmentation using a Multi-strategy Shuffled Frog Leaping Algorithm. Expert Syst. Appl. 2022, 194, 116511. [Google Scholar] [CrossRef]
- Guo, H.; Wang, J.g.; Liu, Y. Multi-threshold image segmentation algorithm based on Aquila optimization. Vis. Comput. 2023, 40, 2905–2932. [Google Scholar] [CrossRef]
- Zheng, J.; Gao, Y.; Zhang, H.; Lei, Y.; Zhang, J. OTSU Multi-Threshold Image Segmentation Based on Improved Particle Swarm Algorithm. Appl. Sci. 2022, 12, 11514. [Google Scholar] [CrossRef]
- Dorigo, M.; Birattari, M.; Stützle, T. Ant Colony Optimization. Comput. Intell. Mag. IEEE 2006, 1, 28–39. [Google Scholar] [CrossRef]
- Mirjalili, S.; Mirjalili, S.M.; Lewis, A. Grey Wolf Optimizer. Adv. Eng. Softw. 2014, 69, 46–61. [Google Scholar] [CrossRef]
- Kennedy, J.; Eberhart, R. Particle swarm optimization. In Proceedings of the ICNN’95—International Conference on Neural Networks, Perth, WA, Australia, 27 November–1 December 1995; Volume 1944, pp. 1942–1948. [Google Scholar]
- Mirjalili, S.; Lewis, A. The Whale Optimization Algorithm. Adv. Eng. Softw. 2016, 95, 51–67. [Google Scholar] [CrossRef]
- Xue, J.; Shen, B. Dung beetle optimizer: A new meta-heuristic algorithm for global optimization. J. Supercomput. 2022, 79, 7305–7336. [Google Scholar] [CrossRef]
- Fu, Y.; Liu, D.; Chen, J.; He, L. Secretary bird optimization algorithm: A new metaheuristic for solving global optimization problems. Artif. Intell. Rev. 2024, 57, 123. [Google Scholar] [CrossRef]
- Abdel-Basset, M.; Mohamed, R.; Abouhawwash, M. Crested Porcupine Optimizer: A new nature-inspired metaheuristic. Knowl. -Based Syst. 2024, 284, 111257. [Google Scholar] [CrossRef]
- Bhandari, A.K.; Kumar, A.; Singh, G.K. Modified artificial bee colony based computationally efficient multilevel thresholding for satellite image segmentation using Kapur’s, Otsu and Tsallis functions. Expert Syst. Appl. 2015, 42, 1573–1601. [Google Scholar] [CrossRef]
- Lan, L.; Wang, S. Improved African vultures optimization algorithm for medical image segmentation. Multimed. Tools Appl. 2023, 83, 45241–45290. [Google Scholar] [CrossRef]
- Aziz, M.A.E.; Ewees, A.A.; Hassanien, A.E. Whale Optimization Algorithm and Moth-Flame Optimization for multilevel thresholding image segmentation. Expert Syst. Appl. 2017, 83, 242–256. [Google Scholar] [CrossRef]
- Mostafa, A.; Hassanien, A.E.; Houseni, M.; Hefny, H. Liver segmentation in MRI images based on whale optimization algorithm. Multimed. Tools Appl. 2017, 76, 24931–24954. [Google Scholar] [CrossRef]
- Mookiah, S.; Parasuraman, K.; Kumar Chandar, S. Color image segmentation based on improved sine cosine optimization algorithm. Soft Comput. 2022, 26, 13193–13203. [Google Scholar] [CrossRef]
- Aranguren, I.; Valdivia, A.; Morales-Castañeda, B.; Oliva, D.; Abd Elaziz, M.; Perez-Cisneros, M. Improving the segmentation of magnetic resonance brain images using the LSHADE optimization algorithm. Biomed. Signal Process. Control 2020, 64, 102259. [Google Scholar] [CrossRef]
- Baby Resma, K.P.; Nair, M.S. Multilevel thresholding for image segmentation using Krill Herd Optimization algorithm. J. King Saud Univ.-Comput. Inf. Sci. 2018, 33, 528–541. [Google Scholar] [CrossRef]
- Chauhan, D.; Yadav, A. A crossover-based optimization algorithm for multilevel image segmentation. Soft Comput. 2023, 1–33. [Google Scholar] [CrossRef]
- Fan, Q.; Ma, Y.; Wang, P.; Bai, F. Otsu Image Segmentation Based on a Fractional Order Moth–Flame Optimization Algorithm. Fractal Fract. 2024, 8, 87. [Google Scholar] [CrossRef]
- Trojovský, P.; Dehghani, M. Pelican Optimization Algorithm: A Novel Nature-Inspired Algorithm for Engineering Applications. Sensors 2022, 22, 855. [Google Scholar] [CrossRef] [PubMed]
- Eluri, R.K.; Devarakonda, N. Chaotic Binary Pelican Optimization Algorithm for Feature Selection. Int. J. Uncertain. Fuzziness Knowl.-Based Syst. 2023, 31, 497–530. [Google Scholar] [CrossRef]
- Ge, X.; Li, C.; Li, Y.; Yi, C.; Fu, H. A hyperchaotic map with distance-increasing pairs of coexisting attractors and its application in the pelican optimization algorithm. Chaos Solitons Fractals 2023, 173, 113636. [Google Scholar] [CrossRef]
- SeyedGarmroudi, S.; Kayakutlu, G.; Kayalica, M.O.; Çolak, Ü. Improved Pelican optimization algorithm for solving load dispatch problems. Energy 2023, 289, 129811. [Google Scholar] [CrossRef]
- Song, H.-M.; Xing, C.; Wang, J.-S.; Wang, Y.-C.; Liu, Y.; Zhu, J.-H.; Hou, J.-N. Improved pelican optimization algorithm with chaotic interference factor and elementary mathematical function. Soft Comput. 2023, 27, 10607. [Google Scholar] [CrossRef]
- Zhou, G.; Lü, S.; Mao, L.; Xu, K.; Bao, T.; Bao, X. Path Planning of UAV Using Levy Pelican Optimization Algorithm In Mountain Environment. Appl. Artif. Intell. 2024, 38, 2368343. [Google Scholar] [CrossRef]
- Qiu, S.; Dai, J.; Zhao, D. Path Planning of an Unmanned Aerial Vehicle Based on a Multi-Strategy Improved Pelican Optimization Algorithm. Biomimetics 2024, 9, 647. [Google Scholar] [CrossRef] [PubMed]
- Louchart, A.; Tourment, N.; Carrier, J. The earliest known pelican reveals 30 million years of evolutionary stasis in beak morphology. J. Ornithol. 2011, 152, 15–20. [Google Scholar] [CrossRef]
- Wu, G.; Mallipeddi, R.; Suganthan, P. Problem Definitions and Evaluation Criteria for the CEC 2017 Competition and Special Session on Constrained Single Objective Real-Parameter Optimization; Nanyang Technological University: Singapore, 2016. [Google Scholar]
- Luo, W.; Lin, X.; Li, C.; Yang, S.; Shi, Y. Benchmark functions for CEC 2022 competition on seeking multiple optima in dynamic environments. arXiv 2022, arXiv:2201.00523. [Google Scholar] [CrossRef]
- Shami, T.M.; Mirjalili, S.; Al-Eryani, Y.; Daoudi, K.; Izadi, S.; Abualigah, L. Velocity pausing particle swarm optimization: A novel variant for global optimization. Neural Comput. Appl. 2023, 35, 9193–9223. [Google Scholar] [CrossRef]
- Yu, M.; Xu, J.; Liang, W.; Qiu, Y.; Bao, S.; Tang, L. Improved multi-strategy adaptive Grey Wolf Optimization for practical engineering applications and high-dimensional problem solving. Artif. Intell. Rev. 2024, 57, 277. [Google Scholar] [CrossRef]
- Shen, Y.; Zhang, C.; Soleimanian Gharehchopogh, F.; Mirjalili, S. An improved whale optimization algorithm based on multi-population evolution for global optimization and engineering design problems. Expert Syst. Appl. 2023, 215, 119269. [Google Scholar] [CrossRef]
- Jia, H.; Rao, H.; Wen, C.; Mirjalili, S. Crayfish optimization algorithm. Artif. Intell. Rev. 2023, 56, 1919–1979. [Google Scholar] [CrossRef]
- Zolf, K. Gold rush optimizer: A new population-based metaheuristic algorithm. Oper. Res. Decis. 2023, 33, 113–150. [Google Scholar] [CrossRef]
- Wang, L.; Cao, Q.; Zhang, Z.; Mirjalili, S.; Zhao, W. Artificial rabbits optimization: A new bio-inspired meta-heuristic algorithm for solving engineering optimization problems. Eng. Appl. Artif. Intell. 2022, 114, 105082. [Google Scholar] [CrossRef]
- Ryalat, M.H.; Dorgham, O.; Tedmori, S.; Al-Rahamneh, Z.; Al-Najdawi, N.; Mirjalili, S. Harris hawks optimization for COVID-19 diagnosis based on multi-threshold image segmentation. Neural Comput. Appl. 2022, 35, 6855–6873. [Google Scholar] [CrossRef] [PubMed]
- Suresh, S.; Lal, S. Multilevel thresholding based on Chaotic Darwinian Particle Swarm Optimization for segmentation of satellite images. Appl. Soft Comput. 2017, 55, 503–522. [Google Scholar] [CrossRef]
- Shi, J.; Chen, Y.; Wang, C.; Heidari, A.A.; Liu, L.; Chen, H.; Chen, X.; Sun, L. Multi-threshold image segmentation using new strategies enhanced whale optimization for lupus nephritis pathological images. Displays 2024, 84, 102799. [Google Scholar] [CrossRef]
- Jiang, Y.; Yeh, W.-C.; Hao, Z.; Yang, Z. A cooperative honey bee mating algorithm and its application in multi-threshold image segmentation. Inf. Sci. 2016, 369, 171–183. [Google Scholar] [CrossRef]
- Dong, Y.; Li, M.; Zhou, M. Multi-Threshold Image Segmentation Based on the Improved Dragonfly Algorithm. Mathematics 2024, 12, 854. [Google Scholar] [CrossRef]

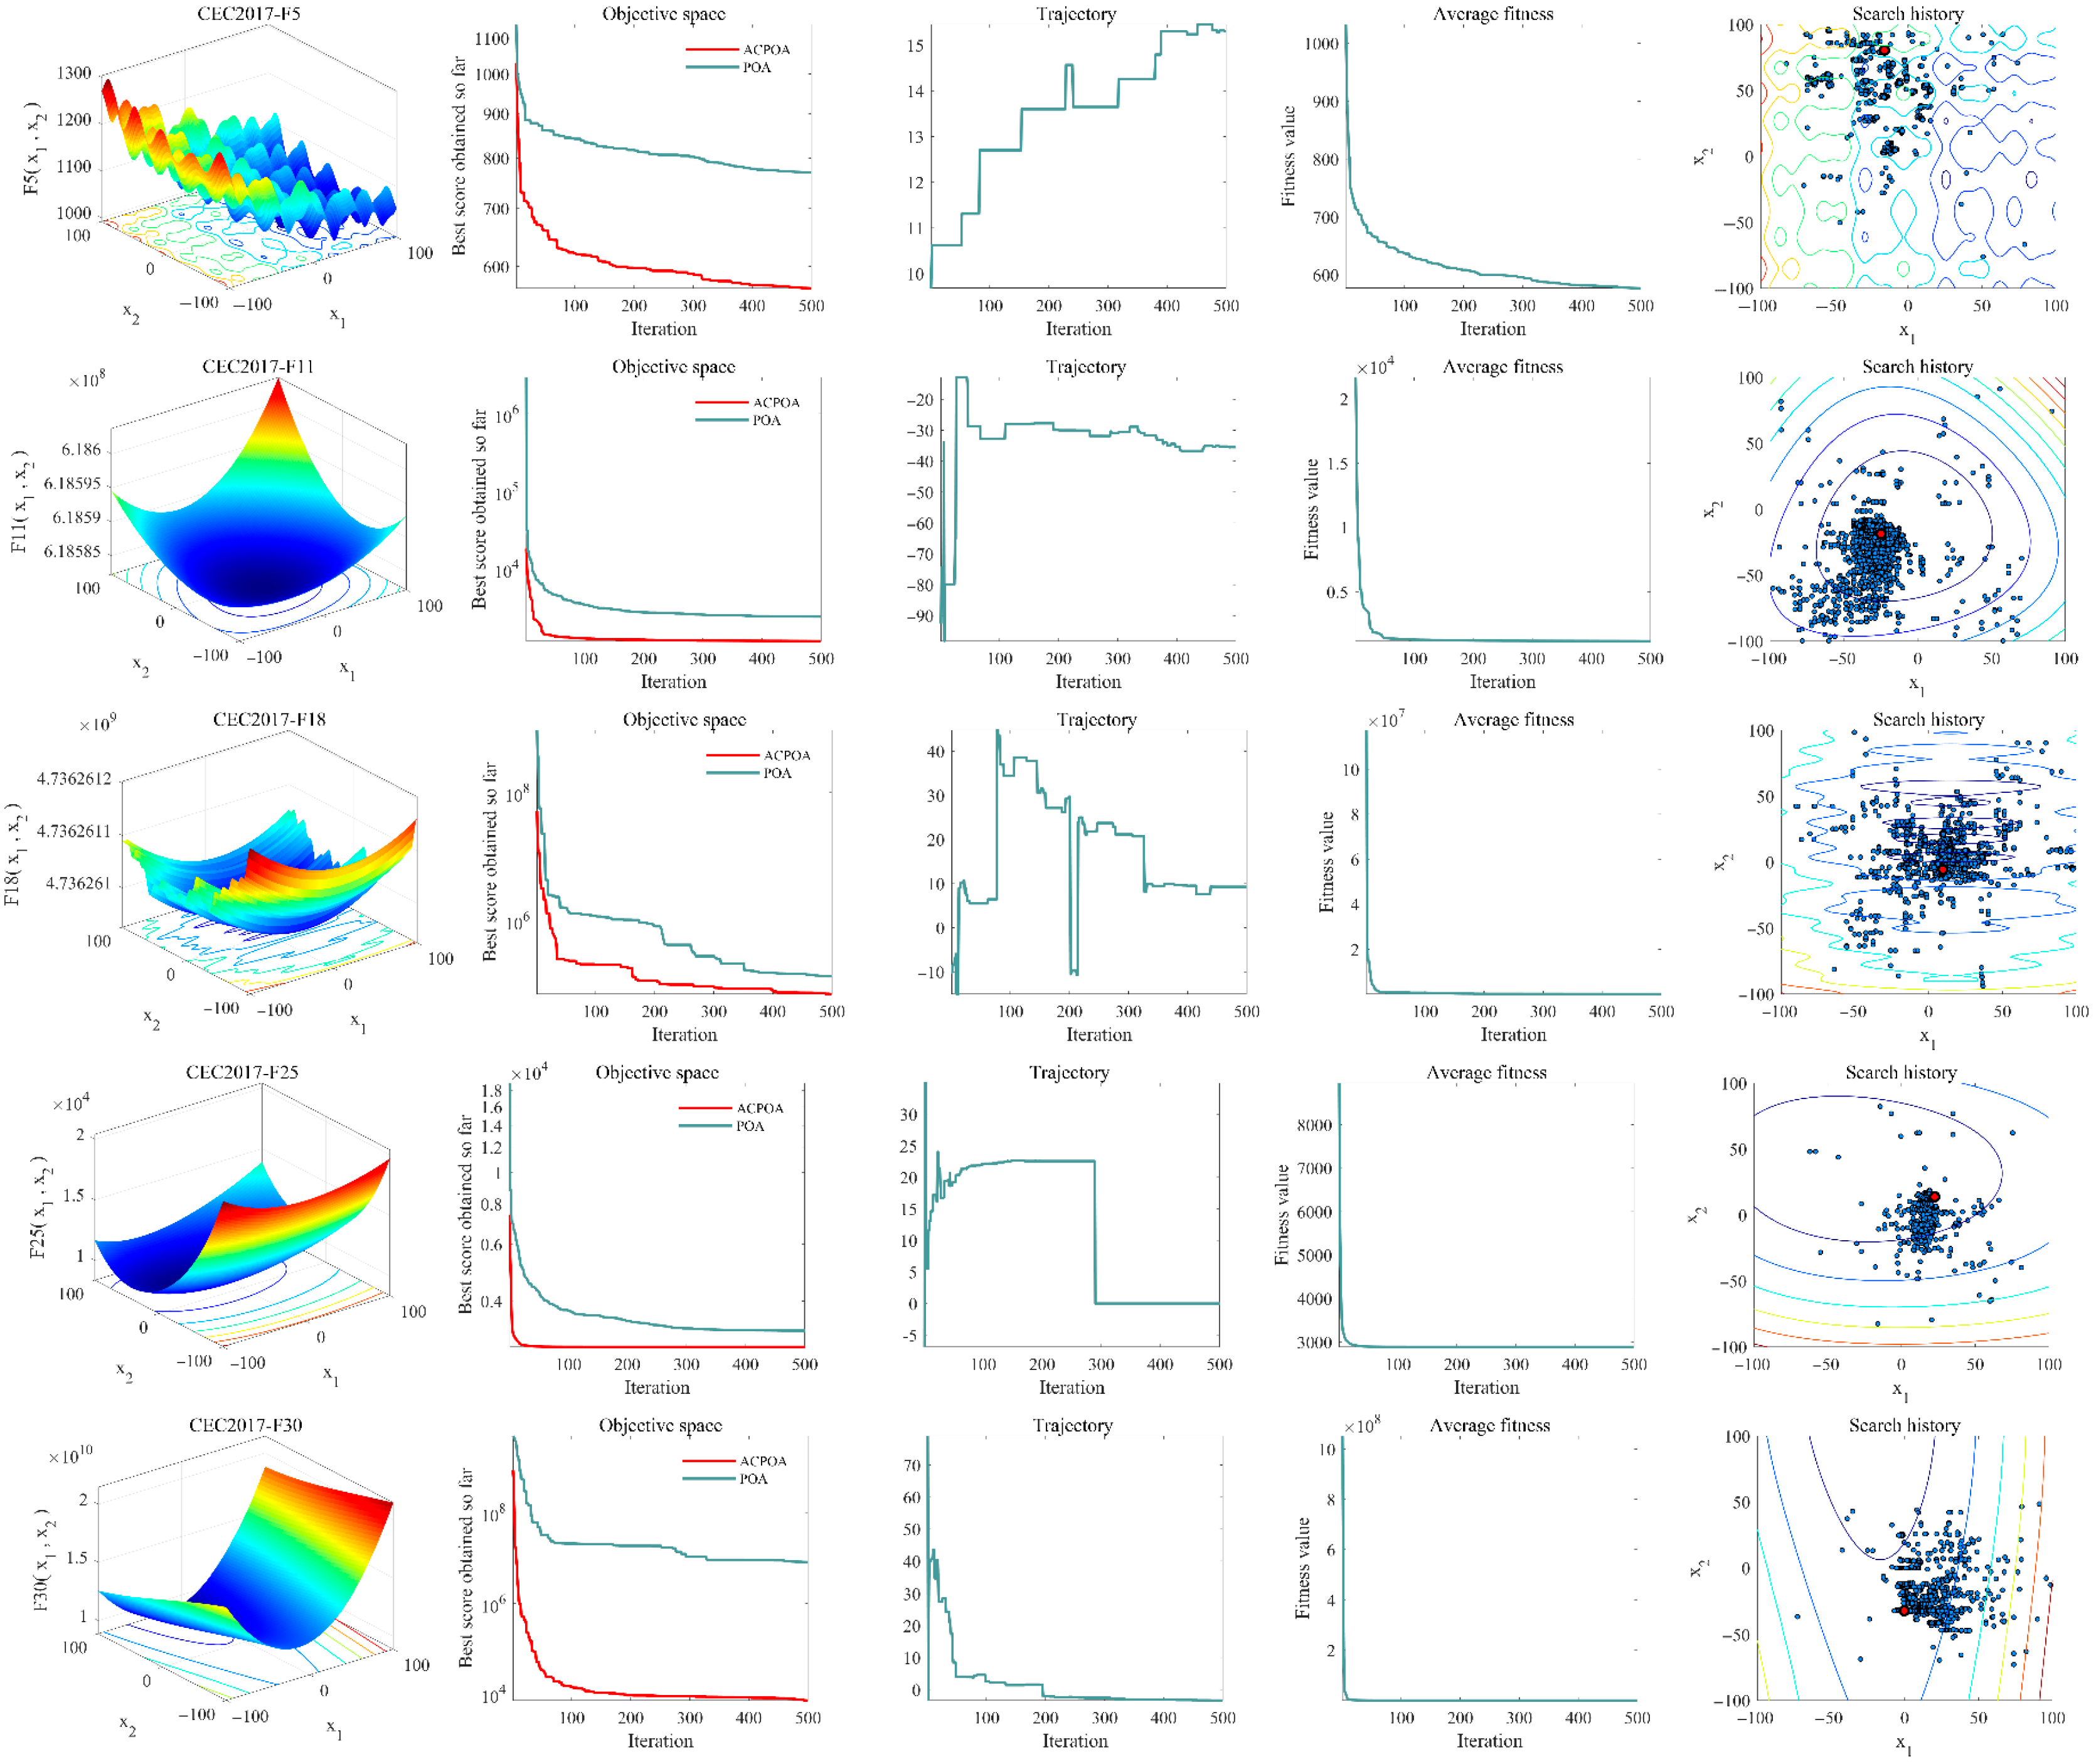

| Algorithms | Name of the Parameter | Value of the Parameter |
|---|---|---|
| VPPSO | 0.3, 0.15, 0.15 | |
| IAGWO | ||
| MEWOA | 1, [0, 1], [−1, 1], [0, 2] | |
| COA | 0.2, 3, 25, 3 | |
| DBO | ||
| GRO | ||
| CPO | 0.1, 80, 0.5, 2 | |
| ARO | ||
| POA | {1, 2}, 0.2 | |
| ACPOA | {1, 2}, 0.2, [0, 1] |
| F~ | Metric | VPPSO | MELGWO | MEWOA | COA | DBO | GRO | CPO | ARO | POA | ACPOA |
|---|---|---|---|---|---|---|---|---|---|---|---|
| F1 | Mean | 1.1375 × 10⁷ | 1.8308 × 10⁹ | 5.7291 × 10⁹ | 8.6894 × 10⁸ | 3.1419 × 10⁸ | 1.0261 × 10⁸ | 7.6019 × 10⁵ | 3.1496 × 10⁷ | 1.6176 × 10¹⁰ | 3.9708 × 10³ |
| Std | 3.4628 × 10⁷ | 1.5588 × 10⁹ | 2.6310 × 10⁹ | 8.1337 × 10⁸ | 2.6897 × 10⁸ | 6.9240 × 10⁷ | 6.0890 × 10⁵ | 2.4351 × 10⁷ | 5.0407 × 10⁹ | 4.6275 × 10³ | |
| F2 | Mean | 1.2711 × 10²³ | 3.4443 × 1031 | 6.6795 × 1033 | 2.2143 × 1027 | 1.4254 × 1033 | 6.7416 × 1024 | 5.8416 × 10²⁰ | 7.6964 × 10²² | 1.2596 × 1033 | 9.8896 × 10²² |
| Std | 5.3032 × 10²³ | 1.3276 × 1032 | 2.5667 × 1034 | 8.4364 × 1027 | 6.6217 × 1033 | 1.4303 × 1025 | 2.9370 × 10²¹ | 2.7150 × 10²³ | 3.7946 × 1033 | 5.4168 × 10²³ | |
| F3 | Mean | 4.9827 × 10⁴ | 4.3420 × 10⁴ | 7.6186 × 10⁴ | 1.2071 × 10⁵ | 8.9042 × 10⁴ | 6.4340 × 10⁴ | 6.5215 × 10⁴ | 5.8754 × 10⁴ | 4.2778 × 10⁴ | 3.5586 × 10⁴ |
| Std | 1.2072 × 10⁴ | 9.8805 × 10³ | 9.7287 × 10³ | 3.7089 × 10⁴ | 1.4271 × 10⁴ | 1.2942 × 10⁴ | 1.1539 × 10⁴ | 9.9056 × 10³ | 8.5261 × 10³ | 9.9549 × 10³ | |
| F4 | Mean | 5.3082 × 10² | 6.2890 × 10² | 9.0888 × 10² | 6.0387 × 10² | 6.9545 × 10² | 5.5125 × 10² | 5.2024 × 10² | 5.4133 × 10² | 2.4250 × 10³ | 4.8022 × 10² |
| Std | 3.7175 × 101 | 1.2765 × 10² | 2.5649 × 10² | 8.7124 × 101 | 1.6924 × 10² | 2.4724 × 101 | 1.5100 × 101 | 2.8898 × 101 | 1.3609 × 10³ | 2.9142 × 101 | |
| F5 | Mean | 6.5220 × 10² | 6.6833 × 10² | 8.0535 × 10² | 7.4572 × 10² | 7.4933 × 10² | 6.0438 × 10² | 6.9201 × 10² | 6.3877 × 10² | 7.6623 × 10² | 5.9121 × 10² |
| Std | 2.7897 × 101 | 3.6359 × 101 | 4.1191 × 101 | 6.2452 × 101 | 4.3479 × 101 | 1.9339 × 101 | 1.3670 × 101 | 3.4135 × 101 | 3.6758 × 101 | 1.6589 × 101 | |
| F6 | Mean | 6.3577 × 10² | 6.4762 × 10² | 6.6788 × 10² | 6.5519 × 10² | 6.4706 × 10² | 6.0683 × 10² | 6.0191 × 10² | 6.1521 × 10² | 6.6142 × 10² | 6.0018 × 10² |
| Std | 1.1280 × 101 | 1.0425 × 101 | 8.6949 × 100 | 1.0440 × 101 | 1.1190 × 101 | 2.0843 × 100 | 1.0067 × 100 | 7.4614 × 100 | 6.0952 × 100 | 2.1633 × 10⁻¹ | |
| F7 | Mean | 9.4449 × 10² | 1.0007 × 10³ | 1.2296 × 10³ | 1.2441 × 10³ | 1.0351 × 10³ | 8.5168 × 10² | 9.4051 × 10² | 9.5214 × 10² | 1.2676 × 10³ | 8.2402 × 10² |
| Std | 6.0901 × 101 | 5.4809 × 101 | 1.0337 × 10² | 1.0238 × 10² | 9.5025 × 101 | 2.3671 × 101 | 2.4305 × 101 | 8.0706 × 101 | 5.7617 × 101 | 2.5279 × 101 | |
| F8 | Mean | 9.2337 × 10² | 9.4264 × 10² | 1.0340 × 10³ | 9.8202 × 10² | 1.0328 × 10³ | 9.0508 × 10² | 9.8309 × 10² | 9.0285 × 10² | 9.9329 × 10² | 8.9669 × 10² |
| Std | 2.9430 × 101 | 3.0132 × 101 | 3.1492 × 101 | 3.2143 × 101 | 6.2159 × 101 | 1.9836 × 101 | 1.5220 × 101 | 2.5415 × 101 | 2.2220 × 101 | 1.7811 × 101 | |
| F9 | Mean | 3.6677 × 10³ | 4.0001 × 10³ | 8.1401 × 10³ | 7.5663 × 10³ | 6.9243 × 10³ | 1.2713 × 10³ | 1.3021 × 10³ | 2.8463 × 10³ | 5.7281 × 10³ | 1.4125 × 10³ |
| Std | 1.2226 × 10³ | 7.8868 × 10² | 1.3441 × 10³ | 1.9048 × 10³ | 1.7899 × 10³ | 2.2074 × 10² | 3.2902 × 10² | 8.6433 × 10² | 7.4255 × 10² | 4.5988 × 10² | |
| F10 | Mean | 4.9128 × 10³ | 5.0444 × 10³ | 7.2141 × 10³ | 6.1829 × 10³ | 6.8688 × 10³ | 5.8291 × 10³ | 7.5081 × 10³ | 4.4758 × 10³ | 5.3002 × 10³ | 4.2705 × 10³ |
| Std | 7.4816 × 10² | 5.2892 × 10² | 7.7563 × 10² | 8.8919 × 10² | 1.1659 × 10³ | 4.7016 × 10² | 3.8199 × 10² | 5.5755 × 10² | 4.4992 × 10² | 5.6168 × 10² | |
| F11 | Mean | 1.4462 × 10³ | 1.4731 × 10³ | 3.2492 × 10³ | 1.7790 × 10³ | 1.8311 × 10³ | 1.3434 × 10³ | 1.2784 × 10³ | 1.3483 × 10³ | 2.3659 × 10³ | 1.2021 × 10³ |
| Std | 1.6075 × 10² | 4.0029 × 10² | 1.2634 × 10³ | 4.8034 × 10² | 5.4897 × 10² | 7.3209 × 101 | 2.7920 × 101 | 1.1555 × 10² | 1.1036 × 10³ | 2.6893 × 101 | |
| F12 | Mean | 2.9636 × 10⁷ | 4.5530 × 10⁷ | 3.4326 × 10⁸ | 1.2786 × 10⁷ | 6.6984 × 10⁷ | 4.3046 × 10⁶ | 1.2139 × 10⁶ | 3.7488 × 10⁶ | 1.3619 × 10⁹ | 1.3642 × 10⁶ |
| Std | 2.5541 × 10⁷ | 4.8988 × 10⁷ | 3.1841 × 10⁸ | 8.0430 × 10⁶ | 8.1928 × 10⁷ | 3.4547 × 10⁶ | 7.1367 × 10⁵ | 2.5990 × 10⁶ | 1.4644 × 10⁹ | 1.1044 × 10⁶ | |
| F13 | Mean | 9.3463 × 10⁴ | 1.5714 × 10⁵ | 2.0549 × 10⁷ | 3.3740 × 10⁵ | 5.0478 × 10⁶ | 1.0275 × 10⁵ | 2.0402 × 10⁴ | 1.7617 × 10⁴ | 1.4489 × 10⁸ | 9.4868 × 10³ |
| Std | 5.3504 × 10⁴ | 4.0772 × 10⁵ | 3.6758 × 10⁷ | 6.6836 × 10⁵ | 7.5956 × 10⁶ | 1.4033 × 10⁵ | 1.1504 × 10⁴ | 1.4142 × 10⁴ | 4.6875 × 10⁸ | 8.6454 × 10³ | |
| F14 | Mean | 1.1363 × 10⁵ | 2.3274 × 10⁵ | 8.3826 × 10⁵ | 5.3779 × 10⁵ | 2.8492 × 10⁵ | 3.0620 × 10⁴ | 2.3852 × 10³ | 9.2270 × 10⁴ | 2.9205 × 10⁴ | 8.9124 × 10⁴ |
| Std | 1.3570 × 10⁵ | 2.9271 × 10⁵ | 8.0865 × 10⁵ | 9.9421 × 10⁵ | 3.3388 × 10⁵ | 3.2617 × 10⁴ | 1.3412 × 10³ | 1.5947 × 10⁵ | 3.8543 × 10⁴ | 1.0446 × 10⁵ | |
| F15 | Mean | 3.8031 × 10⁴ | 2.3062 × 10⁴ | 4.6878 × 10⁶ | 2.8996 × 10⁴ | 7.0496 × 10⁴ | 2.5453 × 10⁴ | 5.1066 × 10³ | 4.5295 × 10³ | 4.5049 × 10⁴ | 1.9796 × 10³ |
| Std | 1.9962 × 10⁴ | 1.3341 × 10⁴ | 1.3037 × 10⁷ | 2.9043 × 10⁴ | 7.5036 × 10⁴ | 1.6858 × 10⁴ | 3.7134 × 10³ | 2.6816 × 10³ | 3.1998 × 10⁴ | 6.7979 × 10² | |
| F16 | Mean | 2.9233 × 10³ | 2.8686 × 10³ | 3.5036 × 10³ | 2.9869 × 10³ | 3.5284 × 10³ | 2.5235 × 10³ | 3.0865 × 10³ | 2.6728 × 10³ | 3.0648 × 10³ | 2.3041 × 10³ |
| Std | 4.2665 × 10² | 3.4690 × 10² | 4.0548 × 10² | 3.8779 × 10² | 4.1437 × 10² | 1.9900 × 10² | 1.8006 × 10² | 2.5857 × 10² | 2.9187 × 10² | 1.6933 × 10² | |
| F17 | Mean | 2.2173 × 10³ | 2.2770 × 10³ | 2.4988 × 10³ | 2.2903 × 10³ | 2.6191 × 10³ | 1.9040 × 10³ | 2.0582 × 10³ | 2.1663 × 10³ | 2.2947 × 10³ | 1.9909 × 10³ |
| Std | 1.6317 × 10² | 2.4677 × 10² | 2.3346 × 10² | 2.0758 × 10² | 2.5341 × 10² | 9.7707 × 101 | 1.3675 × 10² | 2.1816 × 10² | 2.2626 × 10² | 1.5693 × 10² | |
| F18 | Mean | 1.3513 × 10⁶ | 1.1908 × 10⁶ | 6.7675 × 10⁶ | 3.0641 × 10⁶ | 4.7491 × 10⁶ | 4.6233 × 10⁵ | 1.5521 × 10⁵ | 3.9553 × 10⁵ | 3.4603 × 10⁵ | 2.0732 × 10⁵ |
| Std | 1.7307 × 10⁶ | 1.1436 × 10⁶ | 7.0456 × 10⁶ | 3.5154 × 10⁶ | 5.8993 × 10⁶ | 3.5555 × 10⁵ | 1.4850 × 10⁵ | 4.2848 × 10⁵ | 3.8950 × 10⁵ | 2.1897 × 10⁵ | |
| F19 | Mean | 2.0797 × 10⁶ | 2.7473 × 10⁵ | 5.0617 × 10⁶ | 2.1012 × 10⁴ | 5.7832 × 10⁶ | 3.2846 × 10⁴ | 5.8061 × 10³ | 9.6496 × 10³ | 1.1777 × 10⁶ | 3.8020 × 10³ |
| Std | 1.3157 × 10⁶ | 1.0500 × 10⁶ | 6.8168 × 10⁶ | 2.2412 × 10⁴ | 1.1055 × 10⁷ | 5.6650 × 10⁴ | 3.6581 × 10³ | 6.2807 × 10³ | 1.1486 × 10⁶ | 2.5795 × 10³ | |
| F20 | Mean | 2.4563 × 10³ | 2.6103 × 10³ | 2.7958 × 10³ | 2.7211 × 10³ | 2.6765 × 10³ | 2.3393 × 10³ | 2.4494 × 10³ | 2.4309 × 10³ | 2.4947 × 10³ | 2.2506 × 10³ |
| Std | 1.8709 × 10² | 1.7798 × 10² | 1.9587 × 10² | 2.4077 × 10² | 1.8525 × 10² | 8.8035 × 101 | 1.2807 × 10² | 1.7563 × 10² | 1.3419 × 10² | 1.1985 × 10² | |
| F21 | Mean | 2.4318 × 10³ | 2.4564 × 10³ | 2.5681 × 10³ | 2.4696 × 10³ | 2.5673 × 10³ | 2.3989 × 10³ | 2.4850 × 10³ | 2.4107 × 10³ | 2.5529 × 10³ | 2.3926 × 10³ |
| Std | 3.6844 × 101 | 3.3051 × 101 | 3.9999 × 101 | 3.7966 × 101 | 4.3237 × 101 | 1.9409 × 101 | 1.4974 × 101 | 2.9969 × 101 | 4.3677 × 101 | 1.9150 × 101 | |
| F22 | Mean | 3.7881 × 10³ | 5.1707 × 10³ | 6.5027 × 10³ | 4.0338 × 10³ | 5.2794 × 10³ | 2.3565 × 10³ | 2.3098 × 10³ | 2.3472 × 10³ | 5.9579 × 10³ | 3.8288 × 10³ |
| Std | 2.0541 × 10³ | 1.8701 × 10³ | 2.7016 × 10³ | 2.4042 × 10³ | 2.3332 × 10³ | 1.7858 × 101 | 2.5448 × 100 | 4.5840 × 101 | 1.6821 × 10³ | 1.5900 × 10³ | |
| F23 | Mean | 2.8124 × 10³ | 2.8197 × 10³ | 2.9730 × 10³ | 2.8643 × 10³ | 2.9853 × 10³ | 2.7521 × 10³ | 2.8459 × 10³ | 2.7860 × 10³ | 3.0295 × 10³ | 2.7482 × 10³ |
| Std | 3.5110 × 101 | 4.4436 × 101 | 7.0886 × 101 | 6.5980 × 101 | 7.3775 × 101 | 1.7045 × 101 | 1.9810 × 101 | 3.8880 × 101 | 7.2357 × 101 | 1.9297 × 101 | |
| F24 | Mean | 2.9629 × 10³ | 2.9717 × 10³ | 3.1026 × 10³ | 3.0250 × 10³ | 3.1508 × 10³ | 2.9169 × 10³ | 3.0174 × 10³ | 2.9578 × 10³ | 3.1927 × 10³ | 2.9552 × 10³ |
| Std | 3.0418 × 101 | 5.0854 × 101 | 5.4099 × 101 | 8.9759 × 101 | 8.5100 × 101 | 1.5911 × 101 | 2.0416 × 101 | 3.7326 × 101 | 7.4481 × 101 | 3.7275 × 101 | |
| F25 | Mean | 2.9537 × 10³ | 2.9894 × 10³ | 3.1396 × 10³ | 2.9660 × 10³ | 2.9781 × 10³ | 2.9344 × 10³ | 2.9150 × 10³ | 2.9704 × 10³ | 3.2801 × 10³ | 2.8925 × 10³ |
| Std | 2.3983 × 101 | 5.1357 × 101 | 9.5714 × 101 | 3.0666 × 101 | 1.4119 × 10² | 2.0018 × 101 | 1.6907 × 101 | 2.4124 × 101 | 2.2383 × 10² | 1.2564 × 101 | |
| F26 | Mean | 4.8078 × 10³ | 6.1398 × 10³ | 6.7816 × 10³ | 6.0131 × 10³ | 6.9286 × 10³ | 4.2501 × 10³ | 4.9561 × 10³ | 5.1848 × 10³ | 7.2540 × 10³ | 4.5868 × 10³ |
| Std | 1.2737 × 10³ | 7.6364 × 10² | 1.6242 × 10³ | 1.8671 × 10³ | 1.0119 × 10³ | 6.6665 × 10² | 1.2473 × 10³ | 9.8753 × 10² | 1.4921 × 10³ | 6.7159 × 10² | |
| F27 | Mean | 3.2980 × 10³ | 3.2939 × 10³ | 3.3729 × 10³ | 3.2864 × 10³ | 3.3443 × 10³ | 3.2621 × 10³ | 3.2746 × 10³ | 3.2790 × 10³ | 3.3929 × 10³ | 3.2244 × 10³ |
| Std | 4.4947 × 101 | 4.7424 × 101 | 9.8957 × 101 | 4.8187 × 101 | 7.8180 × 101 | 1.4906 × 101 | 1.2546 × 101 | 2.8122 × 101 | 9.9678 × 101 | 1.3185 × 101 | |
| F28 | Mean | 3.3128 × 10³ | 3.4574 × 10³ | 3.5863 × 10³ | 3.3904 × 10³ | 3.6925 × 10³ | 3.3070 × 10³ | 3.2864 × 10³ | 3.3538 × 10³ | 4.0754 × 10³ | 3.2095 × 10³ |
| Std | 3.0797 × 101 | 1.3534 × 10² | 1.0354 × 10² | 1.0071 × 10² | 7.2494 × 10² | 2.3882 × 101 | 1.8118 × 101 | 4.5569 × 101 | 4.6386 × 10² | 3.2677 × 101 | |
| F29 | Mean | 4.3276 × 10³ | 4.3871 × 10³ | 4.9068 × 10³ | 4.1970 × 10³ | 4.4064 × 10³ | 3.8027 × 10³ | 3.9421 × 10³ | 3.9766 × 10³ | 4.5631 × 10³ | 3.6825 × 10³ |
| Std | 2.9691 × 10² | 3.4271 × 10² | 5.0121 × 10² | 3.0088 × 10² | 3.3855 × 10² | 2.0339 × 10² | 1.3313 × 10² | 2.0729 × 10² | 3.1988 × 10² | 1.3905 × 10² | |
| F30 | Mean | 7.5835 × 10⁶ | 3.8007 × 10⁶ | 4.2896 × 10⁷ | 8.4434 × 10⁵ | 1.8720 × 10⁶ | 4.5062 × 10⁵ | 1.0977 × 10⁵ | 8.5338 × 10⁴ | 1.2651 × 10⁷ | 1.6616 × 10⁴ |
| Std | 4.8053 × 10⁶ | 3.2224 × 10⁶ | 3.5696 × 10⁷ | 8.6091 × 10⁵ | 2.5307 × 10⁶ | 3.4936 × 10⁵ | 5.1837 × 10⁴ | 1.0351 × 10⁵ | 1.0297 × 10⁷ | 1.3243 × 10⁴ | |
| Mean. Rank | 4.87 | 6.03 | 9.30 | 6.80 | 8.03 | 3.13 | 3.73 | 3.57 | 8.07 | 1.47 | |
| Friedman | 5 | 6 | 10 | 7 | 8 | 2 | 4 | 3 | 9 | 1 | |
| F~ | Metric | VPPSO | MELGWO | MEWOA | COA | DBO | GRO | CPO | ARO | POA | ACPOA |
|---|---|---|---|---|---|---|---|---|---|---|---|
| F1 | Mean | 3.4657 × 10² | 3.0429 × 10² | 1.9358 × 10³ | 3.9057 × 10³ | 2.0106 × 10³ | 4.8105 × 10² | 3.9349 × 10² | 5.0408 × 10² | 7.9300 × 10² | 3.0003 × 10² |
| Std | 1.0999 × 10² | 1.3128 × 101 | 1.7070 × 10³ | 2.7774 × 10³ | 1.7332 × 10³ | 3.7233 × 10² | 8.9270 × 101 | 3.4324 × 10² | 9.1688 × 10² | 8.3926 × 10⁻² | |
| F2 | Mean | 4.1114 × 10² | 4.1037 × 10² | 4.3779 × 10² | 4.1615 × 10² | 4.3807 × 10² | 4.0268 × 10² | 4.0064 × 10² | 4.0507 × 10² | 4.2054 × 10² | 4.0118 × 10² |
| Std | 1.7082 × 101 | 1.6896 × 101 | 3.4958 × 101 | 2.6395 × 101 | 3.6601 × 101 | 3.3673 × 100 | 1.4780 × 100 | 1.2343 × 101 | 2.6738 × 101 | 1.9302 × 100 | |
| F3 | Mean | 6.0734 × 10² | 6.0792 × 10² | 6.2528 × 10² | 6.0749 × 10² | 6.1192 × 10² | 6.0004 × 10² | 6.0000 × 10² | 6.0015 × 10² | 6.2215 × 10² | 6.0000 × 10² |
| Std | 6.1923 × 100 | 7.6987 × 100 | 1.0269 × 101 | 9.6619 × 100 | 7.4745 × 100 | 2.2921 × 10⁻² | 3.1990 × 10⁻³ | 2.8397 × 10⁻¹ | 1.1809 × 101 | 1.2467 × 10⁻³ | |
| F4 | Mean | 8.1767 × 10² | 8.1575 × 10² | 8.2971 × 10² | 8.2968 × 10² | 8.3440 × 10² | 8.0968 × 10² | 8.2145 × 10² | 8.1669 × 10² | 8.1901 × 10² | 8.1775 × 10² |
| Std | 5.7903 × 100 | 6.8940 × 100 | 8.1023 × 100 | 5.7547 × 100 | 1.2651 × 101 | 2.8398 × 100 | 5.1475 × 100 | 6.8492 × 100 | 5.9016 × 100 | 5.4649 × 100 | |
| F5 | Mean | 9.1339 × 10² | 9.7621 × 10² | 1.1846 × 10³ | 1.0600 × 10³ | 1.0028 × 10³ | 9.0006 × 10² | 9.0000 × 10² | 9.1070 × 10² | 1.0933 × 10³ | 9.0275 × 10² |
| Std | 2.1344 × 101 | 9.0952 × 101 | 2.0945 × 10² | 2.0665 × 10² | 1.2525 × 10² | 1.1693 × 10⁻¹ | 6.5088 × 10⁻⁴ | 1.9006 × 101 | 1.1774 × 10² | 5.3010 × 100 | |
| F6 | Mean | 4.4722 × 10³ | 3.7368 × 10³ | 1.6579 × 10⁴ | 4.7699 × 10³ | 5.2819 × 10³ | 2.8071 × 10³ | 1.8282 × 10³ | 2.7588 × 10³ | 2.8474 × 10³ | 1.8409 × 10³ |
| Std | 2.2332 × 10³ | 2.1388 × 10³ | 1.5632 × 10⁴ | 1.8412 × 10³ | 2.2808 × 10³ | 9.9904 × 10² | 1.3051 × 101 | 1.1952 × 10³ | 1.3497 × 10³ | 1.1364 × 10² | |
| F7 | Mean | 2.0402 × 10³ | 2.0412 × 10³ | 2.0550 × 10³ | 2.0266 × 10³ | 2.0415 × 10³ | 2.0146 × 10³ | 2.0111 × 10³ | 2.0143 × 10³ | 2.0394 × 10³ | 2.0017 × 10³ |
| Std | 1.3565 × 101 | 2.2983 × 101 | 2.1811 × 101 | 2.3171 × 101 | 2.3737 × 101 | 8.4558 × 100 | 5.3486 × 100 | 9.4758 × 100 | 1.5977 × 101 | 5.0237 × 100 | |
| F8 | Mean | 2.2250 × 10³ | 2.2285 × 10³ | 2.2303 × 10³ | 2.2253 × 10³ | 2.2378 × 10³ | 2.2211 × 10³ | 2.2175 × 10³ | 2.2191 × 10³ | 2.2222 × 10³ | 2.2135 × 10³ |
| Std | 4.5283 × 100 | 2.3298 × 101 | 5.3590 × 100 | 9.5938 × 100 | 3.0783 × 101 | 5.4061 × 100 | 5.6260 × 100 | 4.9851 × 100 | 8.1068 × 100 | 9.5202 × 100 | |
| F9 | Mean | 2.5325 × 10³ | 2.5308 × 10³ | 2.5615 × 10³ | 2.5342 × 10³ | 2.5620 × 10³ | 2.5293 × 10³ | 2.5293 × 10³ | 2.5294 × 10³ | 2.5447 × 10³ | 2.5293 × 10³ |
| Std | 4.8412 × 100 | 7.0711 × 100 | 4.0100 × 101 | 2.6826 × 101 | 4.9916 × 101 | 1.9516 × 10⁻² | 5.2841 × 10⁻³ | 4.4776 × 10⁻¹ | 2.0188 × 101 | 5.6355 × 10⁻¹⁰ | |
| F10 | Mean | 2.5452 × 10³ | 2.5907 × 10³ | 2.5304 × 10³ | 2.5757 × 10³ | 2.5437 × 10³ | 2.5076 × 10³ | 2.5157 × 10³ | 2.5156 × 10³ | 2.5398 × 10³ | 2.5076 × 10³ |
| Std | 5.9916 × 101 | 1.6575 × 10² | 5.4505 × 101 | 1.3449 × 10² | 6.1479 × 101 | 2.7629 × 101 | 3.9638 × 101 | 3.9109 × 101 | 6.0838 × 101 | 5.8674 × 101 | |
| F11 | Mean | 2.7651 × 10³ | 2.7579 × 10³ | 2.7460 × 10³ | 2.7806 × 10³ | 2.8091 × 10³ | 2.6049 × 10³ | 2.6233 × 10³ | 2.6225 × 10³ | 2.7512 × 10³ | 2.6795 × 10³ |
| Std | 1.7757 × 10² | 1.7065 × 10² | 1.1913 × 10² | 1.7163 × 10² | 2.0082 × 10² | 2.1820 × 101 | 8.9763 × 101 | 5.2027 × 101 | 1.4235 × 10² | 1.1109 × 10² | |
| F12 | Mean | 2.8640 × 10³ | 2.8658 × 10³ | 2.8650 × 10³ | 2.8697 × 10³ | 2.8766 × 10³ | 2.8646 × 10³ | 2.8653 × 10³ | 2.8679 × 10³ | 2.8723 × 10³ | 2.8646 × 10³ |
| Std | 1.1965 × 100 | 3.9116 × 100 | 1.7109 × 100 | 1.3017 × 101 | 1.8227 × 101 | 7.1820 × 10⁻¹ | 7.5474 × 10⁻¹ | 4.4122 × 100 | 1.8535 × 101 | 1.3917 × 100 | |
| Mean. Rank | 5.17 | 5.33 | 9.00 | 6.92 | 8.67 | 3.42 | 2.92 | 4.08 | 7.42 | 2.08 | |
| Friedman | 5 | 6 | 10 | 7 | 9 | 3 | 2 | 4 | 8 | 1 | |
| F~ | Metric | VPPSO | MELGWO | MEWOA | COA | DBO | GRO | CPO | ARO | POA | ACPOA |
|---|---|---|---|---|---|---|---|---|---|---|---|
| F1 | Mean | 6.2969 × 10³ | 5.6957 × 10³ | 1.6995 × 10⁴ | 4.8599 × 10⁴ | 3.8080 × 10⁴ | 1.1417 × 10⁴ | 1.2658 × 10⁴ | 1.4647 × 10⁴ | 8.9836 × 10³ | 2.2912 × 10³ |
| Std | 2.7746 × 10³ | 2.7018 × 10³ | 4.4983 × 10³ | 1.3467 × 10⁴ | 1.1222 × 10⁴ | 3.5870 × 10³ | 3.2792 × 10³ | 3.9141 × 10³ | 2.8026 × 10³ | 1.3883 × 10³ | |
| F2 | Mean | 4.8107 × 10² | 5.1462 × 10² | 5.8912 × 10² | 5.0038 × 10² | 5.0458 × 10² | 4.6271 × 10² | 4.5915 × 10² | 4.8339 × 10² | 6.4422 × 10² | 4.4991 × 10² |
| Std | 2.8896 × 101 | 3.9989 × 101 | 6.5907 × 101 | 3.6146 × 101 | 8.0071 × 101 | 1.0024 × 101 | 1.0142 × 101 | 3.2460 × 101 | 1.0716 × 10² | 1.9784 × 101 | |
| F3 | Mean | 6.3019 × 10² | 6.2784 × 10² | 6.5362 × 10² | 6.3468 × 10² | 6.3436 × 10² | 6.0167 × 10² | 6.0033 × 10² | 6.0539 × 10² | 6.5430 × 10² | 6.0001 × 10² |
| Std | 1.1186 × 101 | 1.1766 × 101 | 1.1987 × 101 | 1.7618 × 101 | 1.0589 × 101 | 5.1073 × 10⁻¹ | 1.3581 × 10⁻¹ | 4.3495 × 100 | 9.3883 × 100 | 2.1218 × 10⁻² | |
| F4 | Mean | 8.5977 × 10² | 8.6492 × 10² | 9.1100 × 10² | 8.8575 × 10² | 9.1892 × 10² | 8.4402 × 10² | 9.0038 × 10² | 8.5377 × 10² | 8.8068 × 10² | 8.6319 × 10² |
| Std | 1.5268 × 101 | 1.5199 × 101 | 1.5716 × 101 | 1.5254 × 101 | 2.4063 × 101 | 7.8358 × 100 | 1.3335 × 101 | 1.7456 × 101 | 1.2753 × 101 | 1.9148 × 101 | |
| F5 | Mean | 1.5191 × 10³ | 1.6320 × 10³ | 2.8787 × 10³ | 2.6005 × 10³ | 2.1874 × 10³ | 9.2266 × 10² | 9.2261 × 10² | 1.2945 × 10³ | 2.2097 × 10³ | 1.2438 × 10³ |
| Std | 3.6595 × 10² | 3.6887 × 10² | 5.0999 × 10² | 5.9181 × 10² | 5.2628 × 10² | 1.2432 × 101 | 3.9376 × 101 | 2.7261 × 10² | 1.7774 × 10² | 2.4311 × 10² | |
| F6 | Mean | 4.7761 × 10³ | 6.4213 × 10³ | 9.5032 × 10⁶ | 8.6735 × 10³ | 1.4453 × 10⁶ | 7.3043 × 10⁴ | 2.9895 × 10⁴ | 3.3147 × 10³ | 1.0228 × 10⁶ | 2.5973 × 10³ |
| Std | 3.4746 × 10³ | 5.7911 × 10³ | 1.1634 × 10⁷ | 7.0119 × 10³ | 4.7778 × 10⁶ | 1.2657 × 10⁵ | 2.8984 × 10⁴ | 1.5890 × 10³ | 1.8377 × 10⁶ | 9.2865 × 10² | |
| F7 | Mean | 2.1021 × 10³ | 2.1284 × 10³ | 2.1466 × 10³ | 2.1606 × 10³ | 2.1469 × 10³ | 2.0507 × 10³ | 2.0629 × 10³ | 2.0632 × 10³ | 2.1151 × 10³ | 2.0297 × 10³ |
| Std | 4.0420 × 101 | 6.7217 × 101 | 3.4365 × 101 | 1.0040 × 10² | 6.1833 × 101 | 1.0990 × 101 | 9.8261 × 100 | 3.1257 × 101 | 3.8444 × 101 | 1.2374 × 101 | |
| F8 | Mean | 2.2661 × 10³ | 2.2762 × 10³ | 2.2812 × 10³ | 2.2748 × 10³ | 2.3359 × 10³ | 2.2296 × 10³ | 2.2315 × 10³ | 2.2323 × 10³ | 2.2642 × 10³ | 2.2220 × 10³ |
| Std | 6.4708 × 101 | 5.8535 × 101 | 6.3978 × 101 | 5.3474 × 101 | 9.5727 × 101 | 2.2382 × 100 | 1.8118 × 100 | 3.0063 × 101 | 5.3938 × 101 | 1.3001 × 100 | |
| F9 | Mean | 2.5098 × 10³ | 2.5006 × 10³ | 2.5600 × 10³ | 2.4822 × 10³ | 2.5094 × 10³ | 2.4835 × 10³ | 2.4819 × 10³ | 2.4865 × 10³ | 2.5495 × 10³ | 2.4808 × 10³ |
| Std | 1.9572 × 101 | 1.7239 × 101 | 4.1348 × 101 | 2.7193 × 100 | 2.6095 × 101 | 1.1662 × 100 | 7.1576 × 10⁻¹ | 3.4248 × 100 | 3.1790 × 101 | 2.6827 × 10⁻⁴ | |
| F10 | Mean | 3.0863 × 10³ | 3.9147 × 10³ | 3.6152 × 10³ | 3.7418 × 10³ | 3.4571 × 10³ | 2.5383 × 10³ | 2.5387 × 10³ | 2.6418 × 10³ | 3.5533 × 10³ | 2.4802 × 10³ |
| Std | 9.1275 × 10² | 6.4224 × 10² | 1.3826 × 10³ | 1.4204 × 10³ | 1.0735 × 10³ | 6.3597 × 101 | 7.7304 × 101 | 2.0358 × 10² | 1.0430 × 10³ | 8.7741 × 101 | |
| F11 | Mean | 2.9600 × 10³ | 3.1076 × 10³ | 3.8688 × 10³ | 3.3376 × 10³ | 3.1834 × 10³ | 3.0163 × 10³ | 2.9152 × 10³ | 2.9490 × 10³ | 4.8660 × 10³ | 2.9200 × 10³ |
| Std | 2.5409 × 10² | 2.2789 × 10² | 6.4080 × 10² | 7.5569 × 10² | 5.1257 × 10² | 8.0592 × 101 | 7.3399 × 101 | 6.8034 × 101 | 8.7819 × 10² | 4.0680 × 101 | |
| F12 | Mean | 2.9879 × 10³ | 2.9828 × 10³ | 3.0129 × 10³ | 2.9995 × 10³ | 3.0316 × 10³ | 2.9682 × 10³ | 2.9886 × 10³ | 2.9829 × 10³ | 3.0570 × 10³ | 2.9520 × 10³ |
| Std | 4.6786 × 101 | 2.7982 × 101 | 4.3618 × 101 | 3.7041 × 101 | 4.5918 × 101 | 1.1385 × 101 | 1.0707 × 101 | 2.0398 × 101 | 6.2539 × 101 | 1.0873 × 101 | |
| Mean. Rank | 4.42 | 5.75 | 9.00 | 7.25 | 7.67 | 3.25 | 4.17 | 3.92 | 8.17 | 1.42 | |
| Friedman | 5 | 6 | 10 | 7 | 8 | 2 | 4 | 3 | 9 | 1 | |
| Algorithm | Time Complexity | Complexity Analysis |
|---|---|---|
| VPPSO | O (T × N × dim) | The velocity pause mechanism adds a constant-time judgment operation (O (1)) for each particle, and the overall complexity is dominated by iteration (T), population size (N), Reverse Learning (N),and dimension (dim) |
| MELGWO | O (T × N × dim) | The adaptive strategy introduces a constant-time parameter adjustment (O (1)), and the hierarchy update of grey wolves is O (N) (sorting), so the overall complexity is O (T × (N × dim + N)) = O (T × N × dim) |
| MEWOA | O (T × N × dim) | The moulting behavior requires a constant-time boundary judgment (O (1)), and the foraging update is O (N × dim), so the overall complexity is O (T × N × dim) |
| COA | O (T × N × dim) | The moulting behavior requires a constant-time boundary judgment (O (1)), and the foraging update is O (N × dim), so the overall complexity is O (T × N × dim) |
| DBO | O (T × N × dim) | The stealing behavior adds a constant-time random selection (O (1)) for each individual, and the dominant term is still O (T × N × dim) |
| GRO | O (T × N × dim) | The prospecting direction update is O (N × dim), and the digging depth adjustment is O (1), so the complexity is O (T × N × dim) |
| CPO | O (T × N × dim) | The quill defense mechanism adds a constant-time distance calculation (O (1)), and the overall complexity is dominated by iteration and population-dimension update |
| ARO | O (T × N × dim) | The hiding behavior requires a constant-time position randomization (O (1)), and the foraging update is O (N×dim), so the complexity is O (T × N × dim) |
| POA | O (T × N × dim) | The two-phase update (exploration + exploitation) is O (N × dim) per iteration, and no additional high-complexity operations are introduced |
| ACPOA | O (T × N × dim) | 1. Elite pool mutation: Selecting top 3 individuals requires O (N) sorting (constant-time for small N), so O (1); 2. Adaptive cooperative mechanism: Subgroup-dimension allocation uses roulette wheel selection (O(dim) per subgroup, S = min(4, dim) is constant), so O (dim) = O (1); 3. Hybrid boundary handling: Probabilistic repair is O (1) per individual. The dominant term is still O (T × N × dim), which is consistent with the baseline POA |
| Image | Threshold = 2 | Threshold = 4 | Threshold = 6 | Threshold = 8 |
|---|---|---|---|---|
| baboon | 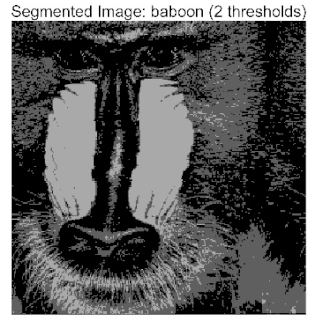 | 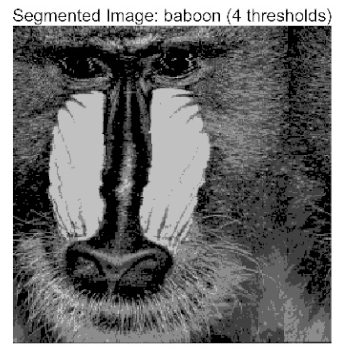 | 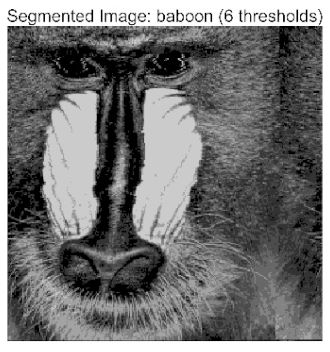 | 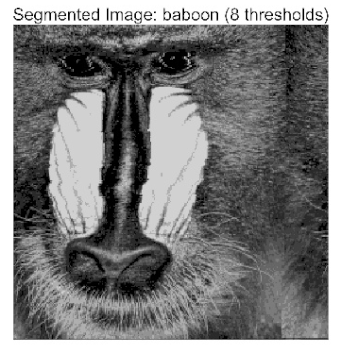 |
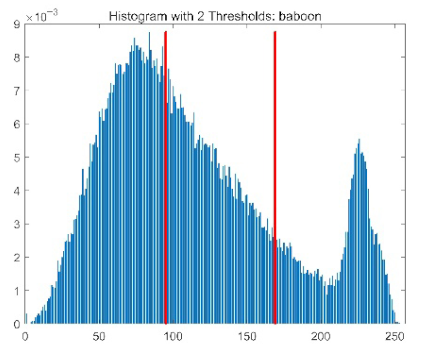 | 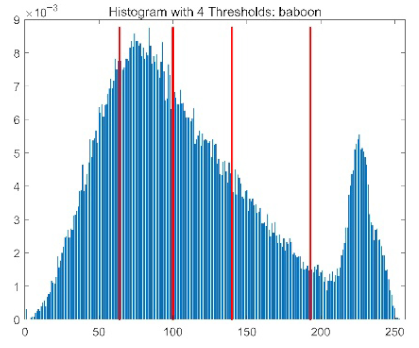 | 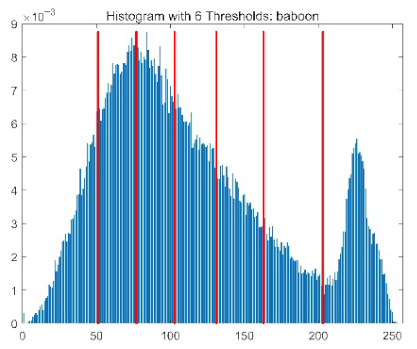 | 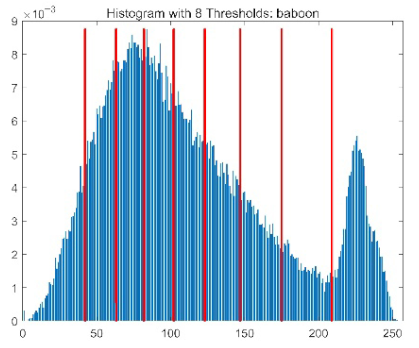 | |
| bank | 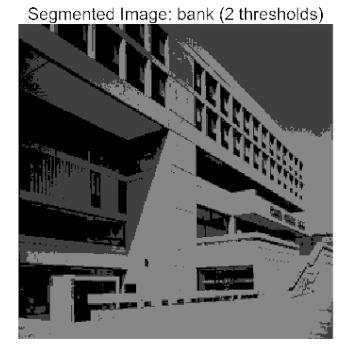 | 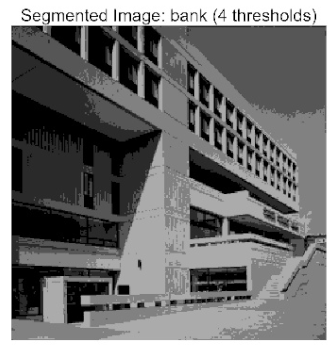 | 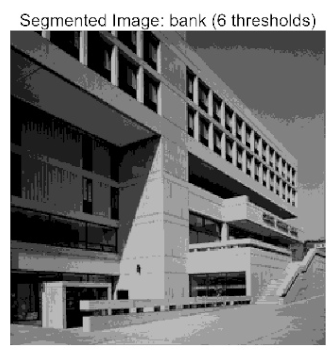 | 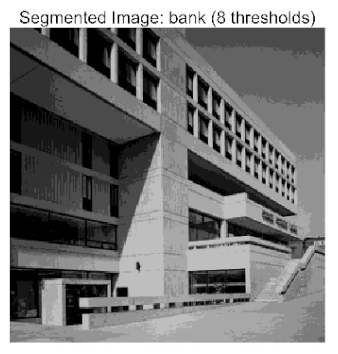 |
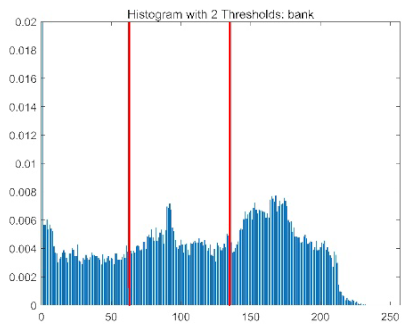 | 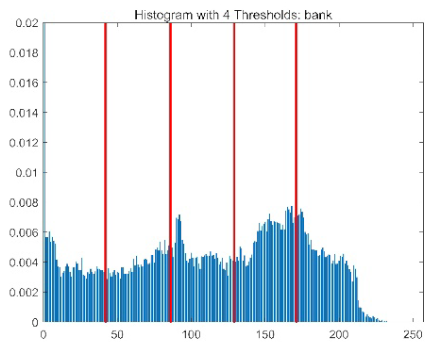 | 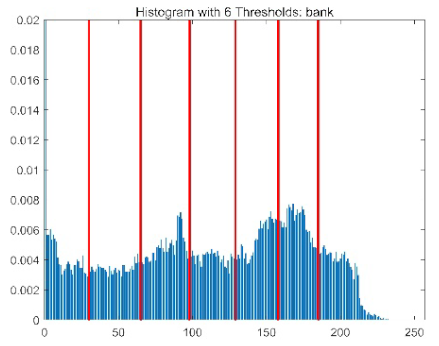 | 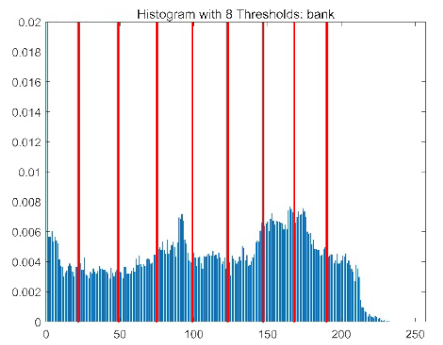 | |
| camera | 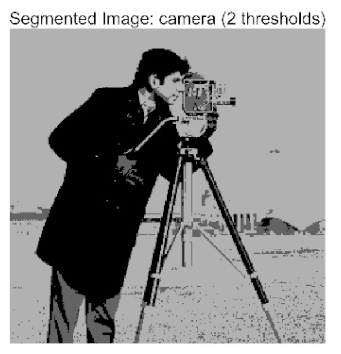 | 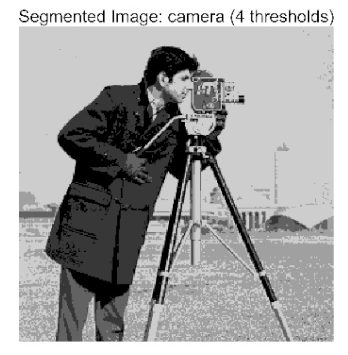 | 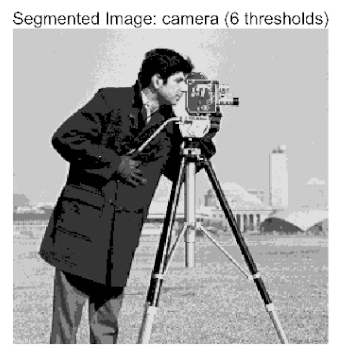 | 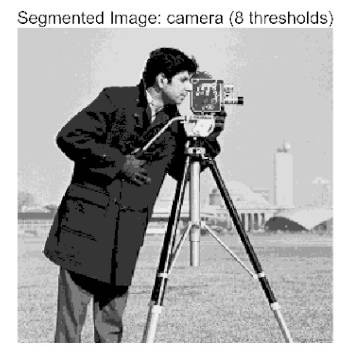 |
 | 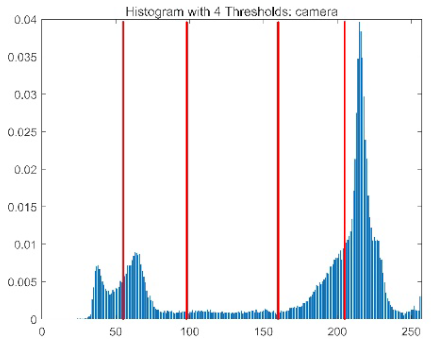 | 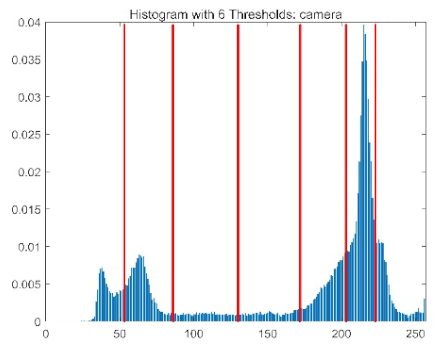 | 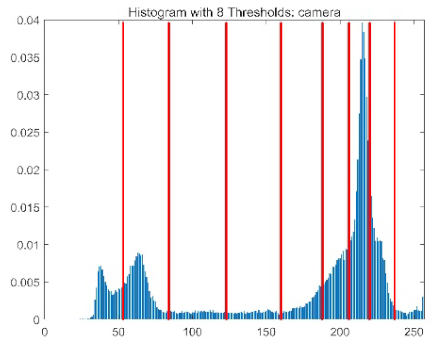 | |
| face | 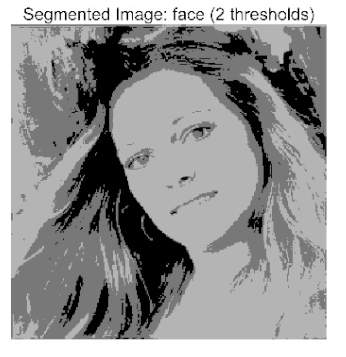 | 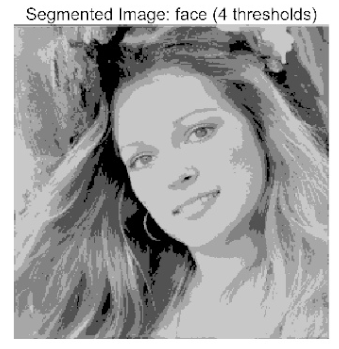 | 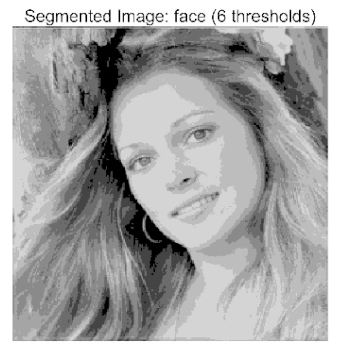 | 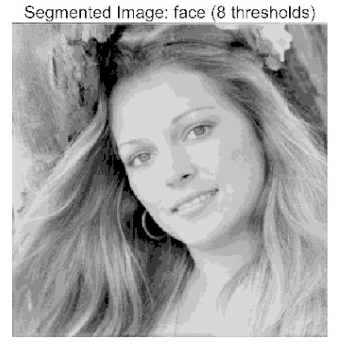 |
 |  |  |  | |
| lena | 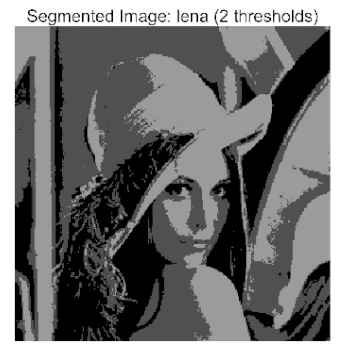 | 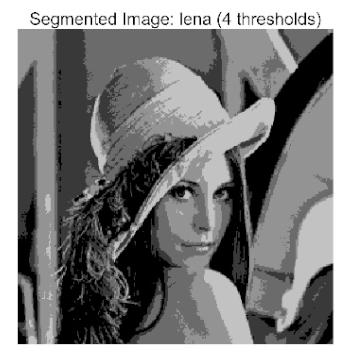 | 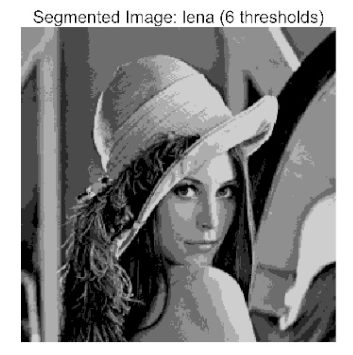 | 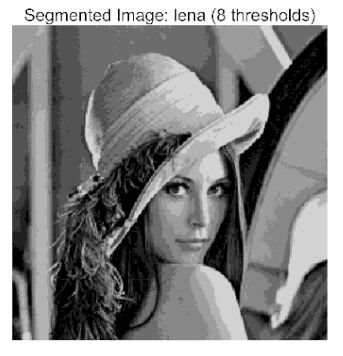 |
 | 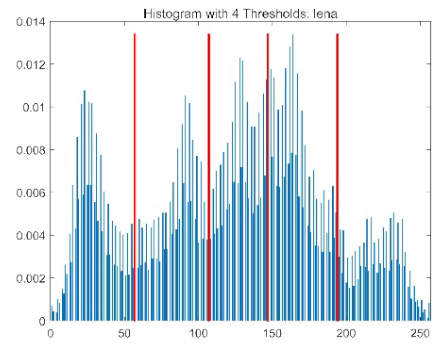 | 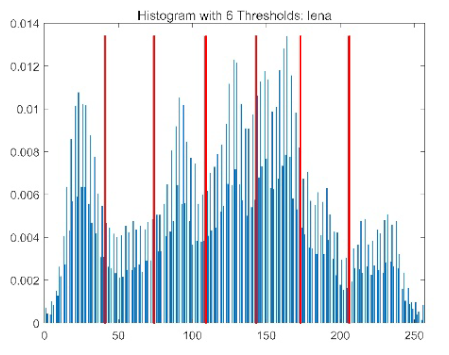 | 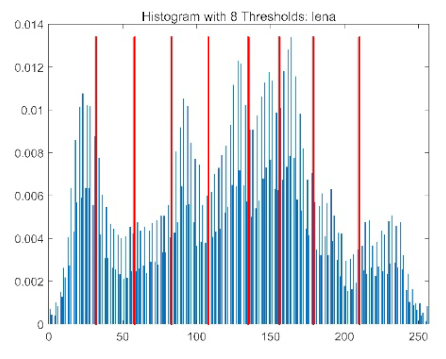 |
| Image | Threshold | Metric | VPPSO | MELGWO | MEWOA | COA | DBO | GRO | CPO | ARO | POA | ACPOA |
|---|---|---|---|---|---|---|---|---|---|---|---|---|
| baboon | 2 | Mean | 3.02 × 10³ | 3.02 × 10³ | 3.02 × 10³ | 3.02 × 10³ | 3.02 × 10³ | 3.02 × 10³ | 3.02 × 10³ | 3.02 × 10³ | 3.02 × 10³ | 3.02 × 10³ |
| Std | 8.35 × 10⁻³ | 1.16 × 10⁻¹ | 3.86 × 10⁻¹ | 1.14 × 100 | 3.48 × 10⁻² | 5.19 × 10⁻¹ | 8.03 × 10⁻¹ | 1.23 × 10⁻¹ | 1.85 × 10⁻¹² | 1.85 × 10⁻¹² | ||
| 4 | Mean | 3.30 × 10³ | 3.30 × 10³ | 3.29 × 10³ | 3.29 × 10³ | 3.30 × 10³ | 3.30 × 10³ | 3.29 × 10³ | 3.30 × 10³ | 3.30 × 10³ | 3.30 × 10³ | |
| Std | 8.82 × 10⁻¹ | 4.13 × 100 | 4.01 × 100 | 1.15 × 101 | 2.44 × 100 | 3.83 × 100 | 5.80 × 100 | 3.09 × 100 | 1.19 × 100 | 1.50 × 10⁻² | ||
| 6 | Mean | 3.37 × 10³ | 3.37 × 10³ | 3.36 × 10³ | 3.36 × 10³ | 3.36 × 10³ | 3.36 × 10³ | 3.36 × 10³ | 3.36 × 10³ | 3.37 × 10³ | 3.37 × 10³ | |
| Std | 3.35 × 100 | 3.69 × 100 | 1.05 × 101 | 1.05 × 101 | 5.16 × 100 | 5.09 × 100 | 4.53 × 100 | 4.31 × 100 | 2.32 × 100 | 1.03 × 10⁻¹ | ||
| 8 | Mean | 3.40 × 10³ | 3.39 × 10³ | 3.38 × 10³ | 3.38 × 10³ | 3.39 × 10³ | 3.39 × 10³ | 3.39 × 10³ | 3.39 × 10³ | 3.40 × 10³ | 3.40 × 10³ | |
| Std | 3.14 × 100 | 7.06 × 100 | 1.03 × 101 | 6.94 × 100 | 5.14 × 100 | 3.29 × 100 | 3.73 × 100 | 3.79 × 100 | 2.12 × 100 | 1.70 × 10⁻¹ | ||
| bank | 2 | Mean | 3.34 × 10³ | 3.34 × 10³ | 3.34 × 10³ | 3.34 × 10³ | 3.34 × 10³ | 3.34 × 10³ | 3.34 × 10³ | 3.34 × 10³ | 3.34 × 10³ | 3.34 × 10³ |
| Std | 0.00 × 100 | 6.34 × 10⁻¹ | 4.20 × 10⁻¹ | 2.08 × 100 | 3.50 × 10⁻² | 1.99 × 10⁻¹ | 5.75 × 10⁻¹ | 2.06 × 10⁻¹ | 0.00 × 100 | 0.00 × 100 | ||
| 4 | Mean | 3.60 × 10³ | 3.60 × 10³ | 3.59 × 10³ | 3.59 × 10³ | 3.60 × 10³ | 3.60 × 10³ | 3.59 × 10³ | 3.60 × 10³ | 3.60 × 10³ | 3.60 × 10³ | |
| Std | 6.66 × 10⁻¹ | 2.90 × 100 | 1.35 × 101 | 7.87 × 100 | 2.84 × 100 | 4.29 × 100 | 3.47 × 100 | 2.25 × 100 | 9.81 × 10⁻¹ | 3.81 × 10⁻² | ||
| 6 | Mean | 3.68 × 10³ | 3.67 × 10³ | 3.66 × 10³ | 3.67 × 10³ | 3.67 × 10³ | 3.67 × 10³ | 3.67 × 10³ | 3.67 × 10³ | 3.68 × 10³ | 3.68 × 10³ | |
| Std | 3.48 × 100 | 6.42 × 100 | 1.20 × 101 | 9.13 × 100 | 7.59 × 100 | 5.03 × 100 | 5.65 × 100 | 3.18 × 100 | 3.01 × 100 | 1.33 × 10⁻¹ | ||
| 8 | Mean | 3.70 × 10³ | 3.70 × 10³ | 3.70 × 10³ | 3.70 × 10³ | 3.70 × 10³ | 3.70 × 10³ | 3.70 × 10³ | 3.70 × 10³ | 3.71 × 10³ | 3.71 × 10³ | |
| Std | 4.05 × 100 | 7.51 × 100 | 6.21 × 100 | 8.53 × 100 | 6.76 × 100 | 4.20 × 100 | 3.61 × 100 | 2.97 × 100 | 3.10 × 100 | 3.12 × 10⁻¹ | ||
| camera | 2 | Mean | 4.48 × 10³ | 4.48 × 10³ | 4.48 × 10³ | 4.48 × 10³ | 4.48 × 10³ | 4.48 × 10³ | 4.48 × 10³ | 4.48 × 10³ | 4.48 × 10³ | 4.48 × 10³ |
| Std | 2.66 × 10⁻² | 1.30 × 10⁻¹ | 7.61 × 10⁻² | 1.14 × 100 | 1.99 × 10⁻² | 0.00 × 100 | 2.88 × 10⁻¹ | 7.52 × 10⁻² | 7.10 × 10⁻² | 0.00 × 100 | ||
| 4 | Mean | 4.60 × 10³ | 4.60 × 10³ | 4.60 × 10³ | 4.60 × 10³ | 4.60 × 10³ | 4.60 × 10³ | 4.60 × 10³ | 4.60 × 10³ | 4.60 × 10³ | 4.60 × 10³ | |
| Std | 1.13 × 100 | 1.54 × 100 | 3.41 × 100 | 2.19 × 100 | 2.36 × 100 | 2.02 × 100 | 2.15 × 100 | 1.62 × 100 | 9.80 × 10⁻¹ | 1.34 × 10⁻² | ||
| 6 | Mean | 4.65 × 10³ | 4.65 × 10³ | 4.64 × 10³ | 4.64 × 10³ | 4.64 × 10³ | 4.64 × 10³ | 4.64 × 10³ | 4.64 × 10³ | 4.65 × 10³ | 4.65 × 10³ | |
| Std | 4.49 × 100 | 5.42 × 100 | 6.58 × 100 | 8.38 × 100 | 5.78 × 100 | 3.92 × 100 | 4.71 × 100 | 3.20 × 100 | 2.72 × 100 | 7.40 × 10⁻² | ||
| 8 | Mean | 4.67 × 10³ | 4.66 × 10³ | 4.66 × 10³ | 4.66 × 10³ | 4.66 × 10³ | 4.66 × 10³ | 4.66 × 10³ | 4.66 × 10³ | 4.66 × 10³ | 4.67 × 10³ | |
| Std | 2.85 × 100 | 3.66 × 100 | 5.40 × 100 | 4.91 × 100 | 4.75 × 100 | 3.14 × 100 | 2.73 × 100 | 2.98 × 100 | 2.43 × 100 | 4.05 × 10⁻¹ | ||
| face | 2 | Mean | 1.91 × 10³ | 1.91 × 10³ | 1.91 × 10³ | 1.91 × 10³ | 1.91 × 10³ | 1.91 × 10³ | 1.91 × 10³ | 1.91 × 10³ | 1.91 × 10³ | 1.91 × 10³ |
| Std | 1.68 × 10⁻¹ | 5.84 × 10⁻¹ | 3.55 × 10⁻¹ | 7.11 × 10⁻¹ | 9.91 × 10⁻² | 1.56 × 10⁻¹ | 6.32 × 10⁻¹ | 3.14 × 10⁻¹ | 1.52 × 10⁻² | 6.94 × 10⁻¹³ | ||
| 4 | Mean | 2.12 × 10³ | 2.12 × 10³ | 2.12 × 10³ | 2.12 × 10³ | 2.12 × 10³ | 2.12 × 10³ | 2.11 × 10³ | 2.12 × 10³ | 2.12 × 10³ | 2.12 × 10³ | |
| Std | 6.95 × 10⁻¹ | 3.51 × 100 | 6.15 × 100 | 7.79 × 100 | 2.75 × 100 | 3.25 × 100 | 3.98 × 100 | 2.52 × 100 | 1.75 × 100 | 5.48 × 10⁻² | ||
| 6 | Mean | 2.18 × 10³ | 2.18 × 10³ | 2.17 × 10³ | 2.17 × 10³ | 2.17 × 10³ | 2.17 × 10³ | 2.17 × 10³ | 2.18 × 10³ | 2.18 × 10³ | 2.18 × 10³ | |
| Std | 2.60 × 100 | 4.89 × 100 | 8.35 × 100 | 7.89 × 100 | 9.25 × 100 | 3.79 × 100 | 4.20 × 100 | 3.29 × 100 | 3.23 × 100 | 1.44 × 10⁻¹ | ||
| 8 | Mean | 2.21 × 10³ | 2.20 × 10³ | 2.19 × 10³ | 2.20 × 10³ | 2.20 × 10³ | 2.20 × 10³ | 2.20 × 10³ | 2.20 × 10³ | 2.20 × 10³ | 2.21 × 10³ | |
| Std | 3.18 × 100 | 4.26 × 100 | 9.80 × 100 | 7.21 × 100 | 6.61 × 100 | 3.41 × 100 | 3.71 × 100 | 2.64 × 100 | 3.02 × 100 | 2.61 × 10⁻¹ | ||
| lena | 2 | Mean | 3.30 × 10³ | 3.30 × 10³ | 3.30 × 10³ | 3.30 × 10³ | 3.30 × 10³ | 3.30 × 10³ | 3.30 × 10³ | 3.30 × 10³ | 3.30 × 10³ | 3.30 × 10³ |
| Std | 1.10 × 10⁻¹ | 8.64 × 10⁻¹ | 2.98 × 10⁻¹ | 1.16 × 100 | 2.08 × 10⁻¹ | 2.86 × 10⁻¹ | 1.85 × 10⁻¹² | 3.65 × 10⁻¹ | 7.88 × 10⁻¹ | 1.85 × 10⁻¹² | ||
| 4 | Mean | 3.69 × 10³ | 3.68 × 10³ | 3.67 × 10³ | 3.68 × 10³ | 3.69 × 10³ | 3.68 × 10³ | 3.68 × 10³ | 3.68 × 10³ | 3.69 × 10³ | 3.69 × 10³ | |
| Std | 8.52 × 10⁻¹ | 3.66 × 100 | 1.56 × 101 | 1.63 × 101 | 1.13 × 100 | 4.48 × 100 | 4.94 × 100 | 3.05 × 100 | 8.54 × 10⁻¹ | 2.28 × 10⁻² | ||
| 6 | Mean | 3.76 × 10³ | 3.76 × 10³ | 3.75 × 10³ | 3.75 × 10³ | 3.75 × 10³ | 3.75 × 10³ | 3.75 × 10³ | 3.76 × 10³ | 3.76 × 10³ | 3.77 × 10³ | |
| Std | 4.63 × 100 | 6.52 × 100 | 1.22 × 101 | 1.29 × 101 | 1.05 × 101 | 5.26 × 100 | 5.89 × 100 | 4.02 × 100 | 2.74 × 100 | 7.58 × 10⁻² | ||
| 8 | Mean | 3.79 × 10³ | 3.79 × 10³ | 3.78 × 10³ | 3.78 × 10³ | 3.79 × 10³ | 3.79 × 10³ | 3.78 × 10³ | 3.79 × 10³ | 3.79 × 10³ | 3.80 × 10³ | |
| Std | 2.86 × 100 | 5.84 × 100 | 6.92 × 100 | 5.82 × 100 | 5.44 × 100 | 4.83 × 100 | 4.26 × 100 | 2.39 × 100 | 2.05 × 100 | 2.44 × 10⁻¹ | ||
| Average rank | 2.93 | 4.36 | 7.52 | 6.95 | 5.86 | 7.03 | 7.96 | 5.96 | 4.17 | 2.25 | ||
| Rank | 2 | 4 | 9 | 7 | 5 | 8 | 10 | 6 | 3 | 1 | ||
| Image | Threshold | Metric | VPPSO | MELGWO | MEWOA | COA | DBO | GRO | CPO | ARO | POA | ACPOA |
|---|---|---|---|---|---|---|---|---|---|---|---|---|
| baboon | 2 | Mean | 13.3365 | 13.3290 | 13.3249 | 13.3267 | 13.3344 | 13.3200 | 13.3101 | 13.3422 | 13.3364 | 13.3364 |
| Std | 7.73 × 10⁻⁴ | 3.38 × 10⁻² | 5.42 × 10⁻² | 5.79 × 10⁻² | 1.17 × 10⁻² | 5.23 × 10⁻² | 8.01 × 10⁻² | 3.88 × 10⁻² | 9.03 × 10⁻¹⁵ | 9.03 × 10⁻¹⁵ | ||
| 4 | Mean | 0.7202 | 0.7256 | 0.7277 | 17.9880 | 18.1284 | 18.0846 | 17.8792 | 18.1788 | 18.2473 | 18.1973 | |
| Std | 7.92 × 10⁻³ | 8.22 × 10⁻³ | 2.06 × 10⁻² | 5.15 × 10⁻¹ | 3.07 × 10⁻¹ | 5.48 × 10⁻¹ | 5.67 × 10⁻¹ | 3.72 × 10⁻¹ | 1.66 × 10⁻¹ | 3.48 × 10⁻² | ||
| 6 | Mean | 21.2406 | 21.0986 | 21.0529 | 20.9320 | 20.6578 | 21.0330 | 20.7988 | 21.1048 | 21.3365 | 21.3841 | |
| Std | 5.05 × 10⁻¹ | 5.77 × 10⁻¹ | 9.22 × 10⁻¹ | 8.76 × 10⁻¹ | 7.55 × 10⁻¹ | 6.08 × 10⁻¹ | 7.65 × 10⁻¹ | 5.21 × 10⁻¹ | 4.31 × 10⁻¹ | 1.21 × 10⁻¹ | ||
| 8 | Mean | 23.0891 | 23.0674 | 22.6065 | 22.4727 | 22.7880 | 22.9362 | 22.7874 | 23.1520 | 23.2291 | 23.7296 | |
| Std | 8.13 × 10⁻¹ | 7.10 × 10⁻¹ | 7.74 × 10⁻¹ | 1.02 × 100 | 6.94 × 10⁻¹ | 7.77 × 10⁻¹ | 7.45 × 10⁻¹ | 4.39 × 10⁻¹ | 6.86 × 10⁻¹ | 1.51 × 10⁻¹ | ||
| bank | 2 | Mean | 16.1237 | 16.1124 | 16.1299 | 16.1213 | 16.1230 | 16.1192 | 16.1282 | 16.1109 | 16.1237 | 16.1237 |
| Std | 1.08 × 10⁻¹⁴ | 3.07 × 10⁻² | 4.33 × 10⁻² | 7.95 × 10⁻² | 6.99 × 10⁻³ | 3.96 × 10⁻² | 6.46 × 10⁻² | 3.36 × 10⁻² | 1.08 × 10⁻¹⁴ | 1.08 × 10⁻¹⁴ | ||
| 4 | Mean | 20.1953 | 20.1507 | 19.9025 | 20.0087 | 20.1336 | 20.1161 | 20.0426 | 20.0276 | 20.1821 | 20.2465 | |
| Std | 7.94 × 10⁻² | 1.27 × 10⁻¹ | 3.50 × 10⁻¹ | 2.25 × 10⁻¹ | 1.13 × 10⁻¹ | 1.64 × 10⁻¹ | 1.94 × 10⁻¹ | 1.67 × 10⁻¹ | 9.39 × 10⁻² | 1.25 × 10⁻² | ||
| 6 | Mean | 22.9213 | 22.8241 | 22.3843 | 22.3978 | 22.6451 | 22.5867 | 22.5365 | 22.6517 | 22.8934 | 23.0945 | |
| Std | 1.84 × 10⁻¹ | 2.36 × 10⁻¹ | 5.38 × 10⁻¹ | 3.73 × 10⁻¹ | 3.76 × 10⁻¹ | 3.10 × 10⁻¹ | 2.99 × 10⁻¹ | 2.21 × 10⁻¹ | 1.82 × 10⁻¹ | 2.99 × 10⁻² | ||
| 8 | Mean | 24.7295 | 24.6335 | 24.1407 | 24.0948 | 24.2443 | 24.2816 | 24.2610 | 24.4456 | 24.7618 | 25.2639 | |
| Std | 3.15 × 10⁻¹ | 5.40 × 10⁻¹ | 4.30 × 10⁻¹ | 6.28 × 10⁻¹ | 4.71 × 10⁻¹ | 3.66 × 10⁻¹ | 2.87 × 10⁻¹ | 2.66 × 10⁻¹ | 3.08 × 10⁻¹ | 5.18 × 10⁻² | ||
| camera | 2 | Mean | 15.0255 | 15.0097 | 15.0406 | 14.9997 | 15.0432 | 15.0081 | 15.0181 | 15.0084 | 15.0526 | 15.0526 |
| Std | 3.88 × 10⁻² | 6.10 × 10⁻² | 2.62 × 10⁻² | 1.63 × 10⁻¹ | 3.07 × 10⁻² | 6.20 × 10⁻² | 1.05 × 10⁻¹ | 7.48 × 10⁻² | 0.00 × 100 | 0.00 × 100 | ||
| 4 | Mean | 18.7913 | 18.2094 | 18.3714 | 18.4111 | 18.3811 | 18.6016 | 18.5922 | 18.7677 | 19.5536 | 19.8549 | |
| Std | 8.56 × 10⁻¹ | 6.30 × 10⁻¹ | 1.03 × 100 | 9.71 × 10⁻¹ | 8.88 × 10⁻¹ | 7.56 × 10⁻¹ | 9.21 × 10⁻¹ | 8.74 × 10⁻¹ | 5.00 × 10⁻¹ | 3.70 × 10⁻² | ||
| 6 | Mean | 21.2128 | 21.2606 | 20.7990 | 20.6149 | 21.4165 | 21.0631 | 21.1030 | 21.3045 | 21.5659 | 21.8909 | |
| Std | 8.96 × 10⁻¹ | 8.21 × 10⁻¹ | 1.17 × 100 | 1.17 × 100 | 7.76 × 10⁻¹ | 8.61 × 10⁻¹ | 1.07 × 100 | 8.14 × 10⁻¹ | 5.25 × 10⁻¹ | 5.73 × 10⁻² | ||
| 8 | Mean | 22.8667 | 22.7975 | 22.5461 | 22.4843 | 22.5379 | 22.7340 | 22.6390 | 22.7709 | 22.7929 | 22.9852 | |
| Std | 5.64 × 10⁻¹ | 7.86 × 10⁻¹ | 1.08 × 100 | 9.80 × 10⁻¹ | 7.58 × 10⁻¹ | 7.87 × 10⁻¹ | 7.56 × 10⁻¹ | 8.73 × 10⁻¹ | 7.20 × 10⁻¹ | 1.72 × 10⁻¹ | ||
| face | 2 | Mean | 14.3031 | 14.2966 | 14.3254 | 14.3093 | 14.3079 | 14.2966 | 14.2850 | 14.2922 | 14.3202 | 14.3225 |
| Std | 6.25 × 10⁻² | 1.08 × 10⁻¹ | 5.65 × 10⁻² | 1.00 × 10⁻¹ | 4.26 × 10⁻² | 8.22 × 10⁻² | 1.43 × 10⁻¹ | 8.78 × 10⁻² | 1.24 × 10⁻² | 1.81× 10⁻¹⁵ | ||
| 4 | Mean | 19.6645 | 19.6634 | 19.4970 | 19.5810 | 19.6764 | 19.5600 | 19.3900 | 19.6174 | 19.6275 | 19.7572 | |
| Std | 1.19 × 10⁻¹ | 1.28 × 10⁻¹ | 2.90 × 10⁻¹ | 2.94 × 10⁻¹ | 1.69 × 10⁻¹ | 2.28 × 10⁻¹ | 3.61 × 10⁻¹ | 1.93 × 10⁻¹ | 1.72 × 10⁻¹ | 2.59 × 10⁻² | ||
| 6 | Mean | 22.3993 | 22.3944 | 21.8273 | 22.0686 | 22.0867 | 22.0759 | 22.0064 | 22.1338 | 22.4368 | 22.5815 | |
| Std | 2.76 × 10⁻¹ | 3.13 × 10⁻¹ | 5.47 × 10⁻¹ | 4.27 × 10⁻¹ | 4.88 × 10⁻¹ | 4.05 × 10⁻¹ | 4.08 × 10⁻¹ | 3.71 × 10⁻¹ | 2.85 × 10⁻¹ | 5.48 × 10⁻² | ||
| 8 | Mean | 24.3443 | 24.1981 | 23.5769 | 23.8893 | 23.8315 | 23.7570 | 23.8162 | 24.1000 | 24.3424 | 24.9131 | |
| Std | 4.00 × 10⁻¹ | 4.09 × 10⁻¹ | 6.92 × 10⁻¹ | 6.04 × 10⁻¹ | 5.97 × 10⁻¹ | 3.11 × 10⁻¹ | 4.07 × 10⁻¹ | 3.05 × 10⁻¹ | 3.17 × 10⁻¹ | 1.00 × 10⁻¹ | ||
| lena | 2 | Mean | 14.9888 | 14.9666 | 14.9883 | 14.9503 | 14.9957 | 14.9672 | 14.9481 | 14.9729 | 14.9860 | 14.9910 |
| Std | 4.00 × 10⁻² | 5.50 × 10⁻² | 4.76 × 10⁻² | 7.25 × 10⁻² | 3.88 × 10⁻² | 5.27 × 10⁻² | 8.02 × 10⁻² | 4.41 × 10⁻² | 3.90 × 10⁻² | 3.89 × 10⁻² | ||
| 4 | Mean | 19.0903 | 19.0530 | 18.9173 | 18.9320 | 19.0882 | 18.9664 | 18.9328 | 19.0154 | 19.0863 | 19.1352 | |
| Std | 5.02 × 10⁻² | 6.16 × 10⁻² | 2.76 × 10⁻¹ | 2.98 × 10⁻¹ | 5.71 × 10⁻² | 1.14 × 10⁻¹ | 1.31 × 10⁻¹ | 9.60 × 10⁻² | 7.08 × 10⁻² | 2.94 × 10⁻² | ||
| 6 | Mean | 21.6002 | 21.5676 | 21.0365 | 21.0846 | 21.3631 | 21.3089 | 21.2994 | 21.4763 | 21.5880 | 21.8932 | |
| Std | 2.75 × 10⁻¹ | 2.92 × 10⁻¹ | 5.29 × 10⁻¹ | 5.58 × 10⁻¹ | 4.43 × 10⁻¹ | 3.07 × 10⁻¹ | 3.18 × 10⁻¹ | 2.24 × 10⁻¹ | 1.78 × 10⁻¹ | 4.51 × 10⁻² | ||
| 8 | Mean | 23.0934 | 22.9918 | 22.8177 | 22.8242 | 22.9642 | 22.9932 | 22.8443 | 23.0844 | 23.2527 | 23.7823 | |
| Std | 3.14 × 10⁻¹ | 3.08 × 10⁻¹ | 4.35 × 10⁻¹ | 4.15 × 10⁻¹ | 4.52 × 10⁻¹ | 3.83 × 10⁻¹ | 4.11 × 10⁻¹ | 3.40 × 10⁻¹ | 2.67 × 10⁻¹ | 1.41 × 10⁻¹ | ||
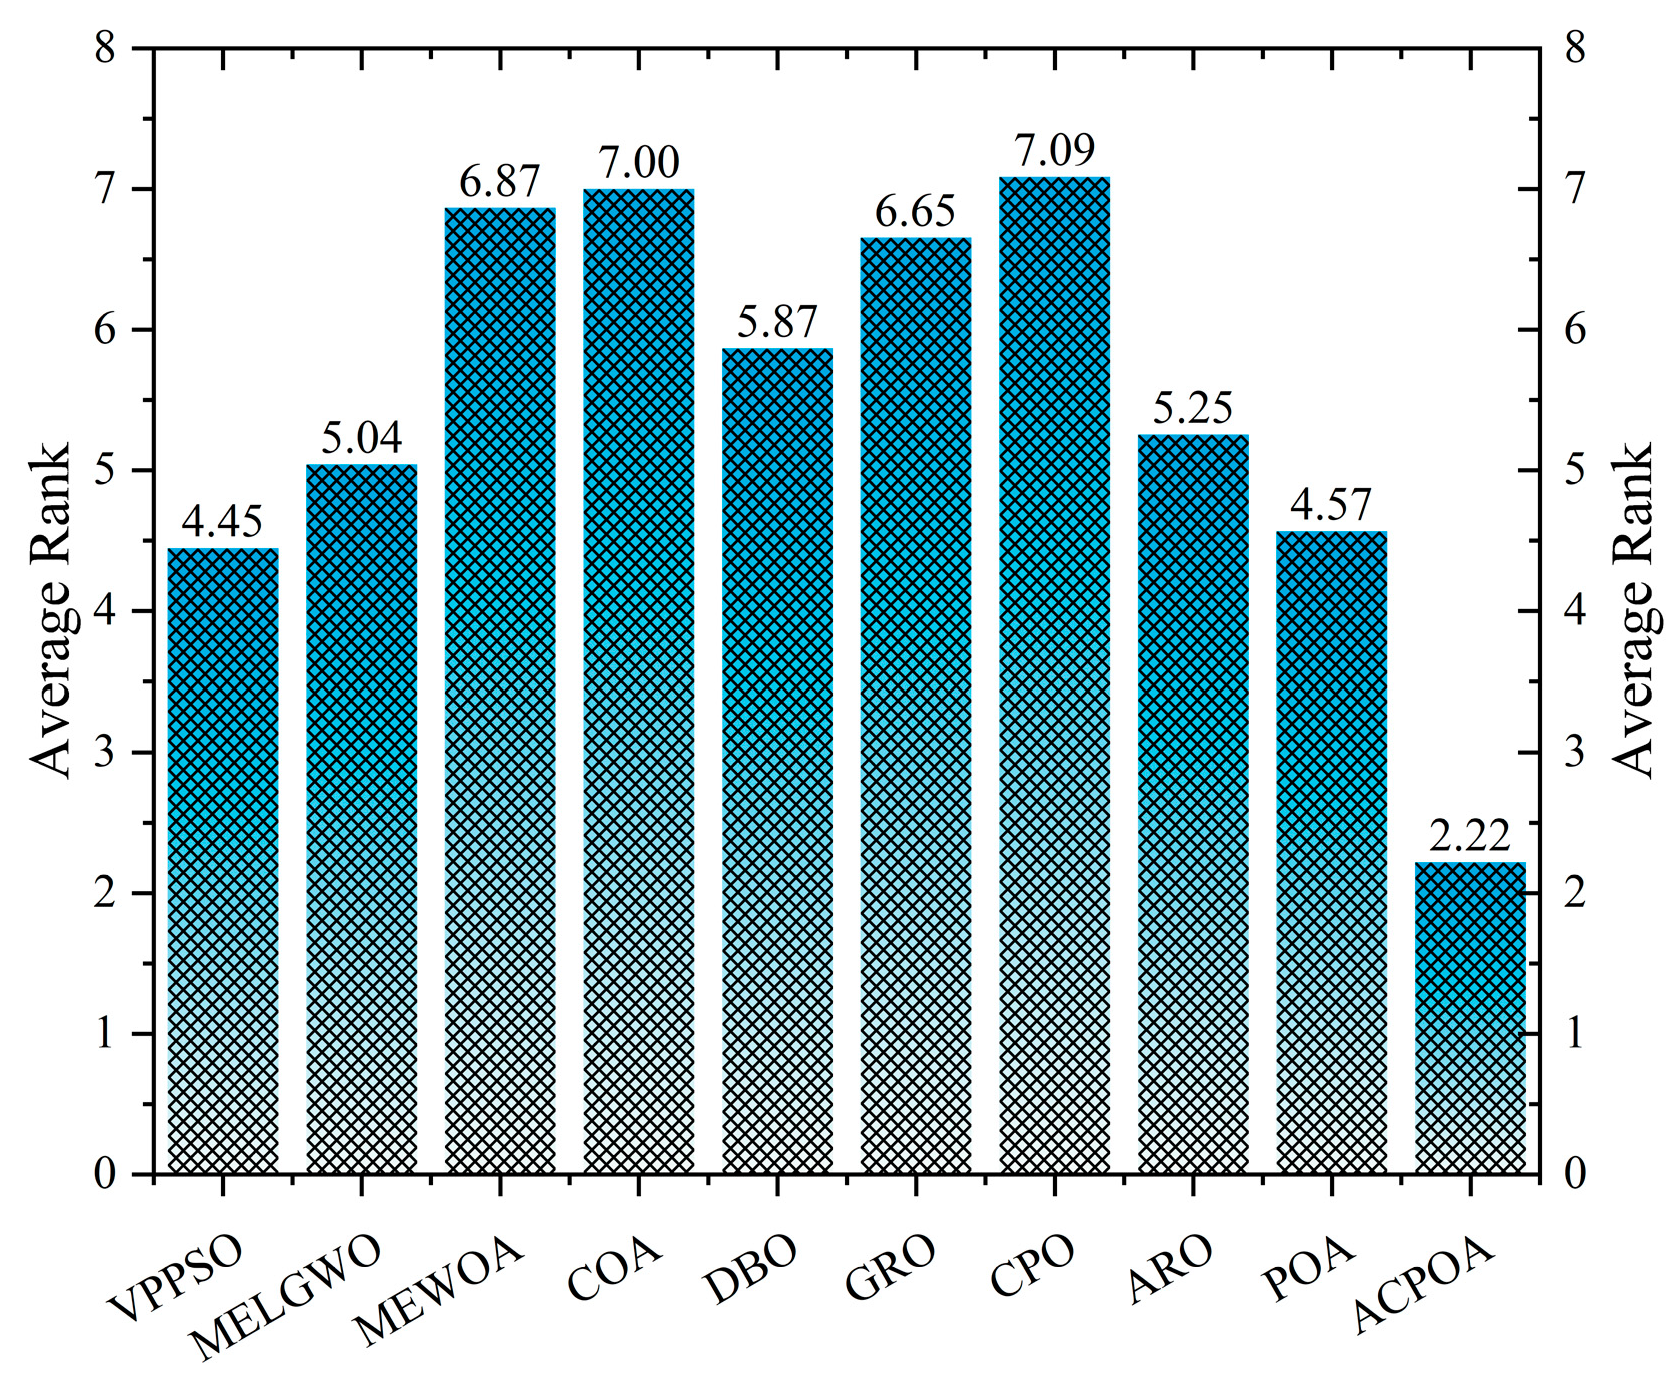
| Average rank | 4.45 | 5.04 | 6.87 | 7.00 | 5.87 | 6.65 | 7.09 | 5.25 | 4.57 | 2.22 | ||
| Rank | 2 | 4 | 8 | 9 | 6 | 7 | 10 | 5 | 3 | 1 | ||
| Image | Threshold | Metric | VPPSO | MELGWO | MEWOA | COA | DBO | GRO | CPO | ARO | POA | ACPOA |
|---|---|---|---|---|---|---|---|---|---|---|---|---|
| baboon | 2 | Mean | 0.6871 | 0.6869 | 0.6864 | 0.6867 | 0.6871 | 0.6864 | 0.6863 | 0.6867 | 0.6871 | 0.6871 |
| Std | 1.11 × 10⁻⁴ | 1.30 × 10⁻³ | 3.09 × 10⁻³ | 2.25 × 10⁻³ | 2.16 × 10⁻⁴ | 3.04 × 10⁻³ | 4.35 × 10⁻³ | 1.41 × 10⁻³ | 0.00 × 100 | 0.00 × 100 | ||
| 4 | Mean | 0.8189 | 0.8200 | 0.8229 | 0.8142 | 0.8186 | 0.8169 | 0.8142 | 0.8188 | 0.8217 | 0.8233 | |
| Std | 3.86 × 10⁻³ | 4.61 × 10⁻³ | 1.08 × 10⁻² | 1.31 × 10⁻² | 7.39 × 10⁻³ | 1.30 × 10⁻² | 1.54 × 10⁻² | 9.51 × 10⁻³ | 4.46 × 10⁻³ | 1.05 × 10⁻³ | ||
| 6 | Mean | 0.8842 | 0.8798 | 0.8833 | 0.8792 | 0.8703 | 0.8799 | 0.8762 | 0.8824 | 0.8859 | 0.8861 | |
| Std | 1.22 × 10⁻² | 1.45 × 10⁻² | 2.33 × 10⁻² | 2.28 × 10⁻² | 1.88 × 10⁻² | 1.61 × 10⁻² | 2.08 × 10⁻² | 1.29 × 10⁻² | 1.11 × 10⁻² | 2.54 × 10⁻³ | ||
| 8 | Mean | 0.9113 | 0.9121 | 0.9051 | 0.9027 | 0.9071 | 0.9101 | 0.9077 | 0.9150 | 0.9158 | 0.9223 | |
| Std | 1.66 × 10⁻² | 1.65 × 10⁻² | 1.73 × 10⁻² | 2.16 × 10⁻² | 1.65 × 10⁻² | 1.82 × 10⁻² | 1.76 × 10⁻² | 1.27 × 10⁻² | 1.65 × 10⁻² | 3.85 × 10⁻³ | ||
| bank | 2 | Mean | 0.7530 | 0.7529 | 0.7529 | 0.7525 | 0.7529 | 0.7528 | 0.7529 | 0.7529 | 0.7530 | 0.7530 |
| Std | 1.13 × 10⁻¹⁶ | 9.80 × 10⁻⁴ | 1.00 × 10⁻³ | 2.09 × 10⁻³ | 1.92 × 10⁻⁴ | 5.77 × 10⁻⁴ | 1.15 × 10⁻³ | 6.41 × 10⁻⁴ | 1.13 × 10⁻¹⁶ | 1.13× 10⁻¹⁶ | ||
| 4 | Mean | 0.8344 | 0.8337 | 0.8340 | 0.8308 | 0.8342 | 0.8342 | 0.8320 | 0.8332 | 0.8343 | 0.8352 | |
| Std | 1.62 × 10⁻³ | 2.75 × 10⁻³ | 8.66 × 10⁻³ | 7.64 × 10⁻³ | 3.55 × 10⁻³ | 4.77 × 10⁻³ | 4.82 × 10⁻³ | 4.02 × 10⁻³ | 2.11 × 10⁻³ | 4.20 × 10⁻⁴ | ||
| 6 | Mean | 0.8785 | 0.8760 | 0.8717 | 0.8738 | 0.8770 | 0.8761 | 0.8736 | 0.8749 | 0.8775 | 0.8816 | |
| Std | 3.60 × 10⁻³ | 6.54 × 10⁻³ | 8.52 × 10⁻³ | 7.52 × 10⁻³ | 5.84 × 10⁻³ | 5.17 × 10⁻³ | 5.85 × 10⁻³ | 4.77 × 10⁻³ | 3.29 × 10⁻³ | 4.36 × 10⁻⁴ | ||
| 8 | Mean | 0.9017 | 0.9011 | 0.8971 | 0.8957 | 0.8989 | 0.8994 | 0.8977 | 0.9024 | 0.9035 | 0.9089 | |
| Std | 5.38 × 10⁻³ | 7.32 × 10⁻³ | 9.08 × 10⁻³ | 8.24 × 10⁻³ | 6.83 × 10⁻³ | 5.65 × 10⁻³ | 6.74 × 10⁻³ | 5.00 × 10⁻³ | 3.96 × 10⁻³ | 2.20 × 10⁻³ | ||
| camera | 2 | Mean | 0.7662 | 0.7663 | 0.7661 | 0.7661 | 0.7662 | 0.7662 | 0.7656 | 0.7660 | 0.7661 | 0.7661 |
| Std | 5.42 × 10⁻⁴ | 4.69 × 10⁻⁴ | 2.85 × 10⁻⁴ | 8.36 × 10⁻⁴ | 2.14 × 10⁻⁴ | 7.33 × 10⁻⁴ | 1.60 × 10⁻³ | 1.09 × 10⁻³ | 0.00 × 100 | 0.00 × 100 | ||
| 4 | Mean | 0.8342 | 0.8332 | 0.8290 | 0.8307 | 0.8327 | 0.8280 | 0.8297 | 0.8317 | 0.8302 | 0.8326 | |
| Std | 5.69 × 10⁻³ | 8.65 × 10⁻³ | 9.18 × 10⁻³ | 9.55 × 10⁻³ | 7.27 × 10⁻³ | 9.30 × 10⁻³ | 8.87 × 10⁻³ | 8.28 × 10⁻³ | 6.16 × 10⁻³ | 8.65 × 10⁻⁴ | ||
| 6 | Mean | 0.8697 | 0.8654 | 0.8629 | 0.8628 | 0.8667 | 0.8625 | 0.8663 | 0.8677 | 0.8718 | 0.8781 | |
| Std | 8.02 × 10⁻³ | 1.24 × 10⁻² | 1.12 × 10⁻² | 9.41 × 10⁻³ | 1.00 × 10⁻² | 1.19 × 10⁻² | 1.13 × 10⁻² | 9.31 × 10⁻³ | 7.72 × 10⁻³ | 1.12 × 10⁻³ | ||
| 8 | Mean | 0.8932 | 0.8929 | 0.8844 | 0.8835 | 0.8879 | 0.8898 | 0.8879 | 0.8906 | 0.8920 | 0.9016 | |
| Std | 8.31 × 10⁻³ | 1.02 × 10⁻² | 1.51 × 10⁻² | 1.05 × 10⁻² | 1.02 × 10⁻² | 9.53 × 10⁻³ | 1.02 × 10⁻² | 1.10 × 10⁻² | 8.85 × 10⁻³ | 2.47 × 10⁻³ | ||
| face | 2 | Mean | 0.6045 | 0.6048 | 0.6049 | 0.6049 | 0.6047 | 0.6043 | 0.6042 | 0.6044 | 0.6048 | 0.6049 |
| Std | 7.08 × 10⁻⁴ | 9.85 × 10⁻⁴ | 4.26 × 10⁻⁴ | 9.39 × 10⁻⁴ | 6.80 × 10⁻⁴ | 9.15 × 10⁻⁴ | 1.49 × 10⁻³ | 1.12 × 10⁻³ | 1.74 × 10⁻⁴ | 2.26× 10⁻¹⁶ | ||
| 4 | Mean | 0.7532 | 0.7518 | 0.7486 | 0.7510 | 0.7536 | 0.7490 | 0.7471 | 0.7517 | 0.7518 | 0.7542 | |
| Std | 2.32 × 10⁻³ | 4.77 × 10⁻³ | 6.66 × 10⁻³ | 7.39 × 10⁻³ | 3.88 × 10⁻³ | 7.27 × 10⁻³ | 8.49 × 10⁻³ | 5.73 × 10⁻³ | 5.02 × 10⁻³ | 8.56 × 10⁻⁴ | ||
| 6 | Mean | 0.8384 | 0.8339 | 0.8181 | 0.8225 | 0.8273 | 0.8240 | 0.8214 | 0.8283 | 0.8358 | 0.8435 | |
| Std | 6.14 × 10⁻³ | 1.02 × 10⁻² | 1.23 × 10⁻² | 1.40 × 10⁻² | 1.47 × 10⁻² | 9.81 × 10⁻³ | 9.43 × 10⁻³ | 8.92 × 10⁻³ | 5.58 × 10⁻³ | 1.40 × 10⁻³ | ||
| 8 | Mean | 0.8819 | 0.8738 | 0.8552 | 0.8669 | 0.8655 | 0.8613 | 0.8645 | 0.8726 | 0.8779 | 0.8950 | |
| Std | 7.98 × 10⁻³ | 9.89 × 10⁻³ | 1.76 × 10⁻² | 1.46 × 10⁻² | 1.51 × 10⁻² | 9.46 × 10⁻³ | 1.11 × 10⁻² | 9.08 × 10⁻³ | 7.67 × 10⁻³ | 1.53 × 10⁻³ | ||
| lena | 2 | Mean | 0.6711 | 0.6709 | 0.6710 | 0.6692 | 0.6707 | 0.6707 | 0.6690 | 0.6703 | 0.6713 | 0.6713 |
| Std | 1.23 × 10⁻³ | 1.33 × 10⁻³ | 1.52 × 10⁻³ | 4.85 × 10⁻³ | 1.90 × 10⁻³ | 1.57 × 10⁻³ | 3.50 × 10⁻³ | 2.52 × 10⁻³ | 1.09 × 10⁻³ | 1.05 × 10⁻³ | ||
| 4 | Mean | 0.7810 | 0.7793 | 0.7752 | 0.7768 | 0.7806 | 0.7791 | 0.7782 | 0.7789 | 0.7810 | 0.7797 | |
| Std | 1.91 × 10⁻³ | 3.09 × 10⁻³ | 8.27 × 10⁻³ | 9.51 × 10⁻³ | 1.80 × 10⁻³ | 4.11 × 10⁻³ | 5.29 × 10⁻³ | 3.54 × 10⁻³ | 2.36 × 10⁻³ | 6.78 × 10⁻⁴ | ||
| 6 | Mean | 0.8414 | 0.8412 | 0.8319 | 0.8336 | 0.8358 | 0.8354 | 0.8340 | 0.8398 | 0.8439 | 0.8510 | |
| Std | 9.05 × 10⁻³ | 7.91 × 10⁻³ | 1.46 × 10⁻² | 1.38 × 10⁻² | 1.14 × 10⁻² | 8.81 × 10⁻³ | 1.03 × 10⁻² | 8.12 × 10⁻³ | 7.25 × 10⁻³ | 1.82 × 10⁻³ | ||
| 8 | Mean | 0.8706 | 0.8685 | 0.8657 | 0.8647 | 0.8681 | 0.8681 | 0.8652 | 0.8694 | 0.8741 | 0.8840 | |
| Std | 6.79 × 10⁻³ | 9.28 × 10⁻³ | 1.04 × 10⁻² | 9.02 × 10⁻³ | 1.15 × 10⁻² | 1.07 × 10⁻² | 8.96 × 10⁻³ | 8.30 × 10⁻³ | 6.64 × 10⁻³ | 2.60 × 10⁻³ | ||
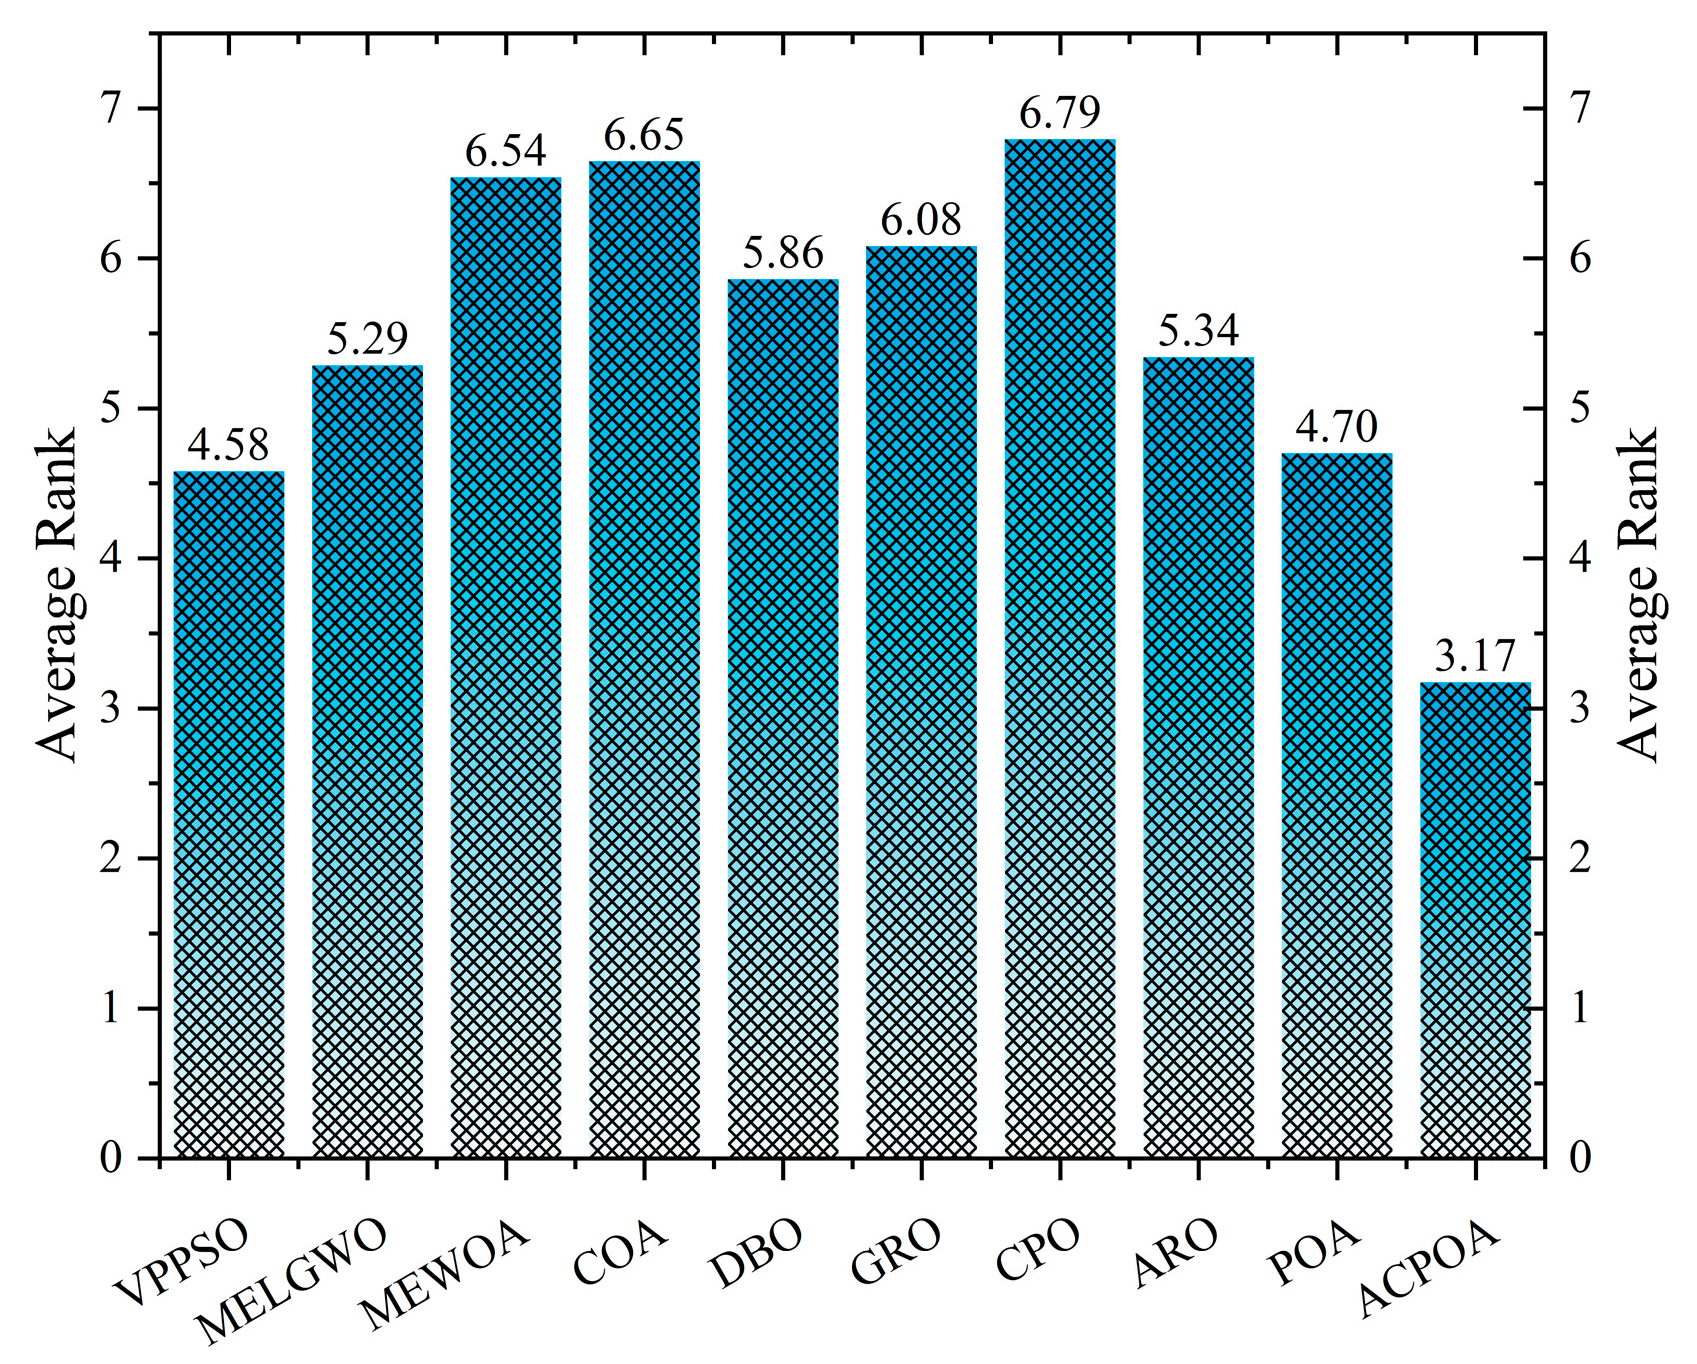
| Average rank | 4.58 | 5.29 | 6.54 | 6.65 | 5.86 | 6.08 | 6.79 | 5.34 | 4.70 | 3.17 | ||
| Rank | 2 | 4 | 8 | 9 | 6 | 7 | 10 | 5 | 3 | 1 | ||
| Image | Threshold | Metric | VPPSO | MELGWO | MEWOA | COA | DBO | GRO | CPO | ARO | POA | ACPOA |
|---|---|---|---|---|---|---|---|---|---|---|---|---|
| baboon | 2 | Mean | 0.7202 | 0.7256 | 0.7277 | 0.4679 | 0.4686 | 0.4674 | 0.4666 | 0.4689 | 0.4688 | 0.4688 |
| Std | 7.92 × 10⁻³ | 8.22 × 10⁻³ | 2.06 × 10⁻² | 4.14 × 10⁻³ | 1.01 × 10⁻³ | 3.48 × 10⁻³ | 5.66 × 10⁻³ | 2.88 × 10⁻³ | 2.85 × 10⁻¹⁶ | 2.82 × 10⁻¹⁶ | ||
| 4 | Mean | 0.7213 | 0.7171 | 0.7271 | 0.7136 | 0.7201 | 0.7185 | 0.7097 | 0.7231 | 0.7261 | 0.7239 | |
| Std | 1.27 × 10⁻² | 1.39 × 10⁻² | 1.15 × 10⁻² | 2.49 × 10⁻² | 1.51 × 10⁻² | 2.45 × 10⁻² | 2.86 × 10⁻² | 1.66 × 10⁻² | 8.40 × 10⁻³ | 1.63 × 10⁻³ | ||
| 6 | Mean | 0.8291 | 0.8238 | 0.8276 | 0.8197 | 0.8107 | 0.8236 | 0.8164 | 0.8268 | 0.8328 | 0.8352 | |
| Std | 1.73 × 10⁻² | 2.12 × 10⁻² | 3.55 × 10⁻² | 3.49 × 10⁻² | 2.99 × 10⁻² | 2.35 × 10⁻² | 3.22 × 10⁻² | 1.85 × 10⁻² | 1.68 × 10⁻² | 4.33 × 10⁻³ | ||
| 8 | Mean | 0.8727 | 0.8756 | 0.8648 | 0.8596 | 0.8662 | 0.8692 | 0.8683 | 0.8786 | 0.8794 | 0.8917 | |
| Std | 2.25 × 10⁻² | 2.05 × 10⁻² | 2.32 × 10⁻² | 3.08 × 10⁻² | 2.20 × 10⁻² | 2.37 × 10⁻² | 2.28 × 10⁻² | 1.53 × 10⁻² | 2.03 × 10⁻² | 4.40 × 10⁻³ | ||
| bank | 2 | Mean | 0.6361 | 0.6362 | 0.6366 | 0.6352 | 0.6363 | 0.6361 | 0.6356 | 0.6363 | 0.6364 | 0.6364 |
| Std | 4.52 × 10⁻⁴ | 5.94 × 10⁻⁴ | 1.29 × 10⁻³ | 4.17 × 10⁻³ | 2.14 × 10⁻⁴ | 1.38 × 10⁻³ | 2.56 × 10⁻³ | 1.06 × 10⁻³ | 0.00 × 100 | 0.00 × 100 | ||
| 4 | Mean | 0.7428 | 0.7415 | 0.7441 | 0.7402 | 0.7433 | 0.7462 | 0.7421 | 0.7422 | 0.7434 | 0.7453 | |
| Std | 3.58 × 10⁻³ | 5.22 × 10⁻³ | 1.27 × 10⁻² | 1.22 × 10⁻² | 6.60 × 10⁻³ | 8.64 × 10⁻³ | 8.81 × 10⁻³ | 7.24 × 10⁻³ | 3.65 × 10⁻³ | 4.46 × 10⁻⁴ | ||
| 6 | Mean | 0.8105 | 0.8074 | 0.8040 | 0.8066 | 0.8091 | 0.8089 | 0.8041 | 0.8044 | 0.8103 | 0.8152 | |
| Std | 8.60 × 10⁻³ | 1.06 × 10⁻² | 1.37 × 10⁻² | 1.41 × 10⁻² | 1.15 × 10⁻² | 1.13 × 10⁻² | 1.25 × 10⁻² | 9.54 × 10⁻³ | 7.16 × 10⁻³ | 1.44 × 10⁻³ | ||
| 8 | Mean | 0.8436 | 0.8457 | 0.8413 | 0.8368 | 0.8432 | 0.8438 | 0.8404 | 0.8467 | 0.8493 | 0.8556 | |
| Std | 9.99 × 10⁻³ | 1.05 × 10⁻² | 1.46 × 10⁻² | 1.14 × 10⁻² | 1.07 × 10⁻² | 1.00 × 10⁻² | 1.29 × 10⁻² | 7.47 × 10⁻³ | 5.74 × 10⁻³ | 3.02 × 10⁻³ | ||
| camera | 2 | Mean | 0.6364 | 0.6363 | 0.6359 | 0.6195 | 0.6203 | 0.6198 | 0.6197 | 0.6198 | 0.6204 | 0.6404 |
| Std | 1.13× 10⁻¹⁶ | 1.06 × 10⁻³ | 1.82 × 10⁻³ | 2.83 × 10⁻³ | 3.32 × 10⁻⁴ | 6.50 × 10⁻⁴ | 1.01 × 10⁻³ | 7.13 × 10⁻⁴ | 1.13× 10⁻¹⁶ | 0.00 × 100 | ||
| 4 | Mean | 0.7137 | 0.6917 | 0.6947 | 0.6995 | 0.6948 | 0.7056 | 0.6965 | 0.7087 | 0.7445 | 0.7583 | |
| Std | 3.60 × 10⁻² | 2.74 × 10⁻² | 4.70 × 10⁻² | 4.17 × 10⁻² | 3.87 × 10⁻² | 3.54 × 10⁻² | 4.65 × 10⁻² | 3.85 × 10⁻² | 2.30 × 10⁻² | 2.48 × 10⁻³ | ||
| 6 | Mean | 0.7803 | 0.7787 | 0.7641 | 0.7610 | 0.7826 | 0.7737 | 0.7784 | 0.7841 | 0.7948 | 0.8036 | |
| Std | 2.71 × 10⁻² | 2.89 × 10⁻² | 4.07 × 10⁻² | 4.24 × 10⁻² | 3.13 × 10⁻² | 3.57 × 10⁻² | 4.02 × 10⁻² | 2.97 × 10⁻² | 2.06 × 10⁻² | 2.41 × 10⁻³ | ||
| 8 | Mean | 0.8201 | 0.8181 | 0.8119 | 0.8131 | 0.8088 | 0.8182 | 0.8145 | 0.8193 | 0.8191 | 0.8300 | |
| Std | 1.81 × 10⁻² | 2.42 × 10⁻² | 3.55 × 10⁻² | 3.09 × 10⁻² | 3.26 × 10⁻² | 2.52 × 10⁻² | 3.27 × 10⁻² | 3.08 × 10⁻² | 2.39 × 10⁻² | 4.78 × 10⁻³ | ||
| face | 2 | Mean | 0.5228 | 0.5231 | 0.5238 | 0.5236 | 0.5233 | 0.5226 | 0.5225 | 0.5227 | 0.5237 | 0.5238 |
| Std | 1.56 × 10⁻³ | 2.42 × 10⁻³ | 9.58 × 10⁻⁴ | 2.58 × 10⁻³ | 1.44 × 10⁻³ | 2.19 × 10⁻³ | 3.49 × 10⁻³ | 2.40 × 10⁻³ | 4.43 × 10⁻⁴ | 2.26 × 10⁻¹⁶ | ||
| 4 | Mean | 0.7050 | 0.7046 | 0.7006 | 0.7046 | 0.7071 | 0.7006 | 0.6984 | 0.7045 | 0.7031 | 0.7074 | |
| Std | 4.39 × 10⁻³ | 9.13 × 10⁻³ | 9.47 × 10⁻³ | 1.11 × 10⁻² | 8.23 × 10⁻³ | 1.36 × 10⁻² | 1.62 × 10⁻² | 1.10 × 10⁻² | 9.48 × 10⁻³ | 1.59 × 10⁻³ | ||
| 6 | Mean | 0.7952 | 0.7908 | 0.7763 | 0.7816 | 0.7859 | 0.7810 | 0.7800 | 0.7842 | 0.7923 | 0.7999 | |
| Std | 6.61 × 10⁻³ | 1.12 × 10⁻² | 1.32 × 10⁻² | 1.68 × 10⁻² | 1.42 × 10⁻² | 1.22 × 10⁻² | 1.30 × 10⁻² | 1.23 × 10⁻² | 6.52 × 10⁻³ | 1.91 × 10⁻³ | ||
| 8 | Mean | 0.8449 | 0.8386 | 0.8172 | 0.8307 | 0.8294 | 0.8236 | 0.8272 | 0.8359 | 0.8416 | 0.8576 | |
| Std | 8.22 × 10⁻³ | 1.08 × 10⁻² | 1.93 × 10⁻² | 1.55 × 10⁻² | 1.60 × 10⁻² | 1.09 × 10⁻² | 1.47 × 10⁻² | 1.13 × 10⁻² | 9.32 × 10⁻³ | 2.57 × 10⁻³ | ||
| lena | 2 | Mean | 0.5452 | 0.5443 | 0.5449 | 0.5412 | 0.5447 | 0.5443 | 0.5406 | 0.5434 | 0.5455 | 0.5456 |
| Std | 2.58 × 10⁻³ | 3.19 × 10⁻³ | 3.30 × 10⁻³ | 8.93 × 10⁻³ | 3.45 × 10⁻³ | 2.96 × 10⁻³ | 6.38 × 10⁻³ | 4.58 × 10⁻³ | 2.24 × 10⁻³ | 2.17 × 10⁻³ | ||
| 4 | Mean | 0.6756 | 0.6745 | 0.6727 | 0.6725 | 0.6752 | 0.6741 | 0.6744 | 0.6737 | 0.6754 | 0.6756 | |
| Std | 1.39 × 10⁻³ | 3.63 × 10⁻³ | 8.96 × 10⁻³ | 1.07 × 10⁻² | 2.25 × 10⁻³ | 4.73 × 10⁻³ | 6.48 × 10⁻³ | 4.47 × 10⁻³ | 1.62 × 10⁻³ | 7.13 × 10⁻⁴ | ||
| 6 | Mean | 0.7468 | 0.7484 | 0.7409 | 0.7414 | 0.7426 | 0.7462 | 0.7398 | 0.7500 | 0.7535 | 0.7596 | |
| Std | 1.23 × 10⁻² | 1.25 × 10⁻² | 2.29 × 10⁻² | 2.19 × 10⁻² | 1.75 × 10⁻² | 1.56 × 10⁻² | 1.49 × 10⁻² | 1.24 × 10⁻² | 1.00 × 10⁻² | 3.15 × 10⁻³ | ||
| 8 | Mean | 0.7860 | 0.7898 | 0.7914 | 0.7843 | 0.7871 | 0.7911 | 0.7896 | 0.7958 | 0.7936 | 0.8103 | |
| Std | 1.24 × 10⁻² | 1.82 × 10⁻² | 2.29 × 10⁻² | 1.76 × 10⁻² | 2.06 × 10⁻² | 1.98 × 10⁻² | 2.17 × 10⁻² | 1.91 × 10⁻² | 1.48 × 10⁻² | 8.58 × 10⁻³ | ||
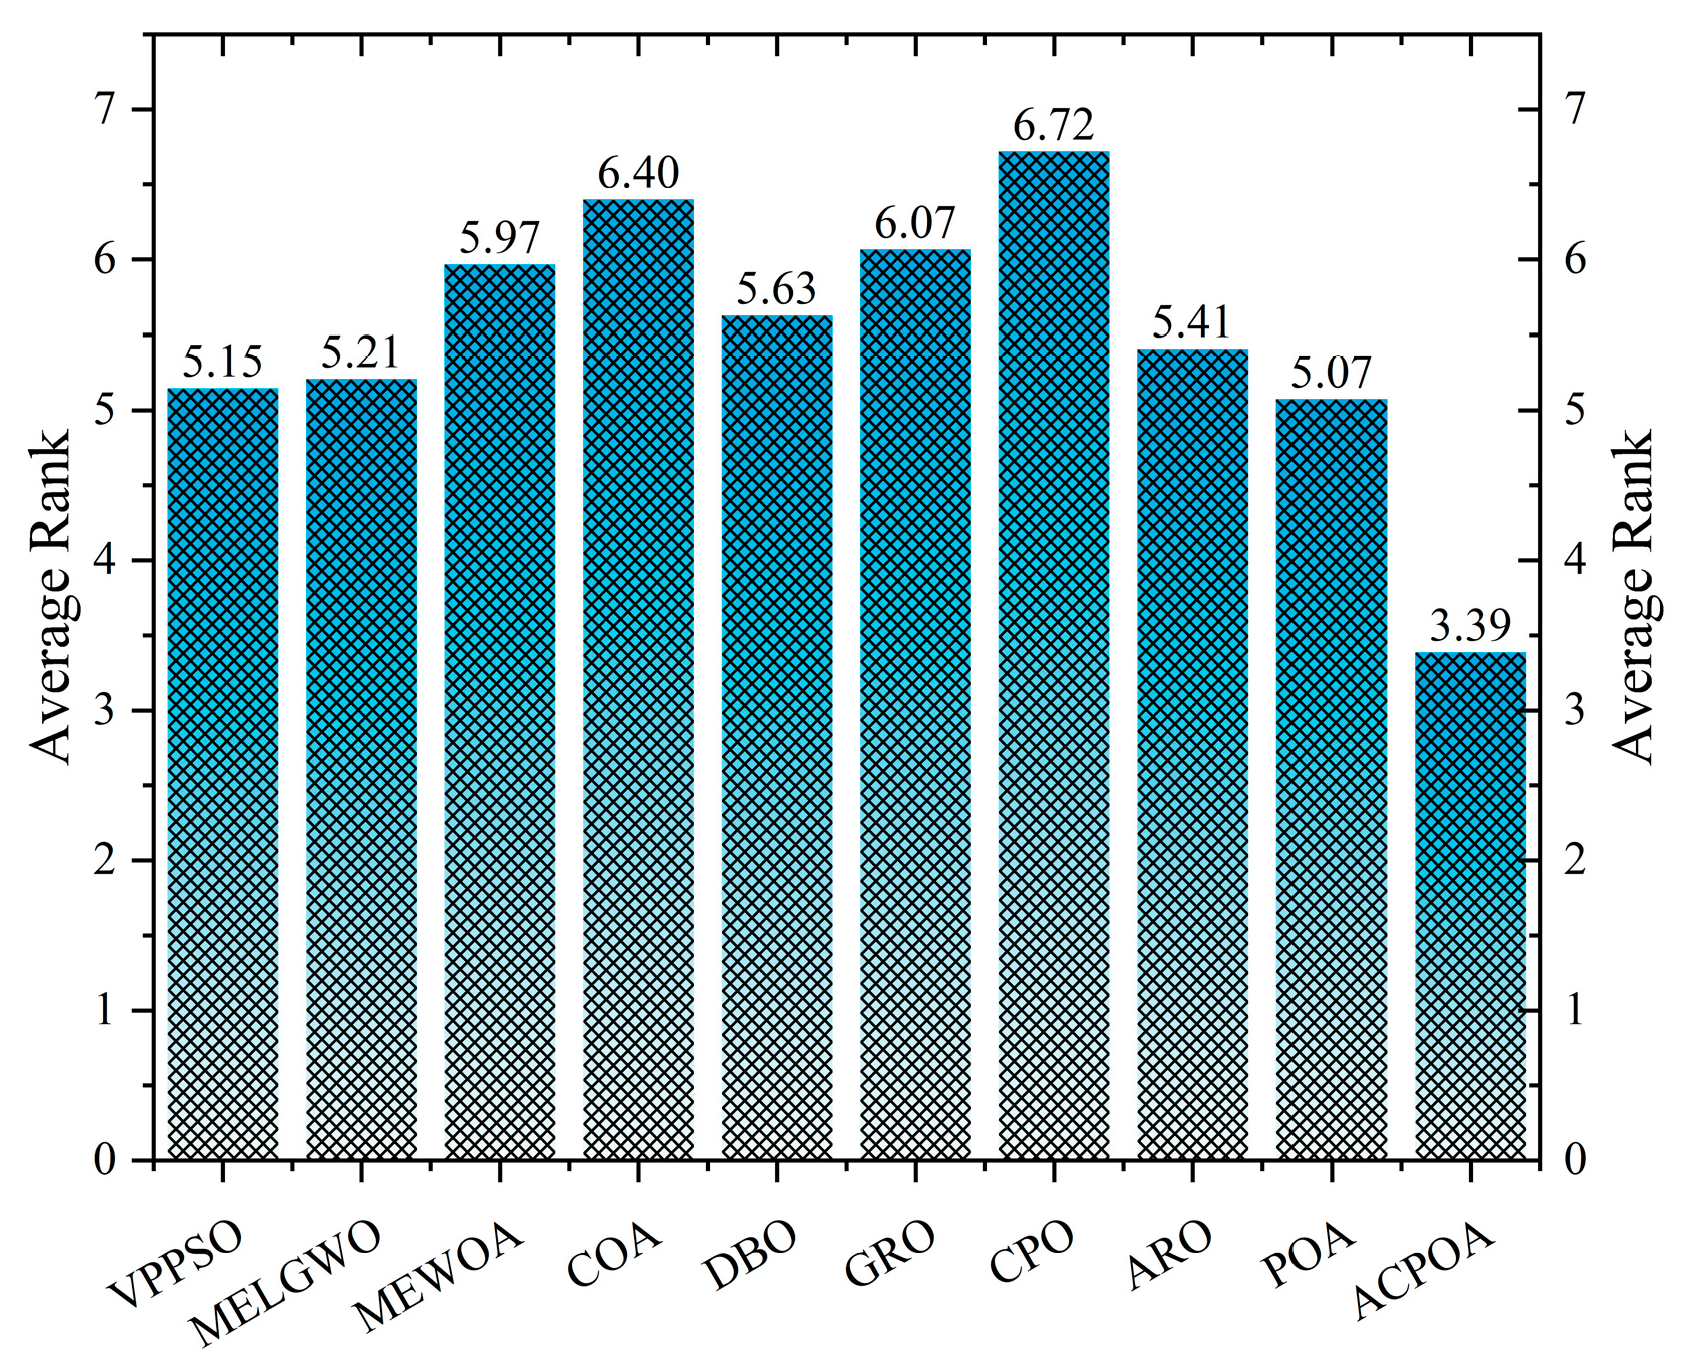
| Average rank | 5.15 | 5.21 | 5.97 | 6.40 | 5.63 | 6.07 | 6.72 | 5.41 | 5.07 | 3.39 | ||
| Rank | 3 | 4 | 7 | 9 | 6 | 8 | 10 | 5 | 2 | 1 | ||
Disclaimer/Publisher’s Note: The statements, opinions and data contained in all publications are solely those of the individual author(s) and contributor(s) and not of MDPI and/or the editor(s). MDPI and/or the editor(s) disclaim responsibility for any injury to people or property resulting from any ideas, methods, instructions or products referred to in the content. |
© 2025 by the authors. Licensee MDPI, Basel, Switzerland. This article is an open access article distributed under the terms and conditions of the Creative Commons Attribution (CC BY) license (https://creativecommons.org/licenses/by/4.0/).
Share and Cite
Zhang, Y.; Wang, J.; Zhang, X.; Wang, B. ACPOA: An Adaptive Cooperative Pelican Optimization Algorithm for Global Optimization and Multilevel Thresholding Image Segmentation. Biomimetics 2025, 10, 596. https://doi.org/10.3390/biomimetics10090596
Zhang Y, Wang J, Zhang X, Wang B. ACPOA: An Adaptive Cooperative Pelican Optimization Algorithm for Global Optimization and Multilevel Thresholding Image Segmentation. Biomimetics. 2025; 10(9):596. https://doi.org/10.3390/biomimetics10090596
Chicago/Turabian StyleZhang, YuLong, Jianfeng Wang, Xiaoyan Zhang, and Bin Wang. 2025. "ACPOA: An Adaptive Cooperative Pelican Optimization Algorithm for Global Optimization and Multilevel Thresholding Image Segmentation" Biomimetics 10, no. 9: 596. https://doi.org/10.3390/biomimetics10090596
APA StyleZhang, Y., Wang, J., Zhang, X., & Wang, B. (2025). ACPOA: An Adaptive Cooperative Pelican Optimization Algorithm for Global Optimization and Multilevel Thresholding Image Segmentation. Biomimetics, 10(9), 596. https://doi.org/10.3390/biomimetics10090596


