
Multi-Feature Facial Complexion Classification Algorithms Based on CNN


Abstract
1. Introduction
- (1)
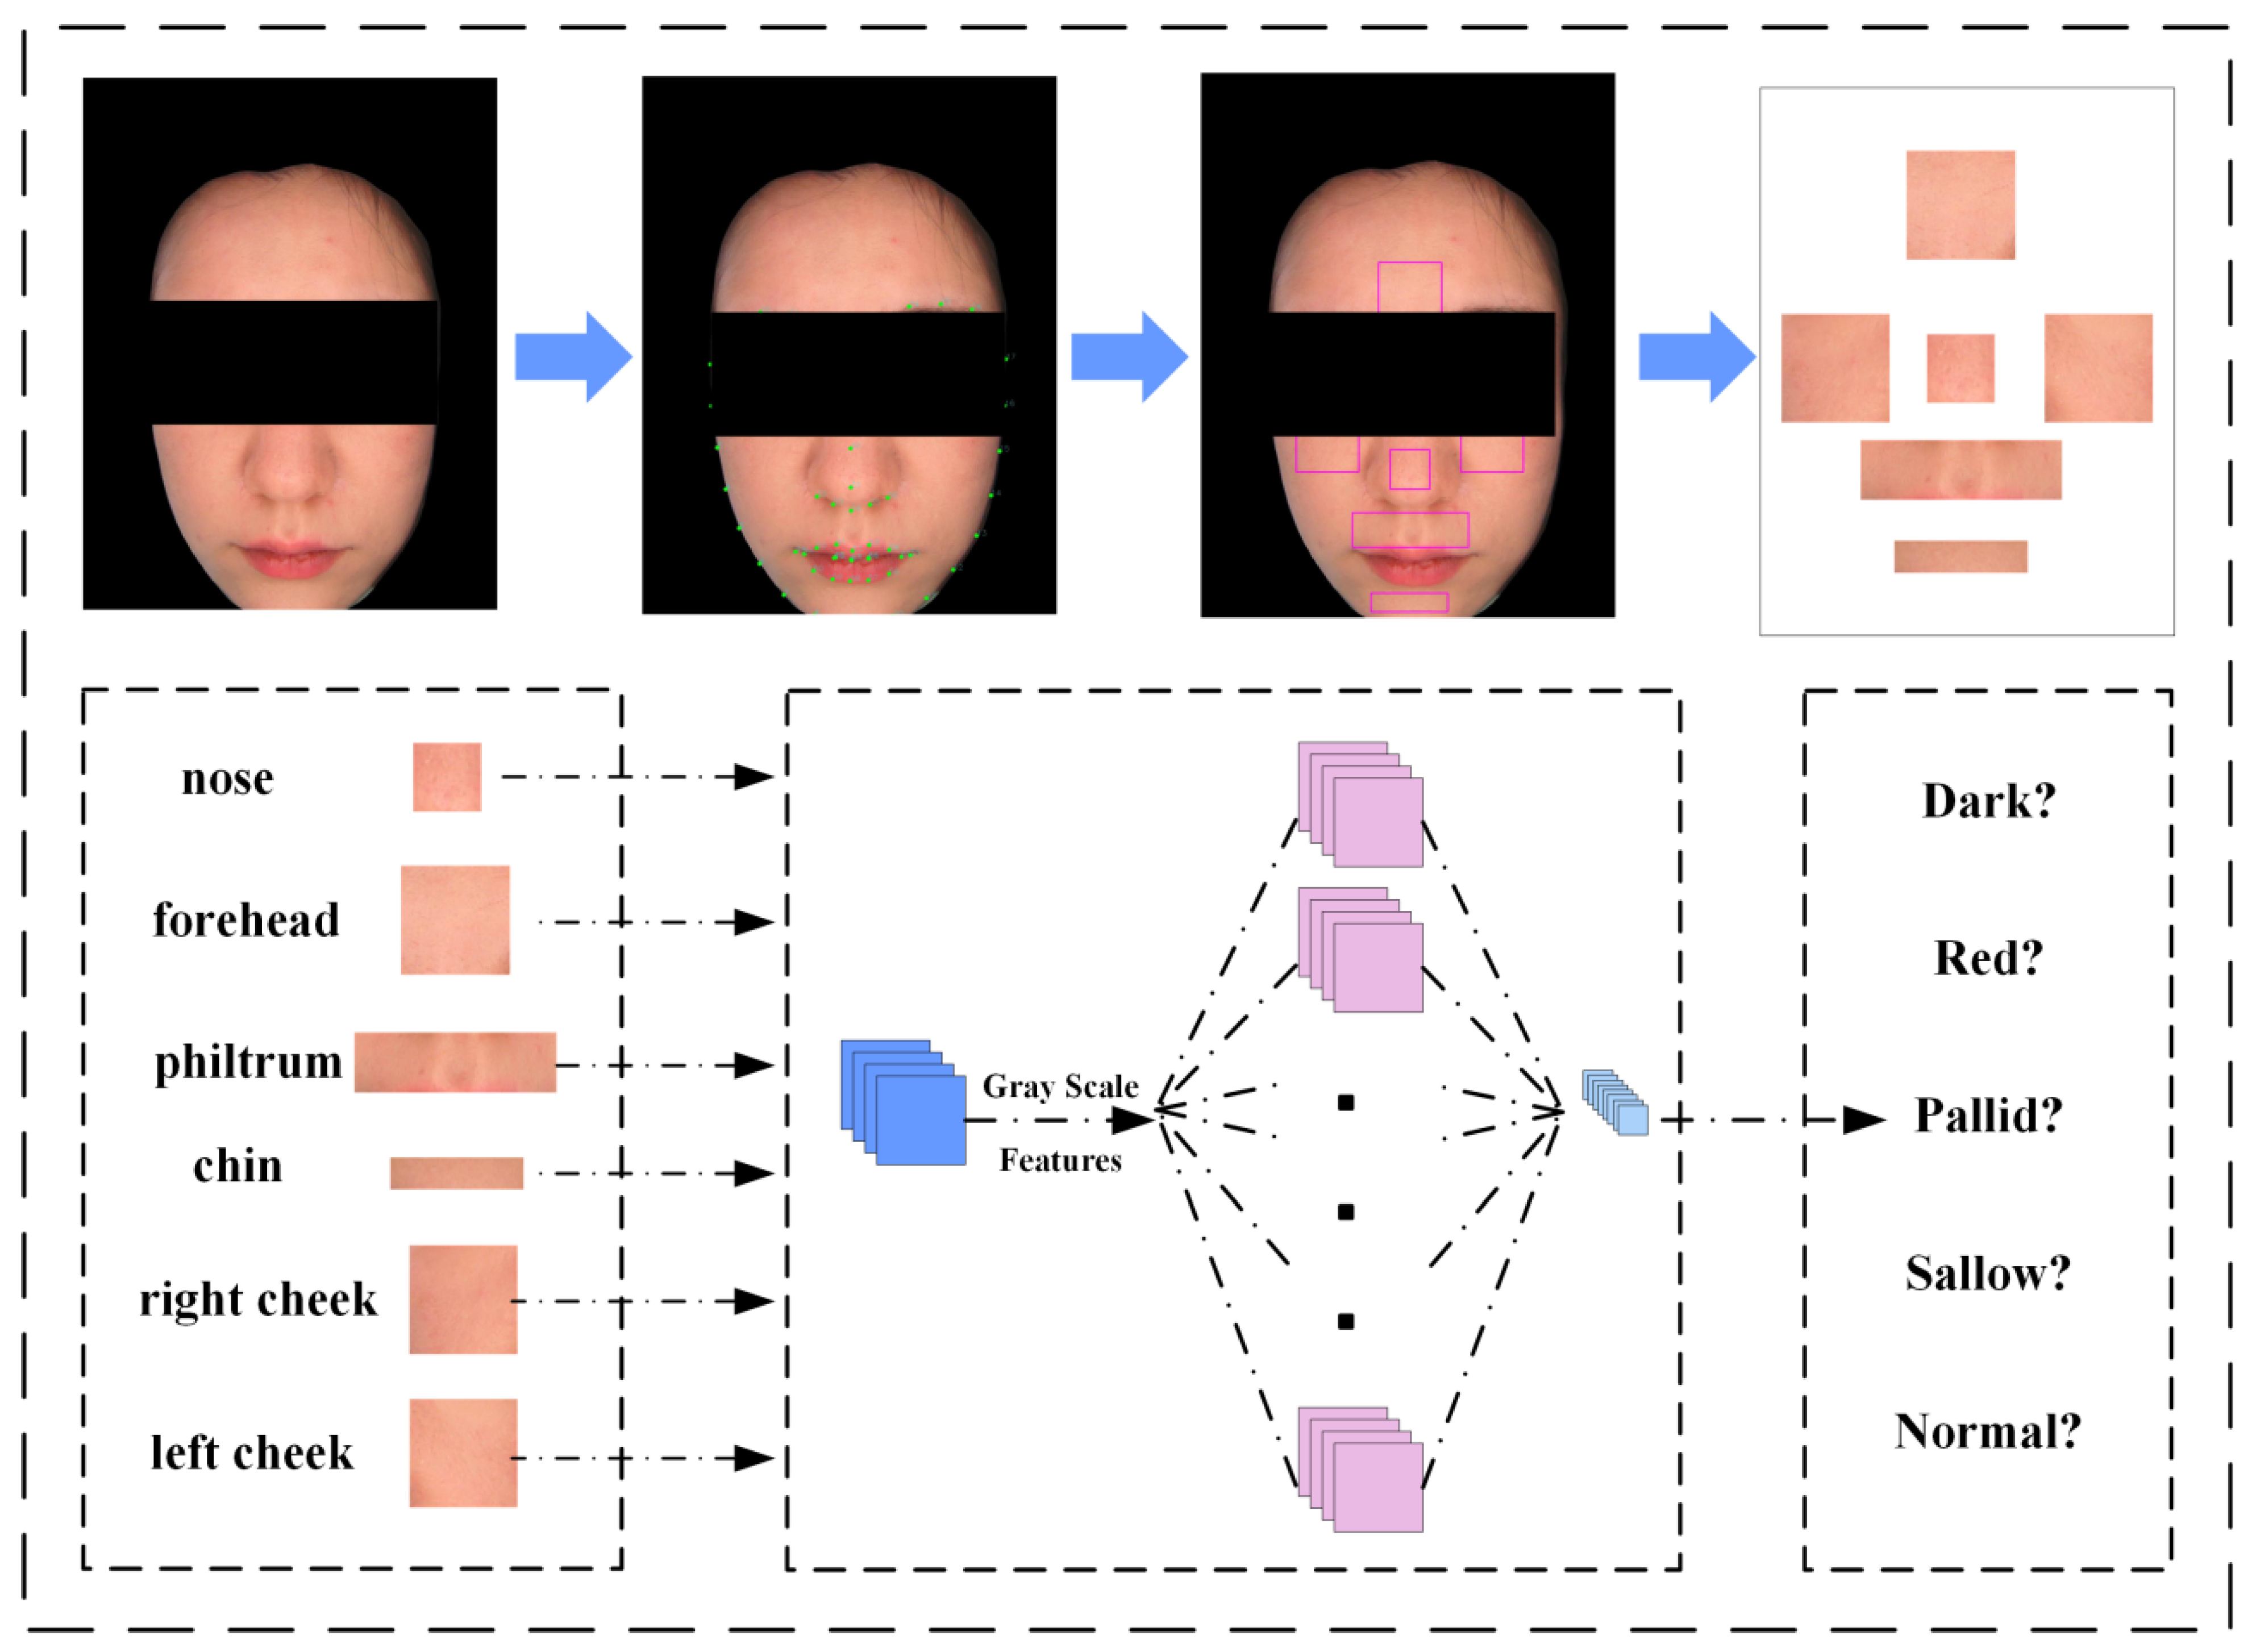
- We leverage the Dlib library to extract facial keypoints and partition them into six distinct regions of interest (ROI), which is analogous to how traditional Chinese medicine conducts a diagnosis by evaluating multiple local facial features. This concept is also reflected in the holographic mapping phenomenon observed in biological systems [25].
- (2)
- Deep learning algorithms are trained by integrating various visual cues, much like how biological neural networks process multimodal sensory inputs [26]. Therefore, we apply convolutional neural networks to extract features for each ROI.
- (3)
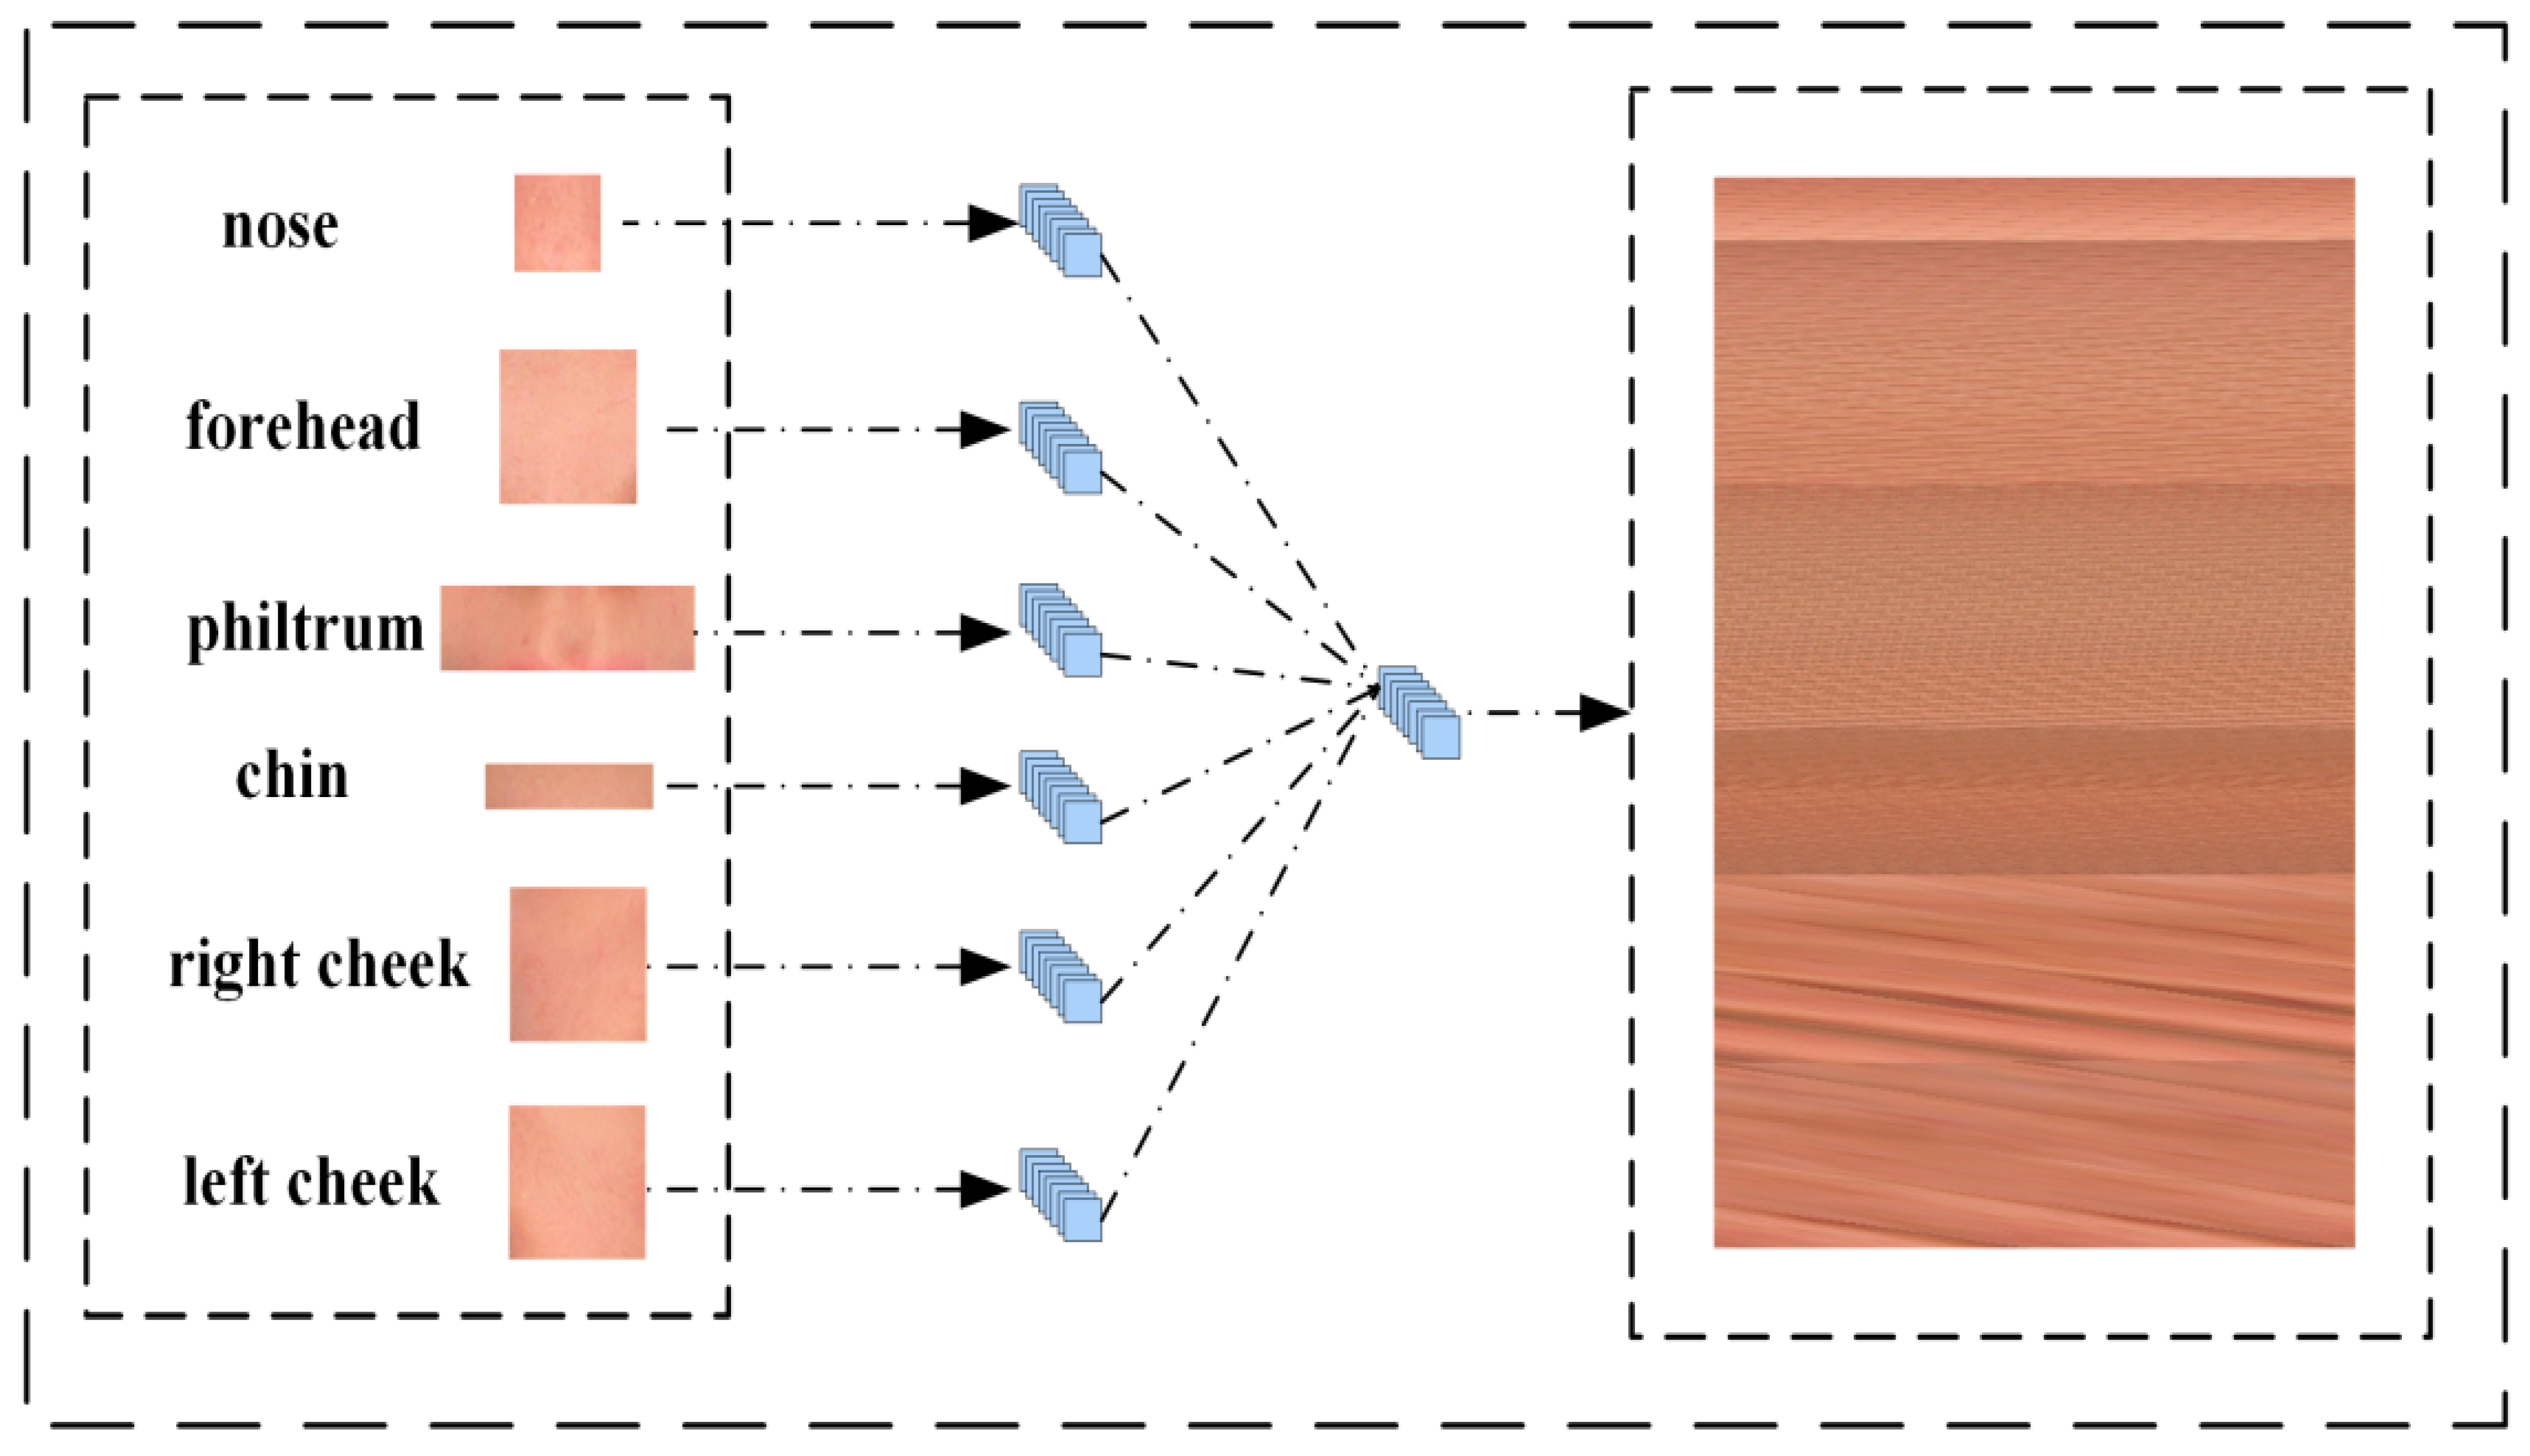
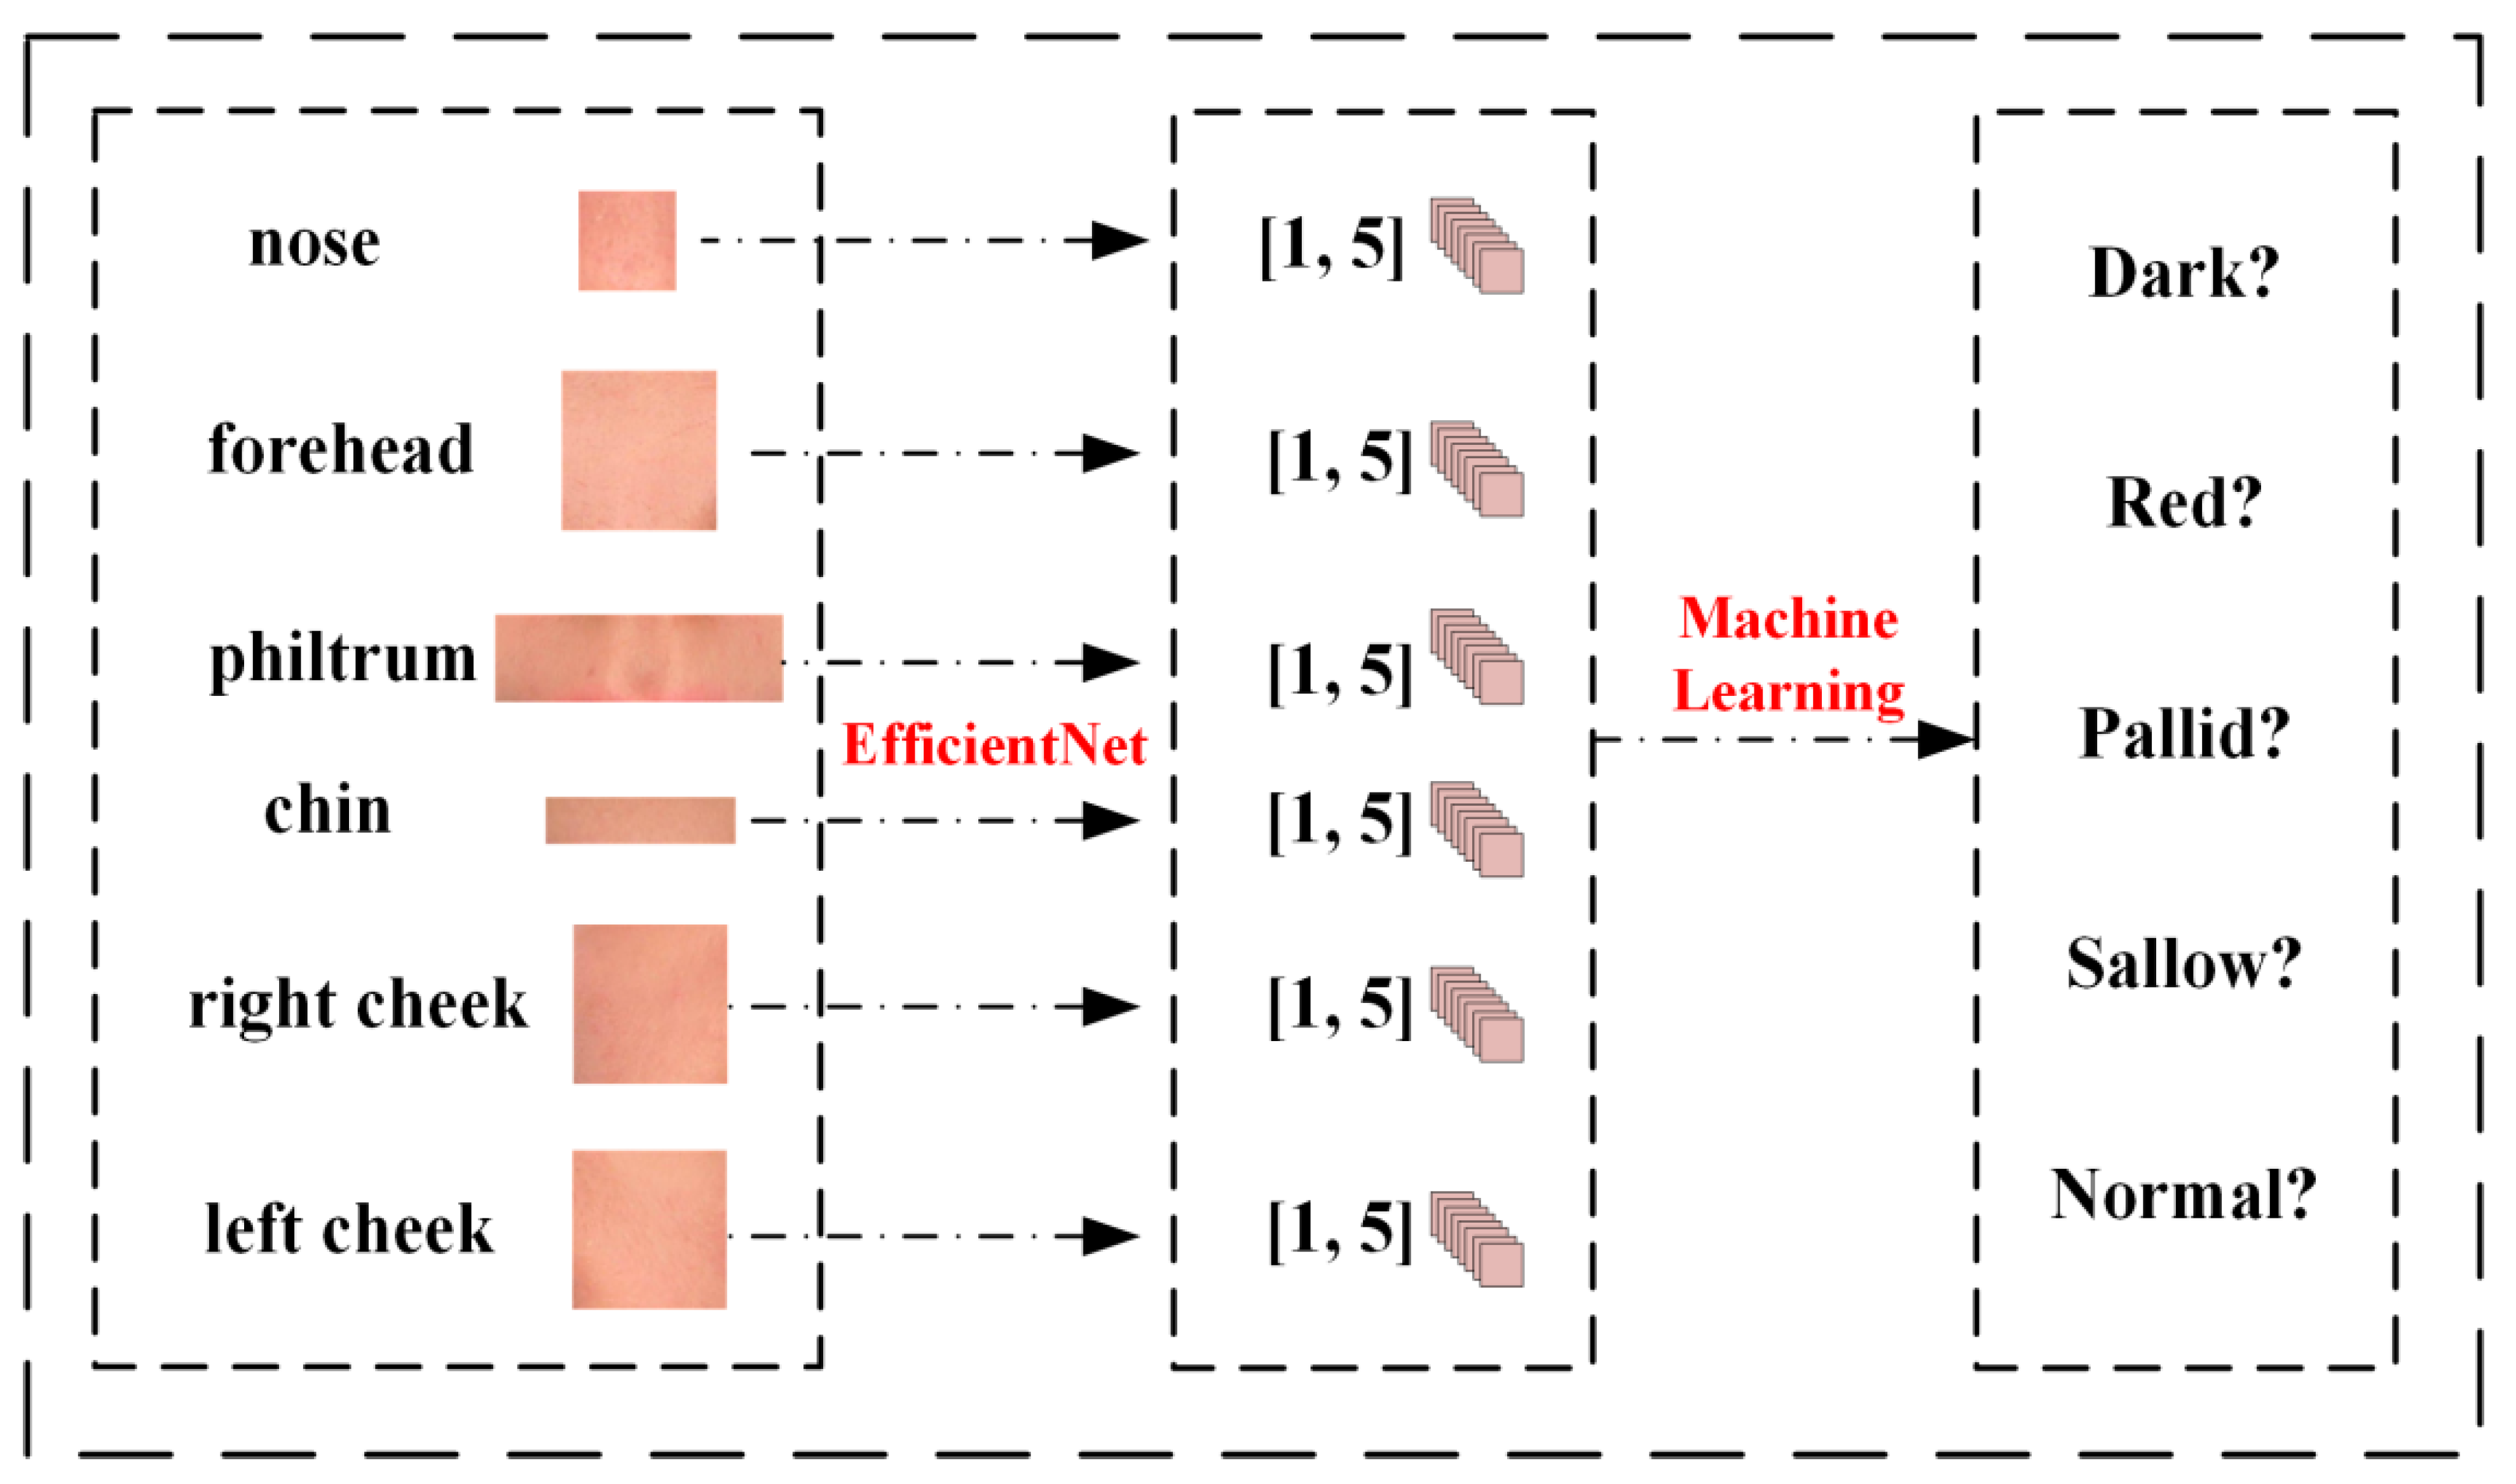
- We proposed three facial complexion classification algorithms that have never been developed by others. The multi-feature fusion algorithm integrates diverse features into channels and incorporates grayscale information that reflects the multimodal information integration properties of the biological visual system. The multi-feature splicing algorithm splices the different ROI sections together for training, while the multi-feature machine learning classification algorithm employs a hybrid approach of deep learning and machine learning for classification.
2. Method Overview
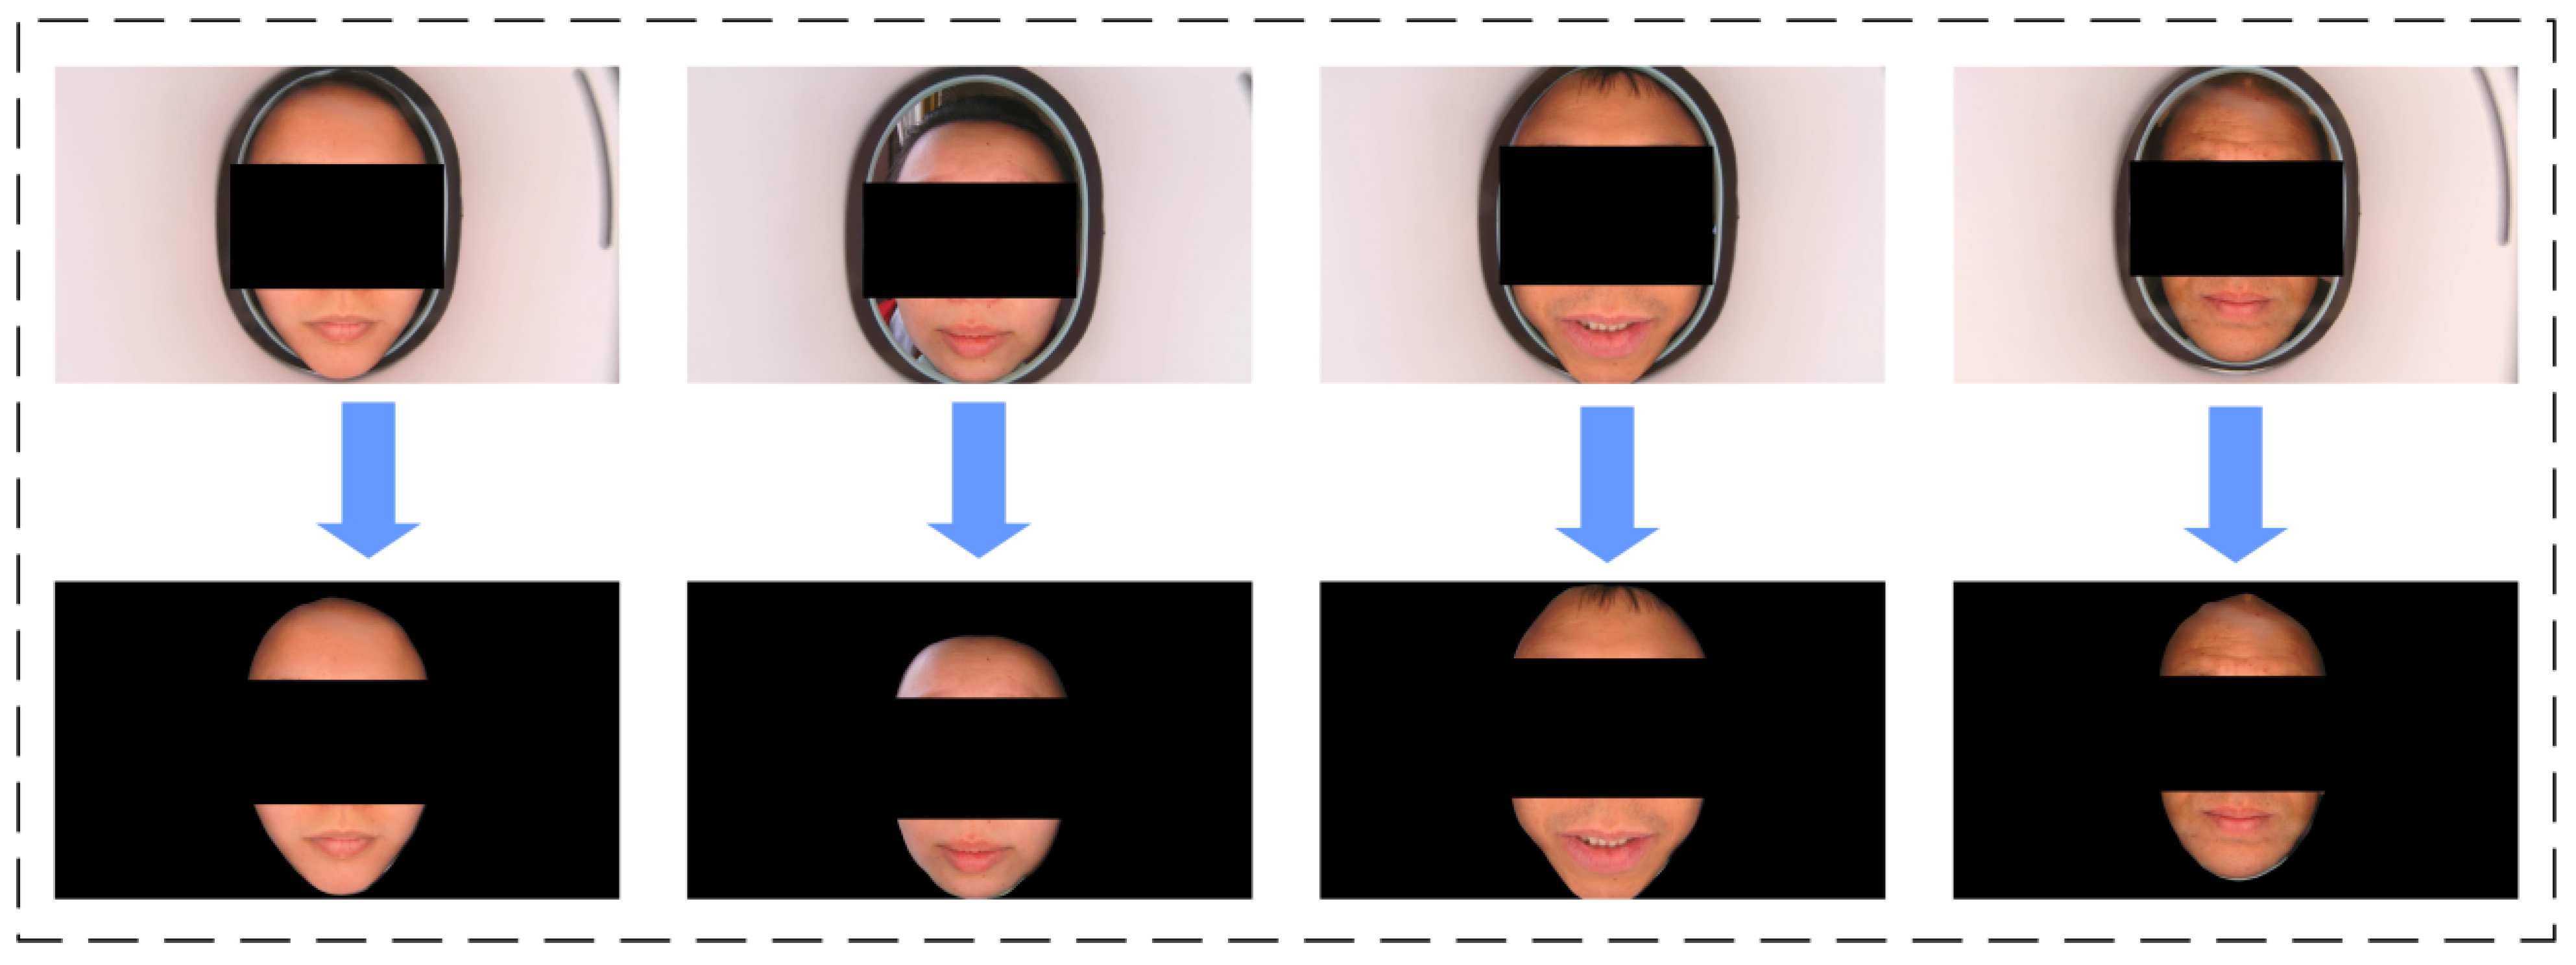
2.1. Dataset
2.2. Method
2.2.1. Multi-Feature Fusion Classification Algorithm
2.2.2. Multi-Feature Splicing Classification Algorithm
2.2.3. Multi-Feature Classification Algorithms with Machine Learning
2.3. Evaluation Indicators
3. Experimental Results
3.1. Results of Multi-Feature Fusion Classification Algorithm
3.2. Comparison of Different Algorithms and Ablation Experiments
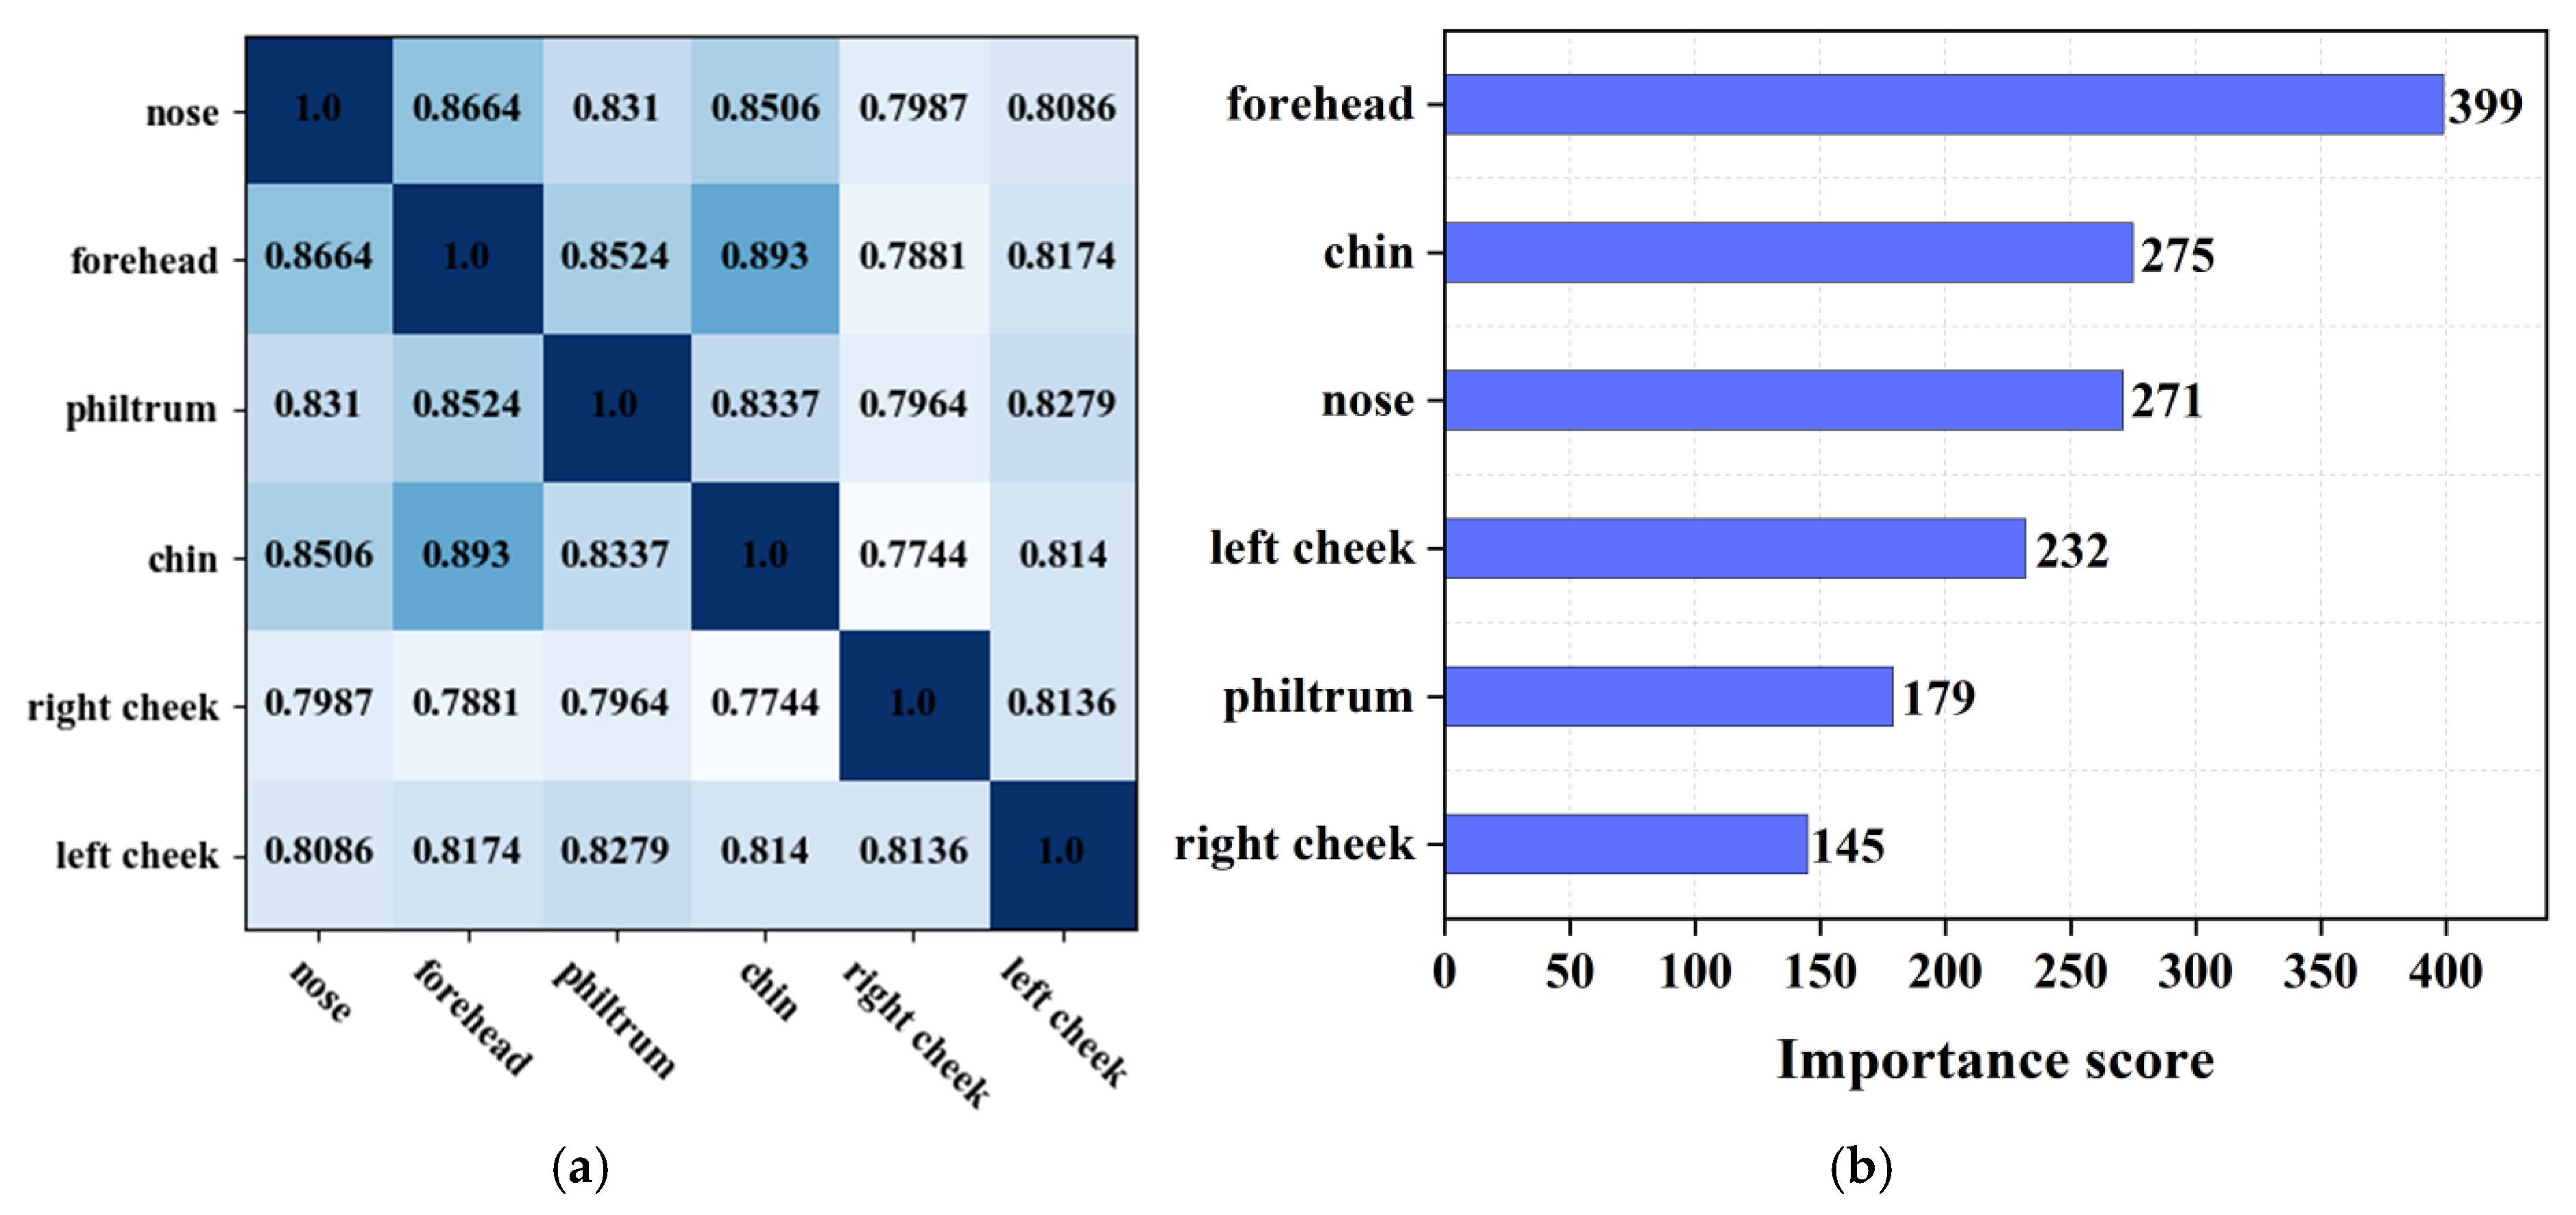
3.3. Correlation and Importance Analysis
4. Conclusions
Author Contributions
Funding
Institutional Review Board Statement
Informed Consent Statement
Data Availability Statement
Conflicts of Interest
References
- Jin, B.; Cruz, L.; Gonçalves, N. Deep facial diagnosis: Deep transfer learning from face recognition to facial diagnosis. IEEE Access 2020, 8, 123649–123661. [Google Scholar] [CrossRef]
- Chen, W.; Xu, D.; Xu, L.; Xu, G.; Guo, Y.; Tian, D.; Yao, Y. A review of traditional Chinese medicine diagnosis using machine learning: Inspection, auscultation-olfaction, inquiry, and palpation. Comput. Biol. Med. 2024, 170, 108074. [Google Scholar]
- Wang, X.; Yang, Z.; Zhang, B.; Karray, F.; Zhang, D. Computerized facial diagnosis using both color and texture features. Inf. Sci. 2013, 221, 49–59. [Google Scholar]
- Jose, J.P.; Kumar, K.M.; Poornima, P.A. A Novel Method for Color Face Recognition Using KNN Classifier. In Proceedings of the 2012 International Conference on Computing, Communication and Applications, Dindigul, India, 22–24 February 2012. [Google Scholar]
- Yuncong, Y.; Jing, Z.; Li, Z.; Mengmeng, D. Face region segmention applying in face diagnosis of traditional Chinese medicine. Meas. Control Technol. 2012, 31, 25–28. [Google Scholar]
- Yang, Y.; Zhuo, L.; Cao, Y.; Zhang, J. Human facial complexion recognition of traditional Chinese medicine based on uniform color space. Int. J. Pattern Recognit. Artif. Intell. 2014, 28, 1450008. [Google Scholar]
- Zhao, C.; Li, F.; Liu, C.; Wang, Z.; Liu, G. Qualitative and quantitative analysis for facial complexion in traditional Chinese medicine. BioMed. Res. Int. 2014, 2014, 207589. [Google Scholar] [CrossRef] [PubMed]
- JMAL, M.; Mseddi, W.S.; Attia, R.; Youssef, A. Classification of Human Skin Color and Its Application to Face Recognition. In Proceedings of the MMEDIA 2014: The Sixth International Conference on Advances in Multimedia, IARIA, Nice, France, 23–27 February 2014. [Google Scholar]
- Fufeng, L.; Dan, D.; Xiaoqiang, L.; Yiqin, W.; Peng, Q.; Xiaoyan, Z. Facial Complexion Acquisition and Recognition System for Clinical Diagnosis in Traditional Chinese Medicine. In Proceedings of the 2009 International Joint Conference on Bioinformatics, Systems Biology and Intelligent Computing, Shanghai, China, 3–5 August 2009; pp. 392–396. [Google Scholar]
- Lin, Y.; Wang, B. Facial Complexion Recognition of Traditional Chinese Medicine Based on Computer Vision. In Proceedings of the 2020 5th International Conference on Computational Intelligence and Applications (ICCIA), Beijing, China, 19–21 June 2020; pp. 113–117. [Google Scholar]
- Eyupoglu, C. Implementation of Color Face Recognition Using PCA and k-NN Classifier. In Proceedings of the 2016 IEEE NW Russia Young Researchers in Electrical and Electronic Engineering Conference (EIConRusNW), St. Petersburg, Russia, 2–3 February 2016; pp. 199–202. [Google Scholar]
- Zhang, J.; Wang, C.; Zhuo, L.; Yuncong, Y. Uniform Color Space Based Facial Complexion Recognition for Traditional Chinese Medicine. In Proceedings of the 2014 13th International Conference on Control Automation Robotics & Vision (ICARCV), Singapore, 10–12 December 2014; pp. 631–636. [Google Scholar]
- Lili, Z.; Xiaoqiang, L.; Xiping, Y.; Fufeng, L.; Xiaoyan, Z.; Wei, L. Lip Color Classification Based on Support Vector Machine and Histogram. In Proceedings of the 2010 3rd International Congress on Image and Signal Processing, Yantai, China, 16–18 October 2010; Volume 4, pp. 1883–1886. [Google Scholar]
- Wang, J.; Li, X.; Yan, X.; Li, F.; Zheng, L. Classification of zygomatic color based on support vector machine in traditional Chinese medicine inspection. Beijing Biomed. Eng. 2012, 31, 1–6. [Google Scholar]
- Xu, M.; Guo, C.; Hu, Y.; Lu, H.; Xue, L.; Li, F.; Zhang, W. Automatic Facial Complexion Classification Based on Mixture Model. In Proceedings of the Advances in Multimedia Information Processing–PCM 2017: 18th Pacific-Rim Conference on Multimedia, Harbin, China, 28–29 September 2017; Revised Selected Papers, Part II 18. pp. 327–336. [Google Scholar]
- Sun, K.; Sun, Q.; Li, X.; Dai, C. Research on TCM color extraction and recognition based on the convolutional neural network. China J. Tradit. Chin. Med. Pharm. 2021, 36, 4286–4290. [Google Scholar]
- Li, W.S.; Wang, S.; Wu, T.; Wu, Y. Facial Complexion Recognition Based on Supervised Latent Dirichlet Allocation in TCM. In Proceedings of the 2011 4th International Conference on Biomedical Engineering and Informatics (BMEI), Shanghai, China, 15–17 October 2011; pp. 290–293. [Google Scholar]
- Zhong, B.; Xing, X.; Love, P.; Wang, X.; Luo, H. Convolutional neural network: Deep learning-based classification of building quality problems. Adv. Eng. Inform. 2019, 40, 46–57. [Google Scholar] [CrossRef]
- Chen, Y.; Jiang, H.; Li, C.; Jia, X.; Ghamisi, P. Deep feature extraction and classification of hyperspectral images based on convolutional neural networks. IEEE Trans. Geosci. Remote Sens. 2016, 54, 6232–6251. [Google Scholar] [CrossRef]
- Ghazouani, H. Challenges and emerging trends for machine reading of the mind from facial expressions. SN Comput. Sci. 2023, 5, 103. [Google Scholar] [CrossRef]
- Hou, J.; Su, H.Y.; Yan, B.; Zheng, H.; Sun, Z.L.; Cai, X.C. Classification of Tongue Color Based on CNN. In Proceedings of the 2017 IEEE 2nd International Conference on Big Data Analysis (ICBDA), Beijing, China, 10–12 March 2017; pp. 725–729. [Google Scholar]
- El Alami, A.; Lakhili, Z.; Mesbah, A.; Berrahou, A.; Qjidaa, H. Color Face Recognition by Using Quaternion and Deep Neural Networks. In Proceedings of the 2019 International Conference on Wireless Technologies, Embedded and Intelligent Systems (WITS), Fez, Morocco, 3–4 April 2019; pp. 1–5. [Google Scholar]
- Lin, Y. Complexion classification based on convolutional neural network. J. Artif. Intell. Pract. 2020, 3, 22–30. [Google Scholar]
- Zhao, K.; Ma, X.; Kuang, H.; Xinhua, L. Facial Complexion Classification of Traditional Chinese Medicine Based on Statistical Features and MobileViT. In Proceedings of the 2024 IEEE 7th Information Technology, Networking, Electronic and Automation Control Conference (ITNEC), Chongqing, China, 20–22 September 2024; pp. 50–54. [Google Scholar]
- Gellis, M. The Unique Aspects of Diagnosing and Treating the Face in Chinese Medicine. J. Chin. Med. JCM 2021, 125, 62. [Google Scholar]
- Tan, H.; Zhou, Y.; Tao, Q.; Rosen, J.; van Dijken, S. Bioinspired multisensory neural network with crossmodal integration and recognition. Nat. Commun. 2021, 12, 1120. [Google Scholar] [CrossRef] [PubMed]
- Chen, L.C.; Zhu, Y.; Papandreou, G.; Schroff, F.; Adam, H. Encoder-Decoder with Atrous Separable Convolution for Semantic Image Segmentation. In Proceedings of the European Conference on Computer Vision (ECCV), Munich, Germany, 8–14 September 2018; pp. 801–818. [Google Scholar]
- Asif, M.; Naz, S.; Ali, F.; Salam, A.; Amin, F.; Ullah, F.; Alabrah, A. Advanced Zero-Shot Learning (AZSL) Framework for Secure Model Generalization in Federated Learning. IEEE Access 2024, 12, 184393–184407. [Google Scholar] [CrossRef]
- Tan, M.; Le, Q. Efficientnet: Rethinking Model Scaling for Convolutional Neural Networks. In Proceedings of the International Conference on Machine Learning, Long Beach, Singapore, 9–15 June 2019; pp. 6105–6114. [Google Scholar]
- Chen, T.; Guestrin, C. Xgboost: A Scalable Tree Boosting System. In 22nd Acm Sigkdd International Conference on Knowledge Discovery and Data Mining; Association for Computing Machinery: New York, NY, USA, 2016; pp. 785–794. [Google Scholar]

| Model | Accuracy | Precision (Average) | Recall (Average) | F1-Score (Average) | Params | Duration (One Epoch) |
|---|---|---|---|---|---|---|
| EfficientNet | 89.37% | 90.34% | 88.62% | 89.53% | 5.3 M | 52 s |
| VGGNet | 53.53% | 53.12% | 54.73% | 52.77% | 138 M | 72 s |
| MobileNet | 51.41% | 56.87% | 48.96% | 46.47% | 3.4 M | 47 s |
| ResNet | 90.14% | 90.91% | 90.53% | 90.33% | 25.5 M | 61 s |
| DenseNet | 86.62% | 90.61% | 87.21% | 86.87% | 8 M | 55 s |
| ConvNeXt | 88.03% | 89.17% | 87.91% | 88.15% | 28 M | 68 s |
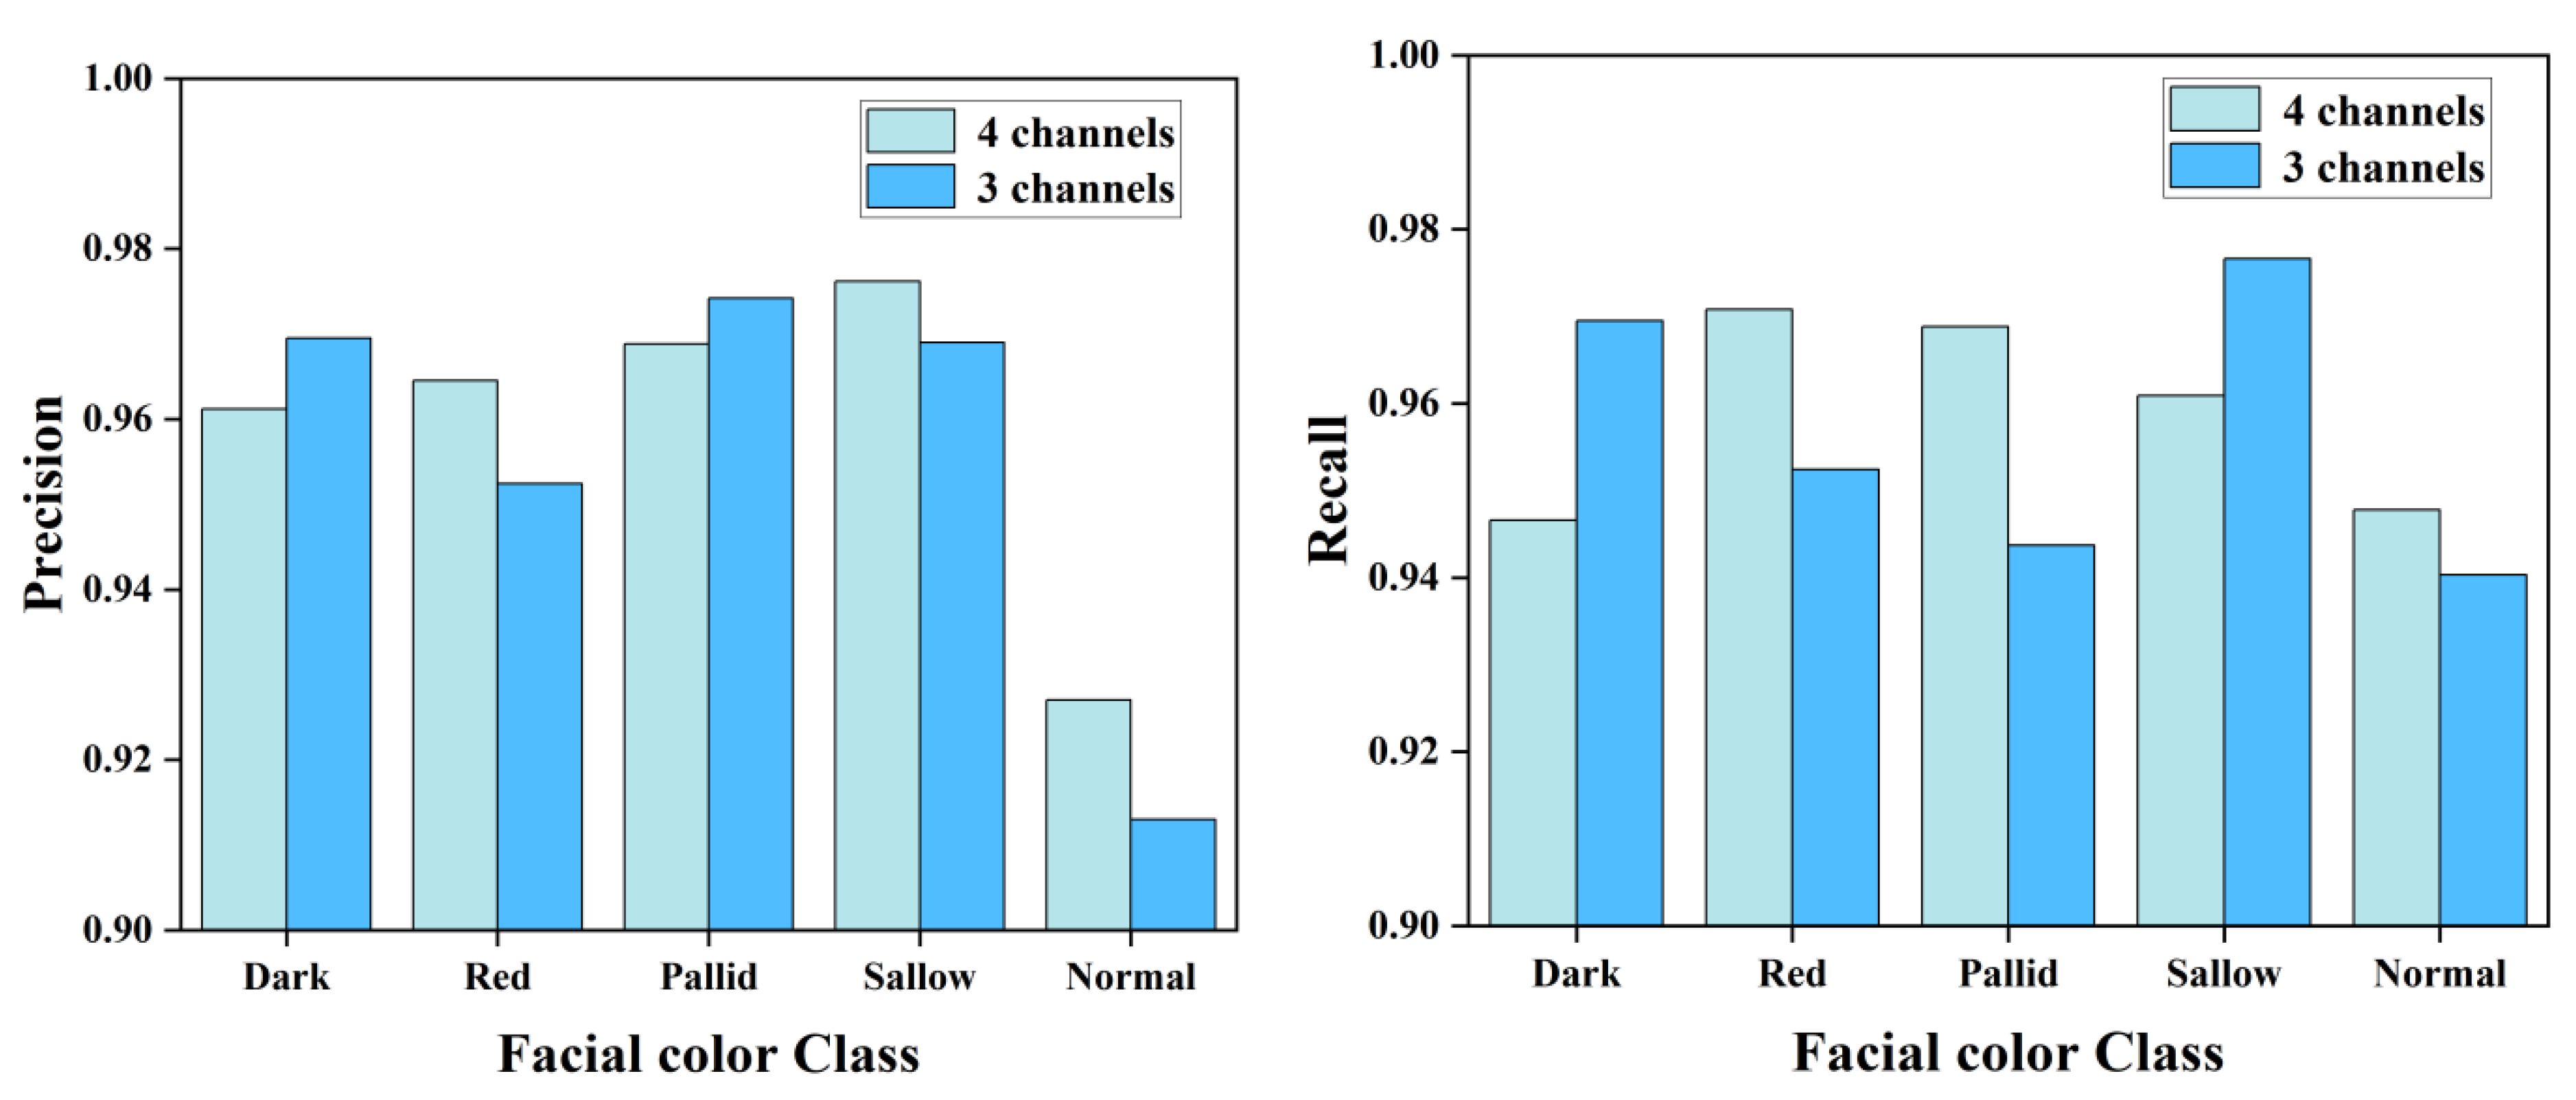
| Indicators | Dark | Red | Pallid | Sallow | Normal |
|---|---|---|---|---|---|
| Precision | 96.12% | 96.45% | 96.88% | 97.62% | 92.70% |
| Recall | 94.66% | 97.02% | 96.88% | 96.09% | 94.78% |
| F1-score | 95.38% | 96.73% | 96.88% | 96.85% | 93.73% |
| Algorithm | Comparison | Experiment |
|---|---|---|
| Multi-feature fusion classification algorithm | 1-1 | 3 channels (RGB) |
| 1-2 | pixel splicing | |
| 1-3 | with chin parts | |
| 1-4 | all 6 parts | |
| 1-5 | 4 channels (RGB + Gray) | |
| Multi-feature splicing classification algorithm | 2-1 | with philtrum parts |
| 2-2 | with chin parts | |
| 2-3 | all 6 parts |
| Comparison | Accuracy | Precision (Average) | Recall (Average) | F1-Score (Average) |
|---|---|---|---|---|
| 1-1 | 95.56% | 95.52% | 95.65% | 95.59% |
| 1-2 | 40.5% | 42.01% | 39.54% | 36.15% |
| 1-3 | 92.79% | 92.79% | 92.91% | 92.80% |
| 1-4 | 94.04% | 94.43% | 93.84% | 94.07% |
| 1-5 | 95.98% | 95.95% | 95.88% | 95.91% |
| 2-1 | 93.76% | 93.67% | 93.96% | 93.73% |
| 2-2 | 90.01% | 90.62% | 89.91% | 89.90% |
| 2-3 | 90.29% | 90.64% | 90.18% | 90.28% |
| ROI | Accuracy | Precision (Average) | Recall (Average) | F1-Score (Average) |
|---|---|---|---|---|
| nose | 92.23% | 92.29% | 92.15% | 92.18% |
| forehead | 95.15% | 95.43% | 95.03% | 95.19% |
| philtrum | 91.12% | 90.99% | 91.05% | 90.96% |
| chin | 90.98% | 90.73% | 90.88% | 90.79% |
| right cheek | 90.29% | 90.23% | 90.13% | 90.13% |
| left cheek | 81.00% | 81.51% | 81.23% | 80.82% |
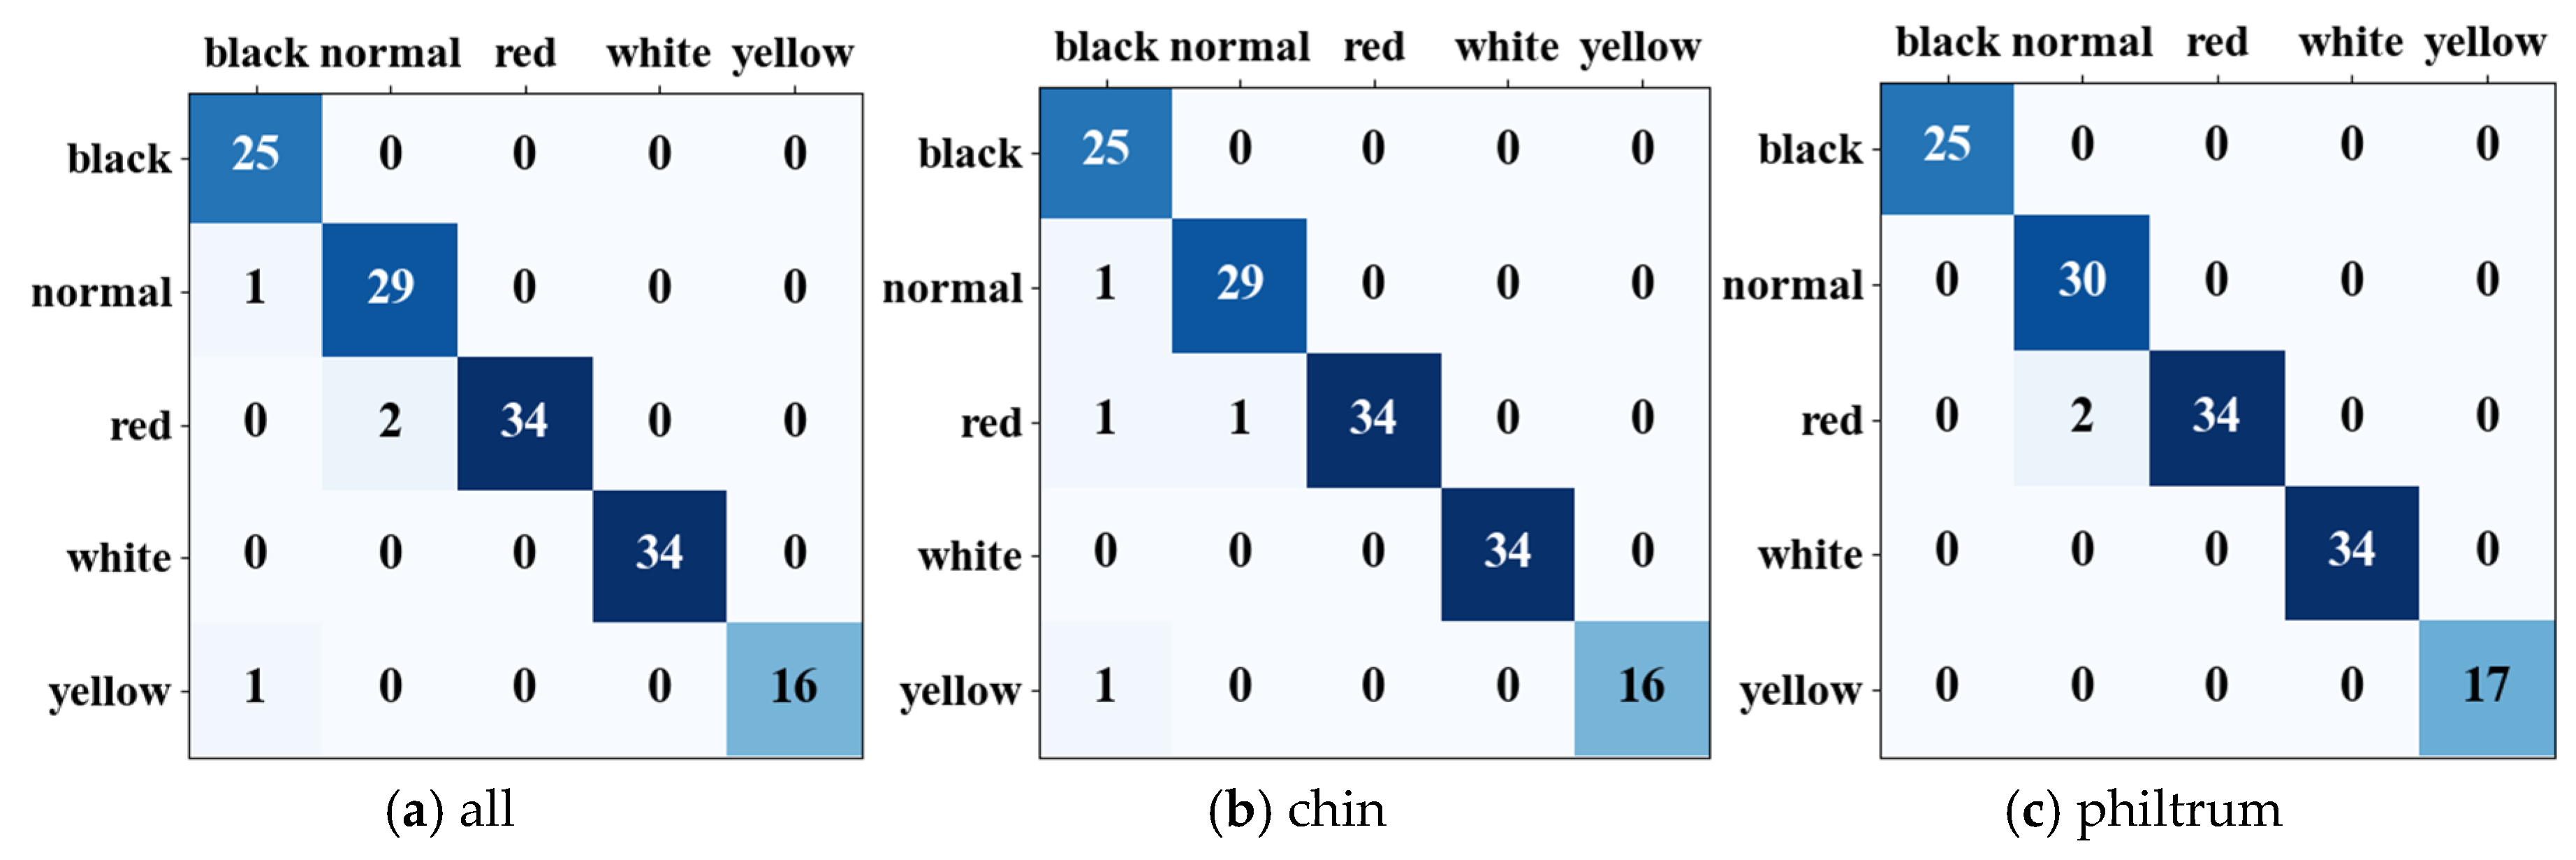
| Model | All | Chin | Philtrum |
|---|---|---|---|
| KNN | 92.81% | 93.97% | 92.65% |
| Decision tree | 95.58% | 94.91% | 96.08% |
| Random forest | 95.52% | 95.24% | 95.52% |
| Linear1 | 92.33% | 92.28% | 92.57% |
| Linear2 | 92.67% | 92.41% | 92.65% |
| SVM | 94.53% | 94.19% | 94.19% |
| XGBoost | 97.23% | 96.13% | 97.78% |
| Ratio | 6:4 | 7:3 | 8:2 | |||
|---|---|---|---|---|---|---|
| Fold | 5 | 10 | 5 | 10 | 5 | 10 |
| Accuracy | 97.57 | 97.19 | 97.96 | 97.51 | 98.23 | 97.78 |
| Standard deviation | 0.43 | 0.79 | 1.03 | 0.99 | 0.88 | 1.11 |
Disclaimer/Publisher’s Note: The statements, opinions and data contained in all publications are solely those of the individual author(s) and contributor(s) and not of MDPI and/or the editor(s). MDPI and/or the editor(s) disclaim responsibility for any injury to people or property resulting from any ideas, methods, instructions or products referred to in the content. |
© 2025 by the authors. Licensee MDPI, Basel, Switzerland. This article is an open access article distributed under the terms and conditions of the Creative Commons Attribution (CC BY) license (https://creativecommons.org/licenses/by/4.0/).
Share and Cite
Cao, X.; Zhang, D.; Jin, C.; Zhang, Z.; Xue, C. Multi-Feature Facial Complexion Classification Algorithms Based on CNN. Biomimetics 2025, 10, 402. https://doi.org/10.3390/biomimetics10060402
Cao X, Zhang D, Jin C, Zhang Z, Xue C. Multi-Feature Facial Complexion Classification Algorithms Based on CNN. Biomimetics. 2025; 10(6):402. https://doi.org/10.3390/biomimetics10060402
Chicago/Turabian StyleCao, Xiyuan, Delong Zhang, Chunyang Jin, Zhidong Zhang, and Chenyang Xue. 2025. "Multi-Feature Facial Complexion Classification Algorithms Based on CNN" Biomimetics 10, no. 6: 402. https://doi.org/10.3390/biomimetics10060402
APA StyleCao, X., Zhang, D., Jin, C., Zhang, Z., & Xue, C. (2025). Multi-Feature Facial Complexion Classification Algorithms Based on CNN. Biomimetics, 10(6), 402. https://doi.org/10.3390/biomimetics10060402