2.1. Design of the Flapping-Wing Mechanism
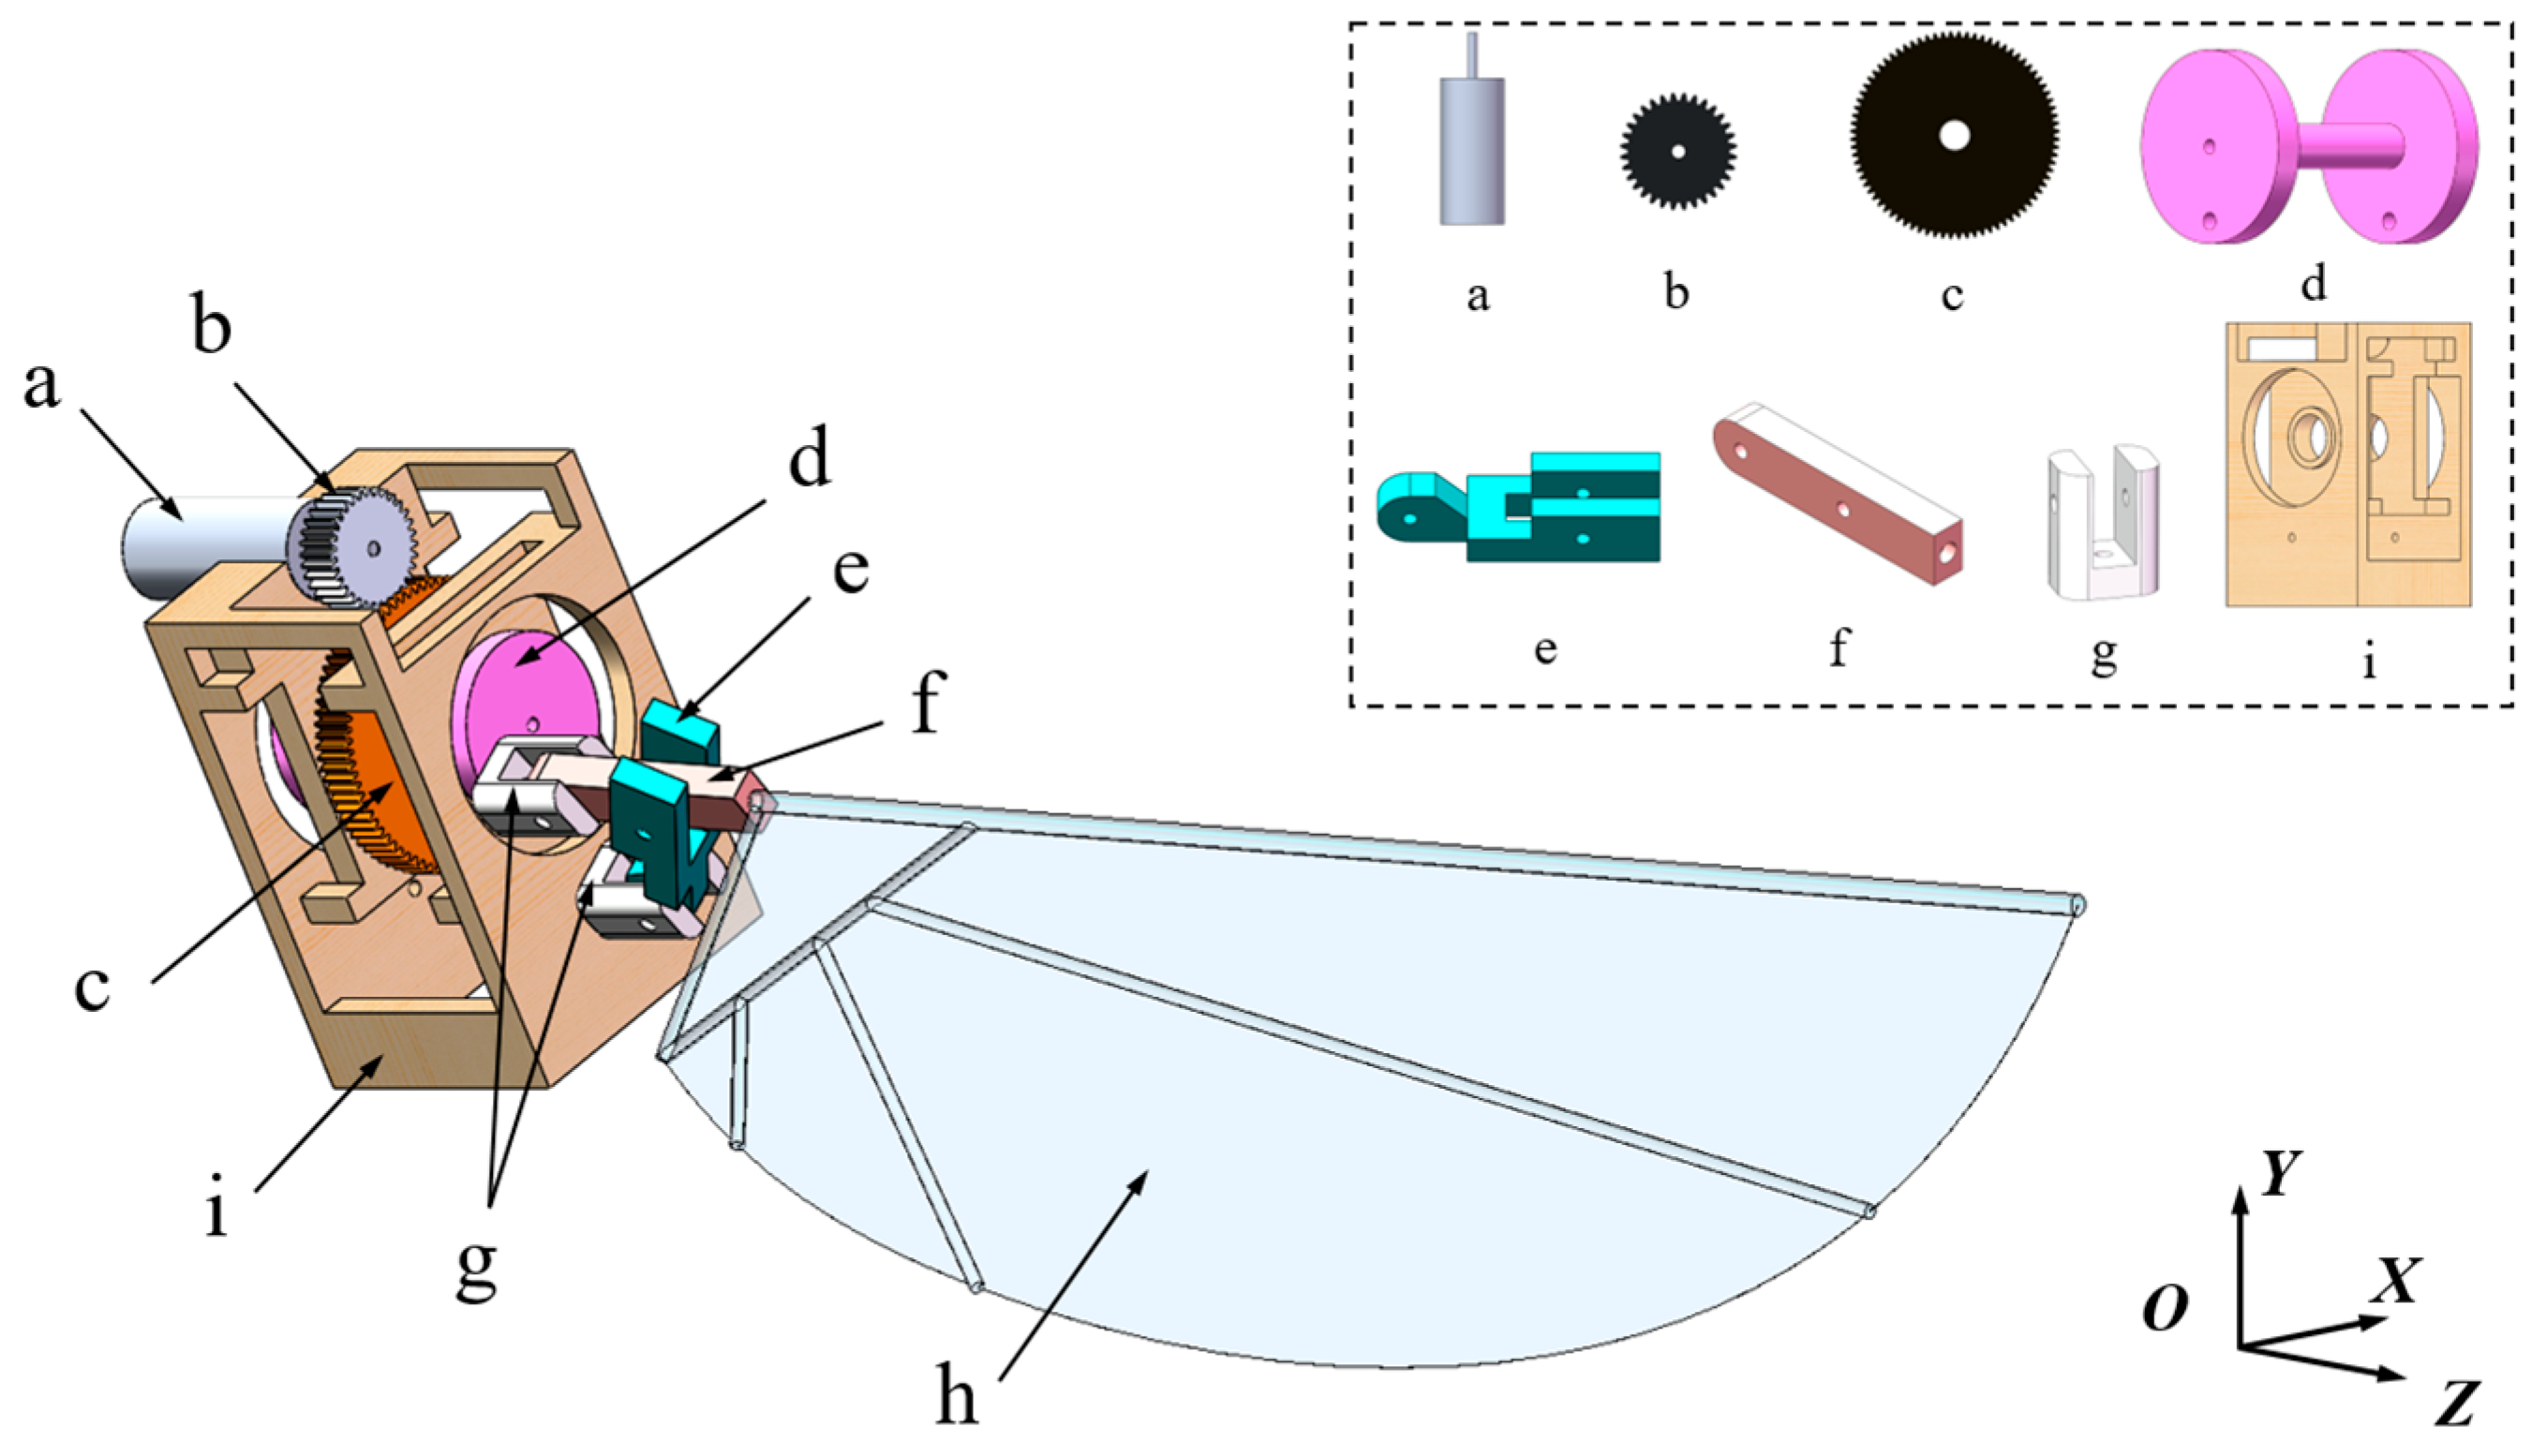
Most advanced flapping-wing mechanisms currently utilize DC motors to drive flapping motion, making it challenging to achieve control of stroke and pitch motion simultaneously. To address this issue, this study proposes a novel transmission mechanism that uses a single motor to enable the coupling of stroking and pitching motions. The mechanism for a right wing is selected for decomposition, as shown in
Figure 1.
The transmission process of the mechanism is as follows: The driving gear rotates synchronously with the motor at an angular velocity , while the driven gear serves to reduce the speed. The center of the driven gear passes through the transmission shaft, and the driven gear is tightly coupled with the transmission shaft to achieve synchronized rotation at a speed of . Both ends of the transmission shaft are constrained by the frame, ensuring only one degree of pitch freedom. The bottom through-holes of the two rotational axes form revolute pairs with the frame and transmission shaft, with no displacement along the Z-axis. The other ends of the two rotational axes form revolute pairs with the endpoints of Linkage 1 and Linkage 2, respectively. Linkage 1 and Linkage 2 are connected by a revolute pair, and the other end of Linkage 2 is connected to the flapping wing. One end of the flapping wing is mounted into a hole at the endpoint of Linkage 2, effectively fixing the wing to Linkage 2. Through this transmission process, the stroke motion and pitch motion of the wing are coupled, simulating the motion patterns of dragonfly wings.
The flight performance of flying animals is closely related to parameters such as body weight, flapping frequency, and wingspan, a relationship known as the scaling law [
23]. Considering the current limitations of materials and manufacturing techniques, it is challenging to design a flapping-wing mechanism with the same size and weight as a real dragonfly. In this study, the proposed mechanism has a mass of 10 g, with the flapping wing area designed at 0.0037 m
2, a wingspan of 0.12 m, and an aspect ratio of 6.56, based on the scaling law. The skeleton material adopts a carbon fiber structure, and the wing membrane uses P31N flexible film. Based on the previous observations and intensity measurement results of the dragonfly wing vein distribution by our research team [
21], the structure of the flapping wing model is designed as shown in
Figure 2.
2.2. Kinematic Parameters of Flapping Motion and Adjustment Rules
To analyze the motion of the wing, the origin of the reference coordinate system is fixed at the wing root, which effectively simplifies the analysis model. This study adopts the method proposed by Ellington [
24] to define the stroke plane. The trajectory of the dragonfly’s wingtip is projected over a number of beat cycles onto the symmetry plane of the body, the OXY plane defined in the body motion parameters. The linear regression line for these projected points is obtained using the least squares method. The stroke plane of the dragonfly is then defined as the plane passing through the wing root point and parallel to this regression line, as shown by Plane A in
Figure 3. Additionally, Plane B is introduced, which is perpendicular to Plane A and passes through the origin O. The stroke plane angle
is the angle between the stroke plane and the horizontal plane. The stroke angle
is the angle between the projection of the line connecting the wingtip and root onto the stroke plane and the Z-axis. The rotation angle
is the angle between the stroke plane and the plane of the wing. The deviation angle
is the angle between the line connecting the wingtip and root and its projection onto the stroke plane. Since the deviation angle varies irregularly and has a small value, its influence is neglected.
Most insects (e.g., bees) use a stroke plane that is parallel to the horizontal plane during flight, with the upstroke and downstroke rotation angles following the same variation pattern, referred to as symmetric rotation, as shown in
Figure 4a [
25]. However, during dragonfly flight, the stroke plane forms a certain angle with the horizontal plane, and the rotation angle exhibits an asymmetric variation pattern, known as asymmetric rotation, as shown in
Figure 4b.
To investigate the asymmetry of the dragonfly’s wing rotation motion, this study introduces the pitch deviation angle
to describe the asymmetric process of wing rotation during the downstroke and upstroke phases. The pitch deviation angle
is defined as follows: Select the midpoints of the downstroke and upstroke phases within the same motion cycle, at the section positions of the flapping wing’s chord line. After connecting the leading edges, the bisector of the angle formed between the leading edge and the stroke plane’s normal direction (denoted as PQ, ‘P’Q’) is measured, as shown in
Figure 5. The angle between this bisector and the normal direction of the stroke plane is defined as the deviation angle of rotation. It can be observed that for symmetric rotation,
= 0°, while for asymmetric rotation,
can be either positive or negative.
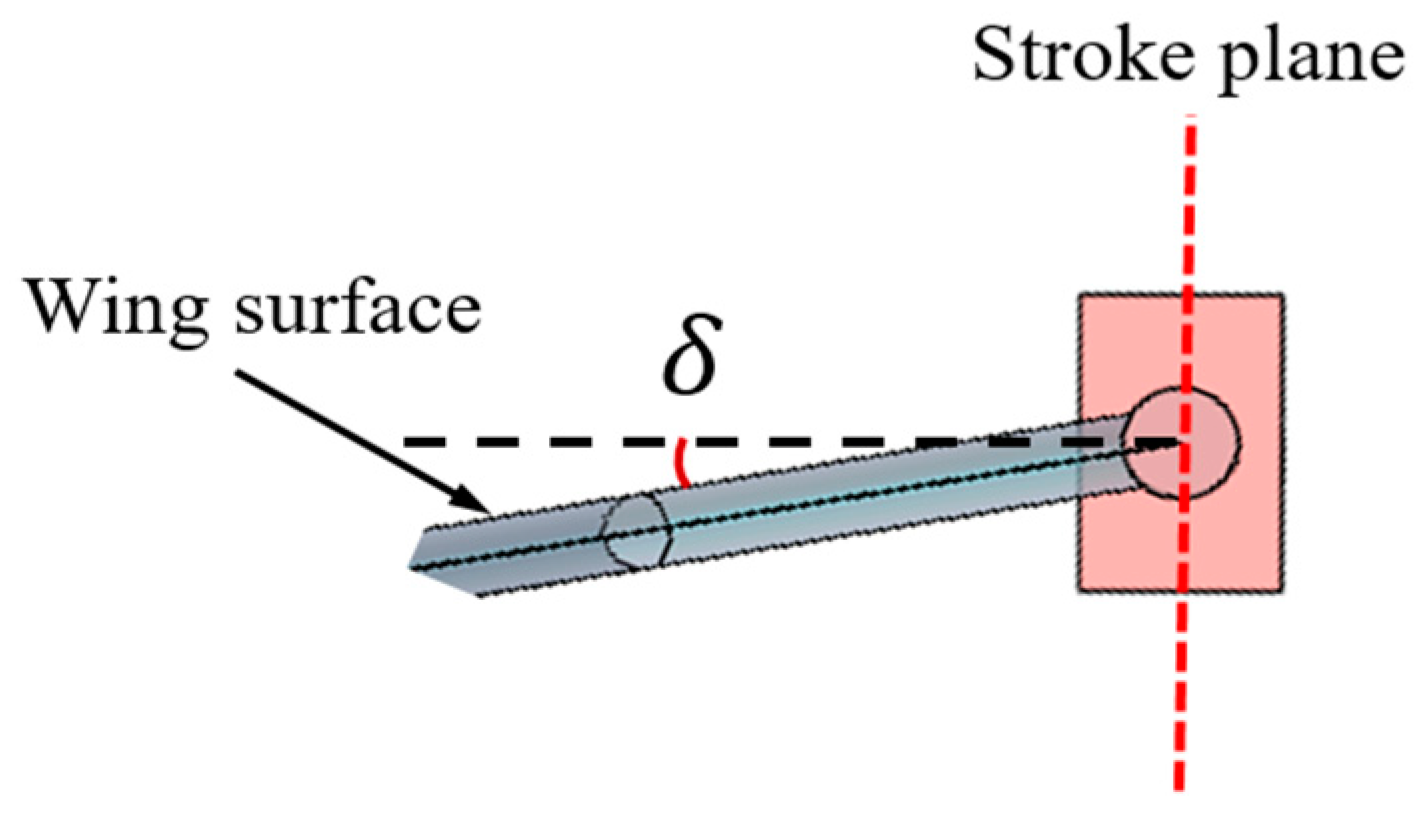
Once the stroke plane is determined, the deviation angle of rotation
can be defined based on the installation angle
between the flapping wing and Linkage 2, as shown in
Figure 6. Initially, when the surface of the flapping wing is parallel to the upper surface of Linkage 2, the deviation angle of rotation
is 0°, representing symmetric pitch motion. When the installation angle is altered such that there is an angular offset between the flapping wing surface and the upper surface of Linkage 2, the deviation angle of rotation
becomes nonzero,
and
are equal. By adjusting the installation angle
, the effect of the deviation angle of rotation
on the aerodynamic characteristics of the flapping wing can be explored.
In natural flight, the surrounding flow field of a dragonfly constantly changes. The uncertainty in airspeed forces the dragonfly to continuously adjust its flapping motion to maintain stable flight. Observations from Norberg [
26,
27] and Zheng [
28] on the dragonfly’s forward flight process revealed that, under the condition of constant stroke amplitude
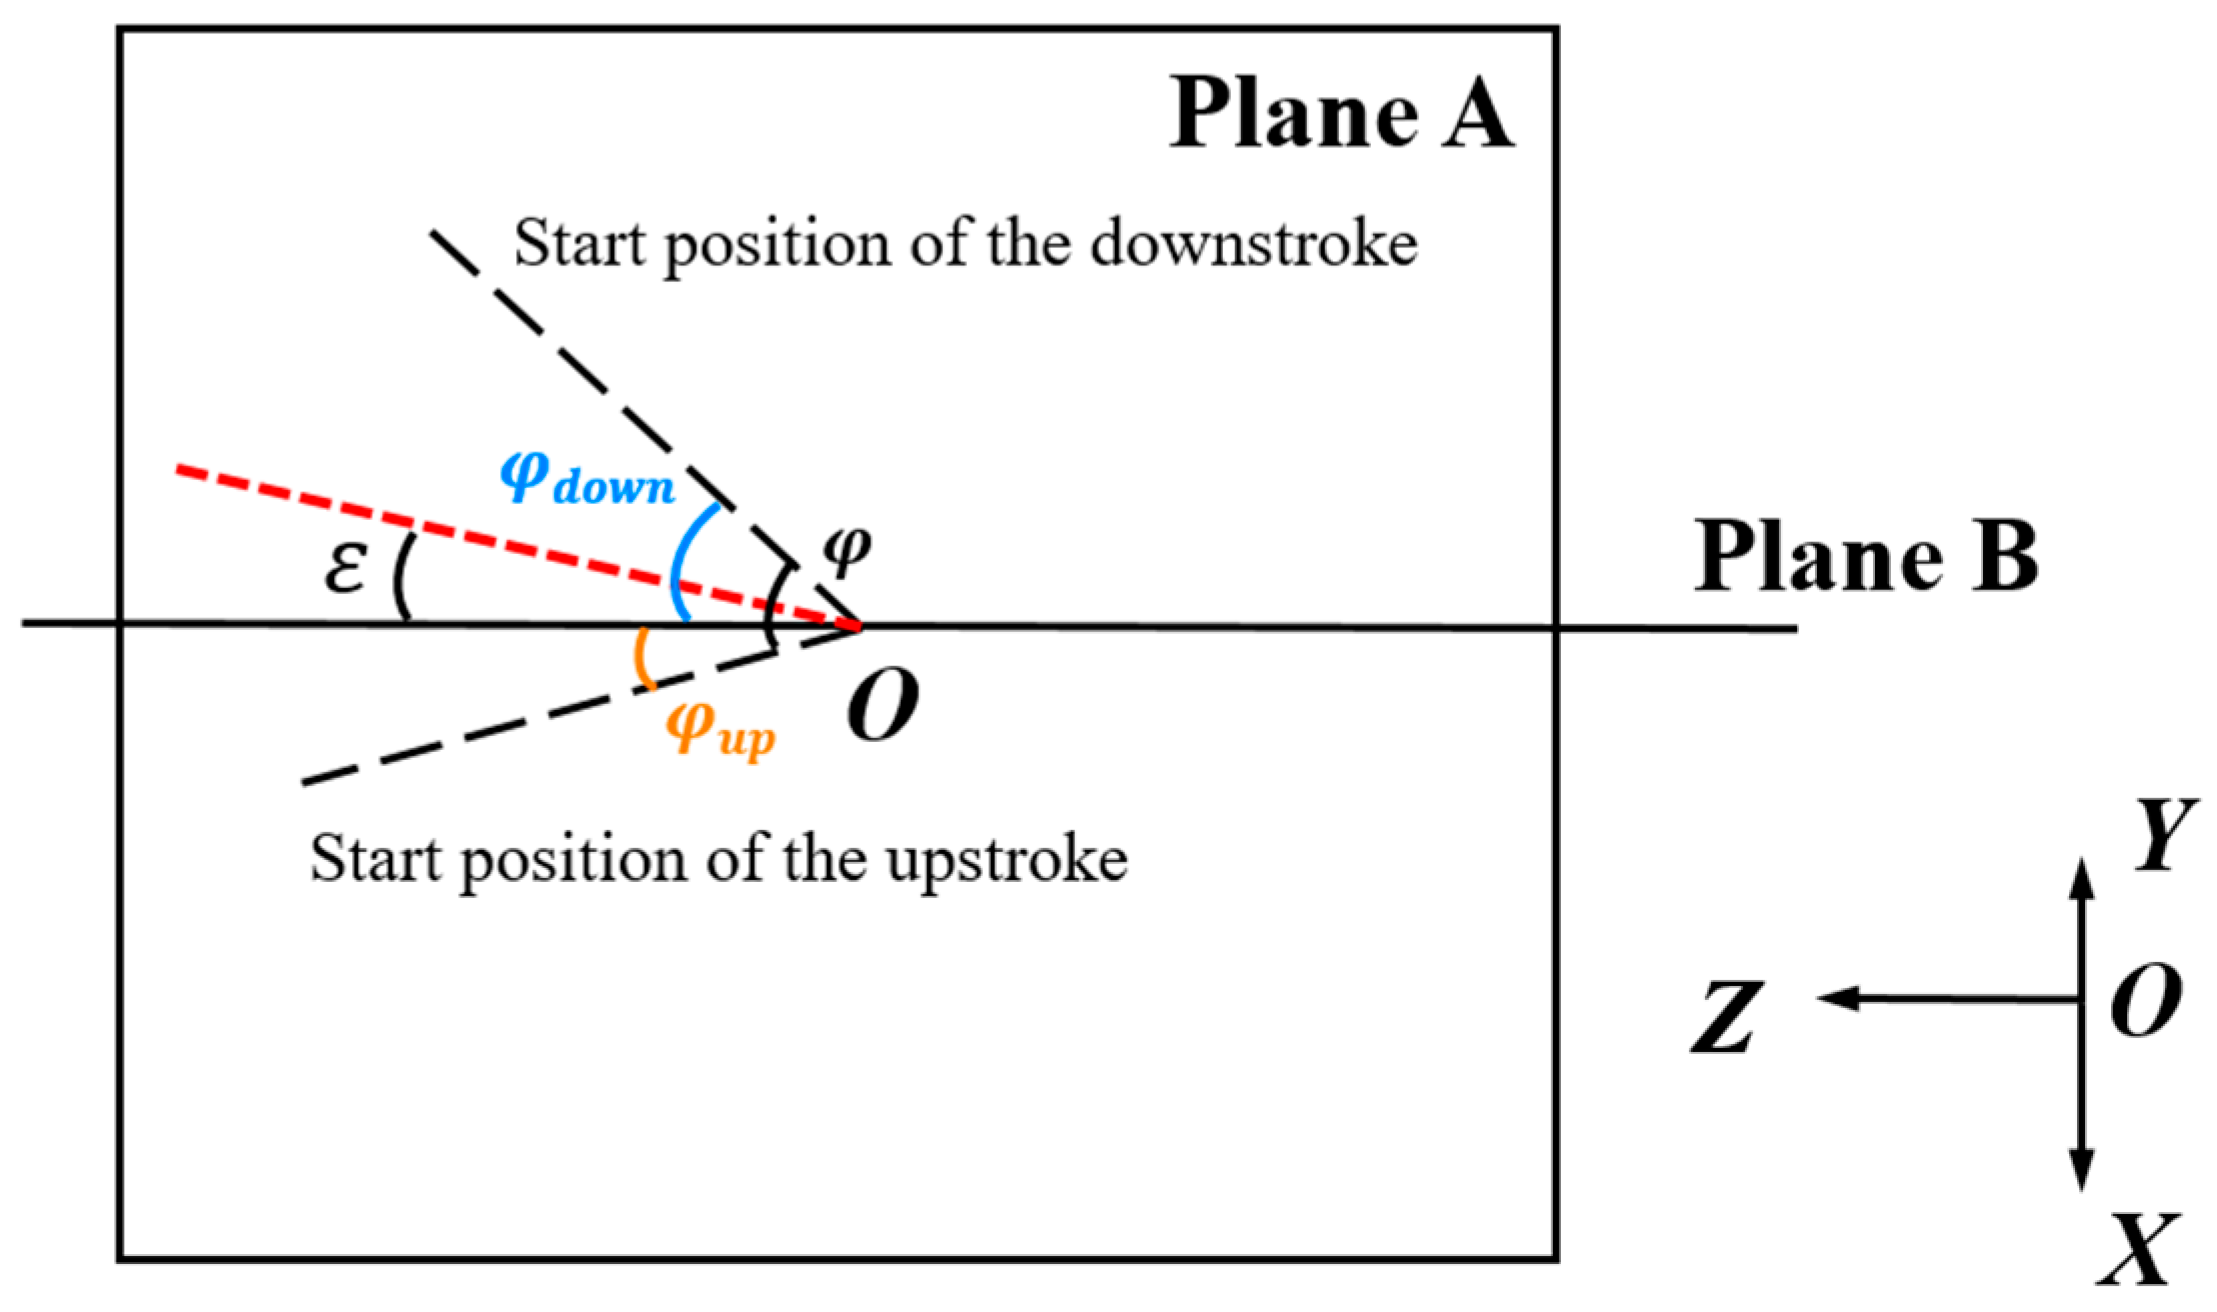
, the dragonfly can adapt to changes in the surrounding flow field by altering the positions of the downstroke and upstroke starting points relative to its body. To investigate the asymmetry in the dragonfly’s wing stroke motion, both the upstroke
and downstroke
amplitudes are defined. This study introduces the stroke midpoint angle
to explore the impact of the downstroke and upstroke starting point positions on aerodynamic forces. The positions of the downstroke and upstroke starting points are simplified as the projection of the line connecting the wingtip and root onto the stroke plane (Plane A). The midpoint angle
is defined as the angle between the bisector of the angle formed by the downstroke and upstroke starting positions and Plane B. The angle increases in the clockwise direction and is considered positive, as shown in
Figure 7.
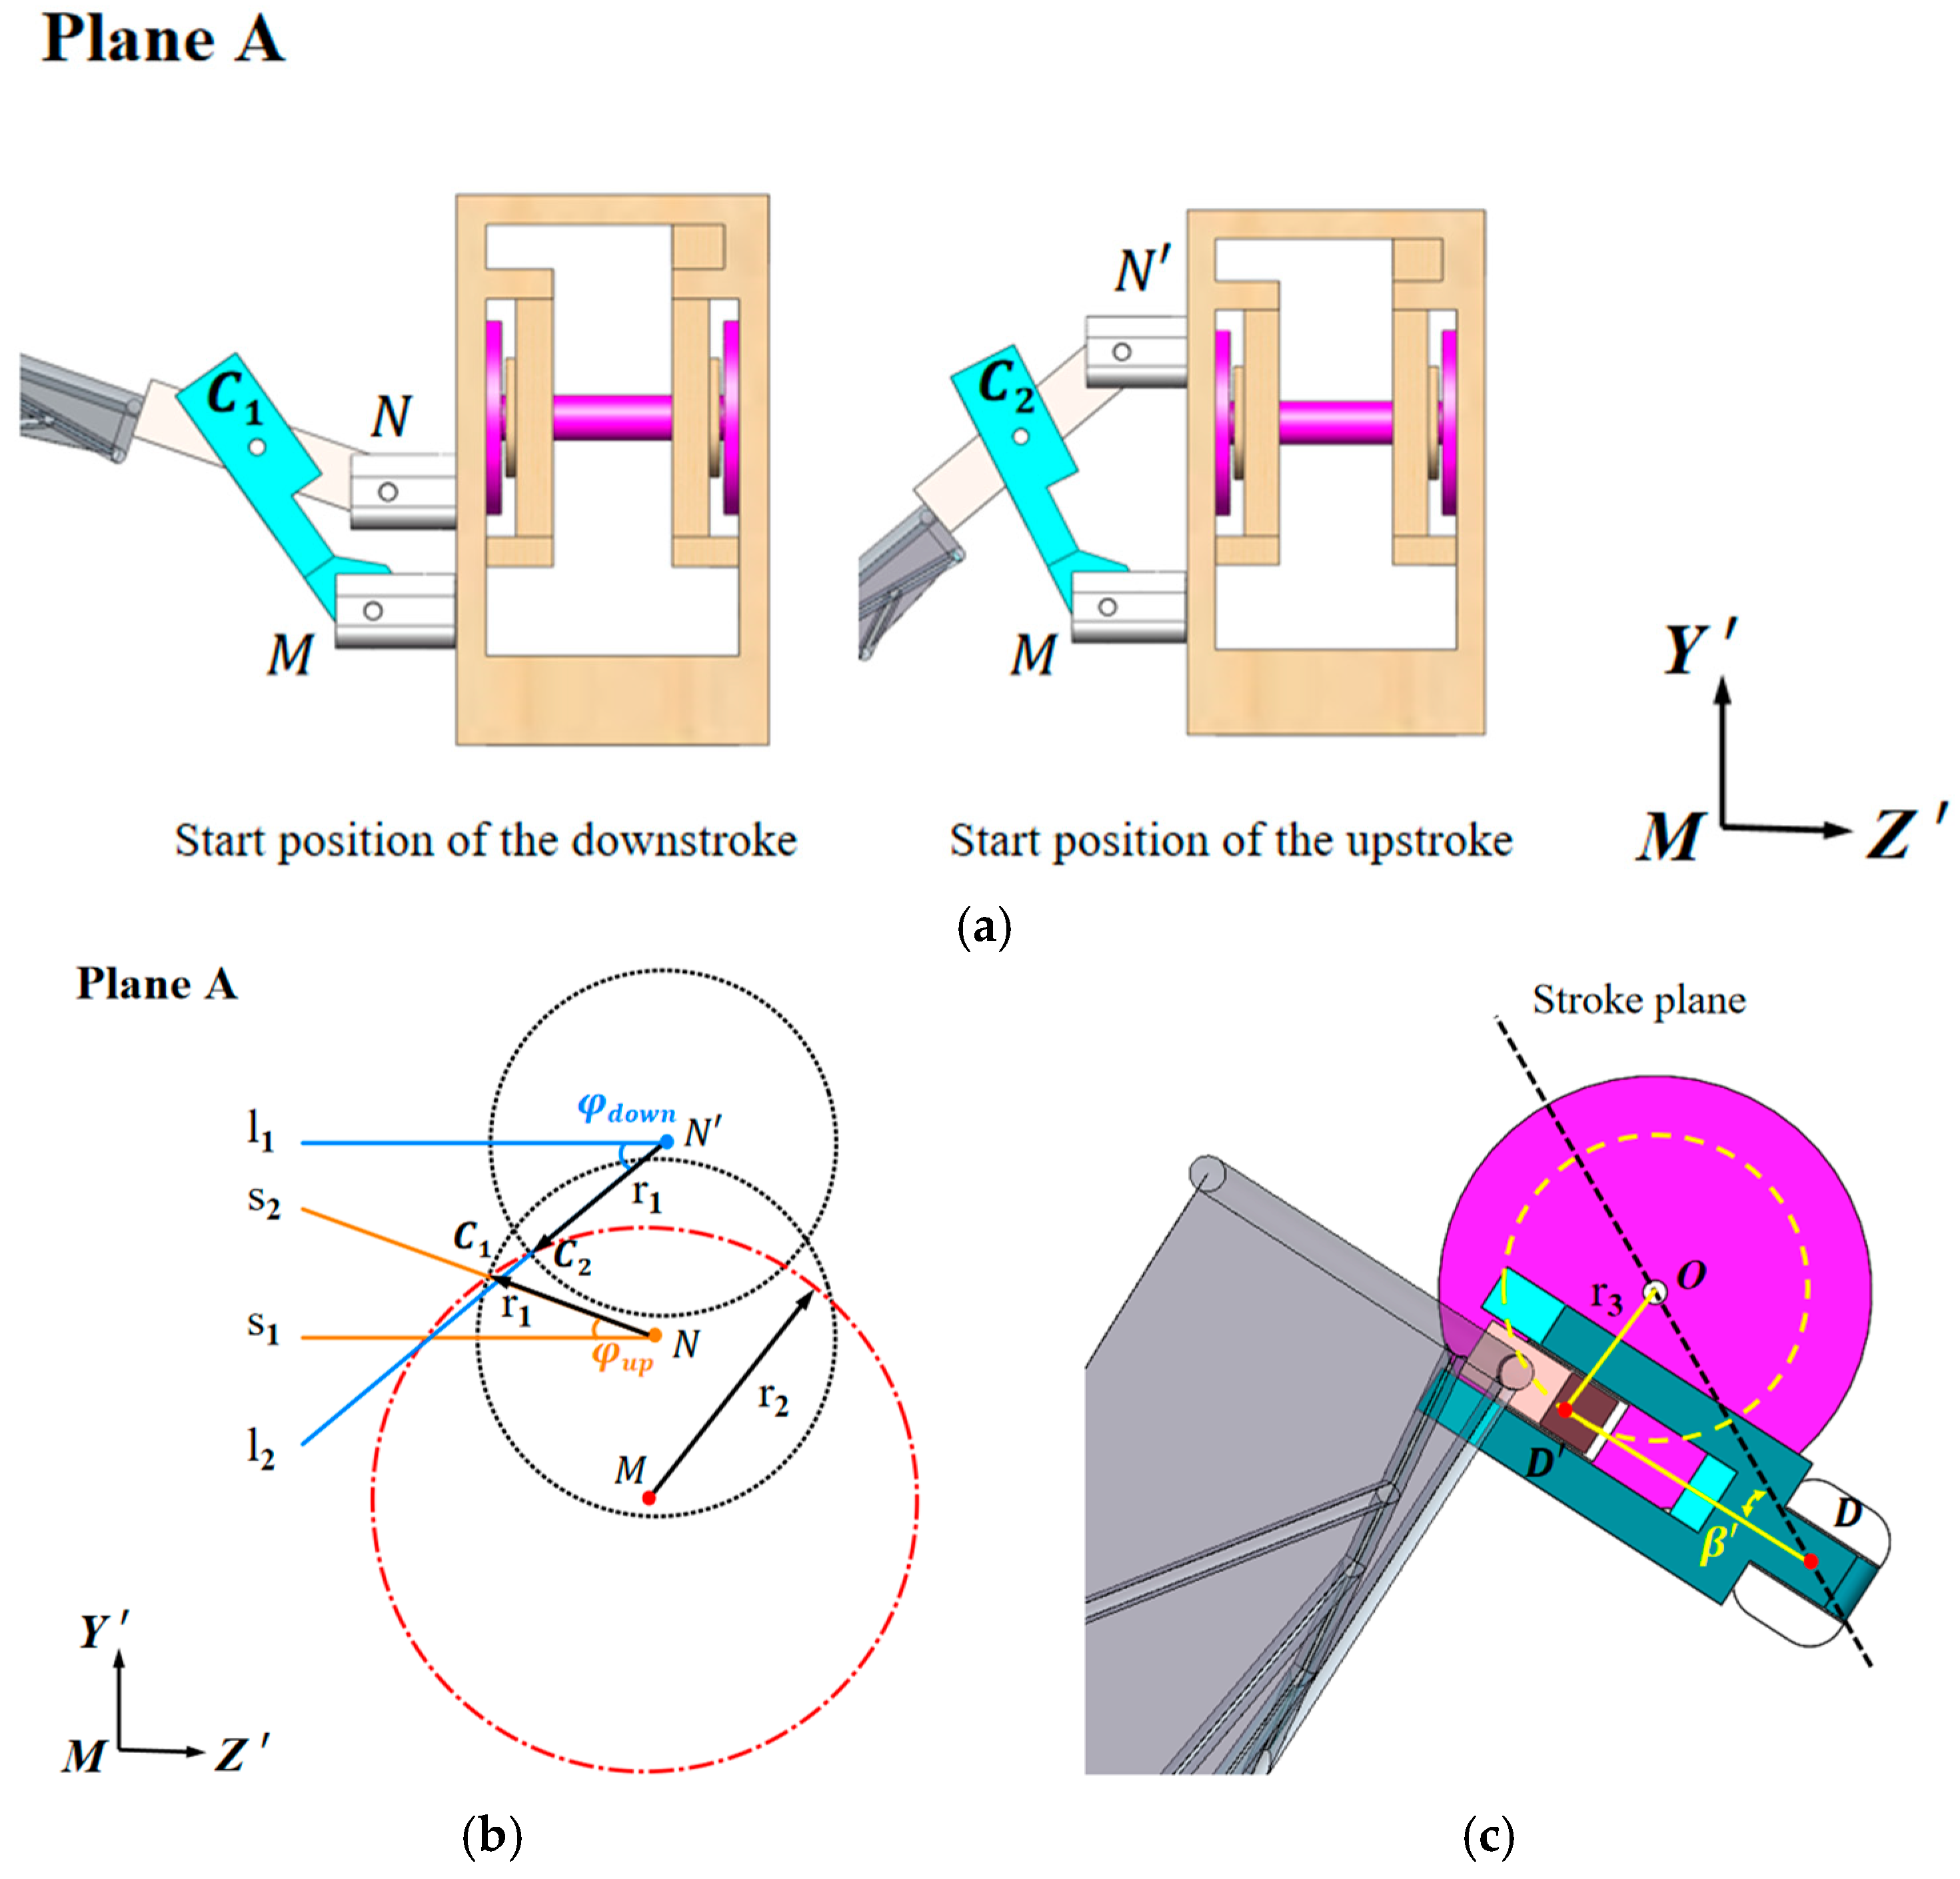
To study the influence of the stroke midpoint angle
on the aerodynamic performance of the flapping wing, the Plane A perspective is selected, as shown in
Figure 8a. The starting positions of the downstroke and upstroke are fixed, with the revolute pair formed by Linkage 1 and the rotational axis remaining unchanged, defined as point M. A local coordinate system M-Y’Z’ is established. The revolute pair formed by Linkage 2 and the rotational axis at the downstroke starting position is defined as point N, and the revolute pair formed by Linkage 1 and Linkage 2 is defined as C
1. Similarly, the revolute pairs at the upstroke starting position are defined as N’ and C
2. This design adopts a clever approach: by altering the positions of the revolute pairs, any combination of
and
can be achieved.
Figure 8a can be simplified to
Figure 8b, where, under the same motion mode, the distances NC
1 and N’C
2 are equal. Taking N and N’ as the centers and the distance NC
1 and N’C
2 as the radius, circles are drawn in the MY’Z’ plane. Lines
and
are parallel to MZ’, while
and
intersect the circles centered at N and N’ at C
1 and C
2, respectively. Another circle is drawn using M as the center and radius
, ensuring that both C
1 and C
2 lie on this circle. In this design, the coordinates are defined as follows: M (0, 0); C
1 (z
1, y
1); C
2 (z
2, y
2); N (1, y
3) and N′ (1, y
4).
As shown in
Figure 8c, the rotational centers of the two rotational axes are defined as D and D’, respectively. The rotational radius of D’ around O is
. The line OD’ is perpendicular to DD’, and
is the angle between DD’ and DO. The length of DO is 13 mm, arcsin
=
/13,
= 13 −
,
= 13 +
. From the geometric relationship, the maximum value of the pitch angle can be derived as 90° +
+
, and the minimum value of the pitch angle
can be derived as 90 −
+
. The remaining parameters can be obtained by solving the system of equations, as follows:
2.3. Kinematic Analysis of the Mechanism
By ensuring similarity in dimensionless parameters between the motion of the model wing and the dragonfly wing, the experimental model can accurately replicate the real flow field of a dragonfly’s flapping wings. The Reynolds number (
Re) is a dimensionless parameter that characterizes the flow conditions of a fluid. To ensure that the flow field generated by the model wing in the experiment matches the flow field of a real dragonfly’s flapping wings, the experimental parameters of the model must be designed to maintain consistency in Re. In this study, the Reynolds number is defined as follows:
where
represents the fluid density,
is the fluid dynamic viscosity coefficient,
is the reference velocity, and
is the characteristic length. The chord length c of the flapping wing model is chosen as
. For
, the average flapping tip velocity is generally used as the reference velocity.
Meanwhile, the Strouhal number (
) is a similarity criterion characterizing the unsteady flow and is the similarity criterion to be simulated in unsteady aerodynamic experiments. For periodic unsteady flow, the Strouhal number is defined as follows:
where
represents flapping frequency. At present, most scholars, when studying the upstroke and downstroke movements of dragonflies, assume that the durations of the two stages are the same for simplicity [
29,
30]. Based on data observed in real dragonfly flight, the standard motion parameters are given as follows:
= 60°,
= 60°,
= −10°, and the pitch amplitude
’ is within the range of 45–70°,
= −5° [
31,
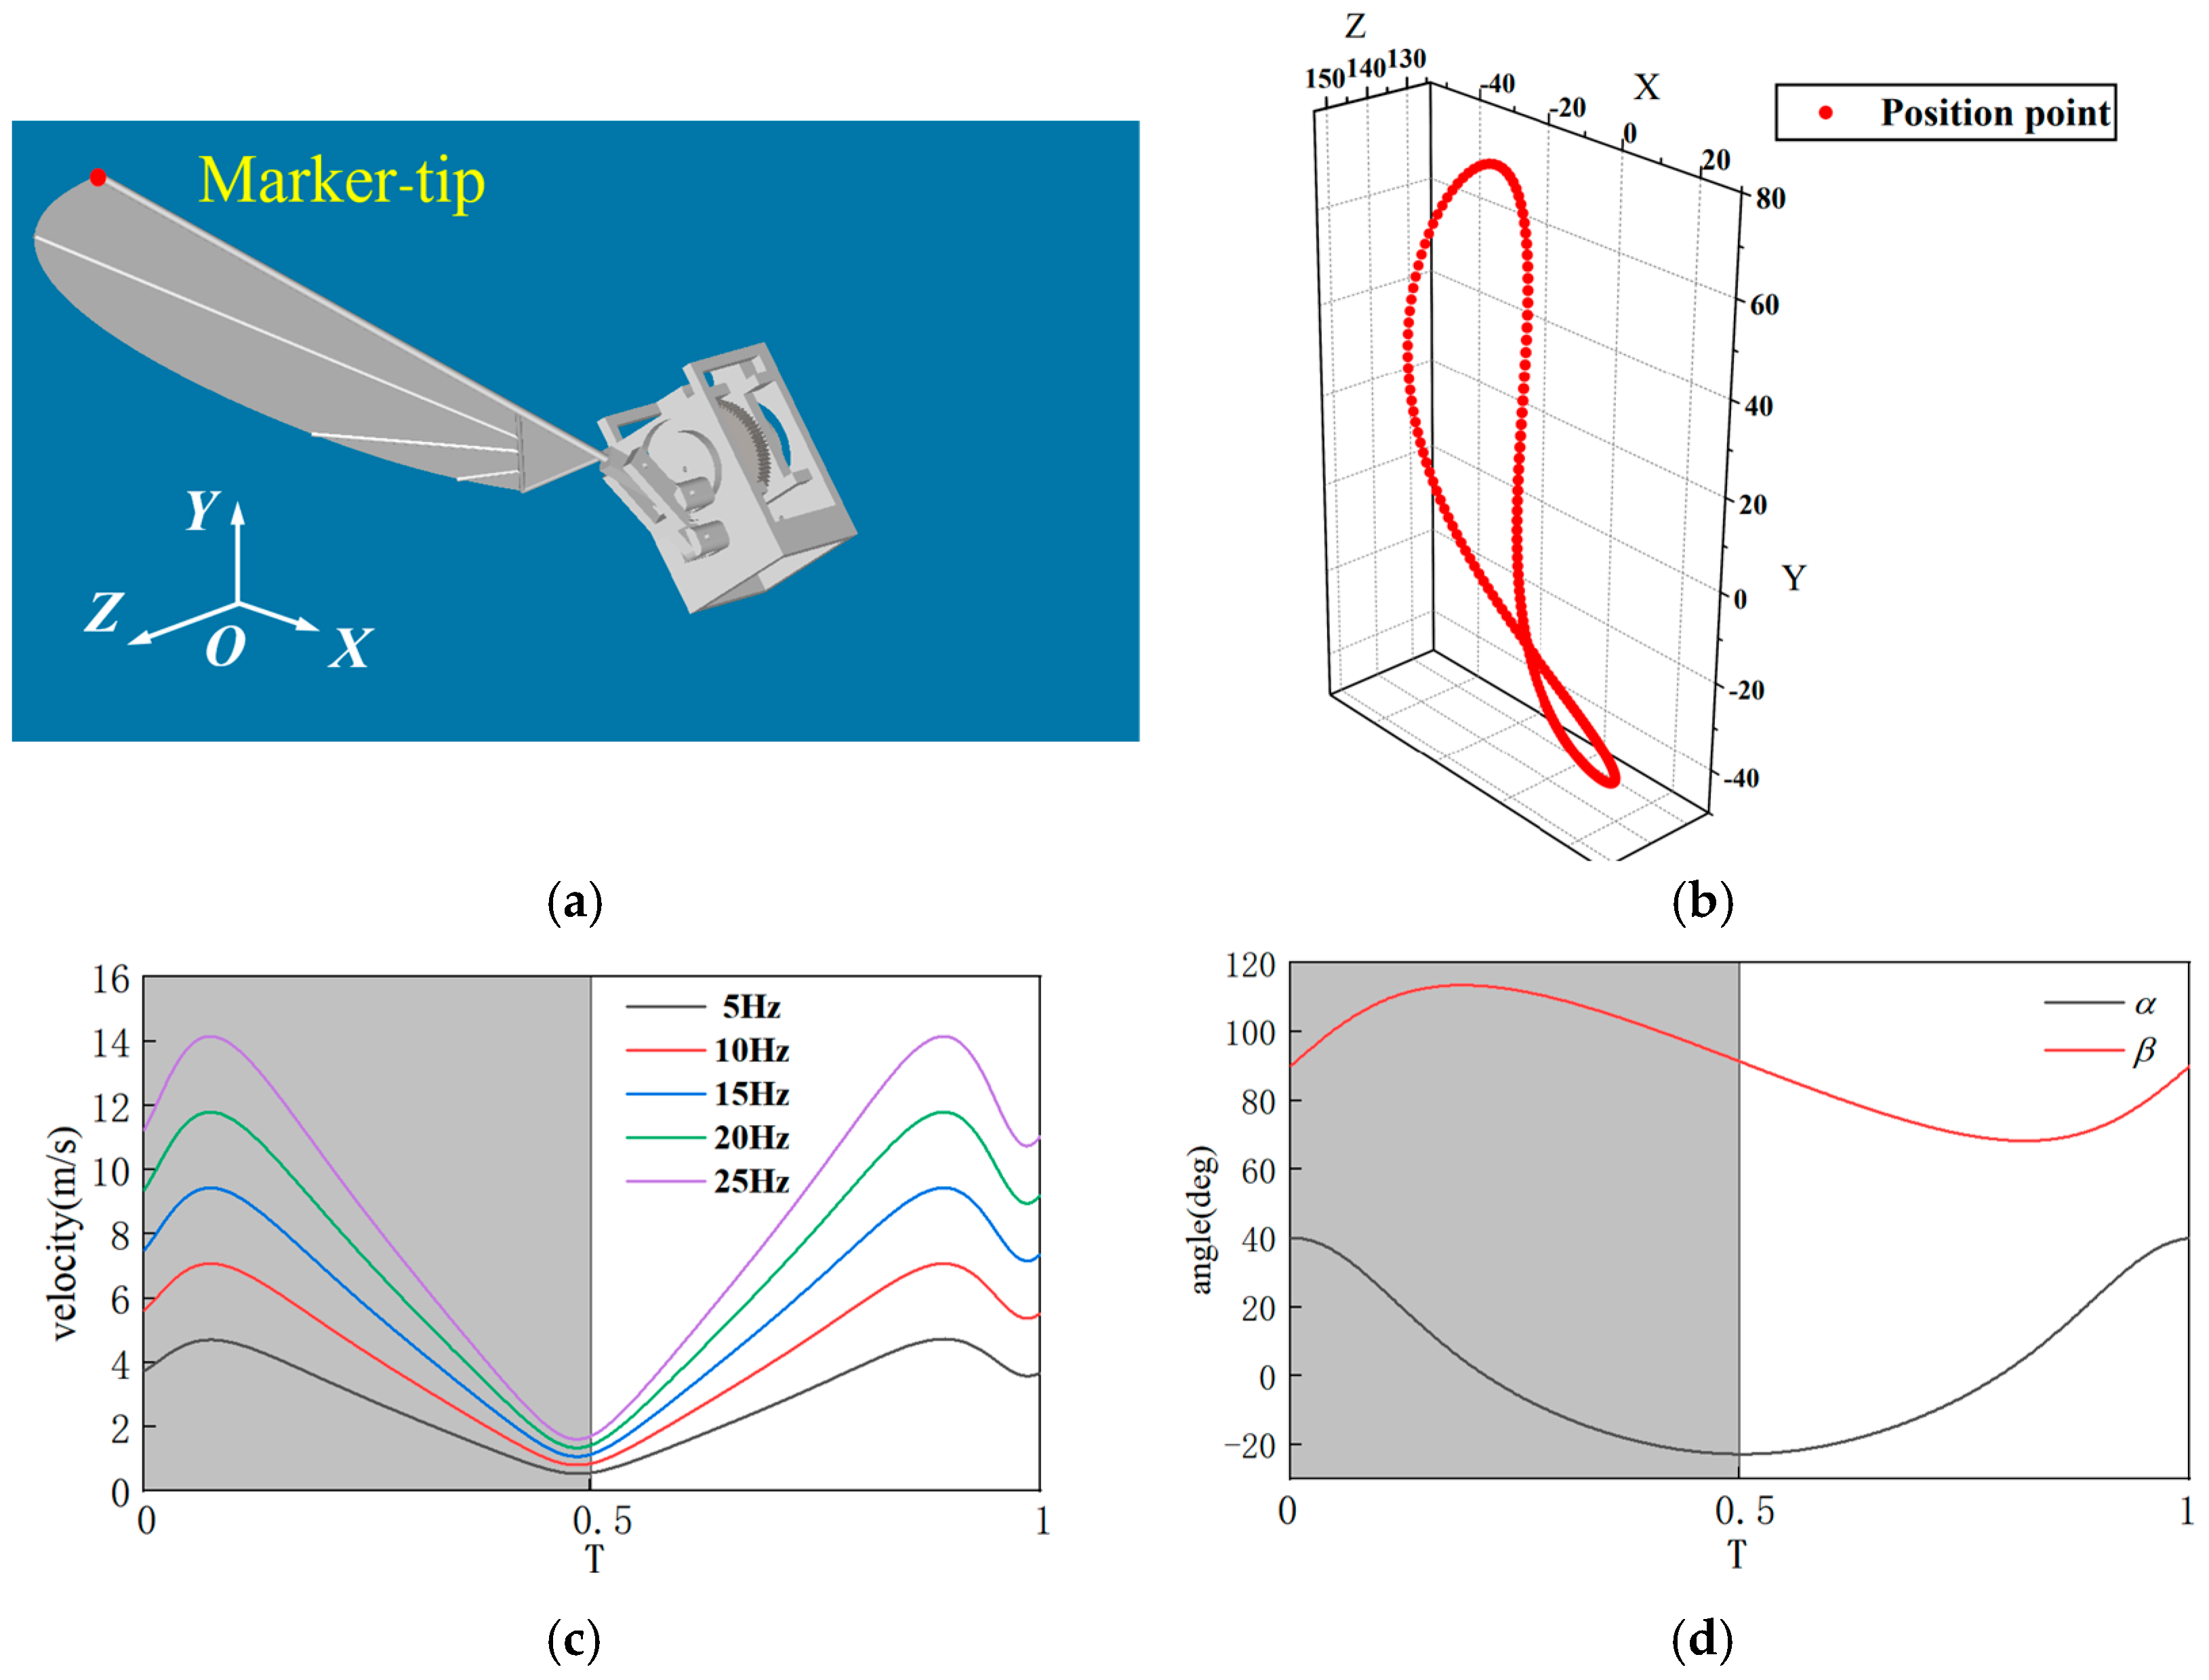
32]. Based on these definitions, aerodynamic analysis is conducted in Adams (2019, 64bit) , with the right wingtip marker defined as Marker-tip, as shown in
Figure 9a. To better observe the variation of aerodynamic forces during the cycle, the time
T is defined in a dimensionless form. It is specified as the time (t) after the start of the wing’s flapping motion, normalized relative to the duration of a full motion cycle. For example,
T = 0–0.5 represents the downstroke phase, while
T = 0.5–1 represents the upstroke phase.
The “8”-shaped flapping of dragonfly wings is a sophisticated adaptive strategy formed over billions of years of evolution. Du and Sun [
33] showed that dragonflies follow an “8”-shaped movement pattern. During the downstroke stage of their wings, the movement of the flapping wings is almost parallel to the direction of gravity, which can generate a large lift force to overcome gravity and fly. In the upstroke stage, the movement of the flapping wings is almost parallel to the horizontal plane, which can generate a large thrust force to make them fly forward. Through vortex control, energy recovery and movement flexibility, it perfectly balances lift demand and energy consumption. This mechanism not only reveals the physical nature of biological flight, but also provides important inspiration for human engineering. Through Adams motion simulation, the wingtip trajectory of the flapping-wing mechanism is obtained, as shown in
Figure 9b. From the simulation results in
Figure 9b, it can be seen that the wingtip trajectory forms an approximately three-dimensional “8” shape, which is consistent with the real flapping motion trajectory, indicating that the model exhibits good biomimetic performance. To ensure Reynolds number similarity, it is necessary to determine the flapping frequency. Under the specified motion pattern, a stable motion cycle is selected, and the flapping frequency
is set between 5 and 20 Hz. The velocity curve of the Marker-tip is shown in
Figure 9c. Using Equations (2) and (3),
Re of the flapping motion at 20 Hz is calculated as 1648, and
is calculated as 0.13. In actual observations,
Re of dragonfly flight ranges from 1000 to 2000, and
of dragonfly flight ranges from 0.11 to 0.15 [
34]. Therefore, under this motion pattern,
Re and
of the flapping wing matches the observed values, ensuring that the flow field generated by the model flapping wing is similar to that of a real dragonfly. Additionally, the motion curves of the stroke angle
and pitch angle
are calculated, as shown in
Figure 9d. The variation patterns of
and
align with the set parameters, verifying the rationality of the mechanism design.
2.4. Experimental Measurement
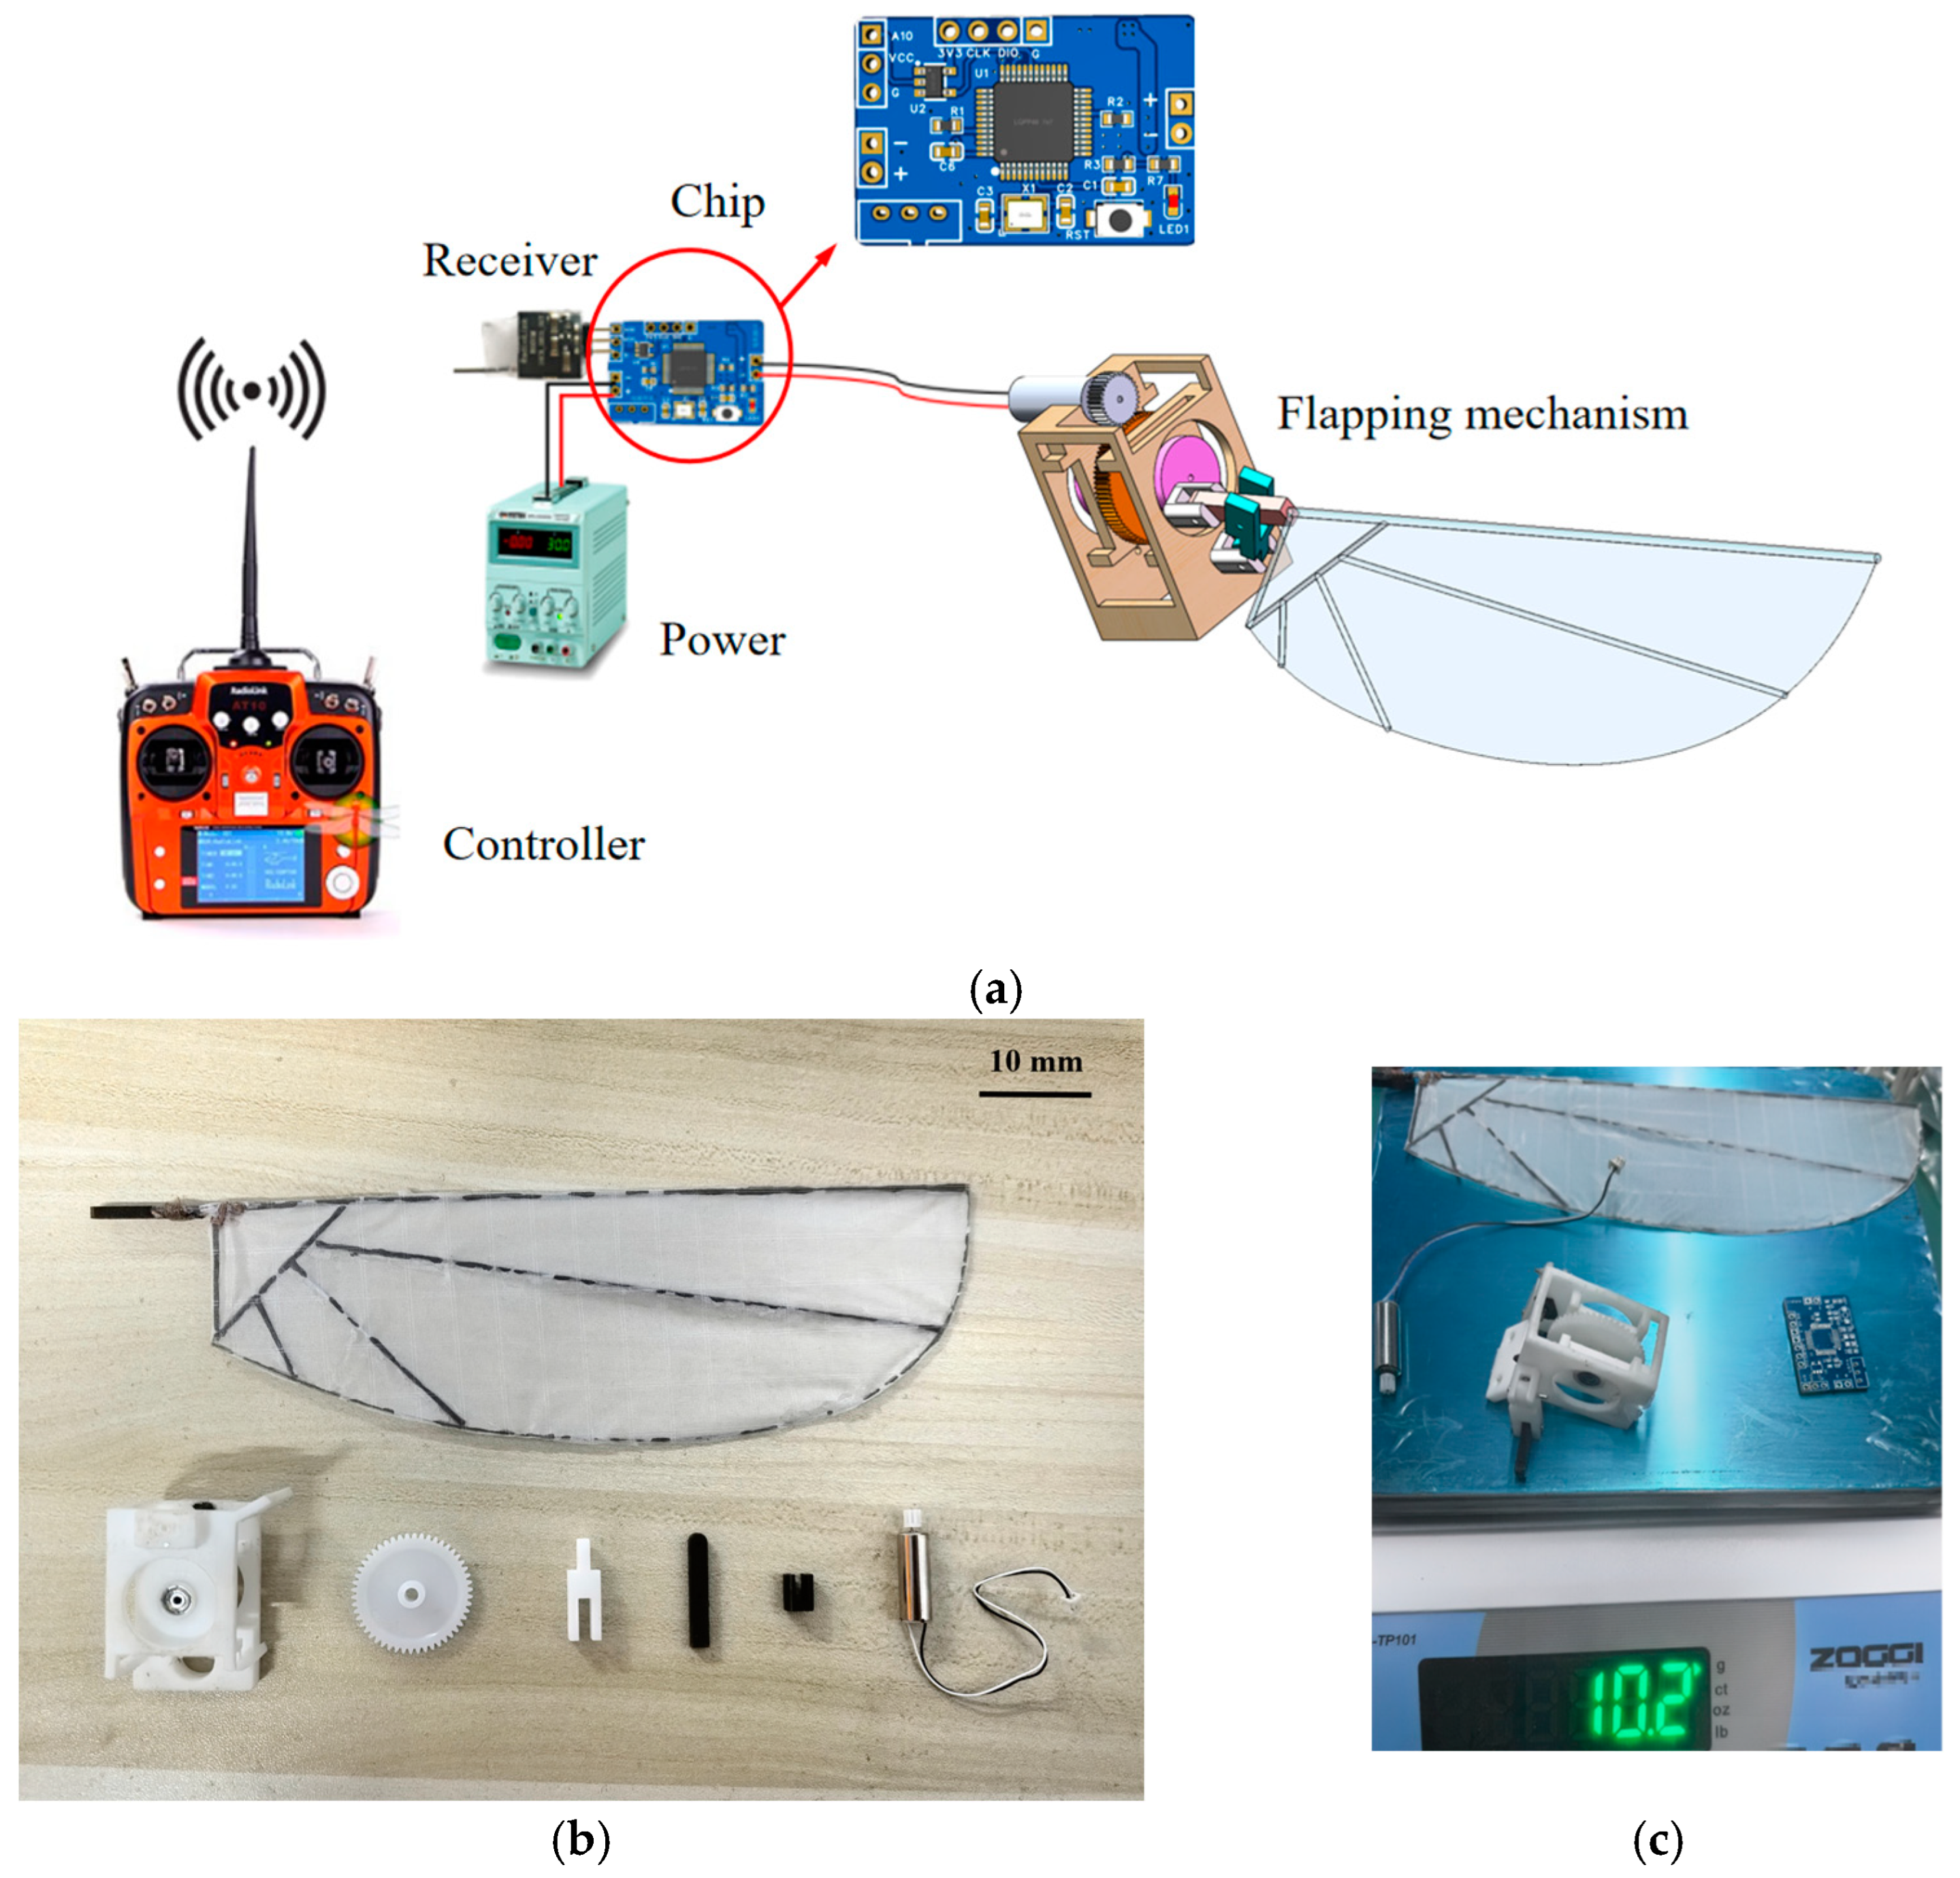
To reduce weight and ensure structural rigidity, most parts in this design are manufactured using PE material, while the gears are 3D-printed from plastic. The flapping wings use P31N thin film as the membrane, with carbon fiber rods serving as the framework, fixed at the joints with adhesive. The connection process primarily employs pin connections and mechanical fasteners. The control system uses a custom-designed integrated circuit chip, including a motor drive module, a receiver serial port module, and a voltage module. The control chip operates at a maximum voltage of 7.4 V and a maximum current of 2 A, with the entire system powered by a stable 3.7 V DC power source. A schematic diagram of the control system is shown in
Figure 10a. Based on the simulation results of the flapping mechanism discussed earlier, this study employs a hollow-cup motor with a mass of only 2 g, a no-load speed of 48,000 r/min, a no-load current of 70 mA, and a rated voltage of 3.7 V. Examples of the parts are shown in
Figure 10b, and the total weight of the flapping-wing mechanism is 10.2 g, as shown in
Figure 10c. To avoid interference in the flapping wing’s flow field caused by environmental changes, the motor’s start and stop operations are controlled via a remote controller that sends signals to the receiver.
In this experiment, a specific model of a three-dimensional force sensor with a measurement range of −50 N to 50 N was used. Before conducting the experiment, the sensor was calibrated by applying known loads to establish the relationship between the displayed voltage values and the actual applied forces.
Table 1 presents the calibration data of the sensor.
The relationship between the loading output voltage and the pressure values along the three axes is derived from the table, as follows:
where
represents the actual displayed voltage (V), and
represents the measured force (N). When the sensor is under tension, both the standard pressure value and the loaded output voltage are positive, but the linear relationship remains unchanged. Using the derived calibration formula and the actual measured voltage values along the X-axis and Y-axis, the thrust and lift on the X-axis and Y-axis are calculated. The error estimation in this experiment is performed at a 95% confidence level, and the error consists of two components: accuracy error
and offset error
[
35,
36]. The main error in this experiment is the offset error. Assuming that the measurement variables
have
offset error limit, the offset error limit for the variable
is calculated as the root mean square of each offset error limit
:
Based on the previous calculation criteria of the experimental bench error [
28], in this experiment, the offset error consists of the following components: the stroke plane angle, the stroke angle, the pitch angle, the sensor measurement accuracy, data acquisition system, and data processing errors. The offset error of the stroke plane angle is caused by the resolution of the angle scale during the installation and calibration process, with a precision of 1°. Therefore, the offset error for the stroke plane angle is 1°/360° = 0.278%. For the data acquisition system, the system resolution used in this experiment is 16 bits, resulting in an error of 1/2
16 = 0.0015%. The offset error from the data processing system is due to rounding errors during numerical calculations, with the software used in this experiment achieving a precision of 64 bits. The rounding error of 1/2
64 = 10
−20% can be neglected. The accuracy of the transmission mechanism control is maintained at 0.1% for the measurements in the X’, Y’, and Z’ directions. Additionally, the offset error for the stroke angle is 0.98%, and that for the pitch angle is 0.75%. During the experiment, the ambient temperature variation was within 20 °C ± 2 °C. Based on the above information and the definition of offset error, the total offset error of the system is determined to be 1.277%. The previous offset error of the force measurement platform of our team was 1.43% [
28]. Currently, if the offset error of the force measurement platform is controlled within 5%, it can be considered that the accuracy of the force measurement platform has reached a relatively advanced level [
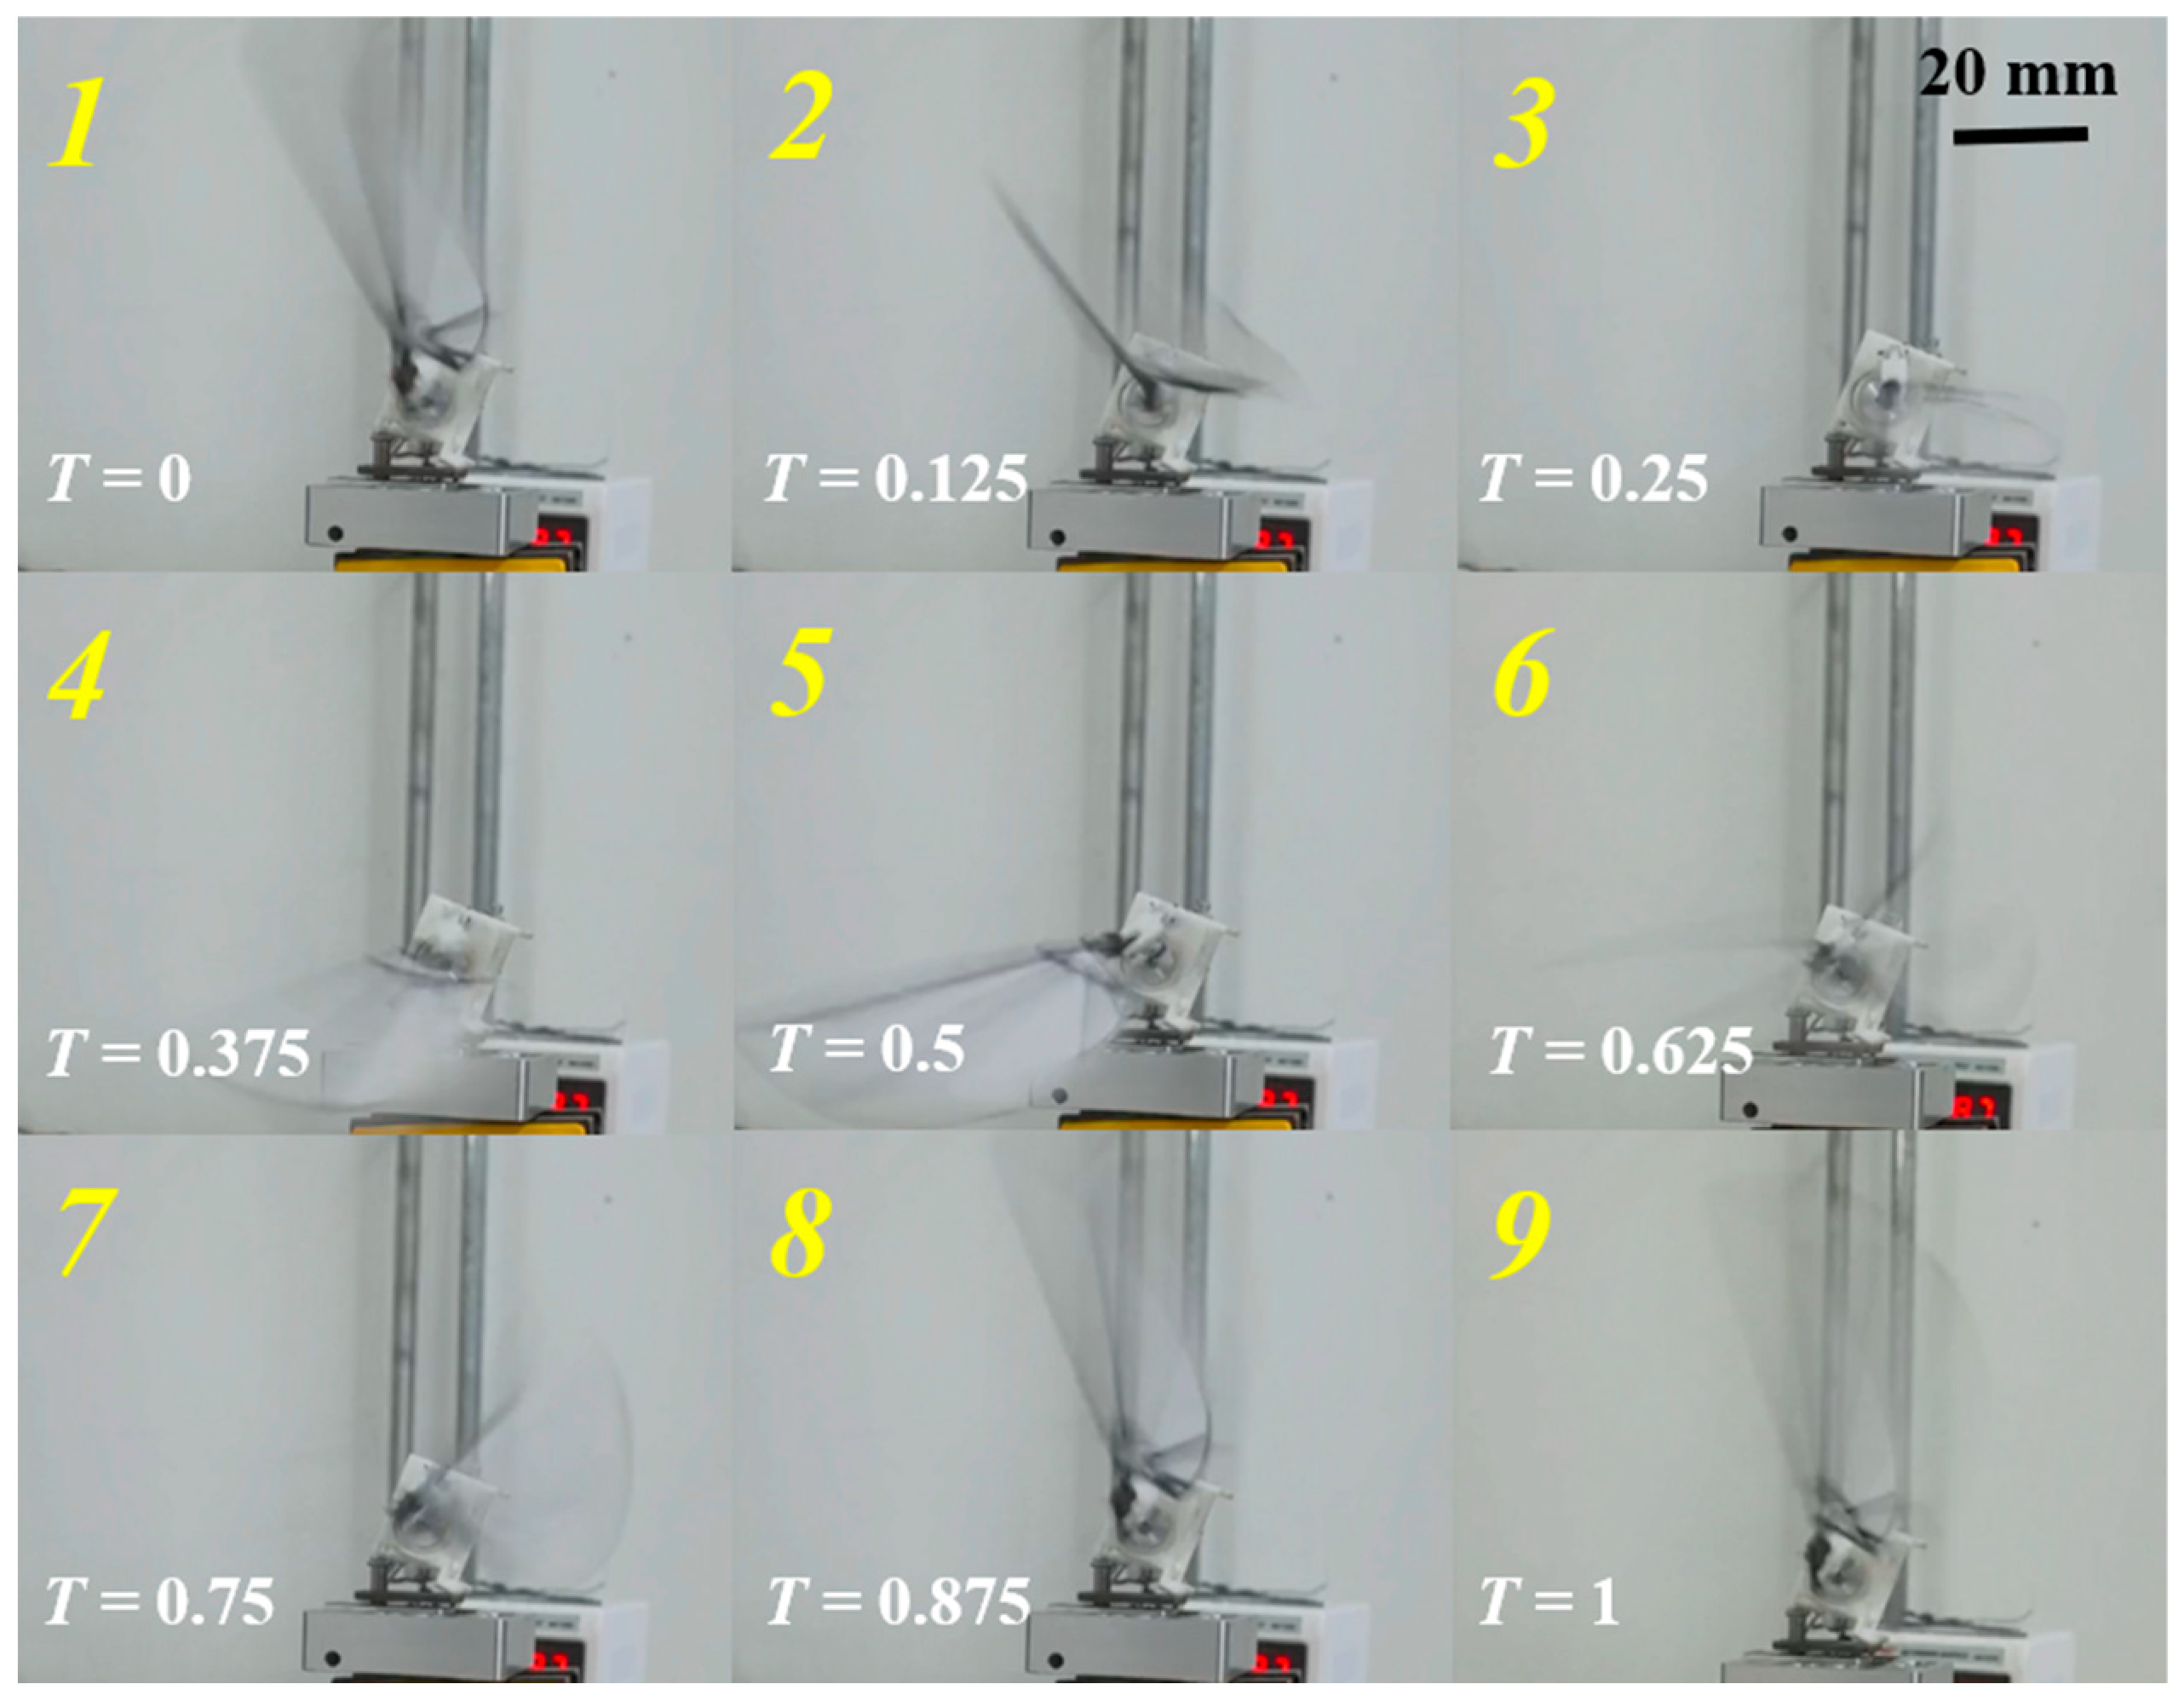
37]. Therefore, the uncertainty of the experimental setup is confirmed to meet the requirements of the experiment. The flapping-wing mechanism was assembled and mounted onto the force measurement platform, with motion images captured during the process. When fixing the flapping wing, care was taken to align the center of mass of the flapping mechanism with the center of the three-dimensional force sensor along the vertical direction. This alignment was intended to ensure that the measured lift varied along the vertical direction, and the thrust varied along the horizontal direction, minimizing errors caused by the torque generated due to the offset of the mechanism’s center of mass. This setup ensured that both the flapping-wing prototype and the three-dimensional force sensor were securely fixed on the test platform. The fixation of the three-dimensional force sensor and the flapping mechanism is shown in
Figure 11. Here, the Y-axis is the vertical direction, with the positive Y-axis pointing downward. When the voltage output along the Y-axis is negative, it indicates that the flapping wing has generated positive lift.
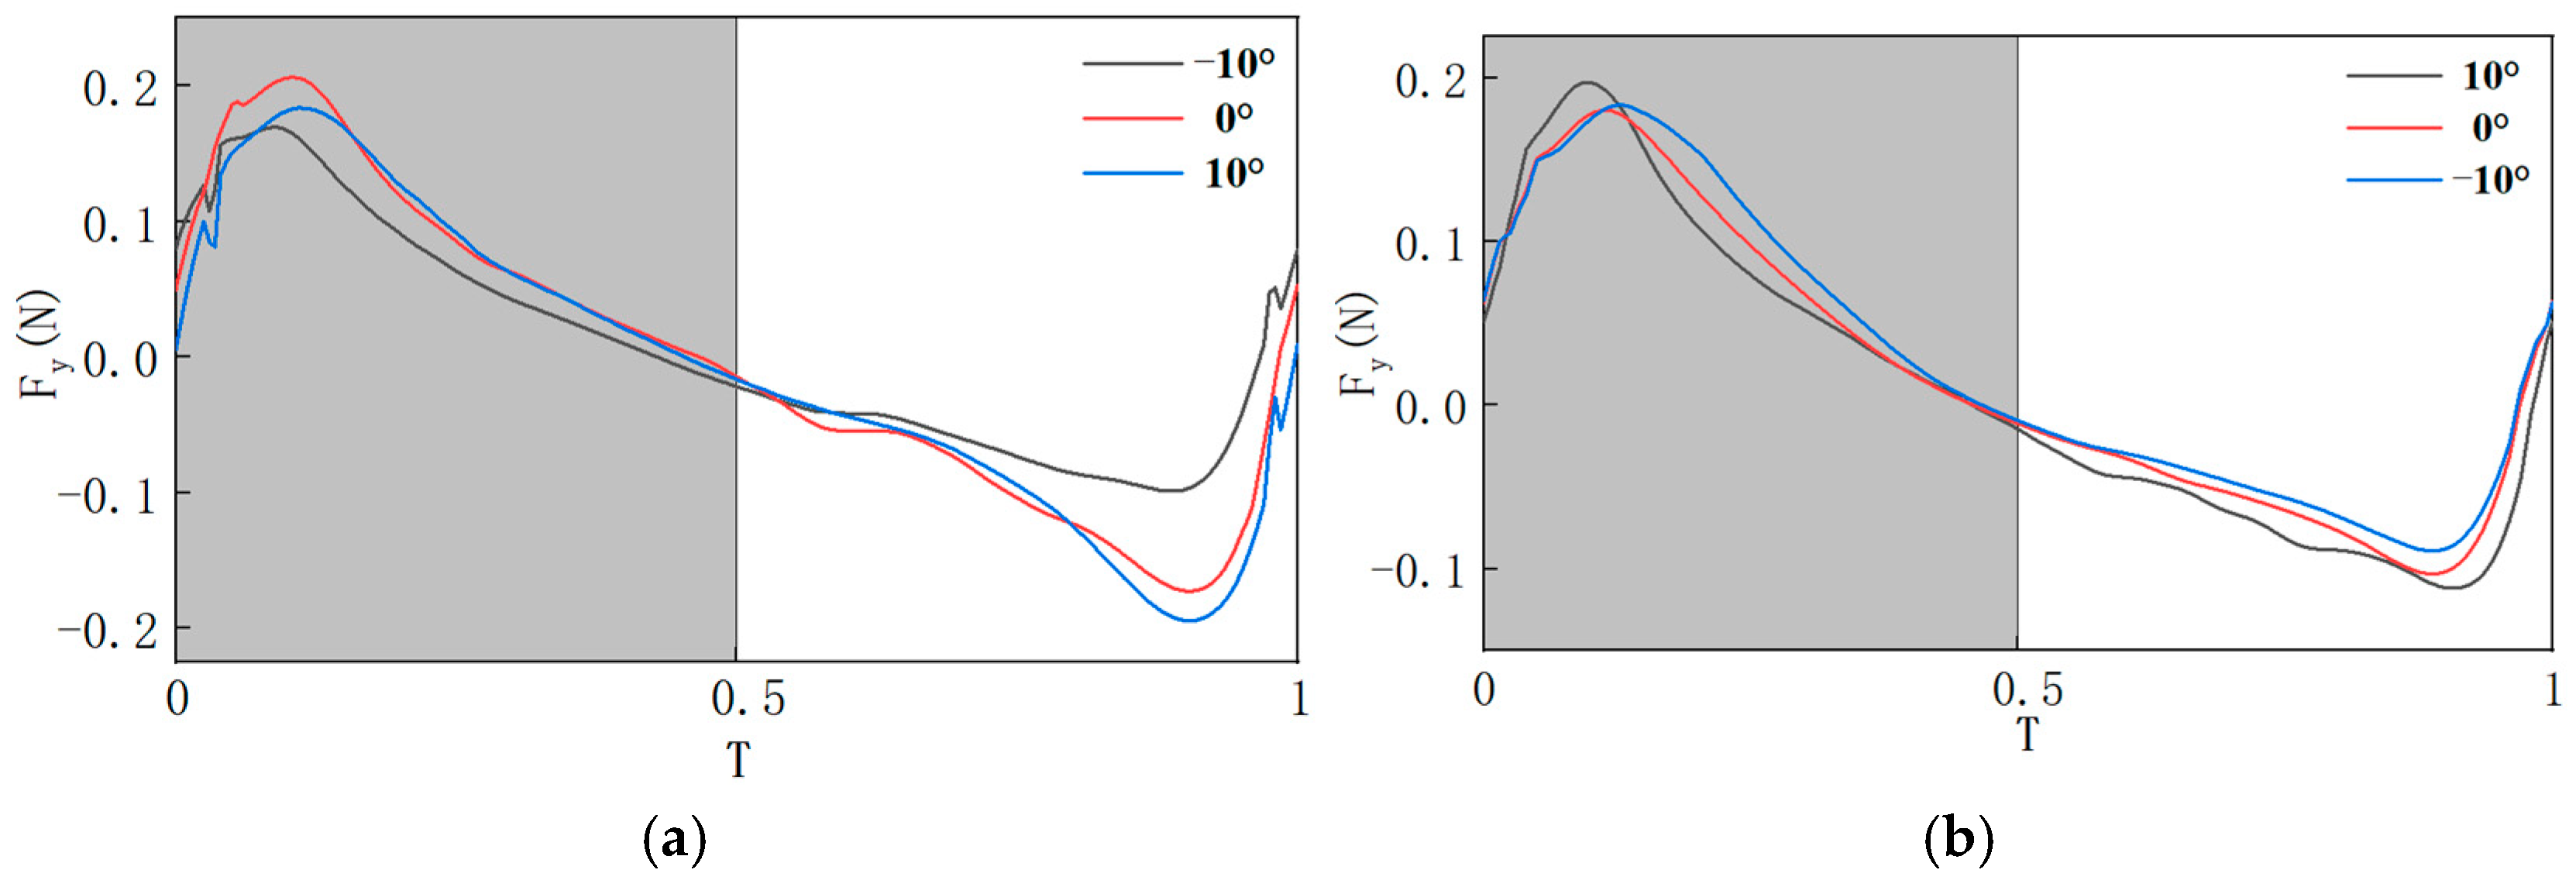
When designing the flapping-wing mechanism, lift is often the primary focus for researchers. Therefore, this experiment primarily investigates the variation pattern of lift during the experimental process. To preliminarily explore the impact of the pitch deviation angle
and the stroke midpoint angle
on the aerodynamic forces of the flapping wing, mechanical tests were conducted on the motion of a single wing of the flapping mechanism. According to the designed mechanism dimensions, the adjustment ranges of both
and
are −10° to 10°. Therefore, −10°, 0°, and 10° are selected as experimental parameters to verify the aerodynamic force variation law at the limit position. Meanwhile, in this study, 5° difference was also selected as an experimental parameter for analysis, and it was found that the obtained aerodynamic characteristic laws were similar to that at 10° difference, and the laws were more obvious when changing at 10° difference, so 10° difference was selected as the experimental parameter. Two sets of experiments were designed, and the parameters for both experimental groups are listed in
Table 2.
2.5. Simulation Setup
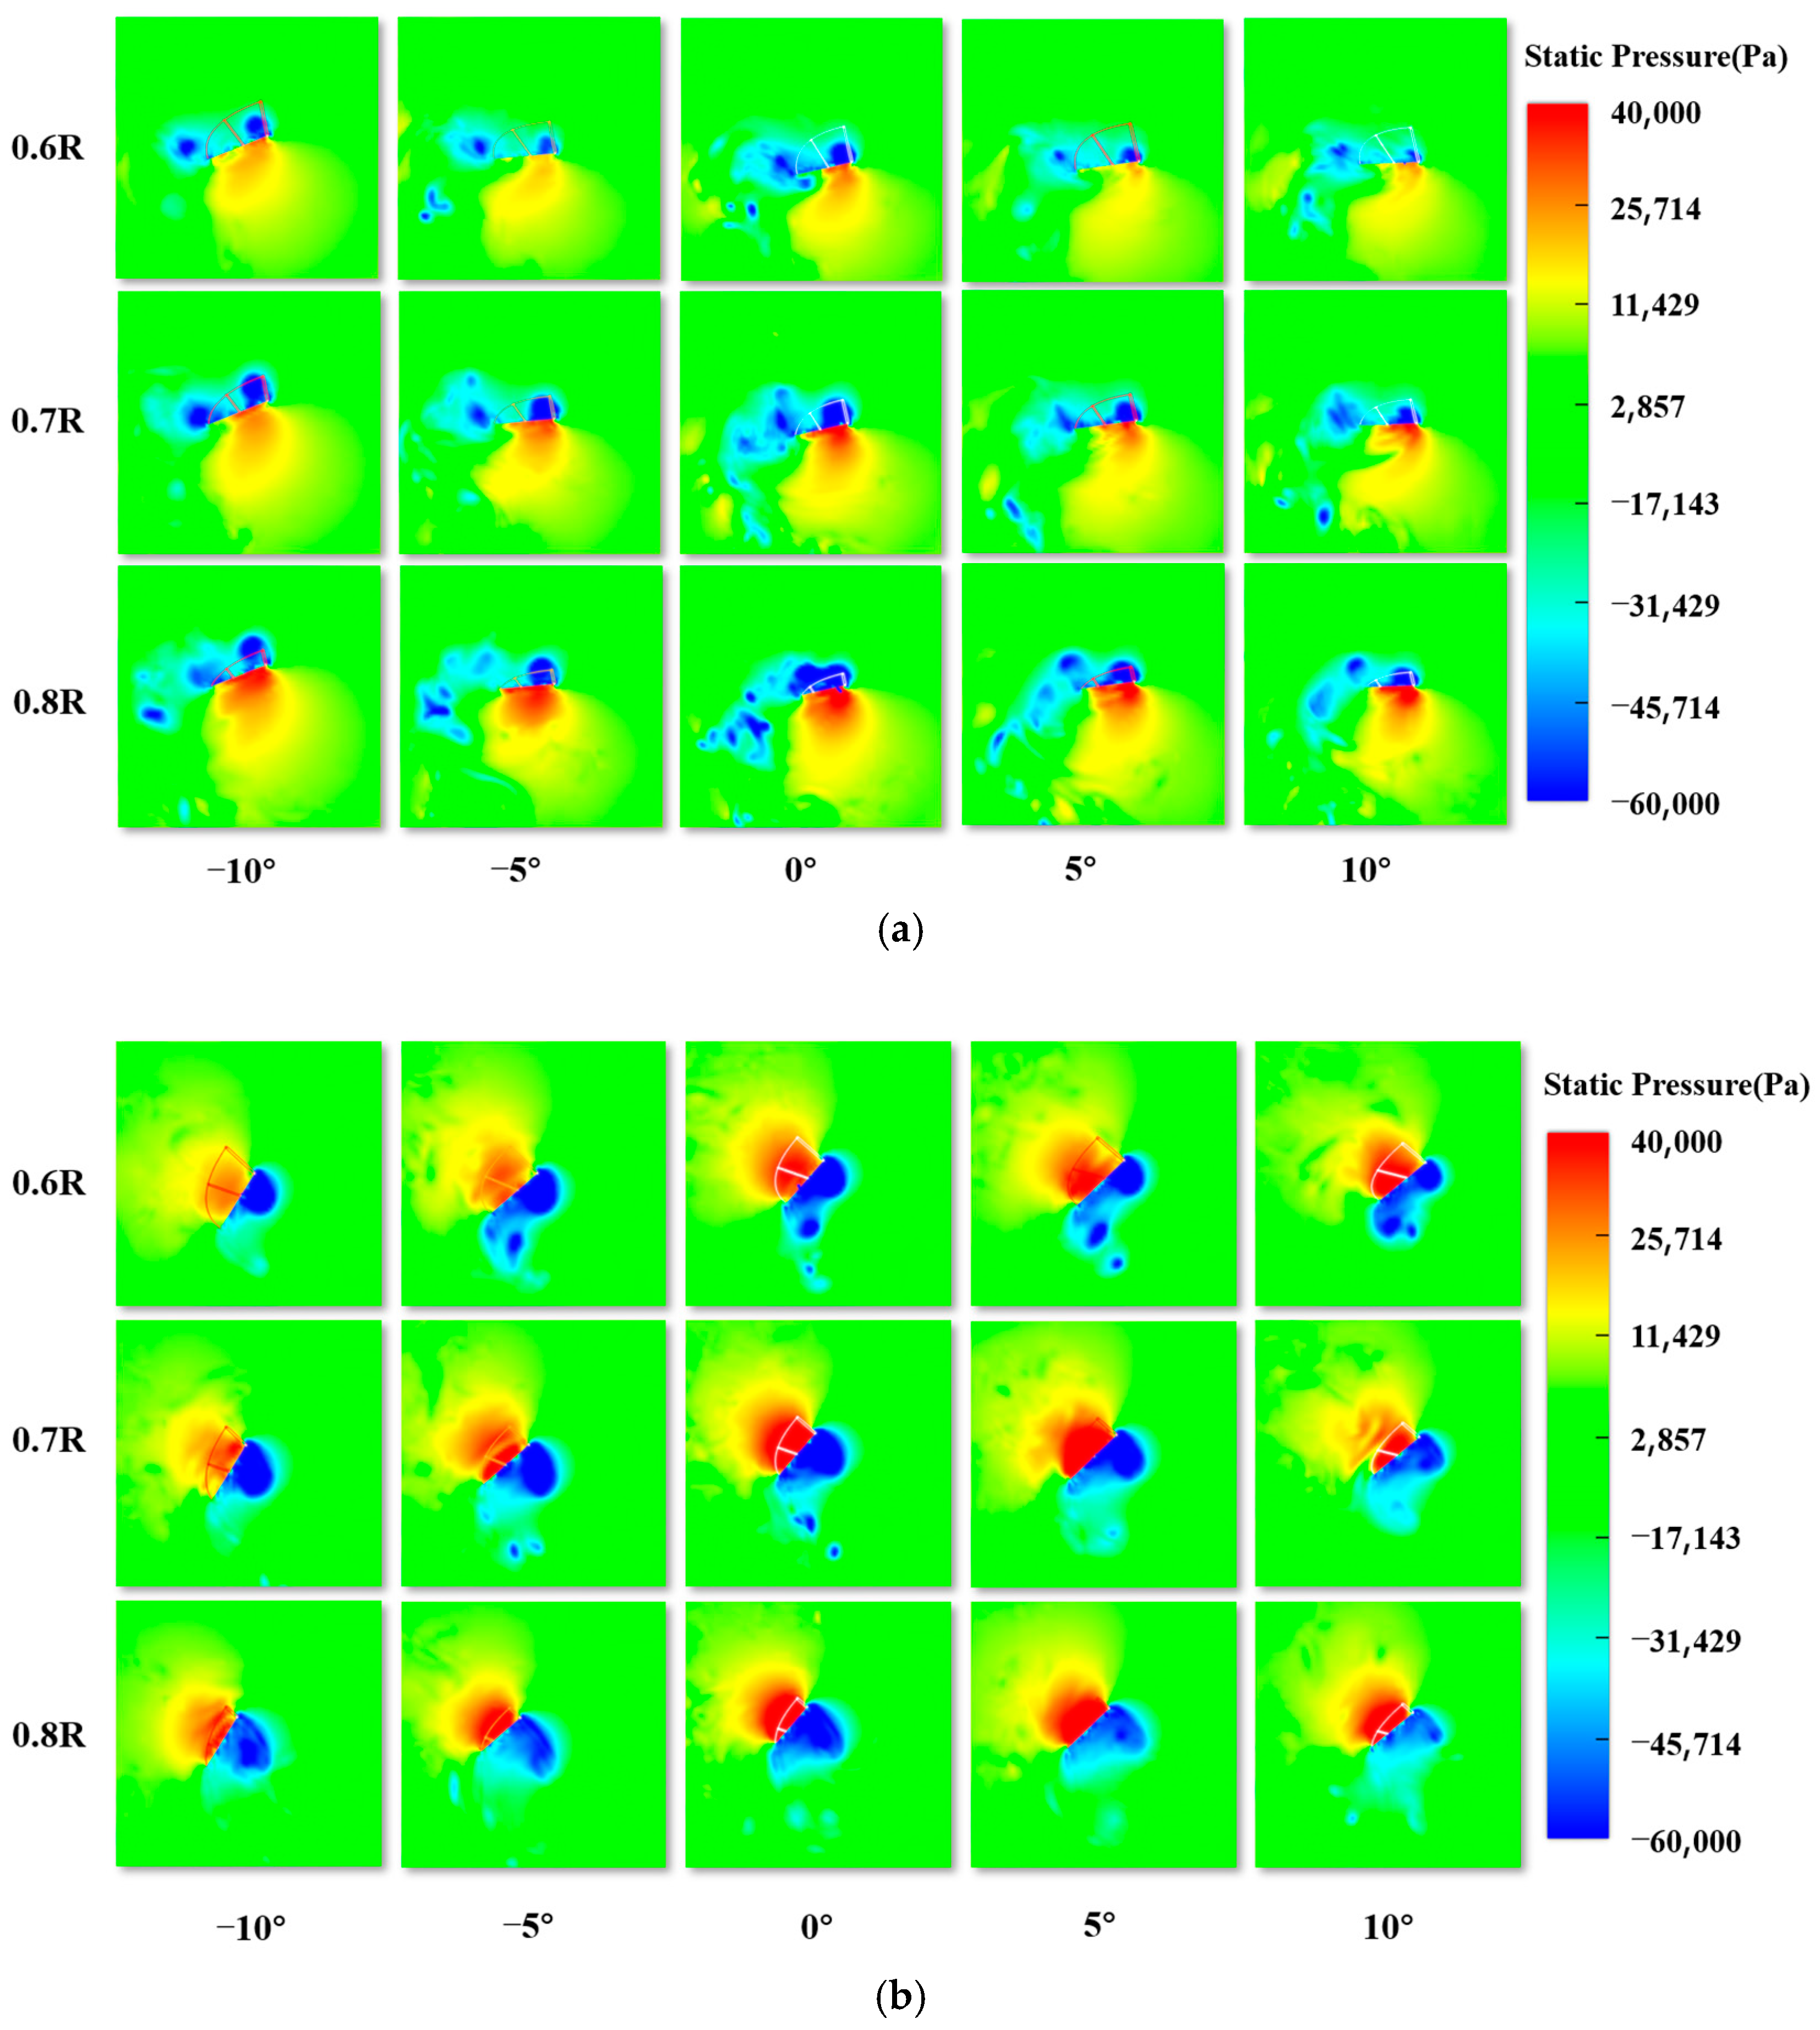
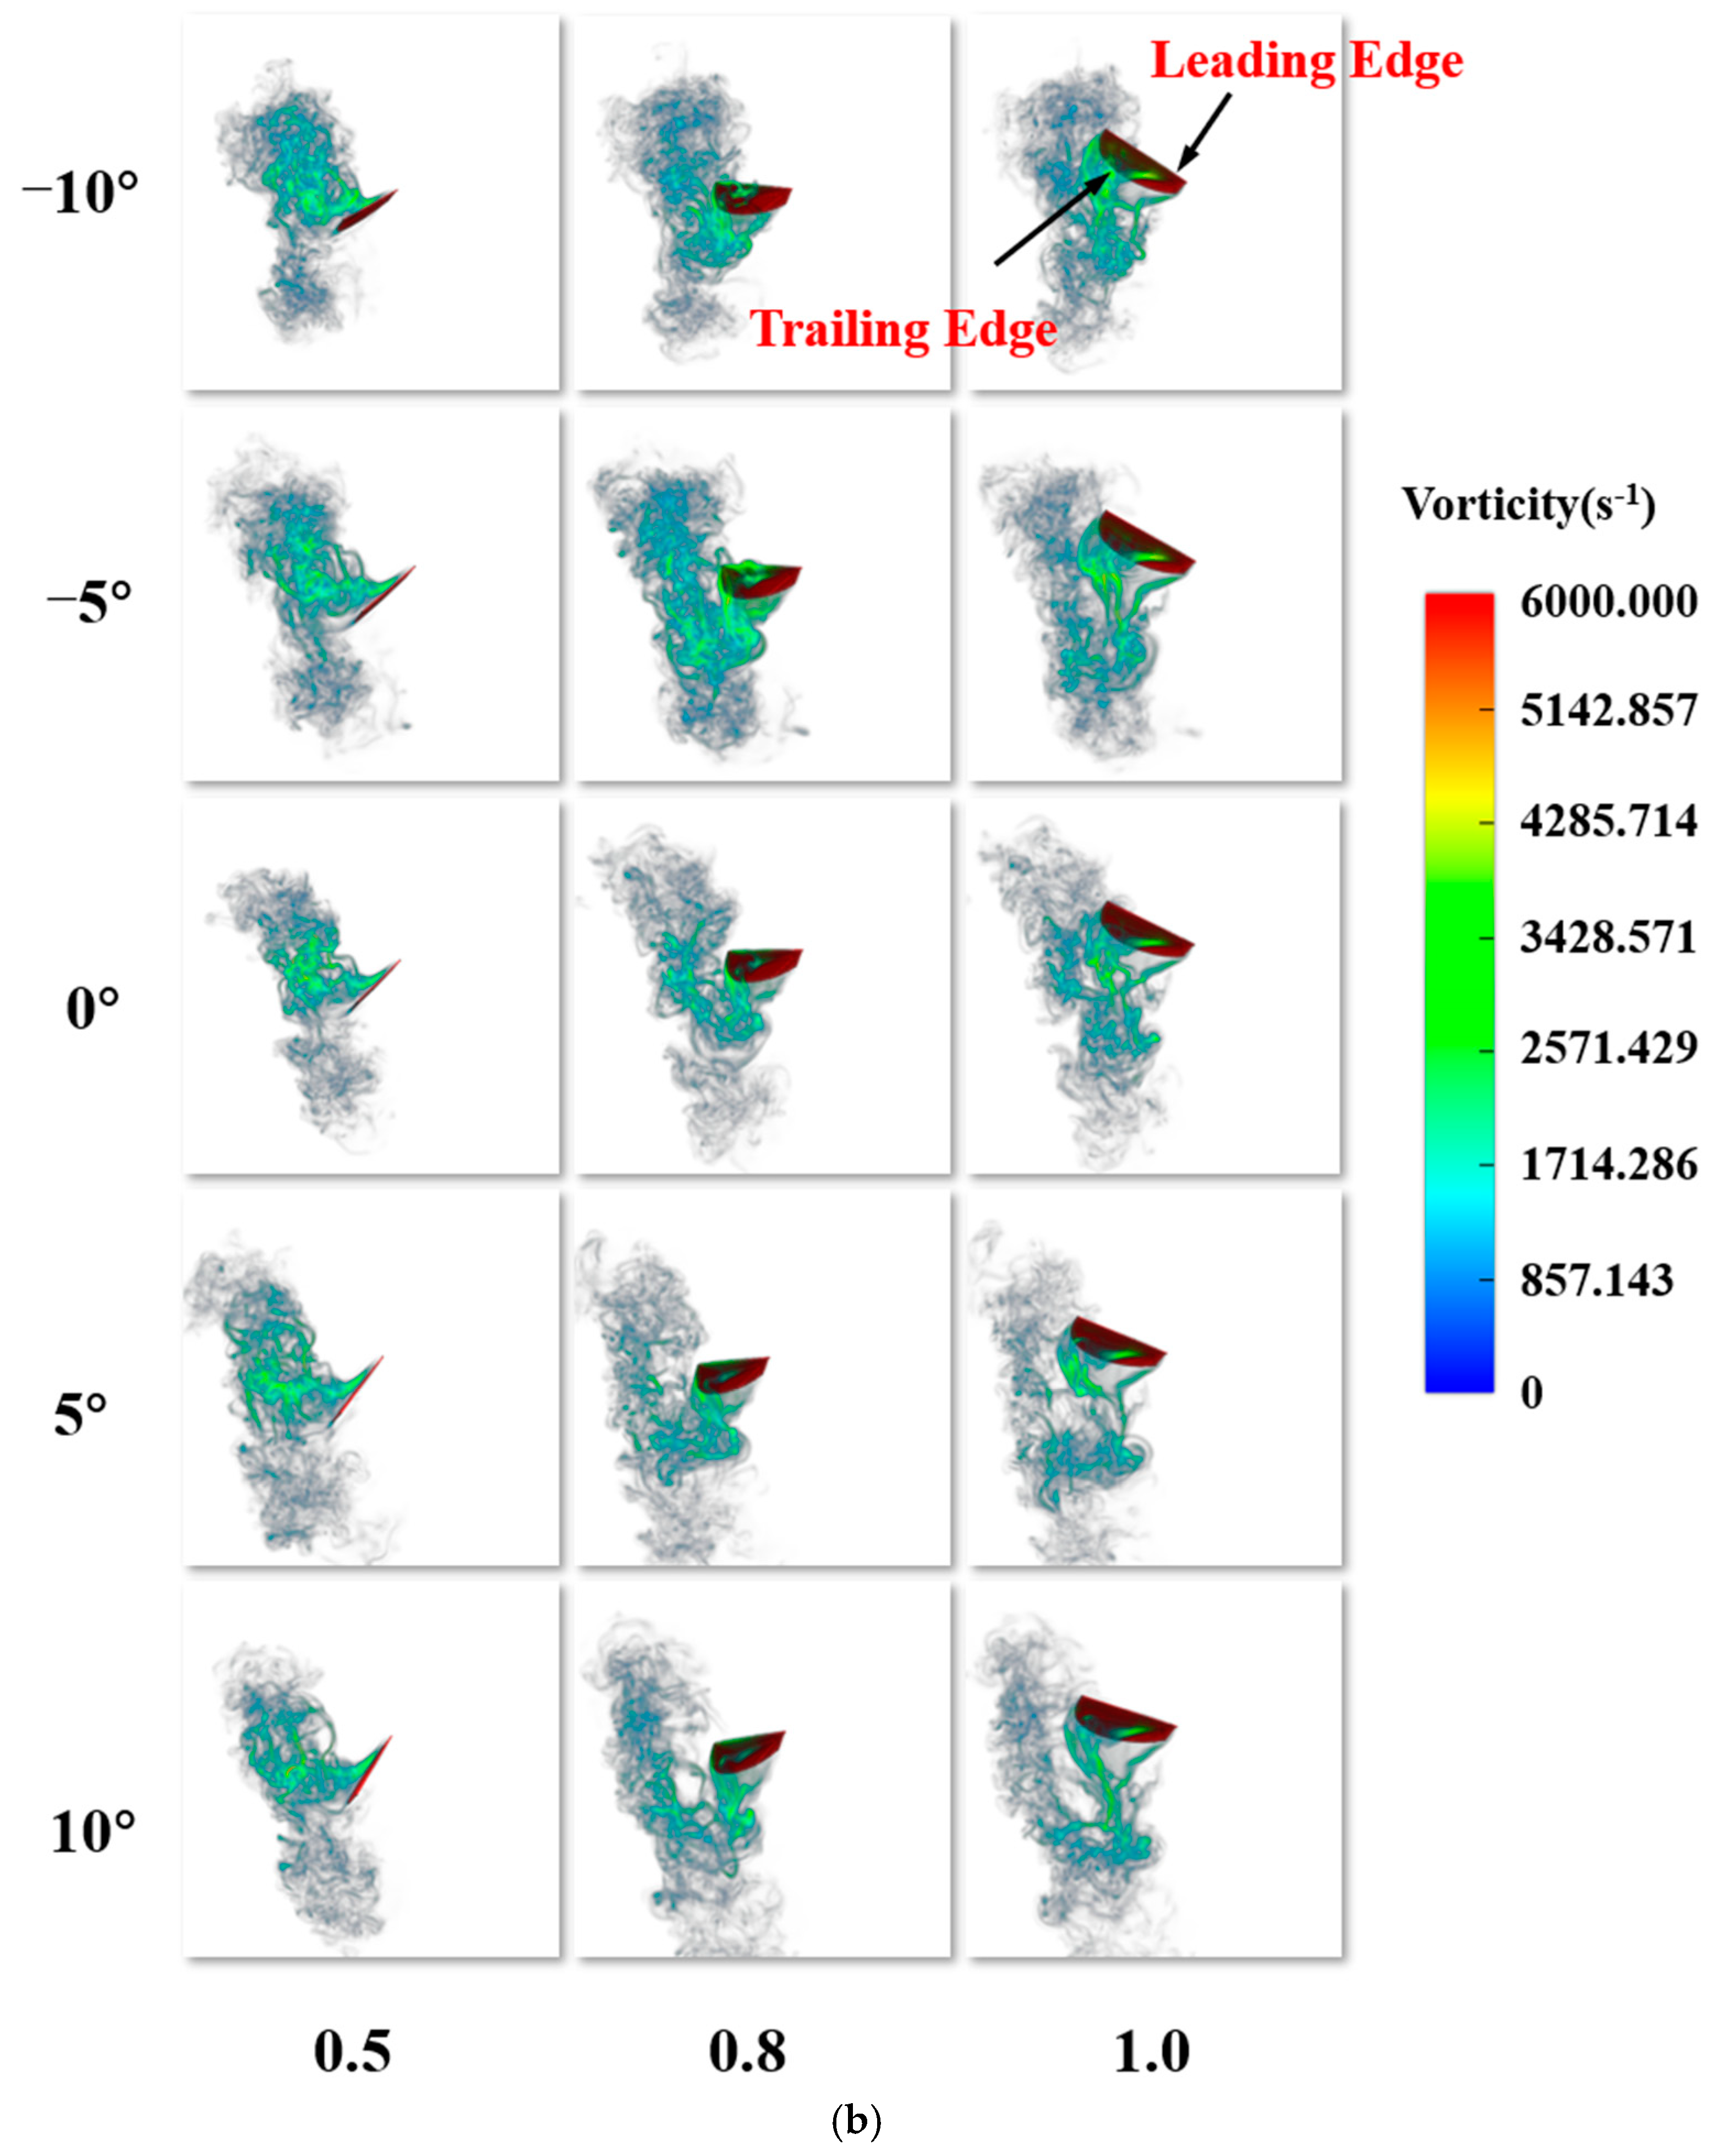
The experimental results obtained can measure the aerodynamic performance of the flapping-wing mechanism on a macro scale. To explore the deeper principles, numerical simulation is needed to analyze the flow field structure. At the same time, the results of numerical simulation can guide the construction of the actual model. The fluid motion around the flapping wing is a low Reynolds number flow. This paper adopts a smooth rigid wing model and focuses on the unsteady aerodynamic mechanism caused by the asymmetric motion of the flapping wing, ignoring the development of smaller-scale vortices caused by the wing structure [
38]. Therefore, in the subsequent analysis, the focus is on the influence of the LEV and the TEV on the unsteady aerodynamic force in the flapping-wing motion. This paper uses Adams 16.0 and XFlow 2020 for collaborative simulation to analyze the aerodynamic characteristics of the bionic flapping-wing aircraft. Through interface data transmission, repeated definition and programming can be avoided, the calculation accuracy can be improved, and time and manpower can be saved [
39]. XFlow is a commercial fluid simulation software which uses the lattice Boltzmann method [
40,
41,
42,
43].
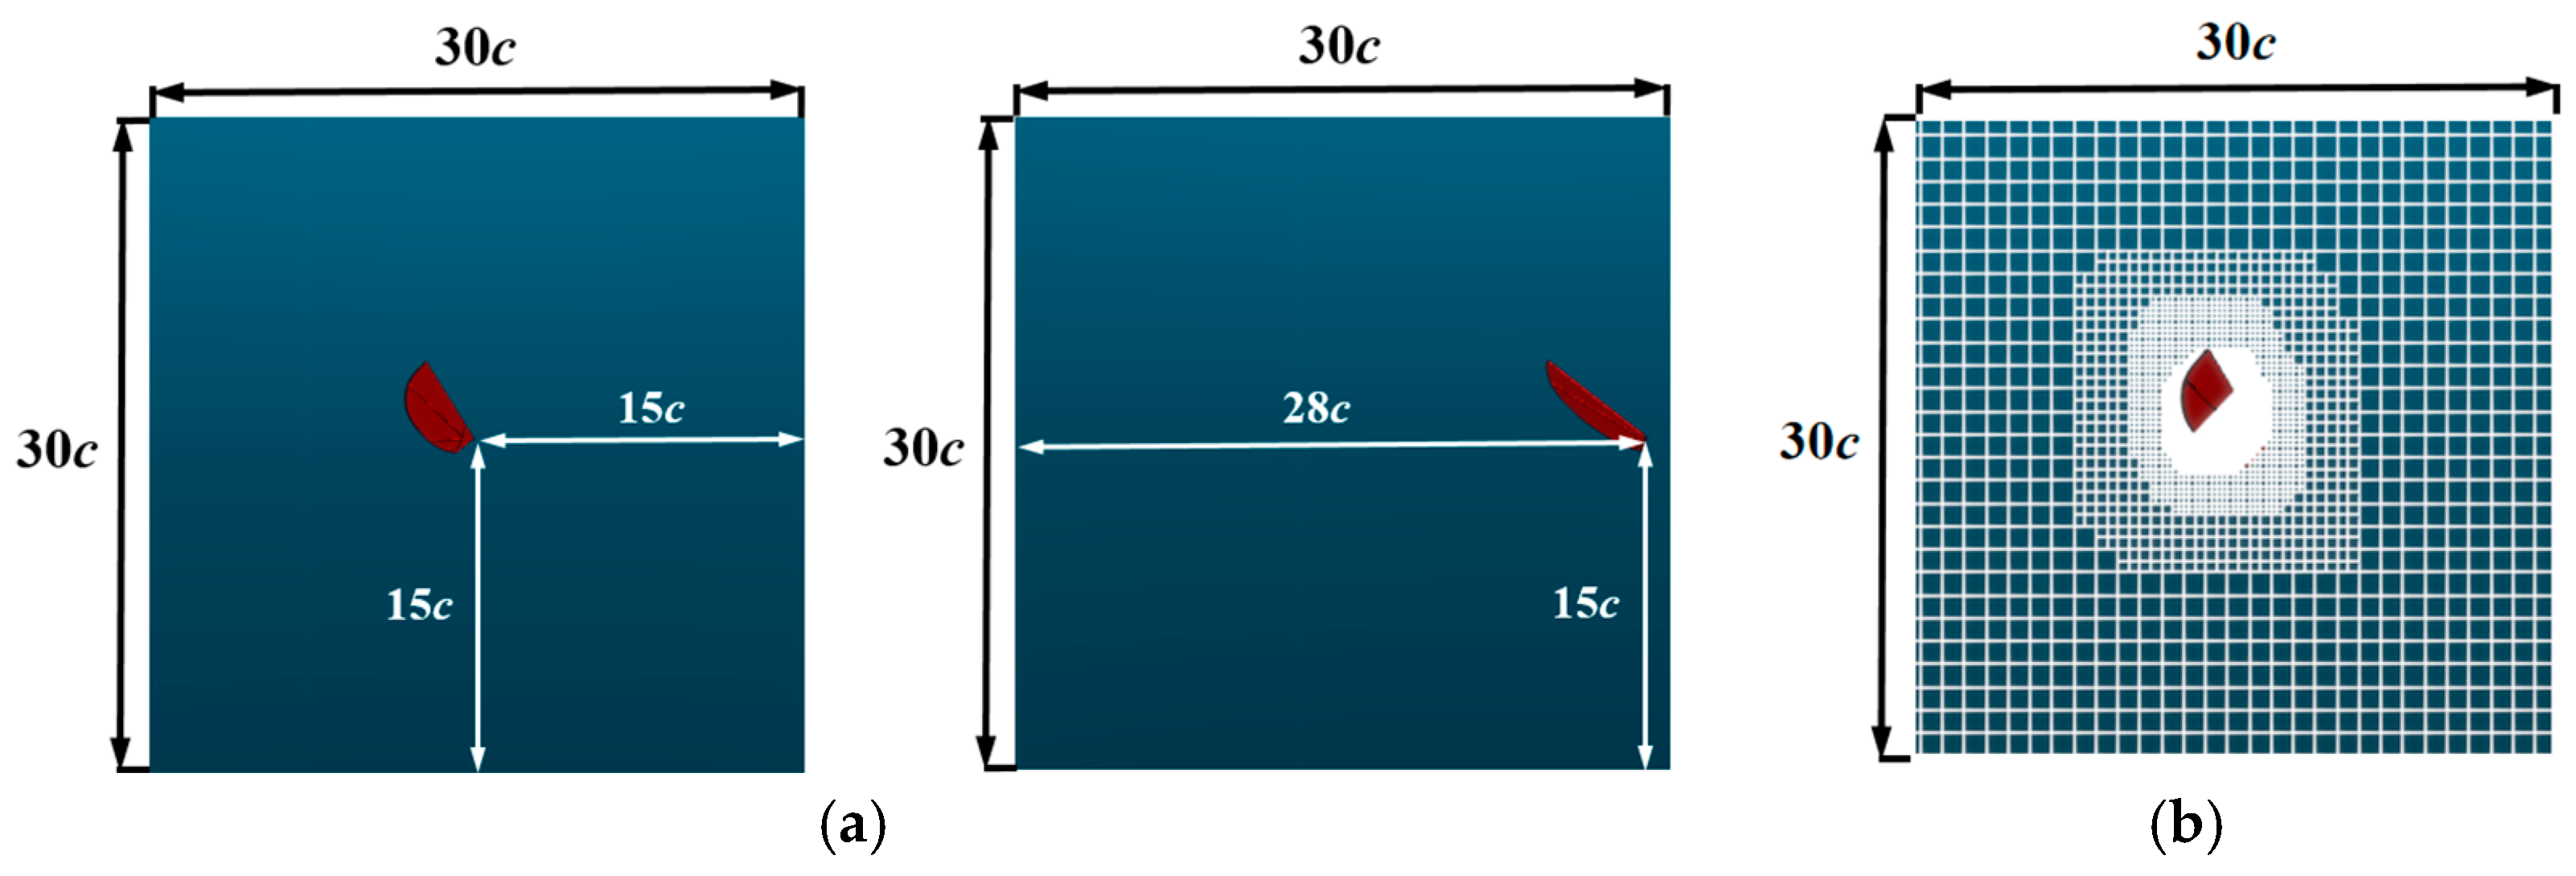
To avoid changes in the motion pattern due to flexible deformation, the influence of a single variable is studied, and the flapping wing is set to be rigid. To eliminate external environmental influences on the aerodynamic characteristics of the flapping wing, adaptive trajectory improvement and wake enhancement are employed in the simulation. The medium of the virtual wind tunnel is set to air, with a flow velocity of 0 m/s, a temperature of 289.15 K, fluid density of 1.23 kg/m3, coefficient of dynamic viscosity of 1.79 × 10⁻⁵ pa∙s, gravitational acceleration of −9.81 m/s2, and the wind tunnel outlet pressure set to 0 pa. The wall-relative slip is set to 0. When determining the computational domain and boundary conditions, the virtual wind tunnel is chosen as the computational domain type, and its size is optimized. A computational domain that is too small would limit the aerodynamic influence of the flapping wing, resulting in inaccurate results, while an excessively large domain would reduce simulation accuracy and increase computation time. After a comprehensive evaluation, only the right-wing model was retained in the simulation model to avoid wall effects.
In the previous work by our team, the accuracy verification and grid independence verification of the numerical simulation method were completed [
21]. The computational domain is set as 30
× 30
× 30
(where
is the average chord length of the flapping wing), and the location of the computational domain and the flapping wing is shown in
Figure 12a. The fluid domain mesh setup is shown in
Figure 12b.
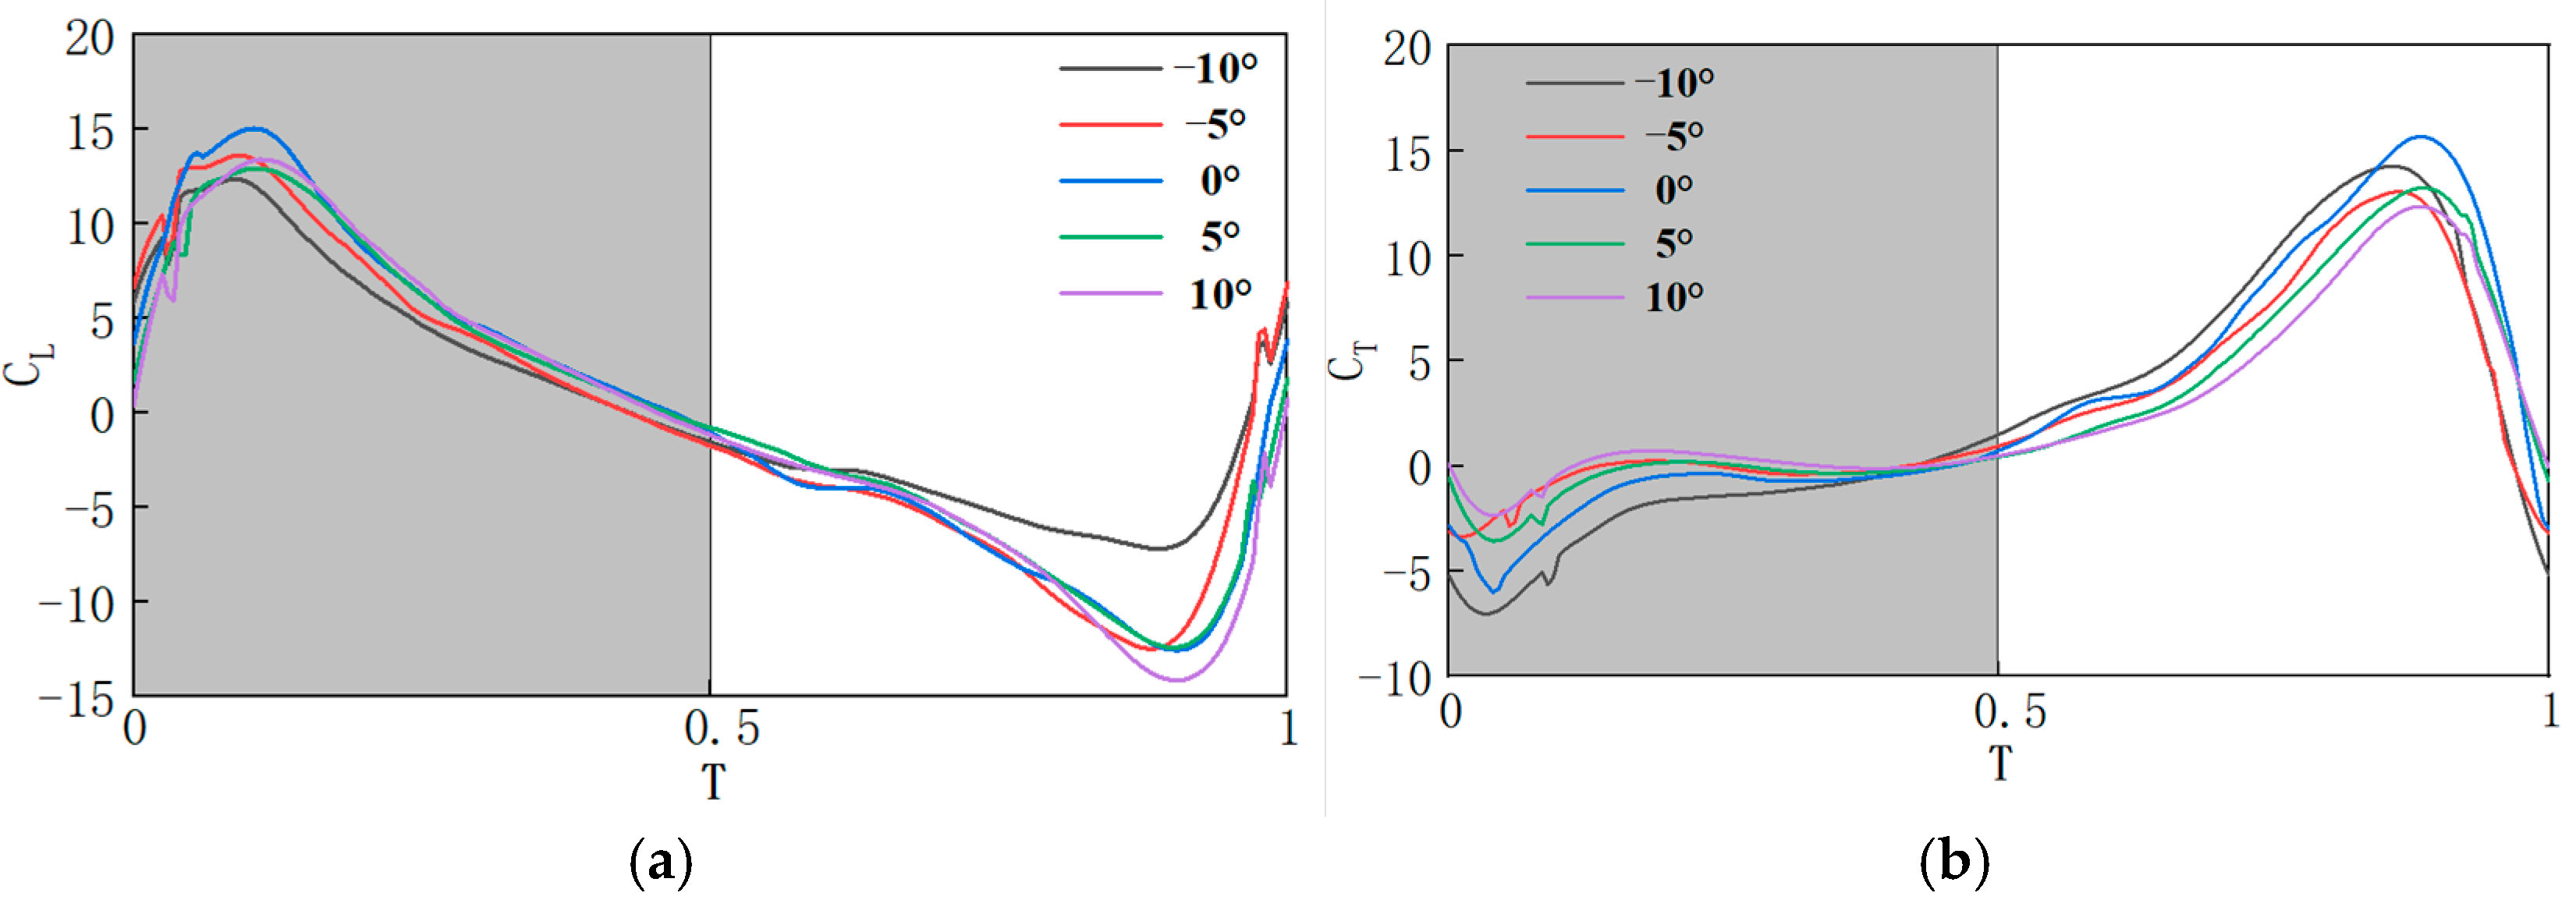
In the study of the aerodynamic characteristics of the flapping wing, the primary focus is on analyzing the variation of lift and thrust. Lift
and thrust
are defined as the aerodynamic forces perpendicular to and parallel to the horizontal plane, respectively. For comparing lift and thrust under different conditions, dimensionless coefficients such as the lift coefficient
and thrust coefficient
are commonly used. The lift coefficient and thrust coefficient are defined as follows:
where
represents the fluid density,
is the surface area of the flapping wing model, and
is the average flapping tip velocity. In the following, different parameter values are set for the mechanism, and dynamic analysis and fluid flow simulations are conducted to evaluate the effects of different pitch deviation angles
, the stroke midpoints
, and pitch amplitude ranges
(
) on the aerodynamic characteristics of the bionic flapping-wing mechanism. A total of 13 sets of experiments are designed, with the parameter values defined as shown in
Table 3.
