1. Introduction
Vehicle ridesharing as a service was first documented in the U.S. during World War I (1914–1918) [
1]. During WWI, the U.S. was in a recession, and as a result, individuals used jitney. Jitney is an unregulated taxi or bus service that carries travelers over a regular route on a flexible schedule [
2]. Jitney’s popularity grew because of its affordability, and this mode of transportation was faster than a streetcar [
3]. As the number of jitney vehicles increased, there were concerns about overcrowding, safety, volatility of the service, and fares [
4]. After WWI, ridesharing lost popularity due to increased personal vehicle availability and growing concerns about sharing a ride. The second noticeable rideshare increase was during World War II (1939–1945). There was a push from the U.S. federal government for citizens to use ridesharing to conserve resources for the war effort [
5]. In the workplace, forming ridesharing committees was encouraged, as well as keeping work shifts flexible to allow employees to find and use rideshares to reduce traffic congestion and resources. The government educated carpoolers to be aware of the impact of their individual behaviors, such as being late, poor manners, or a lack of personal hygiene, which could lead to the failure of rideshare [
6]. Similar to the period following WWI, rideshare lost its popularity after WWII. For several decades, from the late 1960s to early 1980s, rideshare usage or carpooling was stable due to high fuel price hikes, but by 1990, there was a decline in rideshare usage. The decline was primarily due to a decrease in fuel prices and, consequently, an increase in personal vehicles [
7].
Due to advancements in information and communication technologies, rideshare services have become a more reliable form of transportation. During the 1980s and 1990s, there was a rise in the number of personal computers in the U.S. In 1985, about 9% of households had computers, whereas by the year 2000, more than 50% of American families had a computer in their homes [
8]. Along with the rise of personal computers, Internet usage also increased. Later, there was an increase in smartphone usage and advancements in GPS services. Apple sold approximately 1.4 million iPhones worldwide in its first year, 2007, and 11.6 million more iPhones were sold in 2008 [
9]. By 2018, the percentage of Americans who owned smartphones grew to 81% compared to 35% in 2011 [
10]. The technological advancements associated with smartphones and wireless information communication provided the foundation for the transmission of real-time information through smartphones, which had a significant impact in enabling a sharing economy in transportation.
A sharing economy, or collaborative consumption, is “the peer-to-peer-based activity of obtaining, giving, or sharing access to goods and services, coordinated through community-based online services” [
11]. According to a comprehensive literature review on sharing economy by Hossain [
12], the concept of a sharing economy has received significant attention from scholars, practitioners, and policymakers. A sharing economy helps to efficiently utilize the available resources and therefore improves sustainability. Some of the attributes of a sharing economy are a lack of ownership (in this case, of one’s own vehicle), temporary access, and the reallocation of physical goods or tangible assets such as time or money [
13]. A Pew Research Center survey of 4787 U.S. participants highlights that 72% of adults have used some form of shared economy service [
14]. Sharing economies are made possible through multiple technological developments that have simplified the sharing of both physical and nonphysical goods and services through the availability of various internet-based information systems [
11]. For example, for several decades, Blockbuster was known for its movie rental retail operation, where movies were shared by multiple users. However, the rise in shared access using digital media, such as Netflix, has vastly increased the sharing economy [
15]. The integration of the sharing economy with information communication technologies created new business opportunities and companies, such as Airbnb and Uber, which are widely used worldwide [
12]. Airbnb, which started in 2008, is a digital marketplace in which individuals share rooms in their homes, where Airbnb profits from the brokerage fee [
16]. Similarly, in the transportation domain, the integration of the internet, GPS-based location services, and software Apps in smartphones enabled third-party service providers to develop innovative services for transportation options including internet-based, dynamic ridesharing systems (Feldman, 2002).
Using the advancement of information communication technologies and end-users’ growing familiarity with smartphone applications, rideshare service companies first started offering on-demand personal rideshare services. Then, pooled rideshare (PR) on-demand services were offered. With a personal rideshare, the user can travel solo or with individuals they know, whereas with pooled rideshare, the user may travel with one or multiple individuals whom they do not know with multiple pick-up and/or drop-off locations. There are numerous rideshare platforms available throughout the world, including, but not limited to, Uber and Lyft in the U.S., DiDi in China [
17], Ola cabs in India [
18], Grab in Southeast Asia [
19], and Chauffeur Privé in France [
20]. Uber offers services worldwide and is currently the largest rideshare service provider [
21]. According to Uber’s 2022 annual report, their services are available in more than 10,000 cities across 72 countries [
22]. There was a 31% increase in the number of bookings from 2018 to 2019 [
23]. The number of trips increased annually, with the exception of 2020, the year of the onset of the COVID-19 pandemic. There was a 57% increase in Uber’s gross bookings in 2021 compared to the year 2020.
User motivation, which includes, but is not limited to, convenience, flexibility, interaction, time, and economic benefits are important for the success and sustained growth of sharing economies such as rideshare services [
12,
24]. Hossain [
12] highlights that other factors can be economic, political, environmental, social, and technological factors, and for the service providers, the motivations are earning profit and, in some instances, contributing to sustainability. Rideshare services can help to reduce traffic congestion and lower the environmental impact; however, there are challenges in ridesharing [
25]. Travelers have concerns about using rideshare services due to privacy and safety [
26]. Rideshare service providers must ensure that these critical items are prioritized in their service experience. Due to the increase in safety concerns using rideshare, policymakers worldwide are trying to establish proper guidelines for rideshare service companies. For example, in the U.S., Sami’s Law was enacted in 2023 [
27], which ensures that rideshare service companies follow government safety requirements. The legislation mandates that the Government Accountability Office must provide Congress with a report every two years containing findings from a study on: (1) the occurrence of deadly and non-deadly physical and sexual assaults on rideshare drivers by passengers and on passengers by drivers during the previous two years; (2) the details and scope of the background checks performed on potential rideshare drivers; and (3) the safety measures implemented by ridesharing businesses to ensure the wellbeing of both riders and drivers.
User acceptance of personal rideshare is still lower compared to the use of one’s own personal vehicle. According to the 2018 American Community Survey (ACS), 76.3% of Americans used their personal vehicle when commuting to work, in comparison to only 9% who shared a vehicle for their commute [
28]. Research has been conducted on users’ motivational factors, as well as the barriers, in using pooled rideshare [
21,
24,
29,
30,
31,
32,
33].
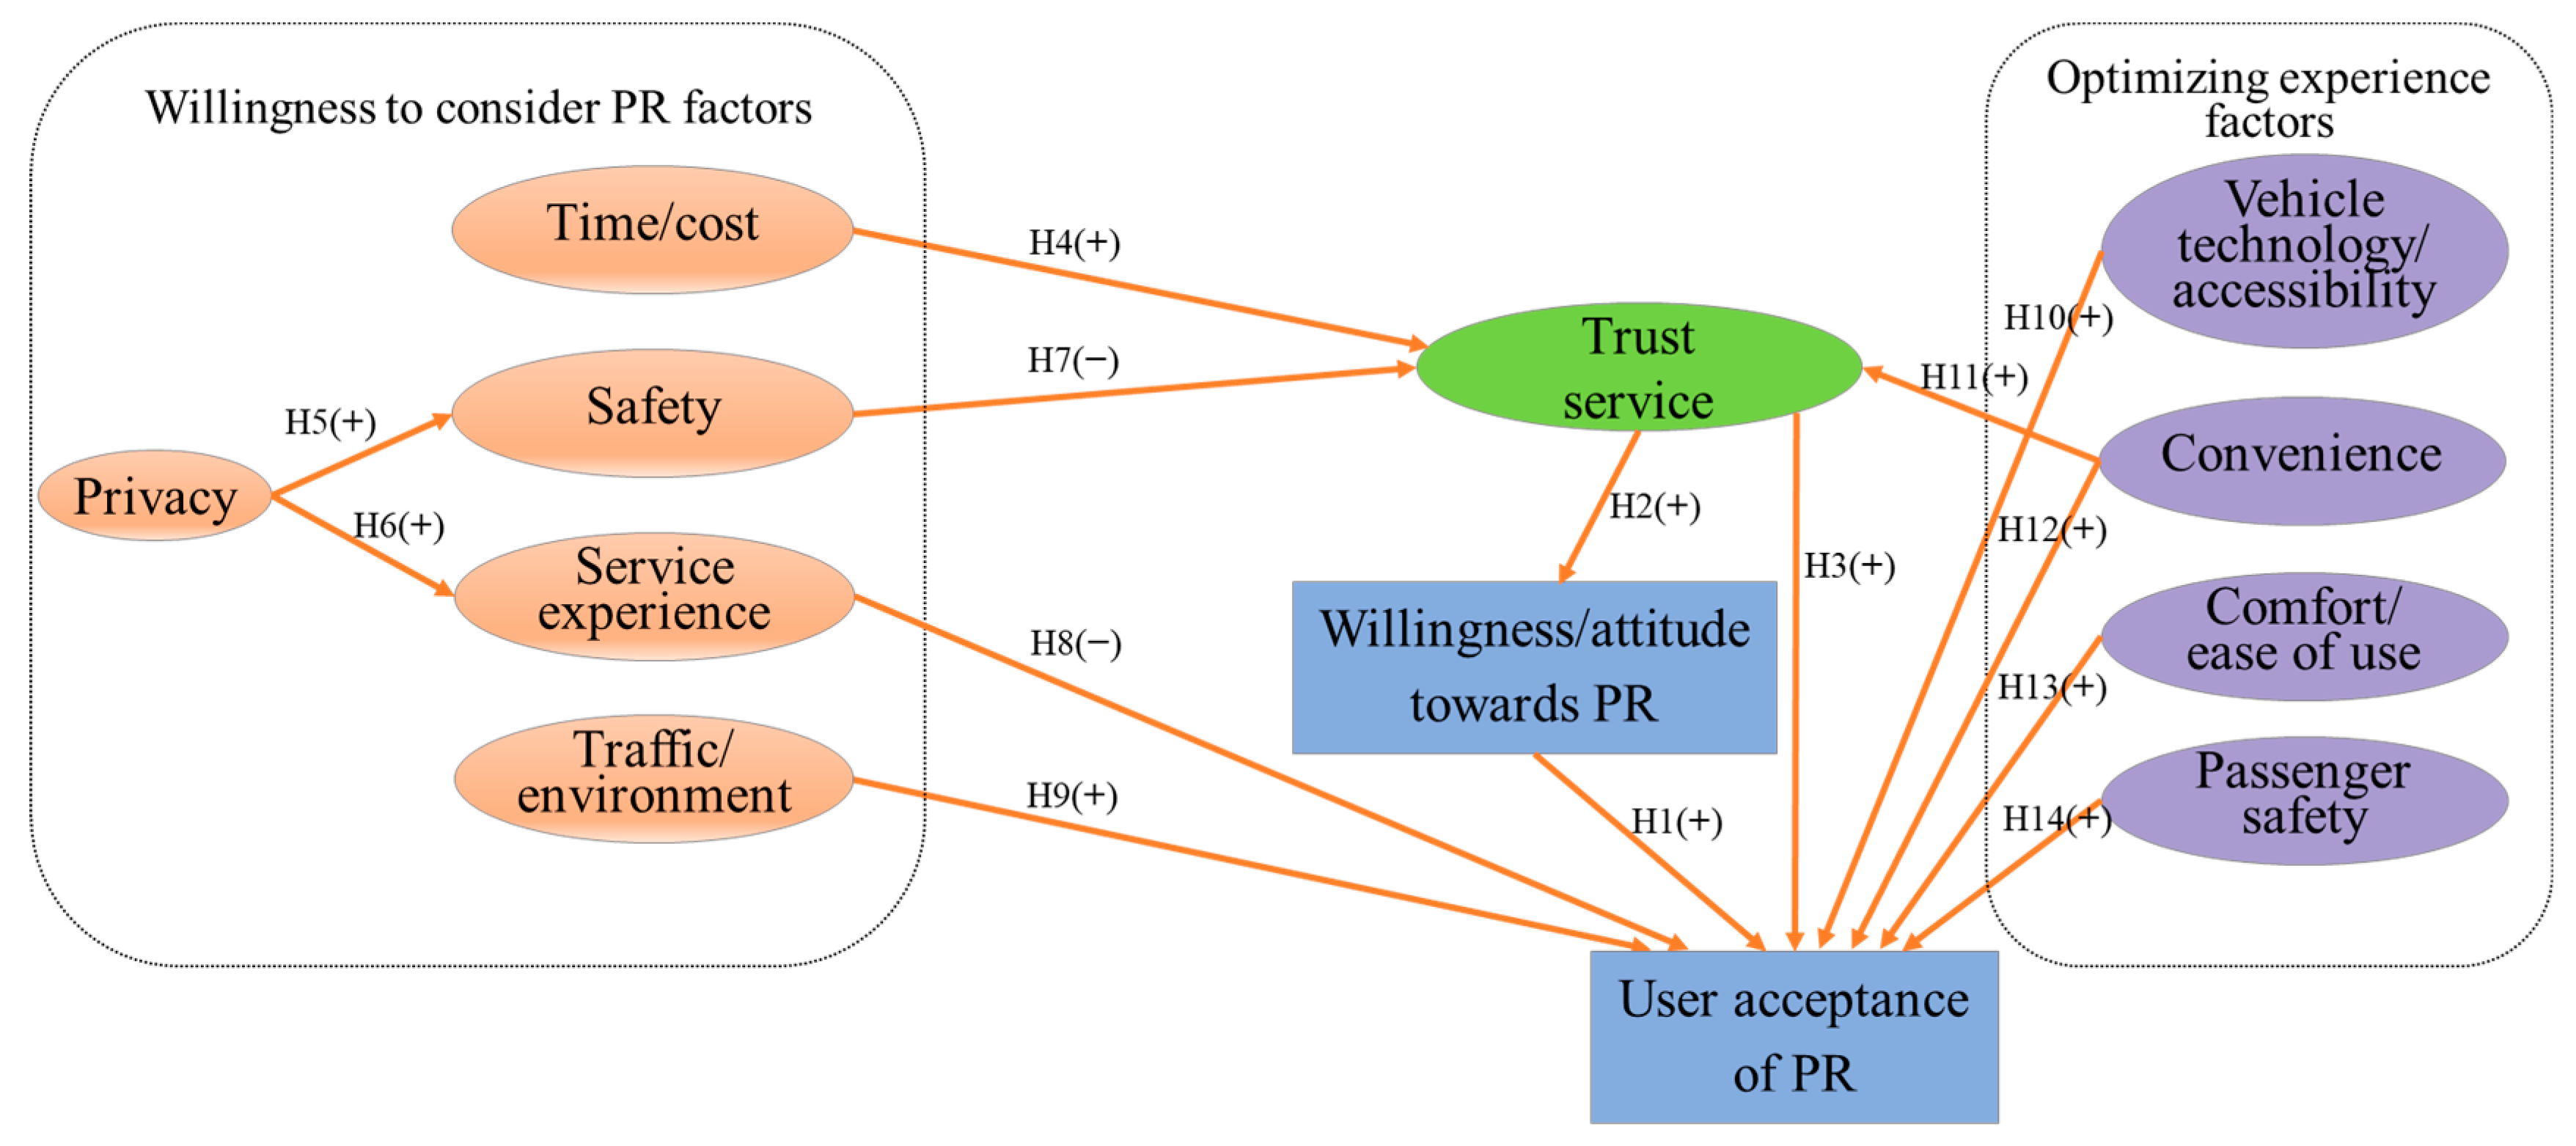
The purpose of this study was to develop a model to predict the user acceptance of pooled rideshare by understanding users’ concerns and preferences. The investigation was based on a national survey, with a robust sample of over 5000 U.S. participants, where the data were analyzed using structural equation modeling. The following sections present the factors influencing the utilization of pooled rideshare (PR) services. The model builds on the Technology Acceptance Model (TAM) and the Unified Theory of Acceptance and Use of Technology (UTAUT) models, defining the user trust in service, attitudes, and acceptance of PR. Then, our lab’s previous research concerning the factors influencing users’ willingness to consider pooled rideshare services and factors that contribute to enhancing users’ experiences are described. The following sections will summarize 14 hypotheses that connect these factors to users’ trust, attitudes, and acceptance of pooled rideshare, using responses from 5385 participants in a national online survey. This study aims to provide a comprehensive understanding of user acceptance of PR services and to offer actionable insights for policymakers and rideshare companies to improve their services and increase user adoption.
4. Results of the Structural Model
4.1. Fitting the Model
The conceptual model, shown in
Figure 1, was considered a baseline to conduct exploratory SEM rather than confirming a conceptual model fit. The goal of the SEM was to obtain a model that determined the best model fit indices using the most optimal path relationships. The SEM was conducted using multiple iterations to obtain the best model fit. The SEM fit indices criteria were met after five iterations, at which point the model fit met the goodness-of-fit measurement criterion. The fifth iteration model was statistically significant (χ
2 (1041) = 16347.1,
p < 0.001,
CFI = 0.893,
RMSEA = 0.052,
SRMR = 0.055,
GFI = 0.946,
TLI = 0.884).
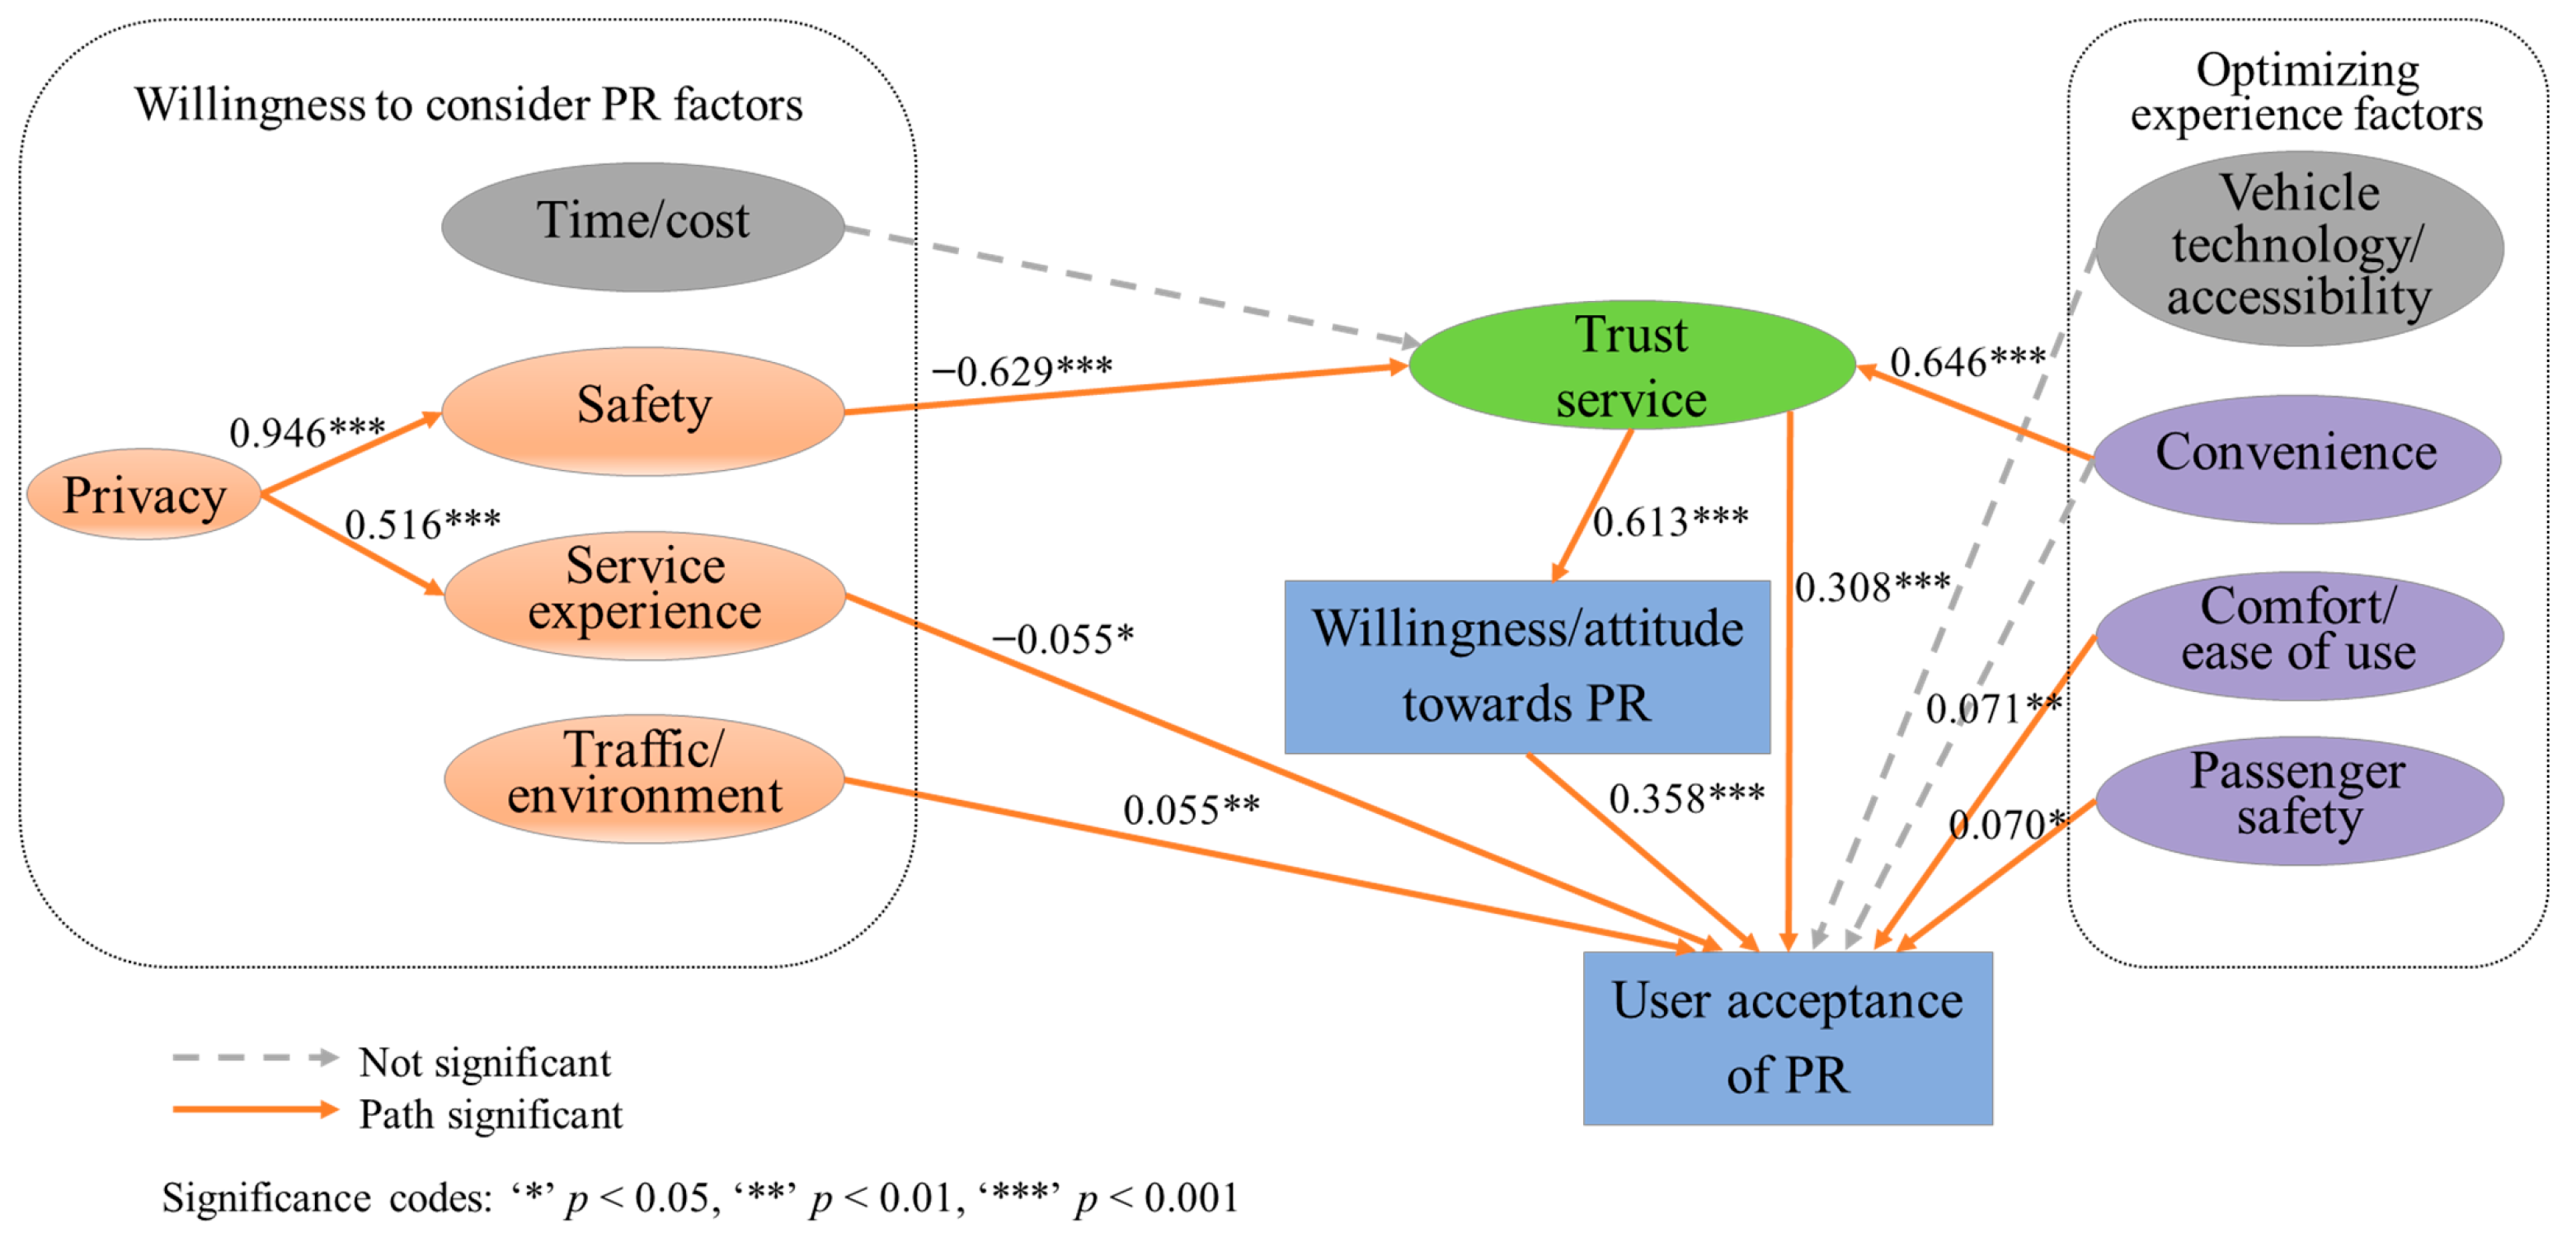
As shown in
Figure 3, out of the 14 original hypotheses, the optimized model revealed that 11 of the hypothesized paths were supported. The two non-significant factors were
time/cost and
vehicle technology/accessibility. The
time/cost factor from
willingness to consider PR and
vehicle technology/accessibility from
optimizing experience factors showed no significance in the model. After observing the insignificance of the
time/cost factor, different configurations of the model were explored to see whether
time/cost had a direct/indirect significant influence on either
willingness/attitude towards PR or
user acceptance of PR; however, in both of those cases, the overall model did not provide a satisfactory fit.
Table 2 provides the significant regression paths of the final model. First, the significant
willingness to consider PR factors were reported. The
privacy factor had a significant influence on both the
safety (
β = 0.946,
z = 23.994,
p < 0.001) and
service experience (
β = 0.516,
z = 18.884,
p < 0.001) factors, indicating that
privacy had a positive relationship with both
safety and
service experience. The
safety factor (
β = −0.629,
z = −7.810,
p < 0.001) had a significant
negative influence on
trust service. The
service experience (
β = −0.055,
z = −1.977,
p < 0.05) and
traffic/environment (
β = 0.055,
z = 2.753,
p < 0.01) factors had a significant influence on
user acceptance of PR. In addition,
service experience had a
negative relationship with
user acceptance of PR, while
traffic/environment had a positive relationship with
user acceptance of PR. Next, the significant optimizing experience factors were reported. The convenience factor (β = 0.646, z = 4.250, p < 0.001) had a significant positive influence on trust service. The comfort/ease of use (β = 0.071, z = 2.582, p < 0.01) and passenger safety (β = 0.070, z = 2.403, p < 0.05) factors had a significant influence on user acceptance of PR. The comfort/ease of use factor had a positive relationship with user acceptance of PR, and passenger safety had a positive relationship with user acceptance of PR.
Finally, the remaining factor, trust service, along with the two response variables (willingness/attitude towards PR and user acceptance of PR) are discussed. The trust service factor had a significant positive influence on both willingness/attitude towards PR (β = 0.613, z = 9.674, p < 0.001) and user acceptance of PR (β = 0.308, z = 6.909, p < 0.001). The willingness/attitude towards PR (β = 0.358, z = 21.297, p < 0.001) factor had a significant positive influence on user acceptance of PR.
4.2. Effect Size Calculations
After determining the significance of each factor, it is then beneficial to evaluate the model’s explanatory power. This is accomplished by evaluating the magnitude of each factor’s influence on the next factor on its path; therefore,
R2 values were calculated for the four factors with a predictive variable (
privacy →
safety,
privacy →
service experience,
safety →
trust service, and
convenience →
trust service). In addition,
R2 values were calculated for the two response variables (
willingness/attitude towards PR and
user acceptance of PR). The objective was to obtain the relationship between the factors and response variable; if a model has an
R2 value greater than 0.3, then that model has good explanatory power [
86].
The R2 value for safety was 0.676, where 67.6% of the variability observed in the safety factor was explained by the privacy factor. The R2 value for service experience was 0.889, where 88.9% of the variability observed in the service experience factor was explained by the privacy factor. The R2 value for trust service was 0.333, where 33.3% of the variability observed in the trust service factor was explained by the combination of the safety and convenience factors. The R2 value for willingness/ attitude towards PR was 0.375, where 37.5% of the variability was explained by the trust service factor. Finally, user acceptance of PR had an R2 value of 0.439, where 43.9% of the variability is explained by five factors (service experience, traffic/environment, comfort/ease of use, passenger safety, and trust service), as well as one response variable, willingness/attitude towards PR. These R2 values provide additional support for the user acceptance of the PR model.
The
R2 values were then used to calculate the Cohen’s
f2 effect sizes, as shown in
Table 2. Examining Cohen’s
f2 is beneficial when evaluating a model to determine the magnitude of each independent variable’s value to the model.
Privacy had a large effect on
safety and
service experience.
Safety and
convenience had a large effect on
trust service.
Trust service, in turn, had a large effect on
willingness/attitude towards PR. While there are five factors and one response variable that influence
user acceptance of PR, the
trust service factor and the
willingness/attitude towards PR response variable had a small effect on the
user acceptance of PR. The remaining four factors had a negligible impact in comparison.
4.3. Mediating (Indirect) Effects
A mediator is a variable in the causal path that helps to explain the relationship between the independent and dependent variables [
87,
88,
89]. As summarized in
Table 3, this full model has four mediators (
safety,
trust service, willingness/attitude towards PR, and
service experience), which contributed to 12 paths. The analysis revealed that all of the possible mediated (indirect) effects were significant. The independent variables were
privacy,
safety,
convenience, and
trust service.
As an independent variable, the privacy factor had a negative indirect effect on the dependent variables trust service, willingness/attitude towards PR, and user acceptance of PR. Privacy (β = −0.595, z = −6.912, p < 0.001) had a negative indirect effect on trust service, mediated through safety. Privacy (β = −0.364, z = −13.179, p < 0.001) had a negative indirect effect on willingness/attitude towards PR, mediated through safety and trust service. Privacy (β = −0.183, z = −10.231, p < 0.001) had a negative indirect effect on user acceptance of PR, mediated through safety and trust service. Privacy (β = −0.131, z = −11.211, p < 0.001) had a negative indirect effect on user acceptance of PR, mediated through safety, trust service, and willingness/attitude towards PR. Privacy (β = −0.029, z = −2.004, p < 0.05) had a negative indirect effect on user acceptance of PR, mediated through service experience.
Similar to the privacy factor, as an independent variable, the safety factor had a negative indirect effect on the dependent variables willingness/attitude towards PR and user acceptance of PR. Safety (β = −0.385, z = −14.109, p < 0.001) had a negative indirect effect on willingness/attitude towards PR, mediated through trust service. Safety (β = −0.194, z = −9.886, p < 0.001) had a negative indirect effect on user acceptance of PR, mediated through trust service. Safety (β = −0.138, z = −11.992, p < 0.001) had a negative indirect effect on user acceptance of PR, mediated through trust service and willingness/attitude towards PR.
In contrast to the privacy and safety factors, as independent variables, the convenience and trust service factors had a positive indirect effect on its dependent variables. The convenience factor had a positive indirect effect on the dependent variables: willingness/attitude towards PR and user acceptance of PR. Convenience (β = 0.396, z = 2.807, p < 0.01) had a positive indirect effect on willingness/attitude towards PR, mediated through trust service. Convenience (β = 0.199, z = 2.659, p < 0.01) had a positive indirect effect on user acceptance of PR, mediated through trust service. Convenience (β = 0.142, z = 2.809, p < 0.01) had a positive indirect effect on user acceptance of PR, mediated through trust service and willingness/attitude towards PR. Next, as an independent variable, the trust service factor had a positive indirect effect on the dependent variable, user acceptance of PR. Trust service (β = 0.22, z = 8.948, p < 0.001) had a positive indirect effect on user acceptance of PR, mediated through willingness/attitude towards PR.
In summary, when the privacy and safety factors were considered as the independent variables, they had negative indirect effects on all their dependent variables, whereas the convenience and trust service factors had positive indirect effects on their dependent variables.
4.4. Higher-Order Factor (Trust Service) and Multicollinearity Assessment
Trust service was theorized in the conceptual model as a higher-order factor that would be identified during the SEM analysis. The higher-order factor was computed by considering the
time/cost,
safety, and
convenience factors as indicators. As a higher-order factor,
trust service needed to be treated as a measurement model, and the collinearity validation was conducted before completing the structural analysis, where
trust service was considered as a dependent variable. A multicollinearity problem occurs when multiple independent variables (predictors) are highly correlated with each other.
Table 4 shows the variance inflation factor (VIF) that helped to diagnose whether there were any multicollinearity problems when predicting
trust service. All of the independent variable VIF values—
time/cost = 2.7,
safety = 2.1, and
convenience = 1.9—were below 5, indicating a low correlation between them [
90]. Therefore,
trust service had no multicollinearity problems amongst its independent variables as a dependent variable.
Similar to
trust service, for the dependent variable
user acceptance of PR, there were multiple independent variables contributing to the regression analysis. Therefore, a multicollinearity assessment was completed for the dependent variable
user acceptance of PR. The VIF values for the independent variables (
Table 5) were
service experience = 5.6,
traffic/environment = 2.8,
trust service = 6.4,
willingness/attitude towards PR = 1.9,
comfort/ease of use = 6.4, and
passenger safety = 6.4. The
traffic/environment and
willingness/attitude towards PR VIF values were below 5, indicating a low correlation. The
service experience, trust service, comfort/ease of use, and
passenger safety VIF values were below 6.5, which were below the acceptable threshold of 10. As there were seven independent variables, it was important to ensure that there was not a high correlation between these independent variables. If any VIF value were above 10, researchers would consider that to be a high correlation, and as a result, the estimation may not be reliable. That is why researchers recommend a VIF value below 10 [
78,
91,
92,
93]. Our data meet this recommendation.
5. Discussion
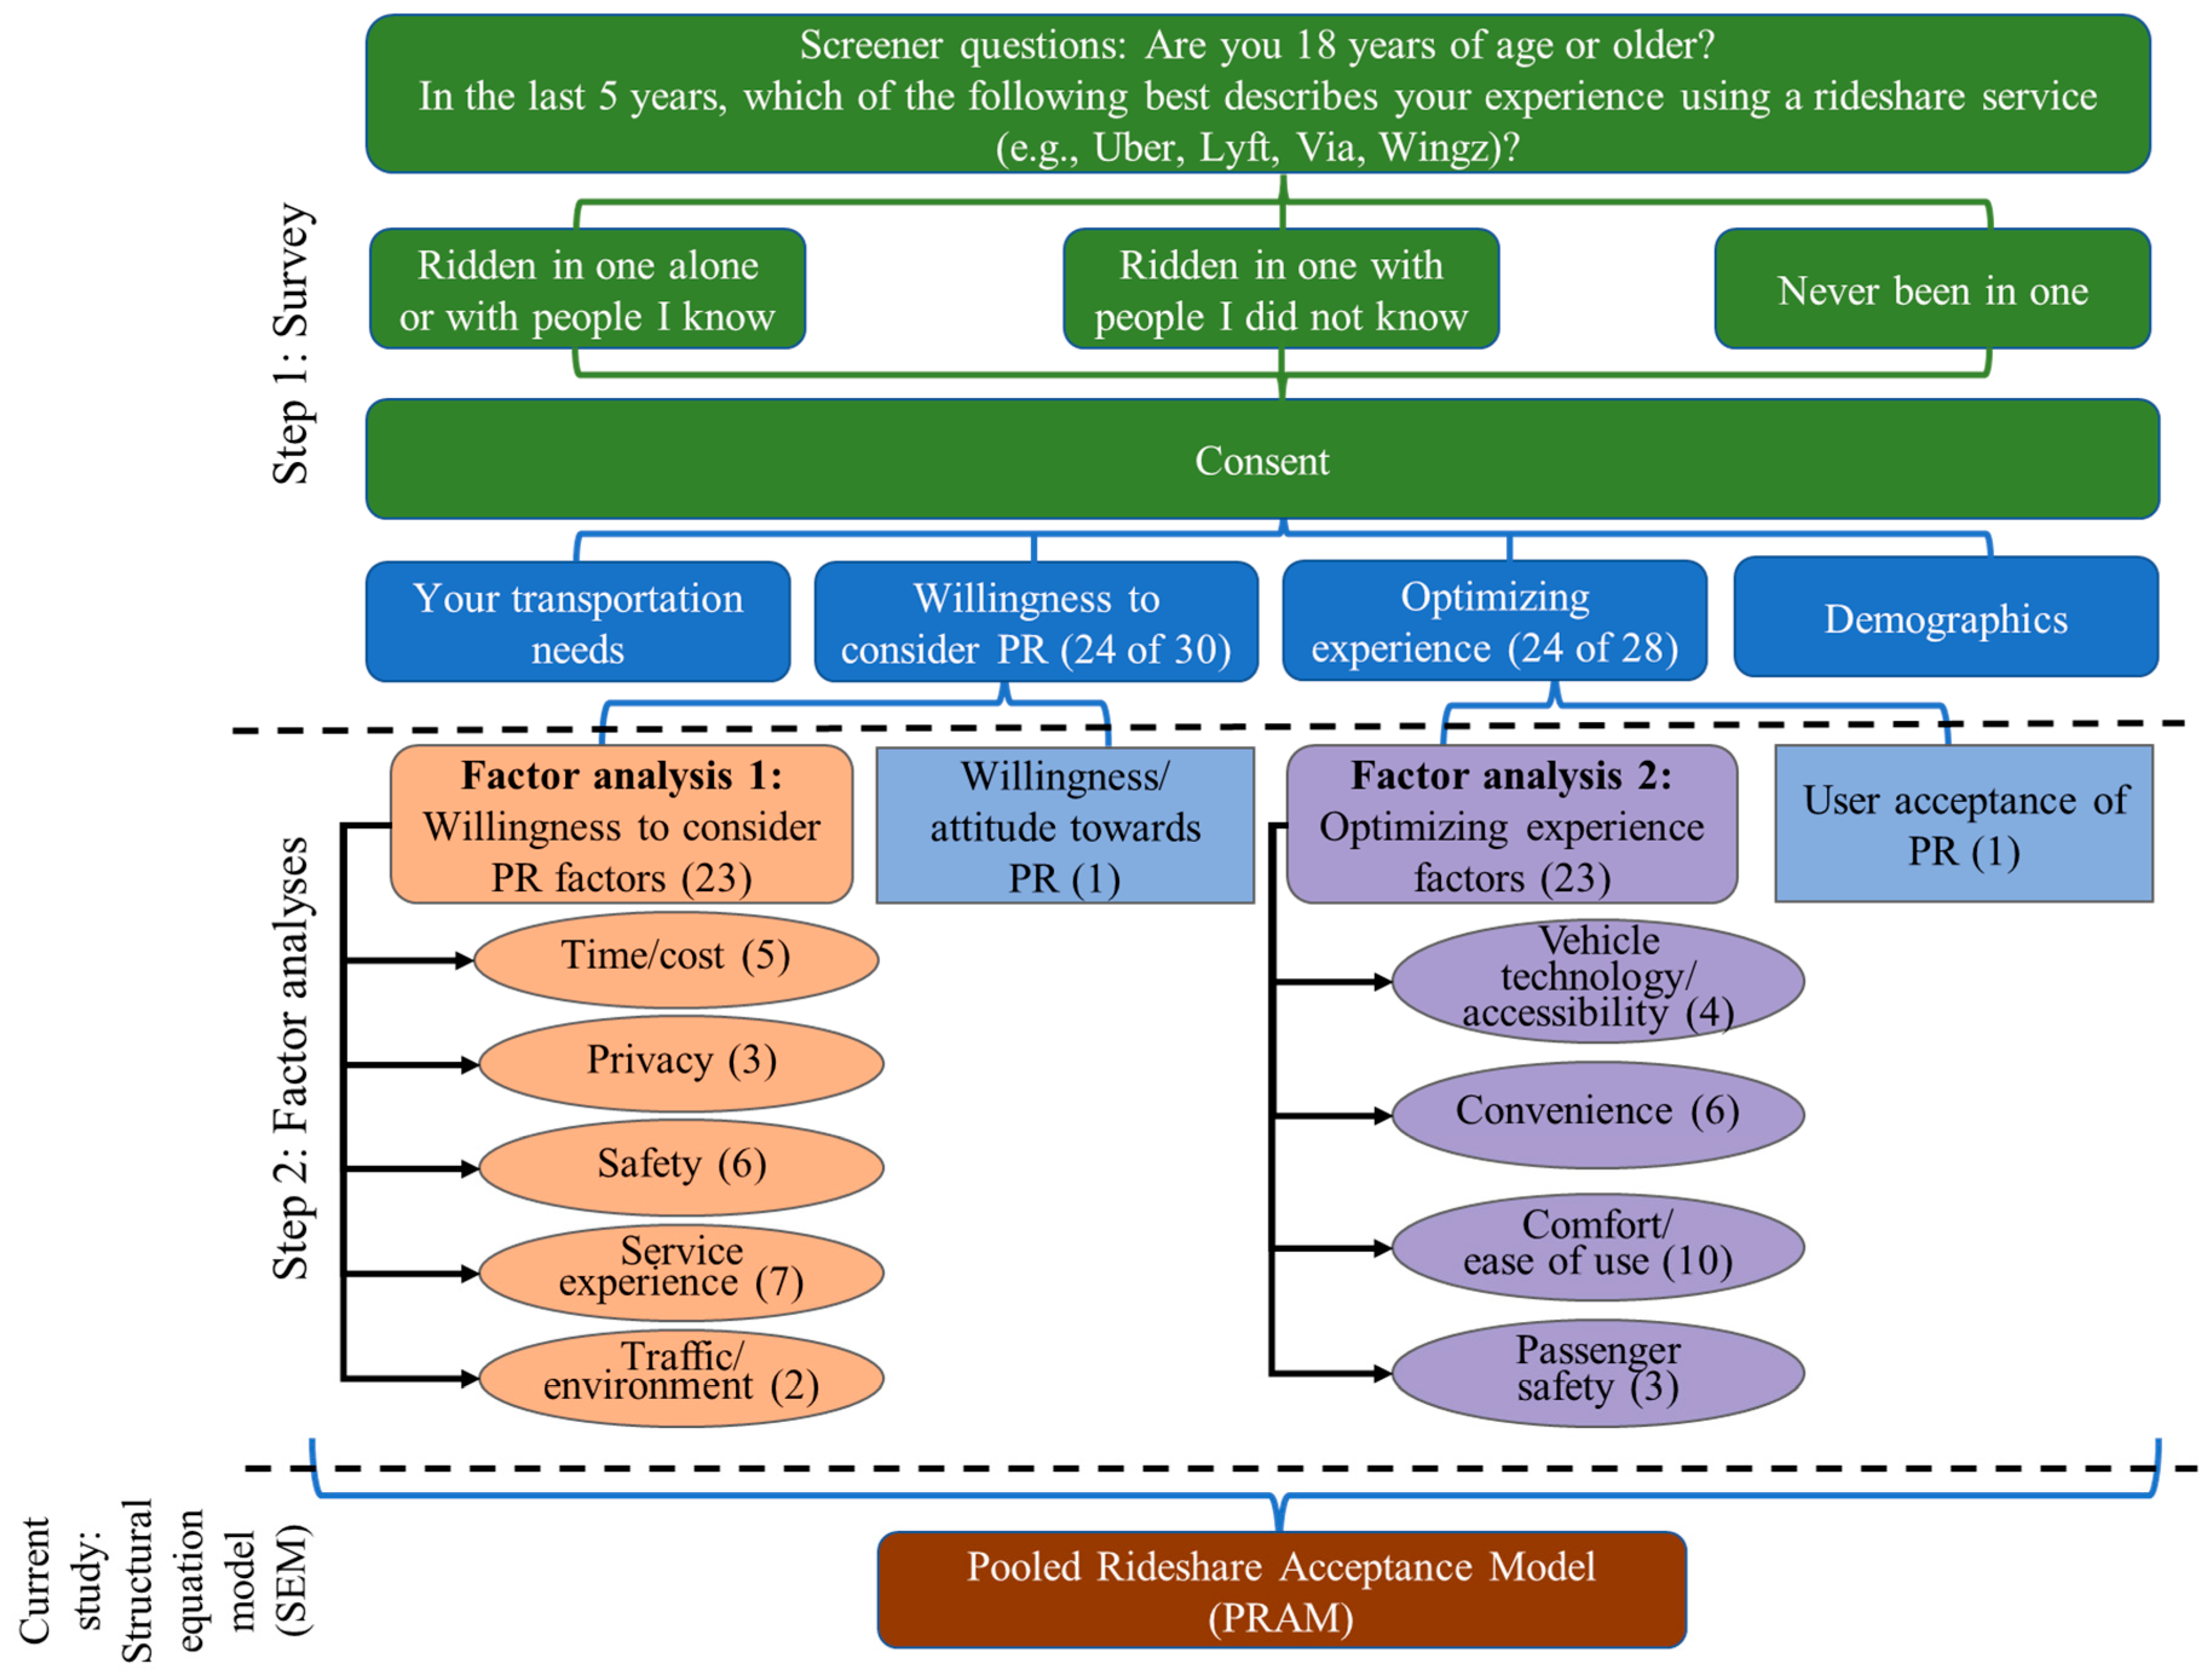
The goal of this study was to develop a model to predict U.S. travelers’ pooled rideshare (PR) acceptance using human factor considerations. The study surveyed 5385 participants across the U.S., plus seven targeted cities. This study utilized the factors identified from two of our team’s previous research papers examining users’
willingness to consider PR [
62] and
optimizing experience of PR [
63]. The
willingness to consider PR study identified five factors:
time/cost, privacy, safety,
service experience, and
traffic/environment. The
optimizing experience study identified four factors:
vehicle technology/accessibility, convenience,
comfort/ease of use, and
passenger safety. In this study, a structural model was created to identify the causal relationships between these factors, resulting in a higher-order factor,
trust service, and identifying all of the factors’ relative contributions to
willingness/attitude towards PR and
user acceptance of PR.
A conceptual model was established using the complex relationship between the ten factors/latent variables (time/cost, privacy, safety, service experience, traffic/environment, trust service, vehicle technology/accessibility, convenience, comfort/ease of use, and passenger safety) and two response variables (willingness/attitude towards PR and user acceptance of PR). While 14 potential paths were explored between the variables, the final optimized model identified 11 of the 14 paths as being significant. Further investigation of the model revealed the mediated (indirect) effects, which explain the indirect relationships that exist between the variables. Based on the model’s direct and indirect effects, the different factors’ relative contribution to the willingness/attitude towards PR and user acceptance of PR can be explained. Privacy, safety, trust service, and convenience factors showed strong significance in the model. The model’s only two non-significant factors were time/cost and vehicle technology/accessibility, which suggests that their importance was relatively low compared to the other factors.
The final model explained the 11 hypotheses and met the required goodness-of-fit measurements criterion. The first hypothesis (H1) stated that users with a favorable attitude towards PR are positively correlated with the likelihood of accepting the service. The result suggested a positive direct relationship between the
willingness/attitude towards PR and
user acceptance of PR. This finding is consistent with other studies derived from the Technology Acceptance Model, indicating that a user’s attitude generally influences their acceptance of a technology/service [
32,
44,
46]. The second hypothesis (H2) stated that a stronger level of trust in PR services is associated with more favorable attitudes and willingness to use PR. The finding demonstrates a positive direct relationship between
trust service and
willingness/attitude towards PR. Trust in the rideshare services is important for the users to have a positive belief, which is also highlighted in other rideshare service studies [
24,
32]. Ma et al. [
32] mention that trust in the rideshare service and trust in multiple drivers form a cumulative trust that is significant for the user to continue using the personal rideshare service. For the pooled rideshare service, this study found that the passengers’ trust is significant if one is to share a ride with someone they do not know, which is a critical element for pooled rideshare services.
The third hypothesis (H3) stated that greater trust in PR services results in increased adoption and acceptance of PR. The result suggested a positive direct relationship between
trust service and
user acceptance of PR. In sharing economy research, trust in unknown persons and services is an essential prerequisite for success in a sharing economy [
16,
94]. For example, Airbnb acts as a broker and operates an online marketplace focused on short-term homestays between strangers. The research on Airbnb usage suggests that trust in its service platform leads to greater usage of its service [
16]. In this study, the results suggest that trusting in the service is important for user acceptance of PR. Along with directly influencing
willingness/attitude towards PR and
user acceptance of PR, the
trust service factor was found to be a significant mediator. With the
trust service factor as a mediator, the
privacy and
safety factors had a negative indirect relationship with
willingness/attitude towards PR and
user acceptance of PR. Similarly, with the
trust service factor as a mediator, the
convenience factor had a positive indirect relationship with
willingness/attitude towards PR and
user acceptance of PR. The acceptance of pooled rideshare relies on the rideshare service platform, which must ensure that riders trust its services with multiple riders and create favorable conditions [
95]. If the user does not feel safe during the ride or if any safety or privacy violations occur while using the ride, it will strongly influence users not to use PR.
The next two significant hypotheses (H5 and H6) were related to the
privacy factor. The fifth hypothesis (H5) stated that users who prioritize privacy will have more concerns about safety when sharing rides with unknown riders. The result suggested a positive direct relationship between the
privacy and
safety factors. As pooled ridesharing requires the user to travel with multiple people whom they do not know, privacy inside the vehicle will influence their perception of safety. The user expects the rideshare companies to ensure that there is no harm or danger when sharing a ride [
21,
32]. The sixth hypothesis (H6) stated that users who prioritize privacy will expect a higher service experience during the ride. The result suggests a positive direct relationship between the
privacy and
service experience factors. As the majority of travelers in the U.S. prefer a personal vehicle for commuting, this finding suggests that the user will desire privacy during PR and wants that privacy to be as similar as possible to what they experience in their own private vehicle. Rideshare companies likely need to enhance their service experience by offering better privacy options to increase PR use.
Next, the seventh hypothesis (H7) stated that users with higher concerns about safety will have lower trust in PR services. The result suggests a negative direct relationship between the
safety and
trust service factors. This means that safety is the primary concern for users who do not accept the PR concept. As highlighted in several studies [
32,
33,
96,
97,
98] as well as in Uber and Lyft’s safety reports [
99,
100], physical and sexual assaults have happened in the past. These incidents tend to cause the user to have reduced trust in the rideshare service, as reflected in this study. When using pooled rideshares, it is likely that a vehicle will detour from their original path to pick up and drop off others; therefore, the user has to travel an extra distance, possibly in an unfamiliar location. With the
safety factor as a mediator, the
privacy factor had a negative indirect relationship with
trust service. Compared to using a personal vehicle, where there is privacy and a preference for traveling alone, the pooled rideshare can create privacy concerns that negatively influence a user’s trust in the service. Feeling safe is of the highest importance for the users; therefore, rideshare companies must ensure passengers that there is a level of safety between the users and the service.
In the two subsequent hypotheses, the
service experience and
traffic/environment factors directly influenced the
user acceptance of PR. The eighth hypothesis (H8) stated that the higher concerns regarding the service experience of PR compared to alternative transportation options result in a decrease in the user acceptance of PR. The result suggested a negative direct relationship between
service experience and
user acceptance of PR. In the
service experience factor, the items with the highest factor loadings were related to public transportation availability. This suggests that unless there is a strong justification for the rideshare advantage, the user may still prefer public transportation over pooled rideshare, as reflected in other studies [
101,
102]. The ninth hypothesis (H9) stated that users with higher concerns for traffic congestion and environmental impact leads to an increase in user acceptance of PR. The result suggested a positive direct relationship between
traffic/environment and
user acceptance of PR. The widespread adoption of ridesharing can take vehicles off the road, reduce traffic congestion, protect air quality, lower vehicle emissions, and reduce the need for infrastructure investment [
70,
101,
103,
104]. The users’ concerns about traffic congestion and thoughts that using rideshare will improve the environment influenced their acceptance of PR directly.
The next significant hypothesis is related to the
convenience factor. The eleventh hypothesis (H11) stated that the optimized convenience experience will lead to increased trust in the PR service. The result suggested a positive direct relationship between the
convenience and
trust service factors. Unlike the
safety factor, the
convenience factor can strongly influence the user to gain trust in the PR services. The increase in trust will help users to formulate a positive opinion of PR [
46]. Rideshare companies need to carefully focus on the topics that fall within the
convenience factor, which can increase ridership. In this study, the results suggest that ride affordability and information about the ride (e.g., cost, route, time, service transparency, and user communication with the outside world) were important. Inbar et al. [
105] conducted similar research concerning passengers and found that passengers like to have continuous information about their trip as well as continuous communication with the outside world. Similar results were also found in the shared autonomous vehicle research, where multiple users share a ride without a driver [
68,
106]. The
convenience factor indirectly influenced both
willingness/attitude towards PR and
user acceptance of PR, mediated through
trust service, indicating its influence on users’ willingness to use PR. Rideshare companies should incorporate user-centered services that are reliable to provide a convenient ride.
The two remaining significant hypotheses were related to
comfort/ease of use and
passenger safety factors. The thirteenth hypothesis (H13) stated that optimized comfort/ease of use experience will lead to increased user acceptance of PR. The result suggested a positive direct relationship between
comfort/ease of use and
user acceptance of PR. As Mayr [
107] suggested in the traveling comfort theory, the user should have a comfortable experience within the vehicle and a comfortable ease of use experience when scheduling a ride. The user expects a high level of physical comfort for a convenient ride [
108]. Rideshare companies should focus on customized heating, ventilation, and air condition (HVAC) systems for each user, enough physical space, ergonomic seats, and in-built infotainment, as well as a better view of the outside environment. The fourteenth hypothesis (H14) stated that the passenger safety experience will lead to increased user acceptance of PR. The result suggested a positive direct relationship between
passenger safety and
user acceptance of PR. As seen earlier, the
safety factor is the greatest priority for the user. Therefore, the safety improvement features in the rideshare service are essential for sustained service growth. Companies such as Uber and Lyft have been consistently incorporating new features to increase the safety of their users. For example, Uber has an emergency assistance button to call authorities if the user needs immediate help. Friends and family can follow the user’s route and will know when the user arrives at their destination. In addition, advanced features such as RideCheck use vehicle sensors and GPS data to detect if a trip goes off-course or if a possible crash has occurred [
109].
The first non-significant factor in the model was
time/cost, which is from the
willingness to consider PR factors. Some studies suggest that the time and cost items are important for rideshare participation [
24,
70,
104,
110,
111,
112]. The previous studies have largely focused on time and cost with other factors, such as demographic features, the relationship between cost and time, vehicle automation, etc. This study focused on 46 items that were categorized into nine diverse factors to obtain the comprehensive motives of user willingness to accept PR. Given the
safety and
convenience factor’s significant contributions to
trust service, the
time/cost factor did not significantly influence
trust service [
24]. In this study, only the
trust service factor influenced positive attitudes towards PR as it acted as a mediator for the
privacy,
safety, and
convenience factors, which the users considered more important than the
time/cost factor.
However, the survey items on the
convenience factor focused on cost, travel time, wait time, and information about the ride. From the previous factor analysis, it is important to note that the items ‘The cost to share a ride is more affordable than other transportation’, ‘There is clear information about the ride (e.g., cost, route, time) before I book it’, and ‘I won’t be delayed by long detours’ had the highest factor loadings [
63]. Specifically, 84% and 81.5% of the participants either ‘Agree’ or ‘Strongly agree’ with the latter two items, indicating their willingness to consider pooled rideshare services. Despite the
time/cost factor’s lack of significance, the individual items related to time and cost were crucial when viewed within the context of convenience. This highlights that while users’ perceptions of privacy and safety are paramount for their attitude towards PR, once the safety concerns are addressed and the services are deemed convenient, time and cost elements significantly enhance their trust in pooled rideshare services. The findings complement the other research, which indicates that factors like reduced trip costs compared to alternatives are important in opting for pooled rideshare services [
70]. Moreover, convenience features like shorter wait times and accessibility all the time, along with transparent communication and reliable services, further influence users’ decisions to share rides [
25,
33,
64,
68]. Amirkiaee et al.’s [
24] rideshare acceptance model highlights that, along with trust, time and cost benefits significantly influence positive attitudes toward rideshare.
The second non-significant factor in the model was
vehicle technology/accessibility, which is from the
optimizing experience PR factors. This complements the findings in Amirkiaee et al.’s [
24] rideshare acceptance model that the user may not be concerned about the vehicle’s energy source, whether it is propelled by electricity, gasoline, or another energy source. Regarding the automation of the vehicle, shared autonomous vehicles have found significance in autonomous vehicle development [
106,
110,
111,
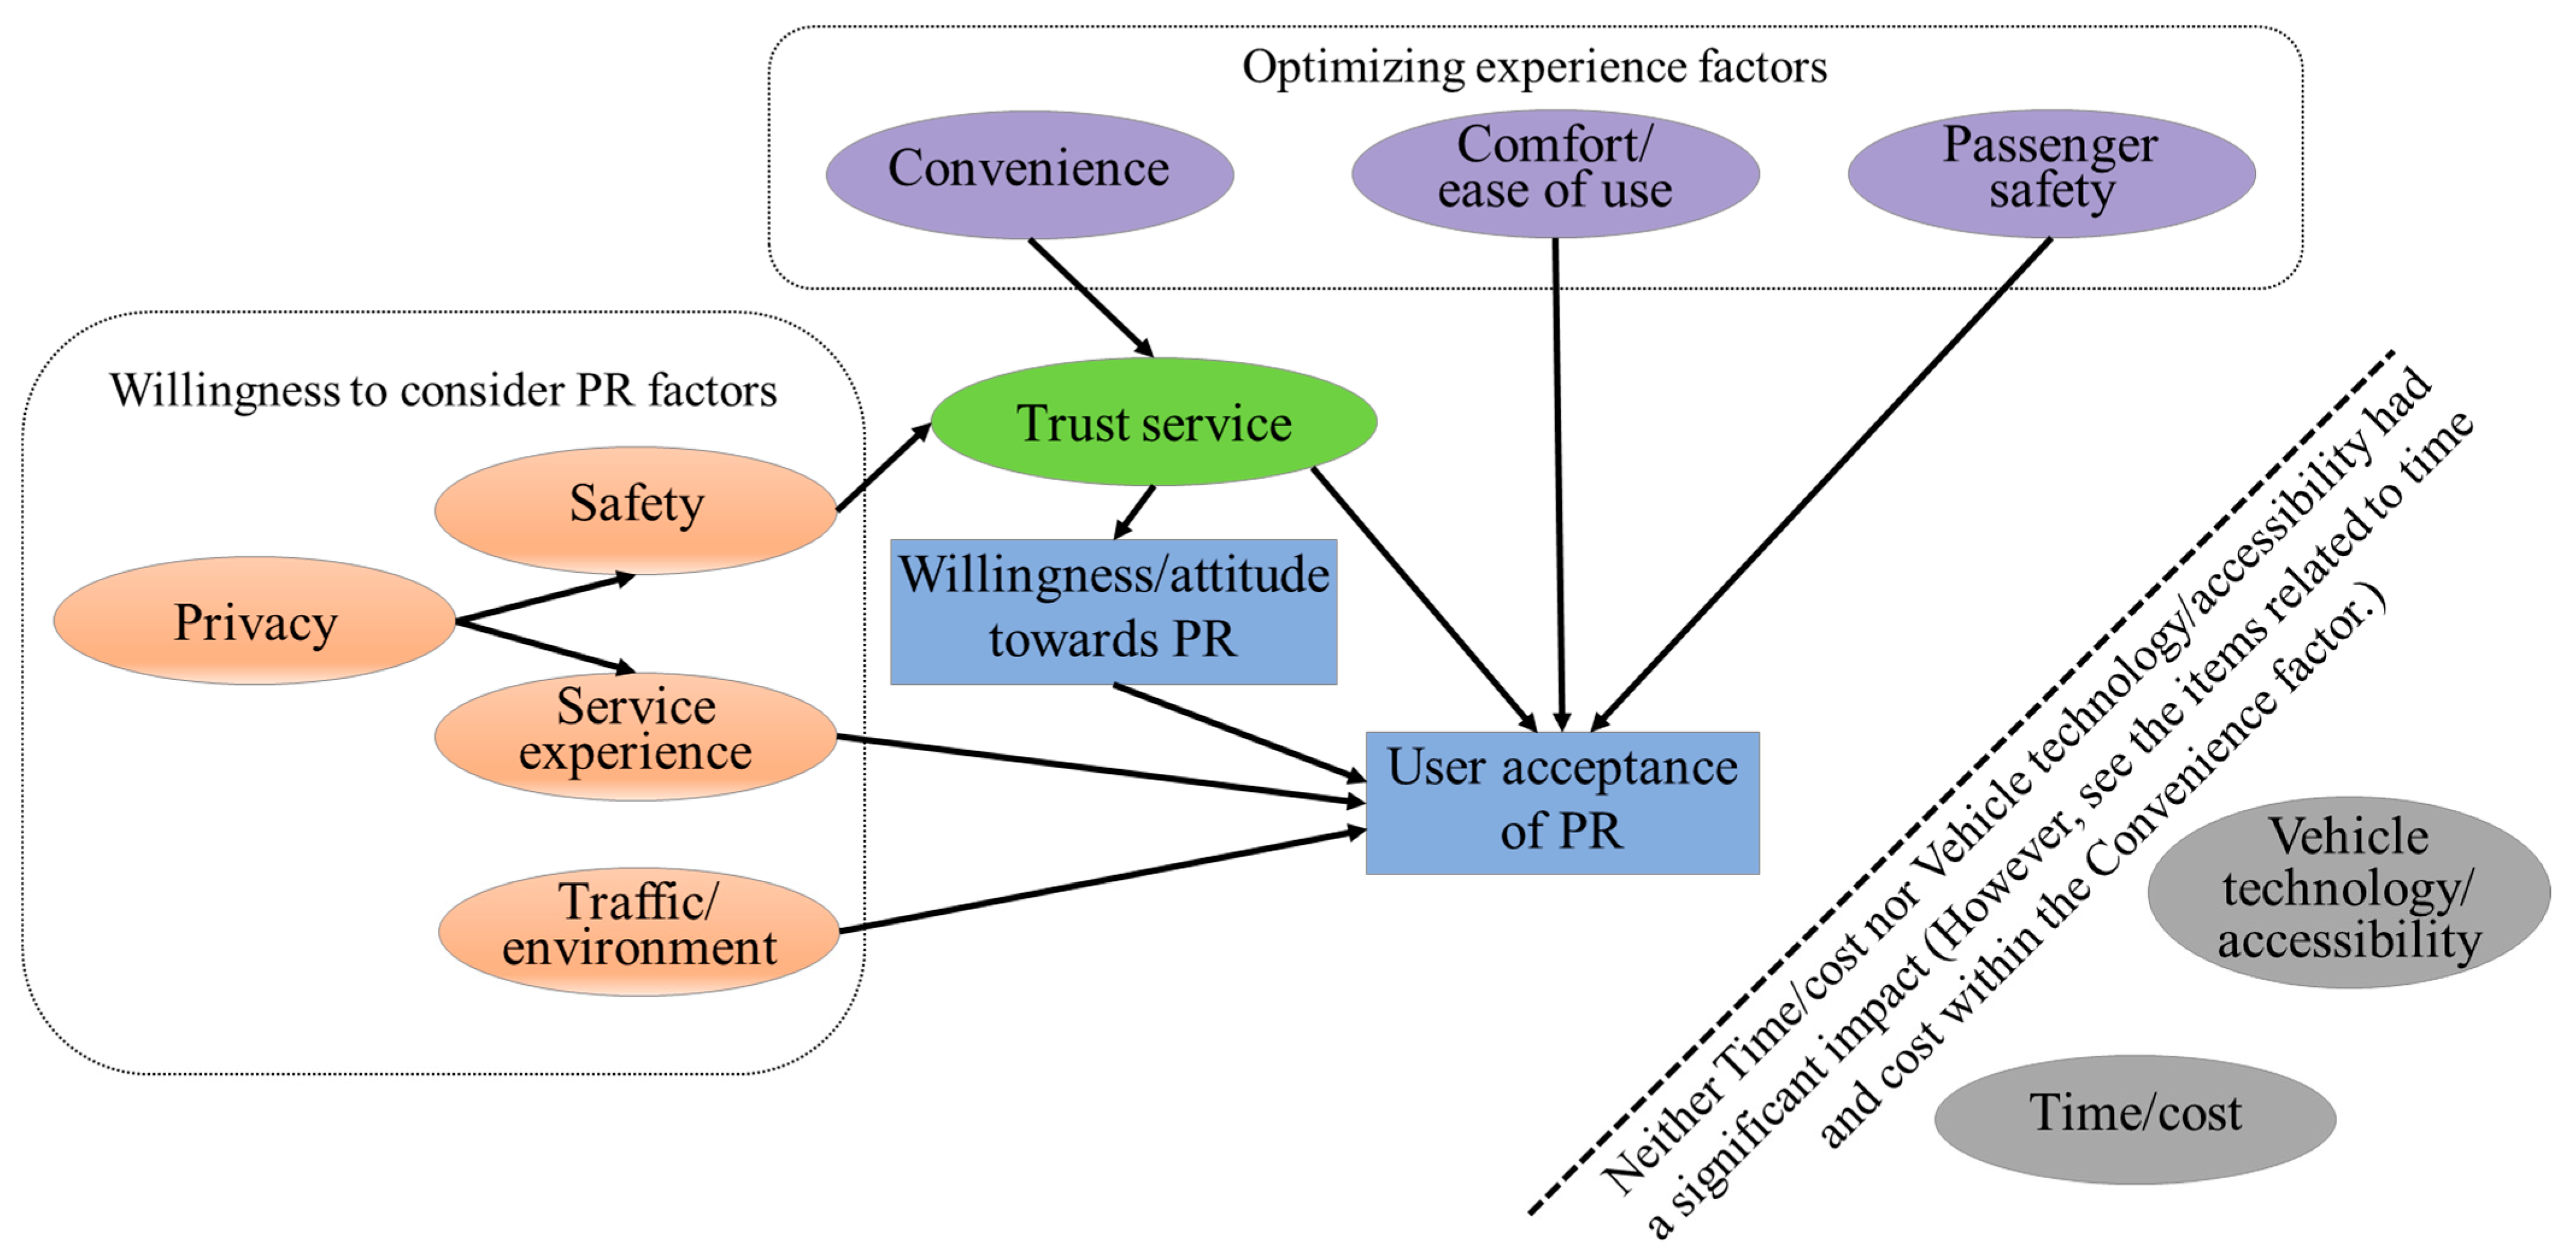
113]; however, from the users’ point of view, it does not influence their acceptance of PR. Finally, after reviewing all of the hypotheses’ significances obtained from the analysis, the user acceptance pooled rideshare model using the human factors perspective, which is Pooled Rideshare Acceptance Model (PRAM), is shown in
Figure 4.
6. Conclusions
This study was designed based on an online national survey in the U.S. with 5385 participants to increase the understanding of human factor- barriers and user preferences, which will provide foundational knowledge of the factors that affect individuals’ acceptance of pooled rideshare (PR). The covariance-based structural equation model (CB-SEM) was used to identify the causal relationship between the
willingness to consider PR factors (
time/cost, privacy, safety,
service experience, and
traffic/environment) and
optimizing experience of PR factors (
vehicle technology/accessibility, convenience,
comfort/ease of use, and
passenger safety), resulting in a higher-order factor,
trust service, and eventually finding all of the factors’ relative contribution to
willingness/attitude towards PR and
user acceptance of PR, thereby developing a Pooled Rideshare Acceptance Model (PRAM). In the PRAM, the
privacy,
safety,
trust service, and
convenience factors showed significance, along with the
comfort/ease of use,
service experience,
traffic/environment, and
passenger safety factors. The only two non-significant factors in the model were (1)
time/cost and (2)
vehicle technology/accessibility, suggesting that users only consider the time, cost, technology, and accessibility variables when they feel safe in using it. Despite the
time/cost factor’s lack of significance, individual items related to time and cost were crucial when viewed within the convenience factor [
63]. This highlights that while user perceptions of privacy and safety are critical towards their attitude towards PR, once the safety concerns are addressed and the services are deemed convenient, time and cost elements significantly enhance users’ trust in pooled rideshare services. This is an important and consistent finding in the study, which makes a valuable contribution to the design of pooled rideshare services.
Privacy had a negative indirect influence on willingness/attitude towards PR and user acceptance of PR, mediated through safety and trust service. Privacy had a negative indirect influence on willingness/attitude towards PR and user acceptance of PR, mediated through service experience. Safety had a negative indirect influence on willingness/attitude towards PR and user acceptance of PR, mediated through trust service. The trust service factor had a positive direct influence on user acceptance of PR and a positive indirect influence, mediated through willingness/attitude towards PR. Convenience had a positive indirect influence on willingness/attitude towards PR and user acceptance of PR, mediated through trust service. The other factors from willingness to consider PR, such as service experience, had a negative direct influence on user acceptance of PR, and traffic/environment had a positive direct influence on user acceptance of PR. Similarly, the factors from optimizing experience, such as comfort/ease of use, had a positive direct influence on user acceptance of PR, and passenger safety had a positive direct influence on user acceptance of PR. In summary, the information about the ride (e.g., cost, route, time), service transparency, and user communication with the outside world greatly influence the acceptance of PR. The individual considers privacy, safety, and service experience as deterrent factors in using PR when compared with other modes of transportation. Rideshare service companies and policymakers must consider these factors as the highest priority in their policy to increase user acceptance of PR.
7. Recommendations to Policymakers and Rideshare Companies
Based on the findings of this extensive study on U.S. travelers’ acceptance of pooled ridesharing (PR), several policy implications and recommendations for policymakers and rideshare companies can be derived. The Pooled Rideshare Acceptance Model (PRAM) reveals that privacy, safety, trust in the service, and convenience factors are paramount to influencing user acceptance of PR.
Enhance User Trust: Rideshare companies should invest in measures that boost user trust in their services. This can be achieved by ensuring transparency in operations, offering reliable services, and ensuring proper communication with users about their ride information and any changes that might occur.
Prioritize Safety: Policies should be enacted that mandate strict safety measures in PR services as safety has been identified as a primary concern for users. This could include rigorous background checks for drivers, robust processes for handling complaints, and advanced safety features like emergency assistance buttons and ride tracking.
Privacy Measures: PR services should pay special attention to the privacy concerns of users, particularly as users are often sharing rides with strangers. Privacy in this context could extend to both physical and data privacy. Measures could include strict data privacy policies and practices. Future vehicle designs, including those of autonomous vehicles, might consider the integration of privacy pods as a potential opportunity considering the growing emphasis on privacy among users.
Improve Service Experience: Rideshare companies should strive to enhance the service experience by mimicking the privacy and comfort that users experience in their personal vehicles. This could involve offering personalized climate control, spacious and ergonomic seating, and onboard infotainment options.
Promote Environmental Benefits: Policymakers should promote the environmental benefits of PR, such as reduced traffic congestion and lower emissions, to encourage more users to consider this mode of transportation. This could include public awareness campaigns and incentives for users choosing more sustainable travel options.
Improve Convenience: Efforts should be made to make PR as convenient as possible. This might include minimizing wait times, providing accurate arrival times, and making the process of booking and paying for rides seamless.
While this study did not identify time/cost and vehicle technology/accessibility as significant factors, it did highlight the importance of time- and cost-related items when viewed through the prism of convenience. Therefore, the importance of shaping users’ perceptions needs to address the problem using a user-centered design, and service providers need to prioritize safety initiatives and address travel time and pricing from a user convenience perspective. As future policies and practices evolve, there is a clear need to offer competitive prices, efficient travel times, reliable services, and to integrate user-friendly technologies, while prioritizing the pivotal factors identified in this study. It is predicted that adhering to these recommendations will substantially amplify the acceptance and adoption of PR services in the U.S.


 ,
, 


