Online Process Safety Performance Indicators Using Big Data: How a PSPI Looks Different from a Data Perspective
Abstract
:1. Introduction
Literature Review
- Able to detect deviations of a process to help justify expenditure towards safety and report on safety in the chemical engineering sphere of influence;
- An intervention tool to prevent issues or “knock-on” effects;
- Able to support decisions to promote organisational vision;
- Used as an effective monitoring tool to allow the organisation to “feel safe” and adhere to regulations and standards;
- Proactive.
- Readily support the first view towards process health and behaviour;
- Be used as an intervention tool;
- Support decisions in a timelier manner;
- Provide assurance to the organisation of process health;
- Be proactive.
- Processes and people are performing safely, effectively and efficiently;
- Organisational impact upon the environment is as minimal as possible;
- Assets are managed and maintained safely and securely;
- The company is viable and profitable.
2. Materials and Methods
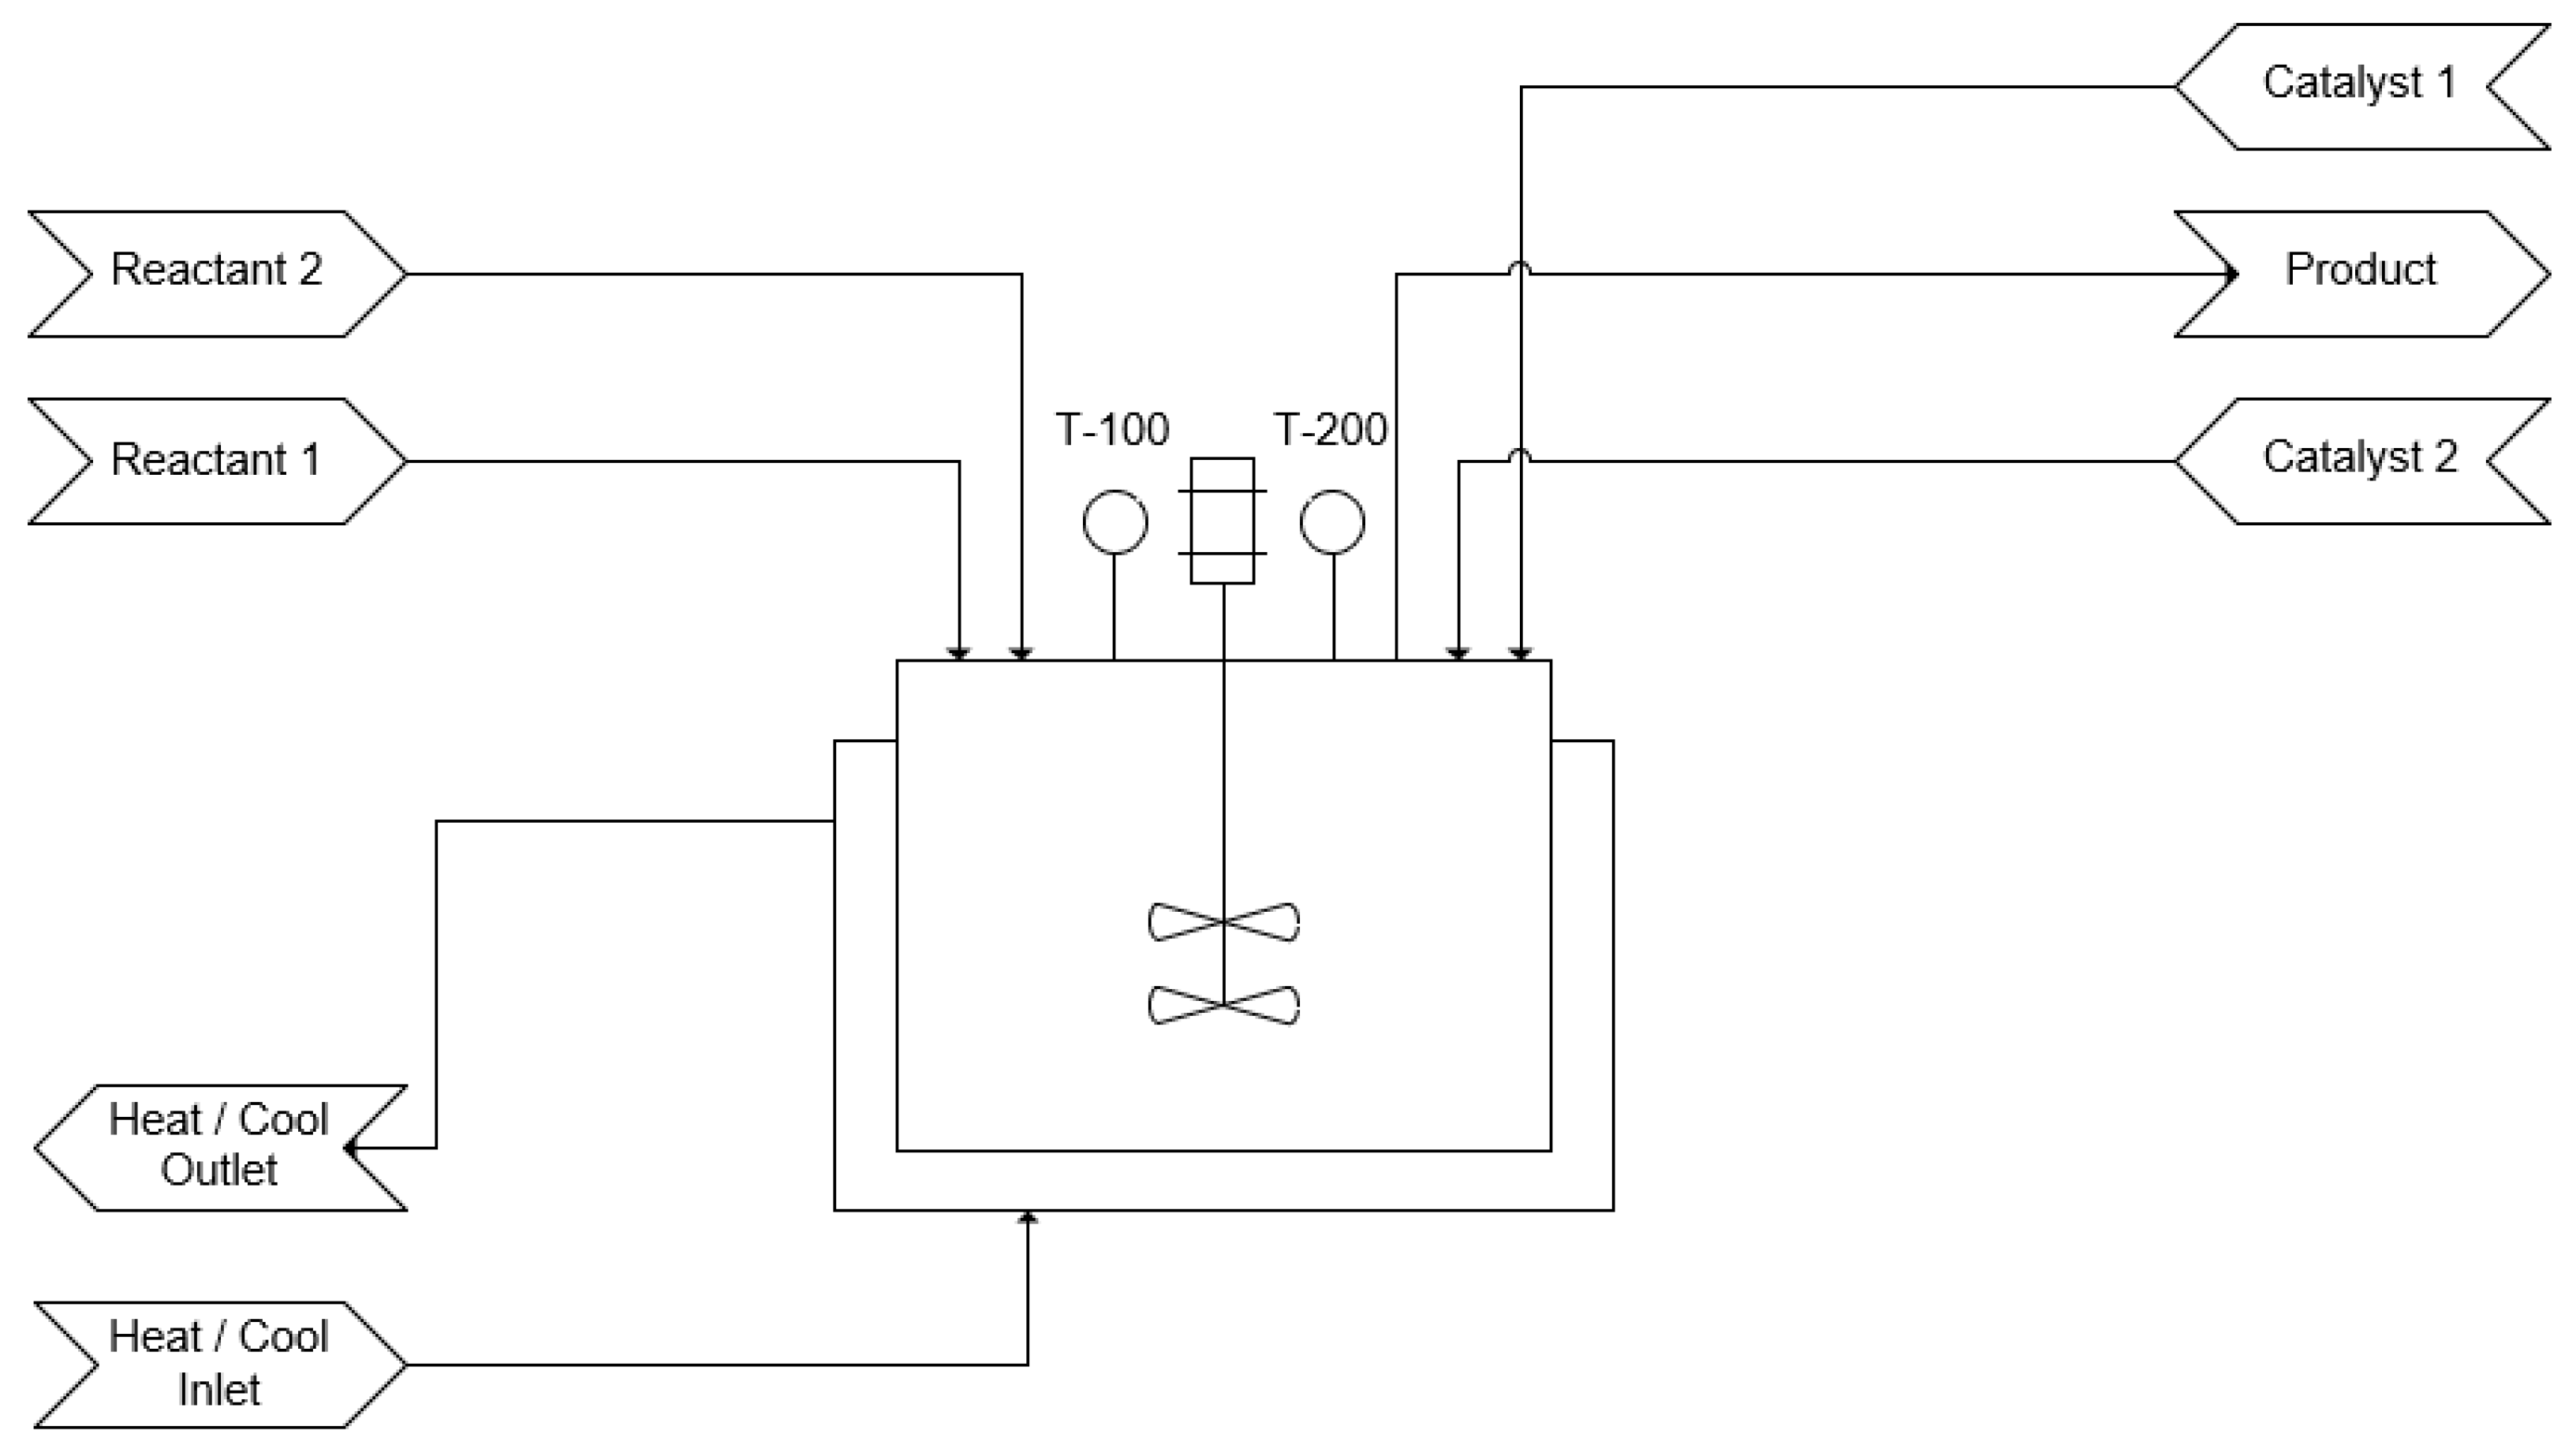
2.1. The Process
2.2. Current PSPIs
- R-100 operating temperature with validation of temperature reading;
- R-300 operating pressure;
- I-100 operating temperature.
- I-100 confirmation of vessel purge during reactant charge;
- I-100 reactant charge;
- R-100 safety temperature trip during testing.
2.3. Method
2.3.1. Generalized Data Extraction Process
2.3.2. Overview
3. Results
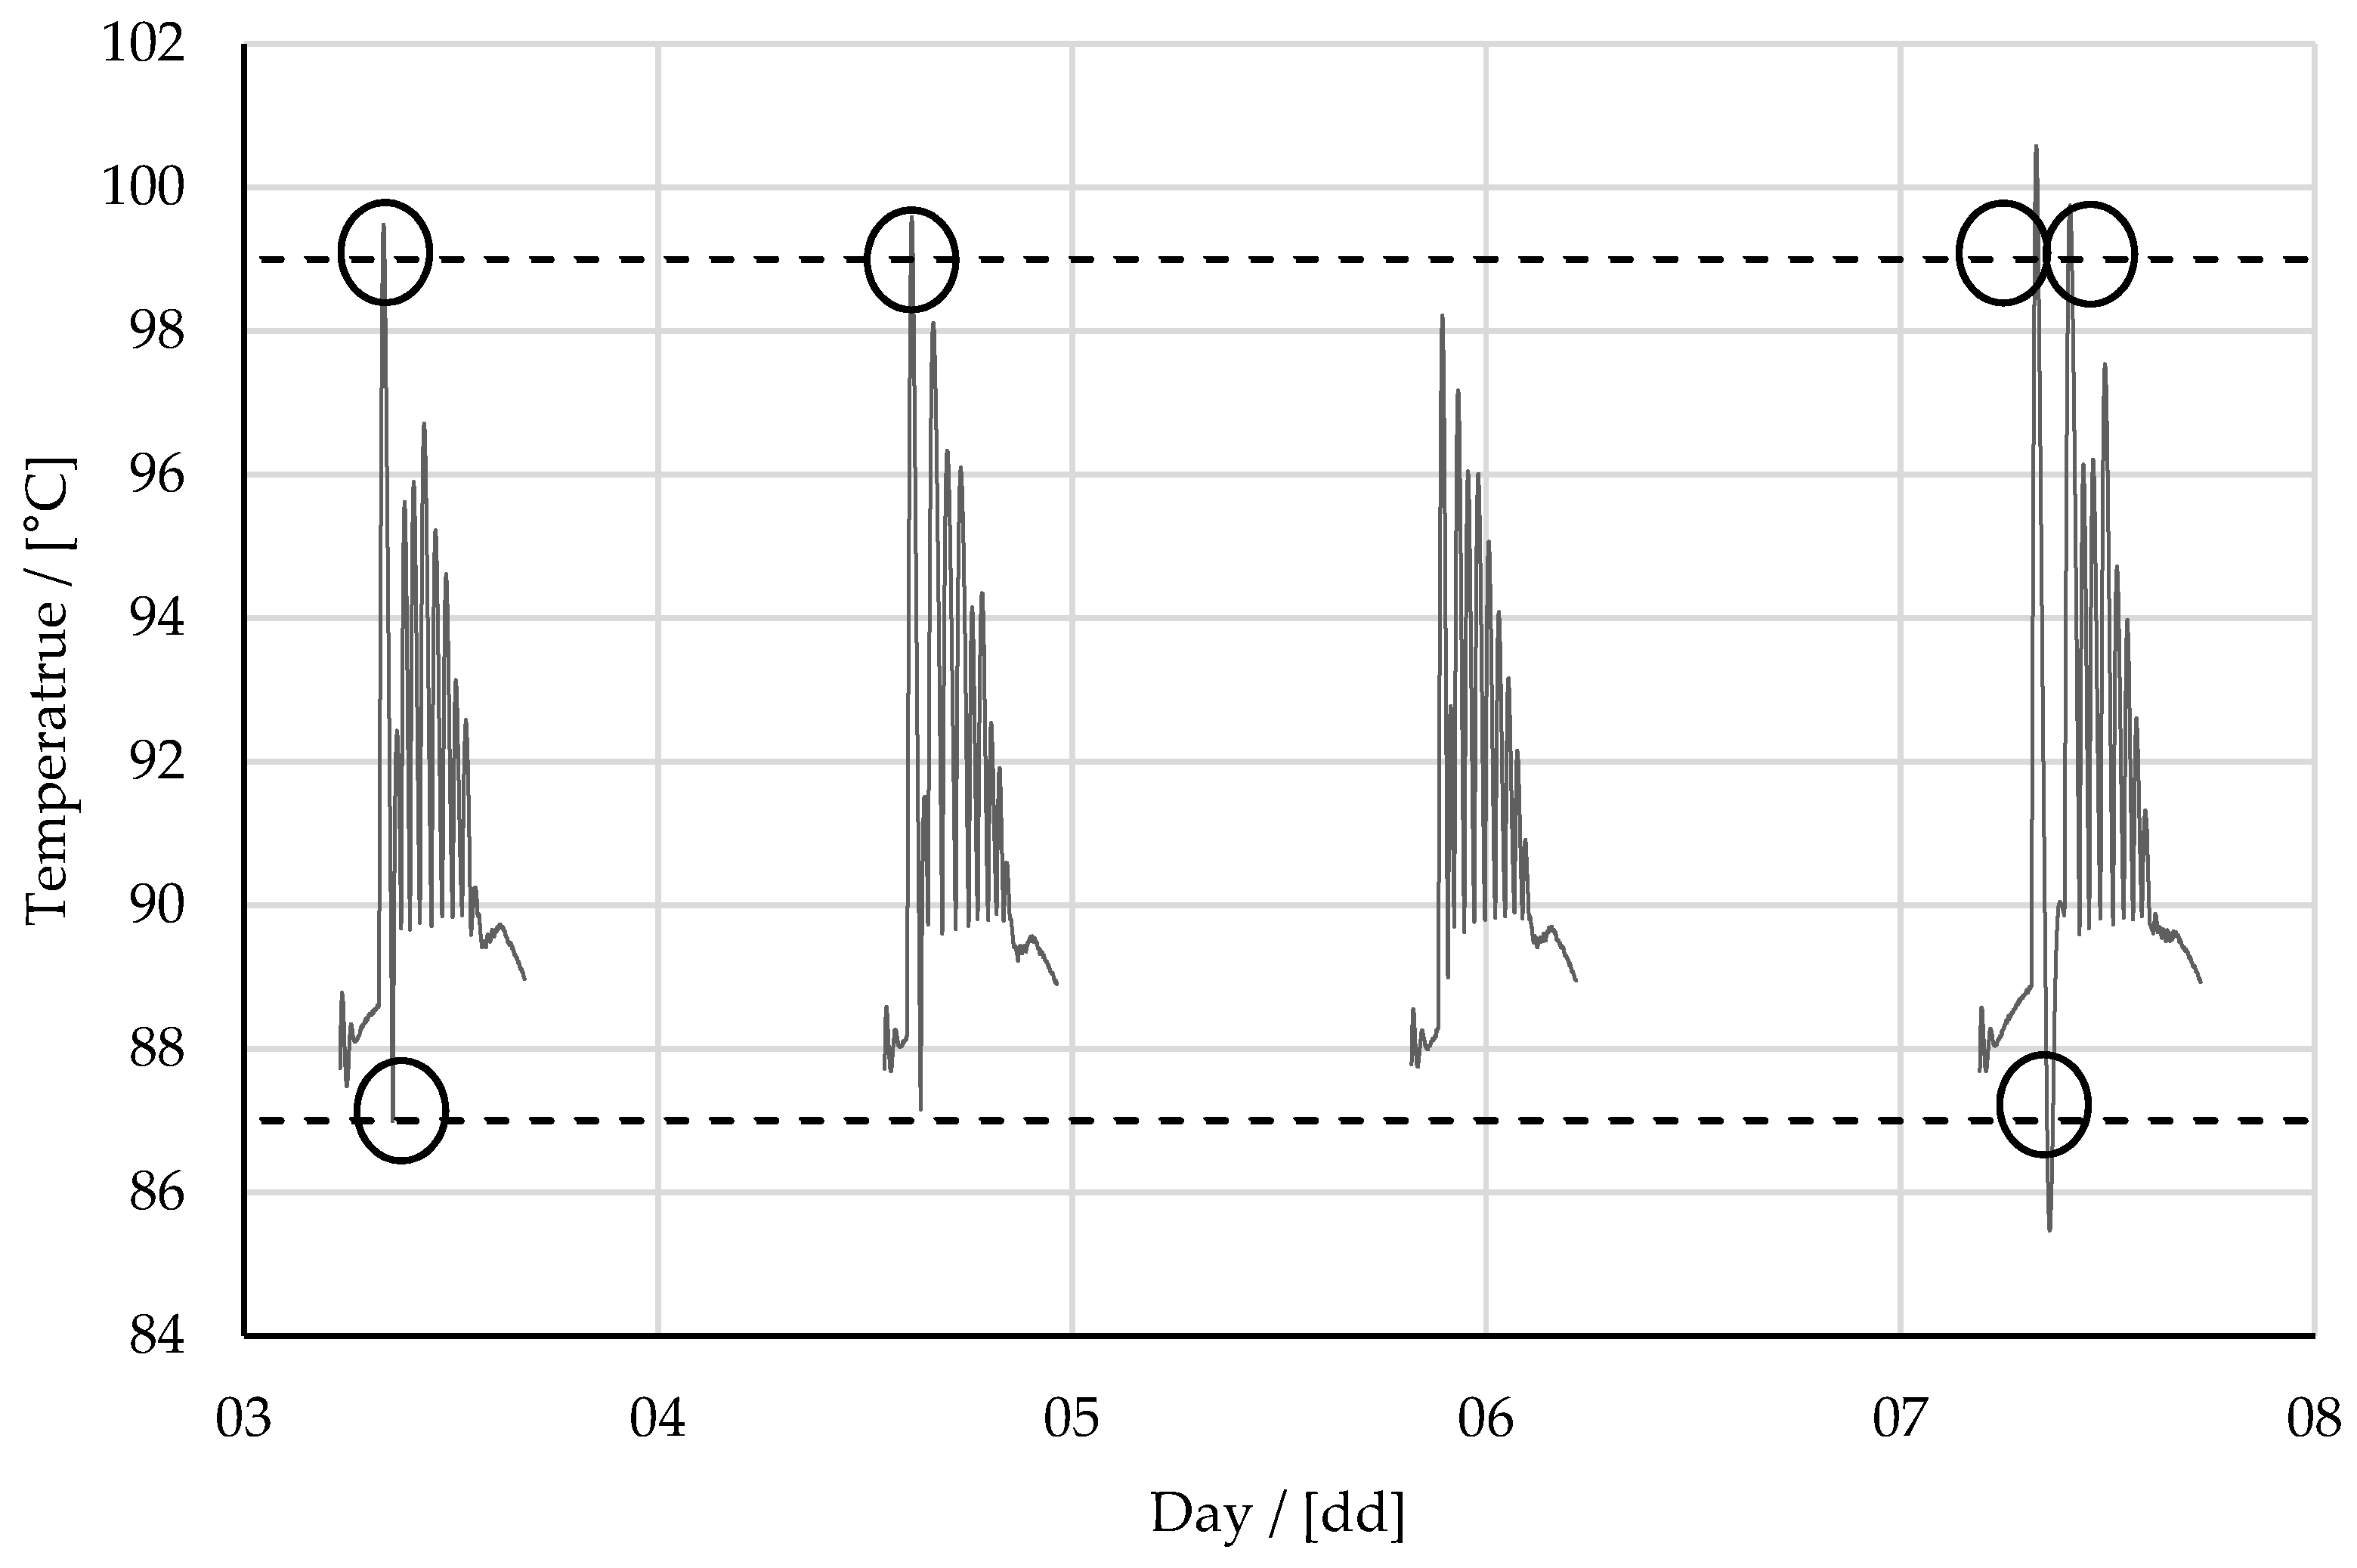
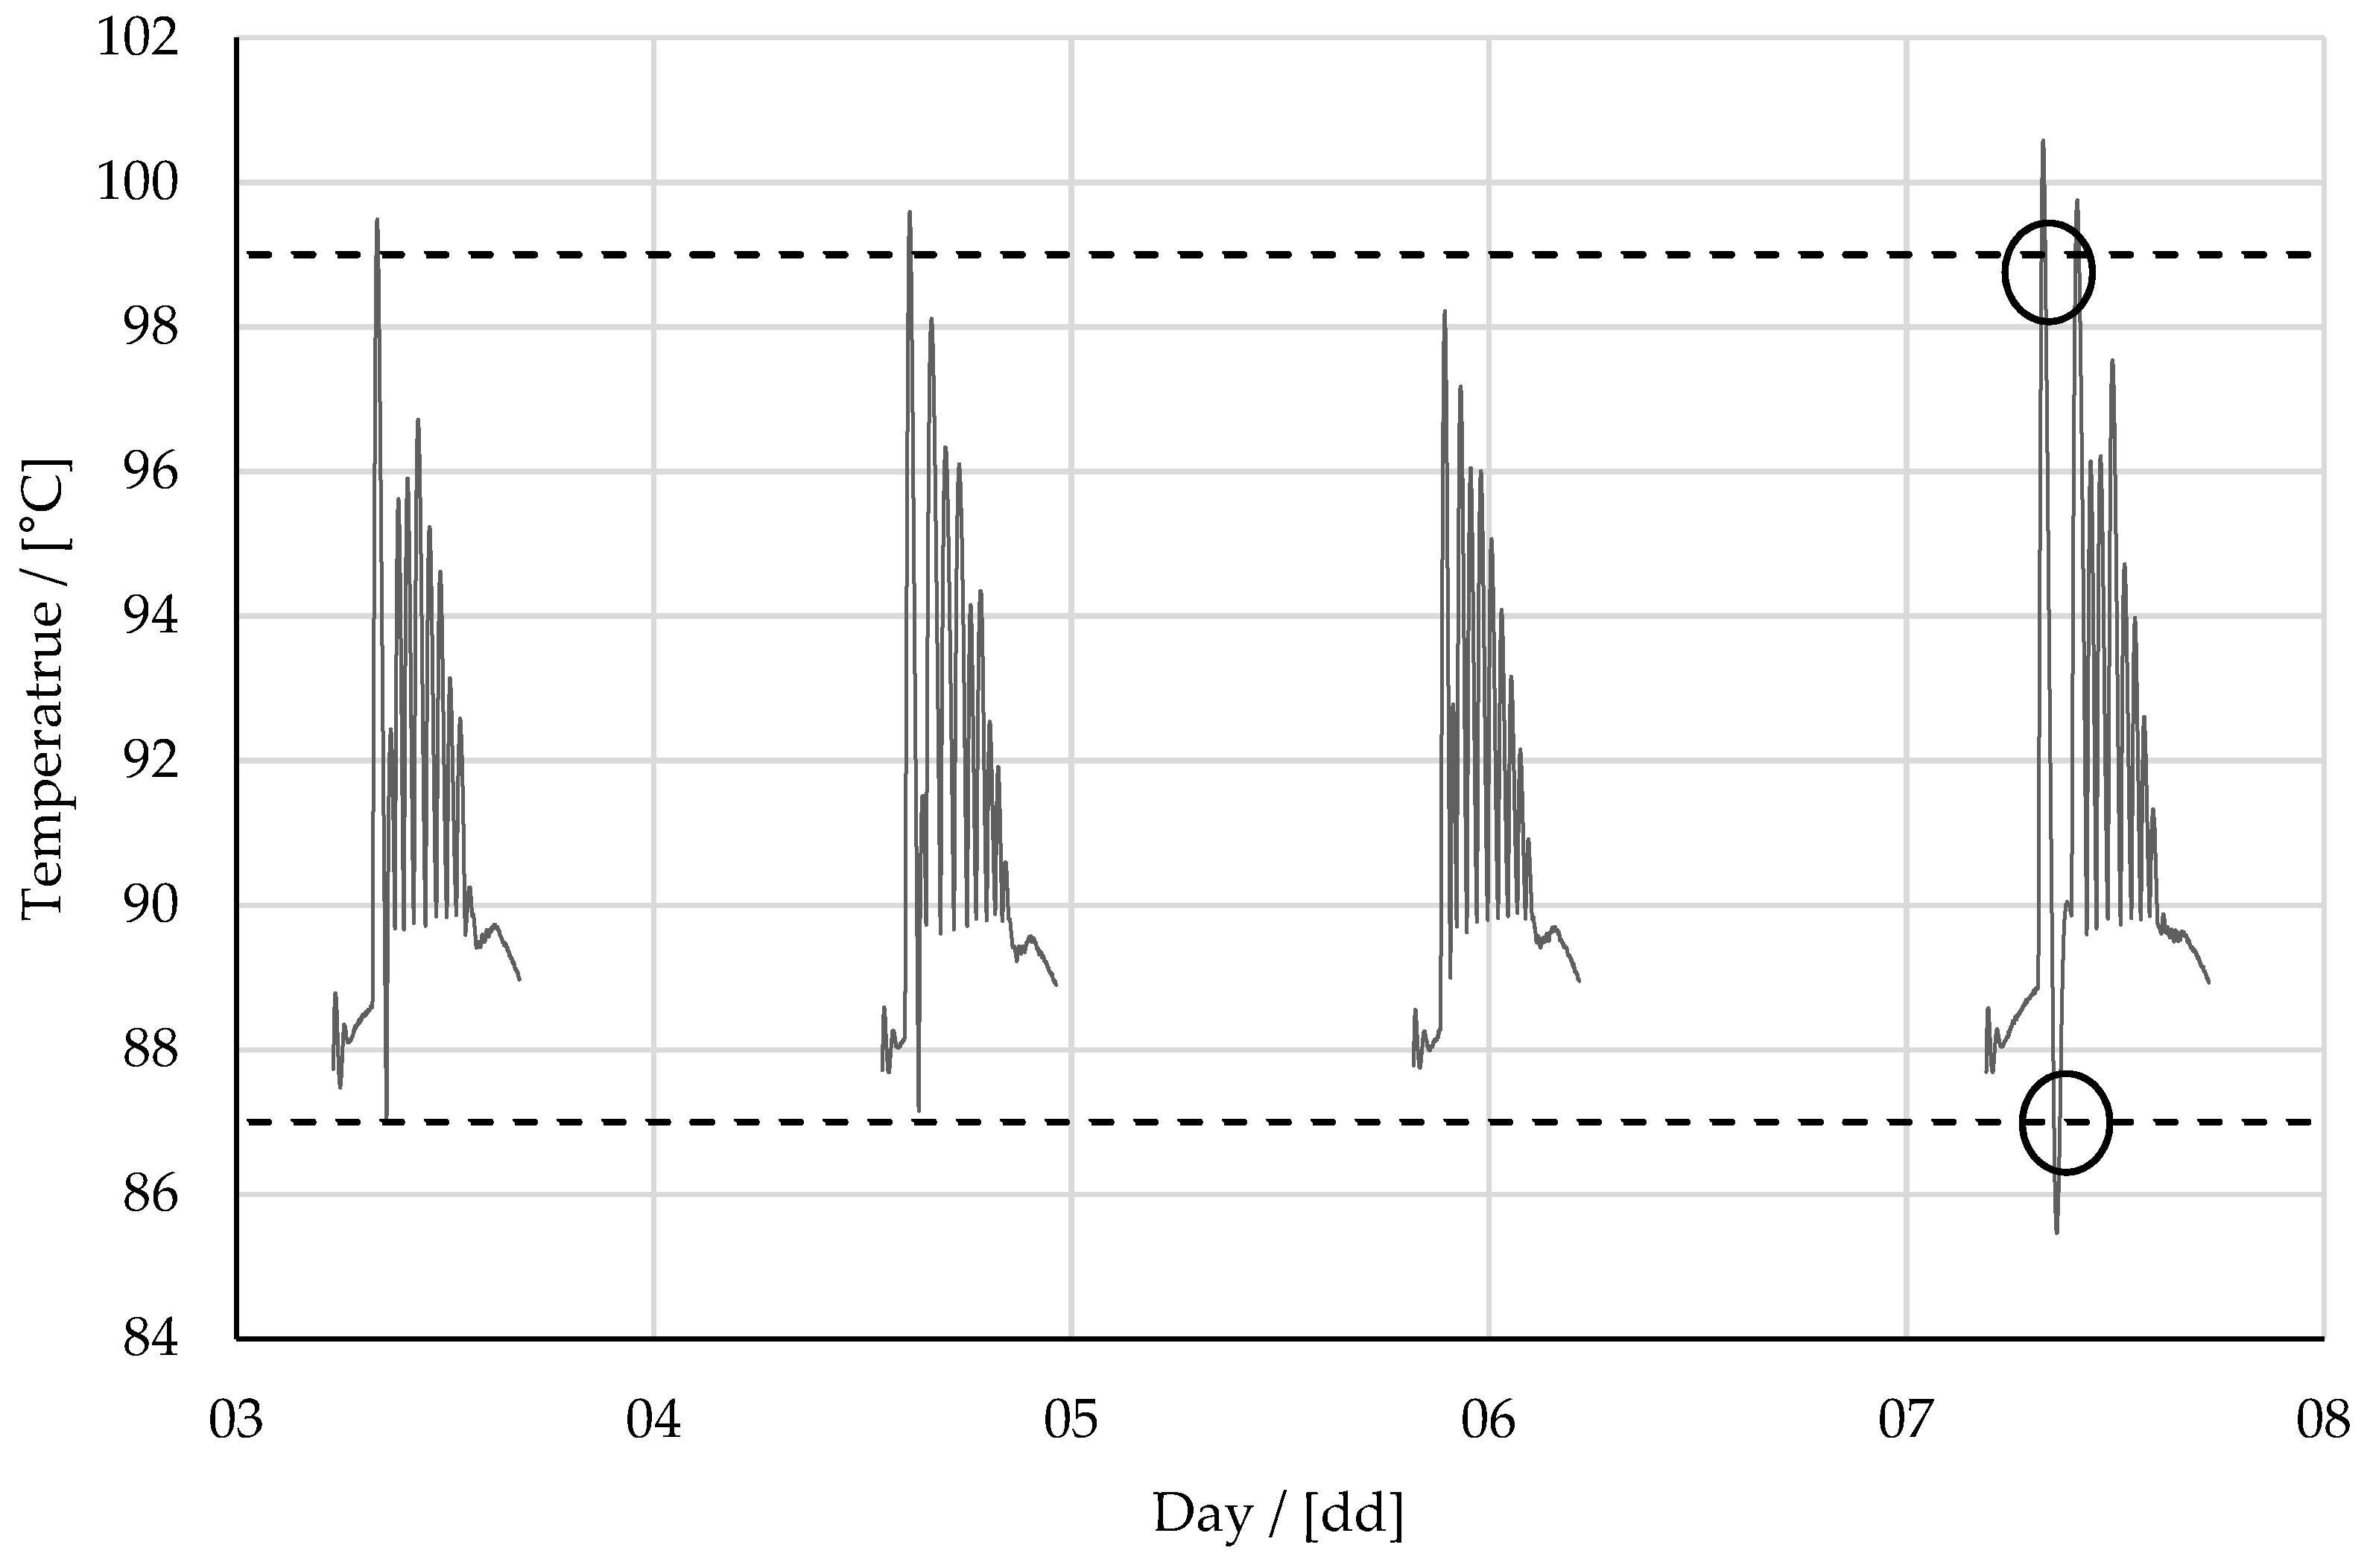
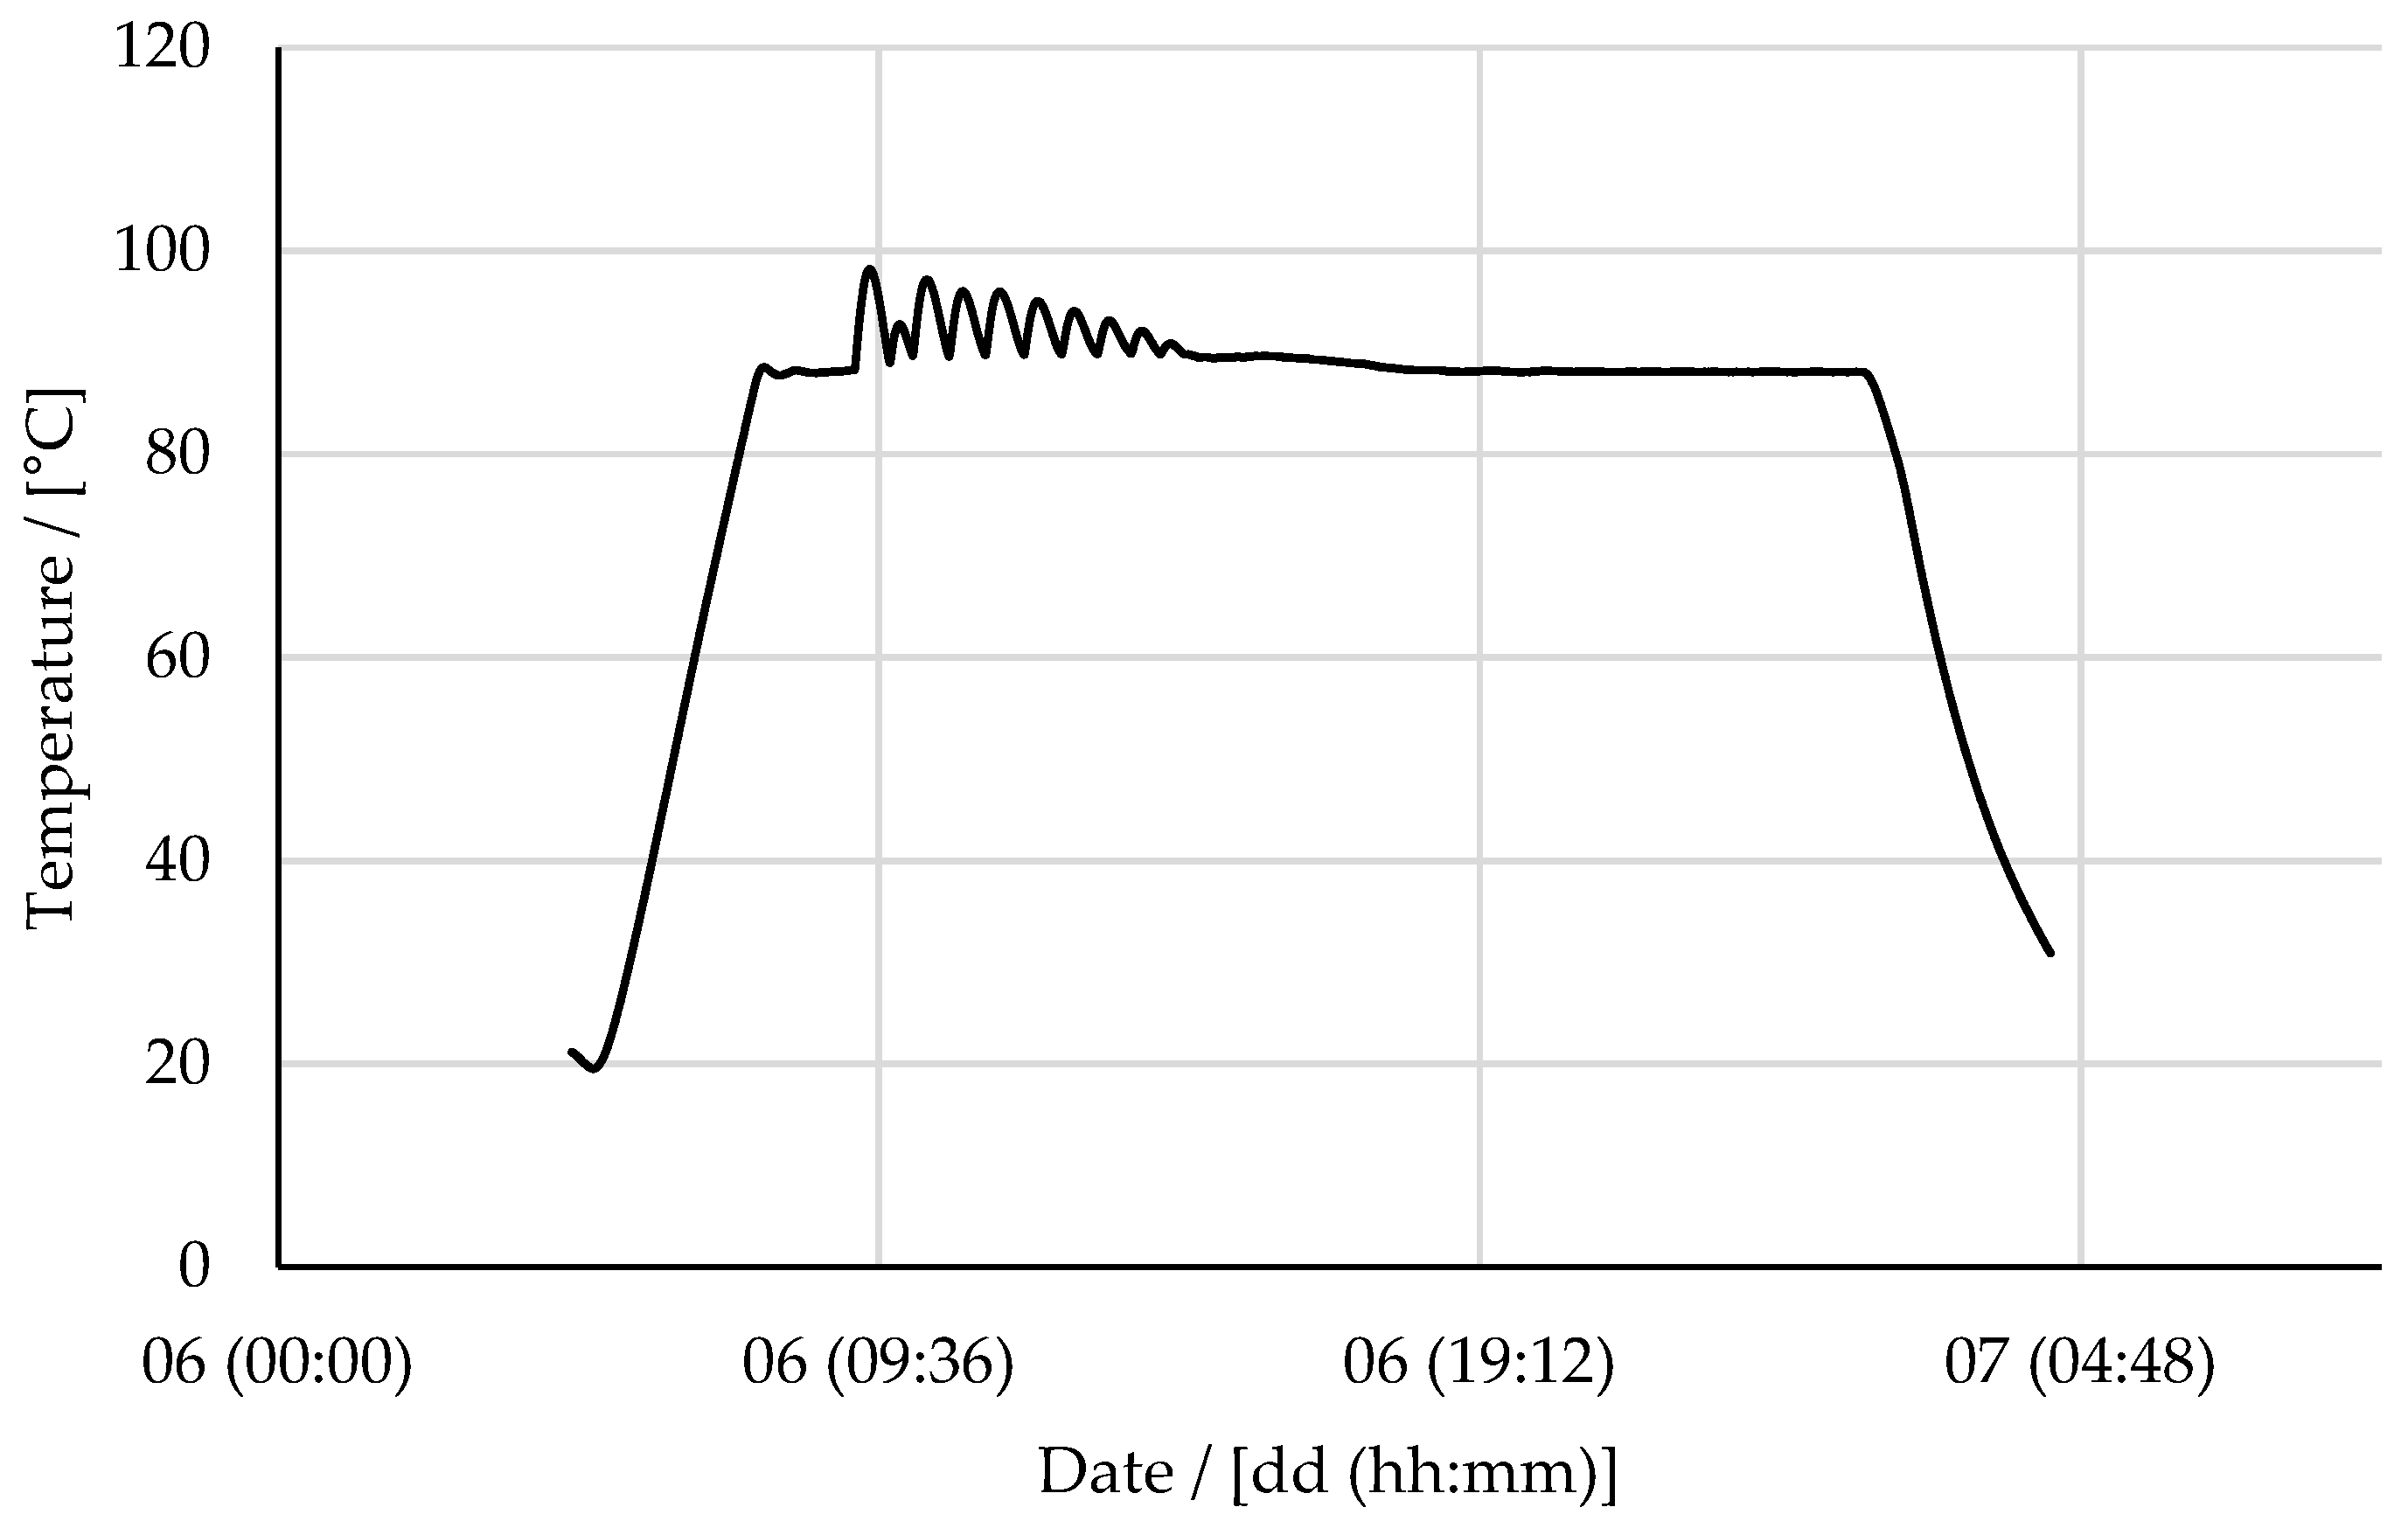
4. Profile PSPIs
- RT100_PhaseName Tag used to isolate data only during the reaction phase;
- For the heating phase, steam valve position data incorporated to determine when the steam valve was open during the heating phase;
- Aligned steam valve position with the RT100_PhaseName tag data;
- Results cleansed to reflect open steam valve position during the heating phase;
- Temperature data during this open valve position period during the reaction phase highlighted;
- Batch temperature profiles superimposed to identify anomalies;
- Derivative function used to calculate the rate change in temperature as shown in the formula below:
5. Discussion
6. Conclusions
Author Contributions
Funding
Institutional Review Board Statement
Informed Consent Statement
Data Availability Statement
Acknowledgments
Conflicts of Interest
References
- De Blois, L.A. Progress in Accident Prevention. Mon. Labor Rev. 1926, 22, 1–3. [Google Scholar]
- Heinrich, H.; Blake, R. The Accident Cause Ratio 88:10:2. National Safety News, May 1956; 18–22. [Google Scholar]
- Lee, J.; Cameron, I.; Hassall, M. Improving process safety: What roles for Digitalization and Industry 4.0? Process Saf. Environ. Prot. 2019, 132, 325–339. [Google Scholar] [CrossRef]
- Holmstrom, D.; Altamirano, F.; Banks, J.; Joseph, G.; Kaszniak, M.; Mackenzie, C.; Shroff, R.; Cohen, H.; Wallace, S. CSB investigation of the explosions and fire at the BP texas city refinery on 23 March 2005. Process Saf. Prog. 2006, 25, 345–349. [Google Scholar] [CrossRef]
- Baker, J.A.; Leveson, N.; Bowman, F.L.; Priest, S.; Erwin, G.; Rosenthal, I.; Gorton, S.; Tebo, P.; Hendershot, D.; Wiegmann, D.; et al. The Report of The BP U.S. Refineries Independent Safety Review Panel; The BP U.S. Refineries Independent Safety Review Panel: Texas City, TX, USA, 2007; p. 374. [Google Scholar]
- Allars, K. BP Texas City Incident Baker Review; Health and Safety Executive: Bootle, UK, 2007; p. 2. [Google Scholar]
- Hopkins, A. Thinking About Process Safety Indicators. Saf. Sci. 2009, 47, 460–465. [Google Scholar] [CrossRef]
- Klein, T.; Viard, R. Process Safety Performance Indicators in Chemical Industry—What Makes It a Success Story and What Did We Learn So Far? Chem. Eng. Trans. 2013, 31, 391–396. [Google Scholar] [CrossRef]
- Le Coze, J.-C.; Pettersen, K.; Reiman, T. The foundations of safety science. Saf. Sci. 2014, 67, 1–69. [Google Scholar] [CrossRef]
- Cundius, C.; Alt, R. Real-Time or Near Real-Time?-Towards a Real-Time Assessment Model. In Proceedings of the 34th International Conference on Information Systems, Milano, Italy, 15–18 December 2013. [Google Scholar]
- Aveva. AVEVA™ Historian. 2021. Available online: https://www.aveva.com/en/products/historian/ (accessed on 13 July 2021).
- Syngenta. Huddersfield Public Information Zone. 2021. Available online: https://www.syngenta.co.uk/publicinformationzone (accessed on 13 July 2021).
- Ali, M.; Cai, X.; Khan, F.I.; Pistikopoulos, E.N.; Tian, Y. Dynamic risk-based process design and operational optimization via multi-parametric programming. Digit. Chem. Eng. 2023, 7, 100096. [Google Scholar] [CrossRef]
- Pasman, H.; Rogers, W. How can we use the information provided by process safety performance indicators? Possibilities and limitations. J. Loss Prev. Process Ind. 2014, 30, 197–206. [Google Scholar] [CrossRef]
- Reiman, T.; Pietikäinen, E. Leading indicators of system safety—Monitoring and driving the organizational safety potential. Saf. Sci. 2012, 50, 1993–2000. [Google Scholar] [CrossRef]
- Swuste, P.; Nunen, K.v.; Schmitz, P.; Reniers, G. Process safety indicators, how solid is the concept? Chem. Eng. Trans. 2019, 77, 85–90. [Google Scholar] [CrossRef]
- Selvik, J.T.; Bansal, S.; Abrahamsen, E.B. On the use of criteria based on the SMART acronym to assess quality of performance indicators for safety management in process industries. J. Loss Prev. Process Ind. 2021, 70, 104392. [Google Scholar] [CrossRef]
- Jacobs, F.R.; Chase, R. Operations and Supply Chain Management, 5th ed.; McGraw-Hill Education: New York, NY, USA, 2019; p. 544. [Google Scholar]
- Klose, A.; Wagner-Stürz, D.; Neuendorf, L.; Oeing, J.; Khaydarov, V.; Schleehahn, M.; Kockmann, N.; Urbas, L. Automated Evaluation of Biochemical Plant KPIs based on DEXPI Information. Chem. Ing. Tech. 2023, 95, 1165–1171. [Google Scholar] [CrossRef]
- Kasie, F.M.; Belay, A.M. The impact of multi-criteria performance measurement on business performance improvement. J. Ind. Eng. Manag. 2013, 6, 595–625. [Google Scholar] [CrossRef]
- Parmenter, D. Key Performance Indicators: Developing, Implementing, and Using Winning KPIs, 3rd ed.; Wiley: Hoboken, NJ, USA, 2015; p. 444. [Google Scholar]
- Hutchins, D. Hoshin Kanri: The Strategic Approach to Continuous Improvement; Taylor and Francis: Abingdon, UK, 2016. [Google Scholar] [CrossRef]
- Leveson, N. A systems approach to risk management through leading safety indicators. Reliab. Eng. Syst. Saf. 2015, 136, 17–34. [Google Scholar] [CrossRef]
- Zwetsloot, G.I.J.M. Prospects and limitations of process safety performance indicators. Saf. Sci. 2009, 47, 495–497. [Google Scholar] [CrossRef]
- Sultana, S.; Andersen, B.S.; Haugen, S. Identifying safety indicators for safety performance measurement using a system engineering approach. Process Saf. Environ. Prot. 2019, 128, 107–120. [Google Scholar] [CrossRef]
- Louvar, J. Guidance for safety performance indicators. Process Saf. Prog. 2010, 29, 387–388. [Google Scholar] [CrossRef]
- Diaz, E.; Watts, M. Metrics-driven decision-making improves performance at a complex process facility. Process Saf. Prog. 2020, 39, e12092. [Google Scholar] [CrossRef]
- IChemE. Loss Prevention Bulletin. 2022. Available online: https://www.icheme.org/knowledge/loss-prevention-bulletin/ (accessed on 1 September 2022).
- Ness, A. Lessons Learned from Recent Process Safety Incidents; American Institute of Chemical Engineers: New York, NY, USA, 2015; Volume 111, p. 23. [Google Scholar]
- Zhao, J.; Suikkanen, J.; Wood, M. Lessons learned for process safety management in China. J. Loss Prev. Process Ind. 2014, 29, 170–176. [Google Scholar] [CrossRef]
- HSE. Health and Safety Executive. Information and Services. 2022. Available online: https://www.hse.gov.uk/ (accessed on 13 October 2022).
- Mendeloff, J.; Han, B.; Fleishman-Mayer, L.A.; Vesely, J.V. Evaluation of process safety indicators collected in conformance with ANSI/API Recommended Practice 754. J. Loss Prev. Process Ind. 2013, 26, 1008–1014. [Google Scholar] [CrossRef]
- Harhara, A.; Arora, A.; Faruque Hasan, M.M. Process safety consequence modeling using artificial neural networks for approximating heat exchanger overpressure severity. Comput. Chem. Eng. 2023, 170, 108098. [Google Scholar] [CrossRef]
- Singh, P.; Sunderland, N.; van Gulijk, C. Determination of the health of a barrier with time-series data how a safety barrier looks different from a data perspective. J. Loss Prev. Process Ind. 2022, 80, 104889. [Google Scholar] [CrossRef]
- Seeq. Seeq about Us. 2023. Available online: https://www.seeq.com/about (accessed on 25 February 2023).
- Di Bona, G.; Silvestri, A.; De Felice, F.; Forcina, A.; Petrillo, A. An Analytical Model to Measure the Effectiveness of Safety Management Systems: Global Safety Improve Risk Assessment (G-SIRA) Method. J. Fail. Anal. Prev. 2016, 16, 1024–1037. [Google Scholar] [CrossRef]
- Falcone, D.; De Felice, F.; Di Bona, G.; Duraccio, V.; Silvestri, A. Risk assessment in a cogeneration system: Validation of a new safety allocation technique. In Proceedings of the 16th IASTED International Conference on Applied Simulation and Modelling, Mallorca, Spain, 29–31 August 2007. [Google Scholar]
- Yadav, O.P.; Zhuang, X. A practical reliability allocation method considering modified criticality factors. Reliab. Eng. Syst. Saf. 2014, 129, 57–65. [Google Scholar] [CrossRef]


| Name | 1–28 February |
|---|---|
| R-100 Temperature Exceeds Limits | 6 |
| Name | 1–28 February |
|---|---|
| R-100 Temperature Exceeds Limits | 6 |
| T-100/T-200 Not Within 5 °C | 0 |
| Date Range | R-100 Temperature Exceeds Limits | T-100/T-200 Not within 5 °C |
|---|---|---|
| January | 1 | 0 |
| February | 6 | 0 |
| March | 3 | 0 |
| April | 0 | 0 |
| May | 0 | 0 |
| June | 3 | 0 |
| July | 3 | 0 |
| August | 1 | 0 |
| September | 1 | 0 |
| October | 3 | 0 |
| November | 1 | 0 |
| December | 0 | 0 |
| Name | 1–28 February | |
|---|---|---|
| Leading Measures | R-100 Temperature Exceeds Limits | 6 |
| T-100 / T-200 Not Within 5 °C | 0 | |
| R-300 P-100 Exceeds Limits | 0 | |
| R-300 P-100 Neutralisation Step Exceeds Limits | 0 | |
| I-100 Temperature Within Operating Limits | 0 | |
| I-100 T-300 / T-400 Not Within 5 °C | 0 | |
| I-100 T-300 / T-400 Not Within 5 °C in Reaction | 0 | |
| Lagging Measures | I-100 Purge Check | 0 |
| I-100 Low Inert Gas Flow | 0 | |
| Health Check of Alarms | I-100 Hi-Lo Temperature Trip Activation | 0 |
| I-100 Low Temperature Trip Activation | 0 | |
| I-100 High Temperature Trip Activation | 0 | |
| R-300 High Pressure Trip Activation | 0 | |
| R-100 High Pressure Trip Activation | 0 | |
| R-100 Hi-Hi Pressure Trip Activation | 0 | |
| R-100 High Temperature Trip Activation | 0 | |
| R-100 High Temperature Alarm Count | 0 |
Disclaimer/Publisher’s Note: The statements, opinions and data contained in all publications are solely those of the individual author(s) and contributor(s) and not of MDPI and/or the editor(s). MDPI and/or the editor(s) disclaim responsibility for any injury to people or property resulting from any ideas, methods, instructions or products referred to in the content. |
© 2023 by the authors. Licensee MDPI, Basel, Switzerland. This article is an open access article distributed under the terms and conditions of the Creative Commons Attribution (CC BY) license (https://creativecommons.org/licenses/by/4.0/).
Share and Cite
Singh, P.; van Gulijk, C.; Sunderland, N. Online Process Safety Performance Indicators Using Big Data: How a PSPI Looks Different from a Data Perspective. Safety 2023, 9, 62. https://doi.org/10.3390/safety9030062
Singh P, van Gulijk C, Sunderland N. Online Process Safety Performance Indicators Using Big Data: How a PSPI Looks Different from a Data Perspective. Safety. 2023; 9(3):62. https://doi.org/10.3390/safety9030062
Chicago/Turabian StyleSingh, Paul, Coen van Gulijk, and Neil Sunderland. 2023. "Online Process Safety Performance Indicators Using Big Data: How a PSPI Looks Different from a Data Perspective" Safety 9, no. 3: 62. https://doi.org/10.3390/safety9030062
APA StyleSingh, P., van Gulijk, C., & Sunderland, N. (2023). Online Process Safety Performance Indicators Using Big Data: How a PSPI Looks Different from a Data Perspective. Safety, 9(3), 62. https://doi.org/10.3390/safety9030062


