1. Introduction
Automated shuttles are small, low-speed (generally less than 25 mph) vehicles that “do not require a human operator, although early demonstrations all have included an onboard human attendant to observe passengers, record data, answer questions, and serve as a safety operator if needed” [
1]. The Federal Transit Administration has included these vehicles in their Strategic Transit Automation Research Plan (2018), intending to address two main service challenges: (1) first/last-mile connections and (2) serving low-demand corridors and areas [
2].
Multiple deployments of these low-speed automated vehicles (LSAVs) have been carried out across the United States at locations such as Ann Arbor, Michigan, and Arlington, Texas, as well as in larger cities such as Minneapolis, Minnesota; Denver, Colorado; and Las Vegas, Nevada [
3,
4,
5]. In all these deployments, research was conducted to assess the rider acceptance and operating performance. While the rider acceptance was generally high for most locations, the northern deployments found that the shuttles did not operate well in extreme weather conditions (e.g., heavy snowfall and cold temperatures reduced electric battery life). Additionally, several programs found that the human safety operators were taking control of the LSAV more frequently over time, perhaps to avoid a hard braking event, which could potentially result in safety conflicts with other road users and passenger injury or discomfort, as these events are unexpected and sometimes without apparent reason. The speeds at which the LSAVs travel are slower than the surrounding traffic, which may impact the traffic flow and contribute to the unsafe interactions between the LSAV and other road users (e.g., drivers may try “to beat” the LSAV by passing illegally or turning in front of it, which can cause the LSAV to stop suddenly). However, no research has evaluated how LSAVs interact with existing infrastructure elements under real-world traffic environments. This study aims to fill this gap by utilizing methods from naturalistic driving studies.
This study aims to assess the infrastructure-related safety implications of having a low-speed, autonomous shuttle operating on public roadways in mixed traffic. The proposed research questions were: (1) Based on the results from the safety analysis, what are the infrastructure elements and traffic conditions that have negative effects on LSAV performance? (2) What limitations should be considered while planning for a potential LSAV or automated transit vehicle deployment? (3) How can transit planners adjust and improve the deployment program as it unfolds?
The data used for this research come from an LSAV deployment in Fairfax, Virginia. The shuttle operated between the Dunn Loring-Merrifield Metrorail Station and the corner of Merrifield Town Center Drive and District Avenue in the Mosaic District, to provide first- and last-mile transportation for passengers (
Figure 1). The route consisted of roads with two to four travel lanes in an urban business area with a 25-mph speed limit. On this route, the LSAV traveled through two signal-controlled intersections and multiple intersections controlled by stop signs. The route that the shuttle followed is shown in
Figure 1.
The deployment utilized an EasyMile EZ10 Gen 3 low-speed autonomous electric shuttle, operating at a maximum of 12 mph on a circulator route on public roads in Merrifield, Virginia, located in Fairfax County. The EZ10 has been used in over 200 deployments, holds up to 12 passengers, and features a complete set of sensors, including LiDAR, cameras, and a real-time kinematic-corrected GPS. The EasyMile EZ10 Gen 3 is advertised as being capable of operating with SAE International Level 4 ADS capability [
6] in certain operational design domains (ODDs). However, a route was chosen for this deployment that would satisfy a legitimate transit need rather than a restricted ODD. As a result, the route included more operational complexity and higher traffic volumes than a typical EasyMile LSAV deployment. Subsequently, the team approached the deployment with the expectation that the LSAV would be operated at SAE Level 3 [
6] capability, with the human safety operator being required to intervene in scenarios that were beyond the vehicle’s automated functional capability.
The LSAV was operated by a third-party mobility company called Transdev, and ran Monday through Thursday between the hours of 10:00 a.m. and 2:00 p.m. In compliance with National Highway Traffic Safety Administration regulations, a human safety operator was onboard at all times to monitor safety while the LSAV was in operation.
2. Materials and Methods
2.1. Instrumentation of the LSAV
As part of this automated shuttle deployment program, the Virginia Tech Transportation Institute (VTTI) instrumented the shuttle with a data acquisition system (DAS) and cameras [
7]. The analysis in this paper provides results only from the first 7 months of data collection (21 October 2020, through 18 May 2021).
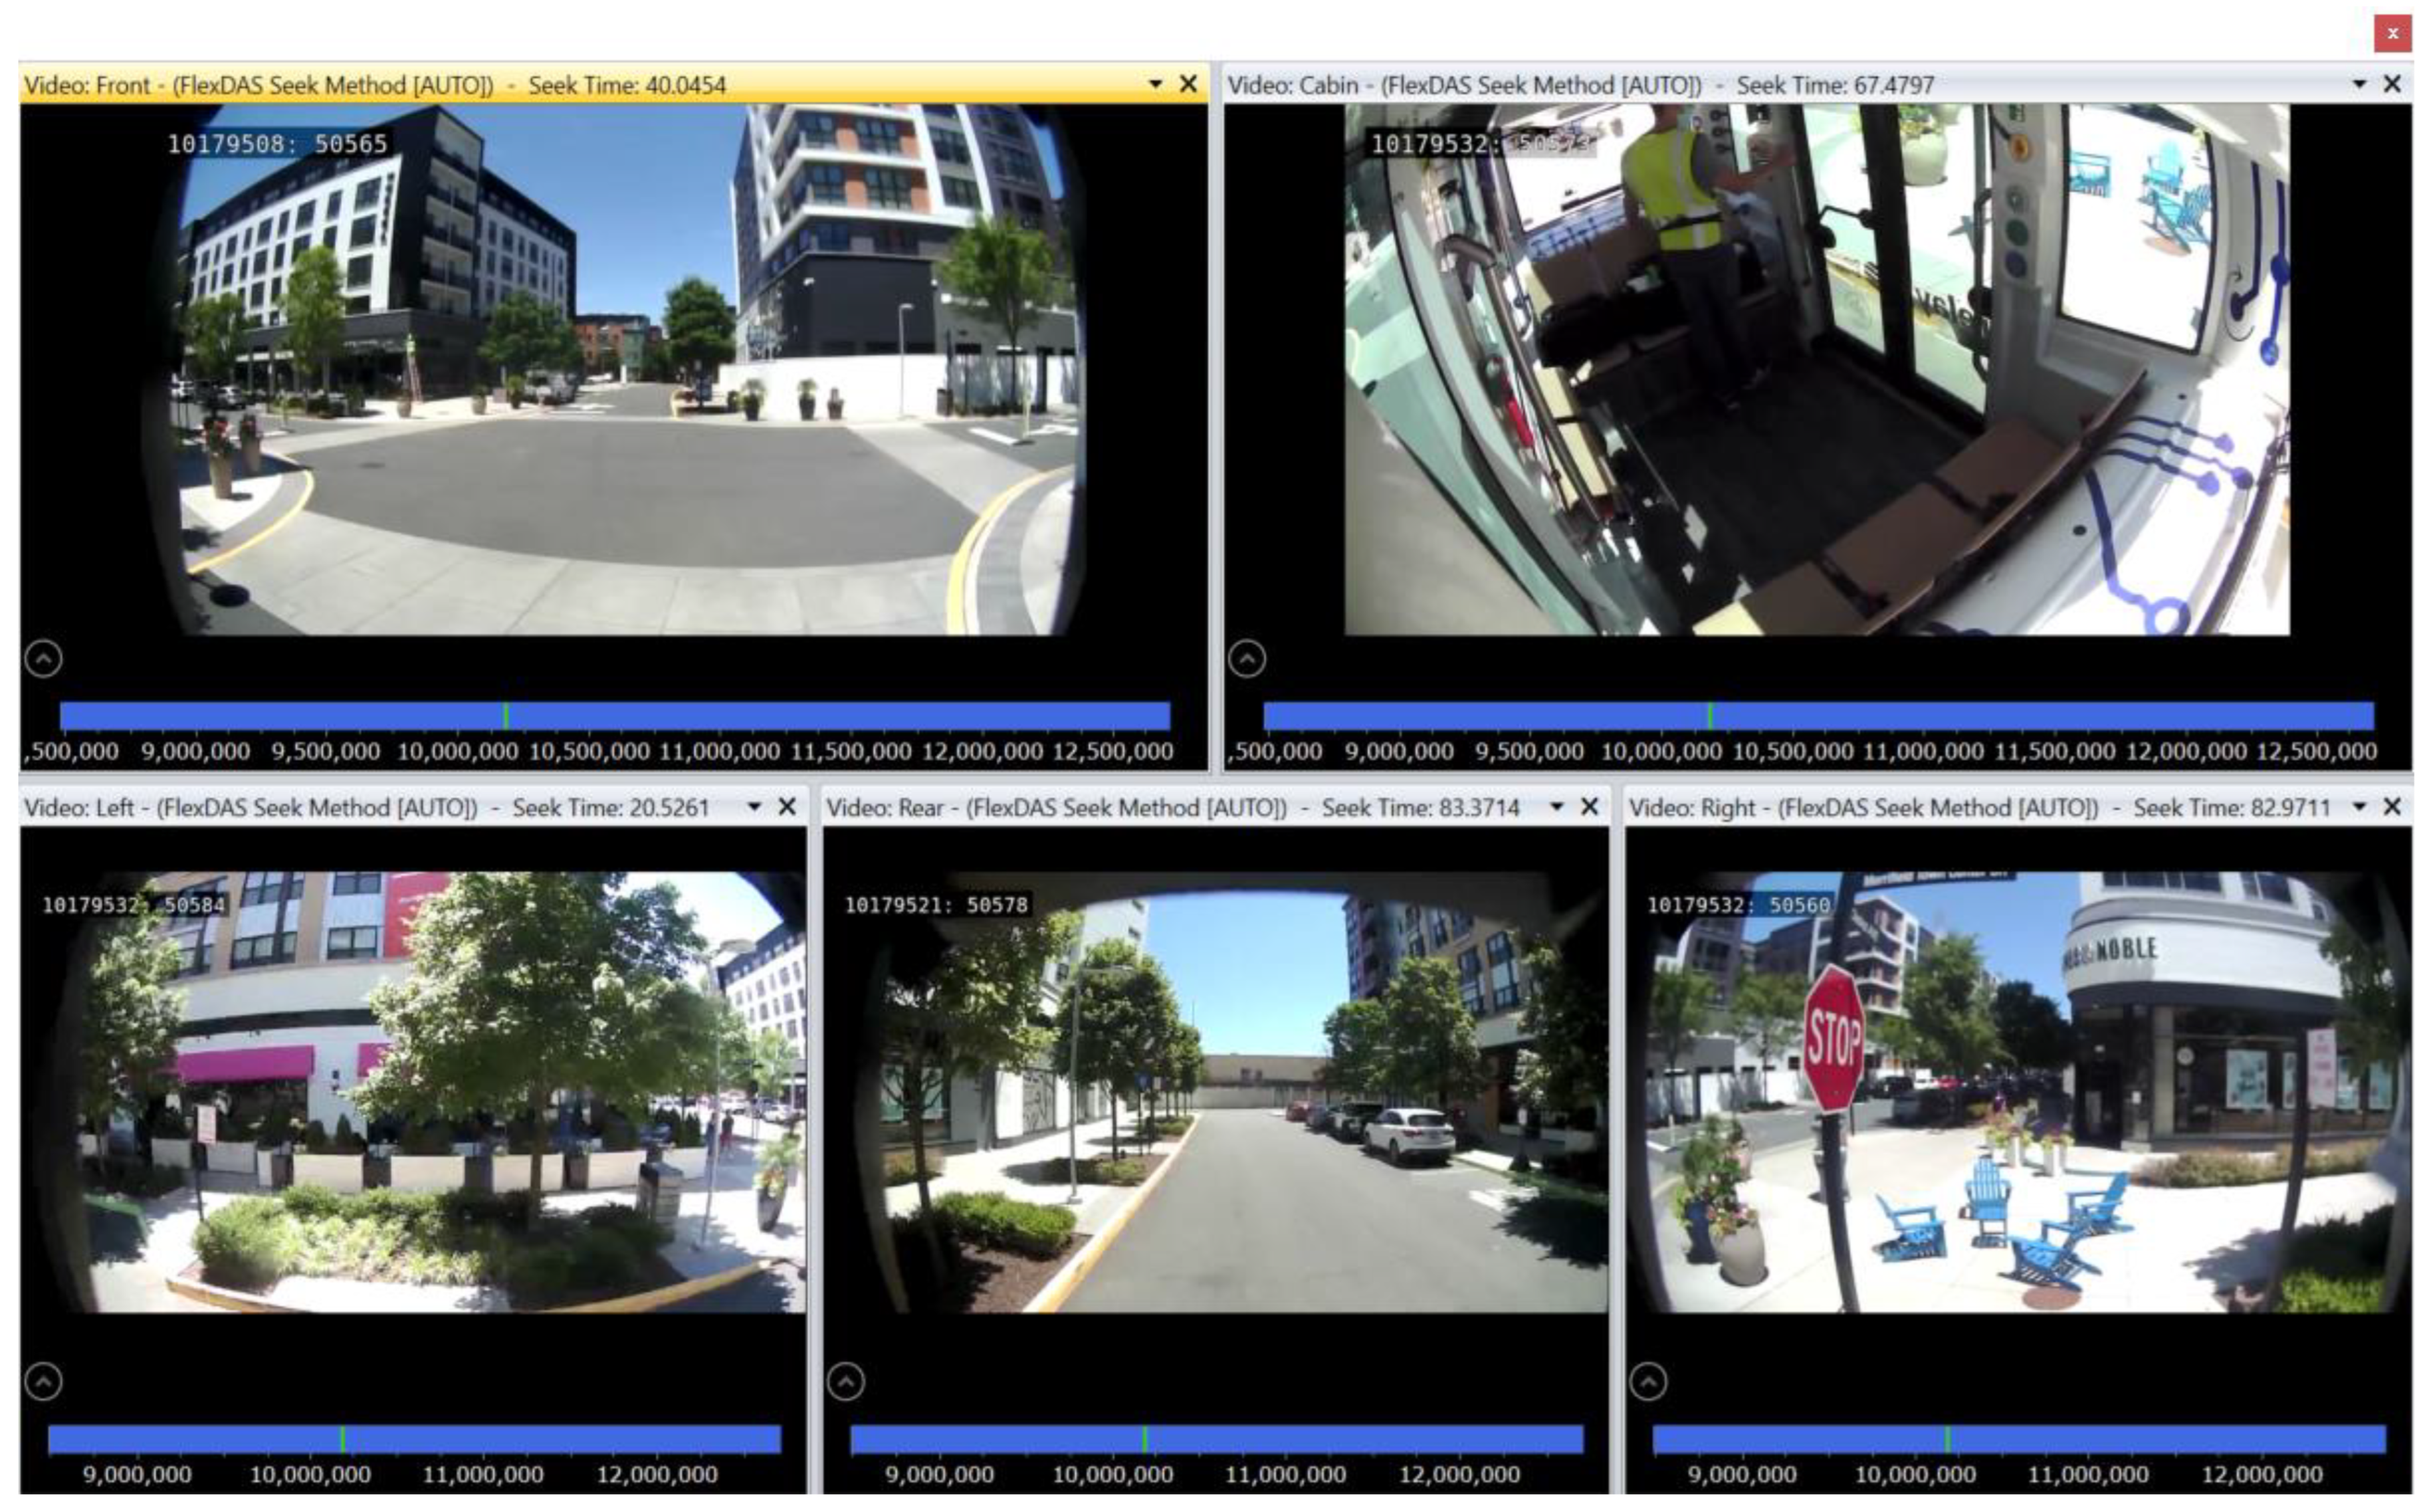
Five cameras were installed onboard the LSAV, each of which collected continuous video when the LSAV was in operation. These five cameras recorded (1) the forward view, (2) inside the shuttle, (3) toward the left side of the shuttle, (4) the rearward view, and (5) toward the right side of the shuttle. The external cameras provided 360-degree coverage around the LSAV, allowing the research team adequate visibility of conditions around the vehicle during the disengagement events. These camera views were selected to capture traffic interactions with a wide variety of road users, including pedestrians and pedal-cyclists, as well as the impact of the disengagements on any passengers onboard at the time of the event.
Figure 2 shows the images obtained from each camera view [
7].
2.2. Event-Type Definitions and Video Coding
Data were recorded continuously while the LSAV was operational. Given that it was not possible to review every second of the continuous video data, specific segments of the video during which any of the following events were reported were selected for reviewing by trained data coders. The events were identified through the disengagement report provided by the LSAV manufacturer. Three types of events were identified: e-stops, soft stops, and circumventions.
E-stops are events where the LSAV safety system logic initiated a hard brake maneuver (averaging 0.3 g deceleration), culminating in a complete stop. E-stops were identified using a monthly disengagement report provided by EasyMile. This deceleration rate was enough to cause unsecured objects or passengers to slide off seats if not belted in or holding on. These reports included a universal time-coordinated timestamp for each disengagement that could be correlated to the DAS timestamp recorded with the video and sensor data. All of these events were reviewed by trained data coders and further classified as valid or invalid. Valid events were those where there was a clear obstacle or threat present in the video. Invalid events were those where it was not possible to determine an apparent reason why the system performed such a stop or what “obstacle” was detected by the software.
Soft stops were manually initiated by the human operator in response to a situation where they wanted to bring the vehicle to a less aggressive stop. The soft stop event resulted in braking to a stop with a 0.05 g rate of deceleration. Over time, operators learned which situations would likely result in an e-stop or unsafe condition, and would initiate a soft stop to avoid a more aggressive e-stop for better rider experience. Soft stops were also documented in the disengagement report provided by EasyMile. Additionally, after some of these soft stops, the human operator also needed to maneuver around an obstacle manually (e.g., encountering a double-parked vehicle within the path of the travel defined for the LSAV). The periods of time where the safety operator was manually controlling the vehicle were defined as circumventions and are detailed further below.
Circumvention events occurred when the human operator took manual control of the LSAV and physically maneuvered around an obstacle using controls located onboard the LSAV. Circumvention events typically occurred after either an e-stop or soft stop disengagement. Circumventions were also reviewed by data coders to look for any safety-critical situations that may have occurred while the operator was maneuvering the vehicle [
7].
2.3. Event Coding Procedures
The cameras and DAS onboard the LSAV allowed trained data coders at the VTTI to review the video surrounding the event of interest and identify potential contributing factors, environmental conditions, and the role of other road users in these events. There were two parts to the data coding procedure: baseline coding and safety-critical event coding. The first part of the coding protocol was conducted for every disengagement event identified in the dataset. The variables in the first protocol reported the trigger type and reason for the trigger, as well as environmental conditions, passenger presence, and the potential role of other road users in the event. The second part of the data coding protocol sought to provide a more detailed classification of context if a safety-critical event or interaction was determined to have occurred. For this protocol, a safety-critical event was defined as any event where the operators’, passengers’, or other road users’ safety was compromised, resulting in a crash, near-crash, crash-related conflict, or proximity conflict. If a safety-critical event also occurred as a result of this triggered event, additional variables were coded that provided information regarding the sequence of events surrounding the event and the role of other road users. The variables that were coded as part of this review are listed in
Table 1.
For conflicts related to traffic signals, the coding was further simplified to only record whether the LSAV was within the bounds of the intersection (defined as between the stop bar at the entry of the intersection and the crosswalk at the exit of the intersection) at the time of the signal phase change. Data coders also recorded whether the signal was yellow or red. If the signal was red, the LSAV Event Reduction protocol was also completed (See
Table 1).
2.4. Segmentation of the Route
In addition to the video data reduction of events, an automated reduction process relating the baseline triggered events and safety-critical events to different segments on the route was performed to examine the effect of different infrastructure elements on the LSAV performance. This reduction was achieved by constructing a GPS map of the deployment route and using geofences to breakdown the route into small pieces. The whole route was broken into 54 polygons, and the GPS coordinates for the four corners of each section were identified and recorded. These coordinates served as a geofence for each of the route sections. For each of these 54 sections along the route, the research team utilized video data, Google Earth, and the Virginia Department of Transportation knowledge to determine the infrastructure elements of interest that were present. The LSAV performance was measured using kinematics data, rates of triggered events, and safety-critical events. For each identified triggered event and safety-critical event during the previous reduction process, the GPS location of the event was coded and localized to different sections of the route according to the GPS map constructed. The infrastructure elements coded are shown below in
Table 2.
Using the GPS map and results from the safety analysis, the research team was able to relate the LSAV performance with different infrastructure elements along the route. After all the events were coded and assigned to different route sections, the event rates under different infrastructure elements were calculated using the number of triggered events and kinematics data gathered for each route section across all the sections with the same infrastructure element. This provided the ability to compare the LSAV performance under different infrastructure elements and configurations. The research team identified some infrastructure elements that can pose a threat to LSAVs and the most complex infrastructure configuration for the LSAV along the route. The infrastructure configurations were identified by locating the most problematic route sections and analyzing the infrastructure elements present in these sections. The research team also identified the three route sections with the highest rates of triggered events.
3. Results
The following results are organized by the flow of the reduction. First, an overview of the triggered events and the infrastructure-related distribution of triggered events is presented, since these events served as a basis for further reductions. The second part presents the distribution of safety-critical events by infrastructure elements. A total of 852 trigged events were identified by the manufacturer, including 148 e-stops, 449 soft stops, 189 circumventions, and 66 signal phase and timing events (which was not presented in the results since it is out of the scope of this analysis). Among these events that went through reduction, 41 safety-critical events were identified. Finally, the results from kinematics data analysis and the most problematic route sections identified are presented.
Per the defined scope of the research effort, these results were evaluated for data collected during the first 7 months of data collection (21 October 2020, through 19 May 2021). When appropriate, the results are presented in event rates per mile traveled to make for a standardized comparison.
3.1. Overview of Triggered Events
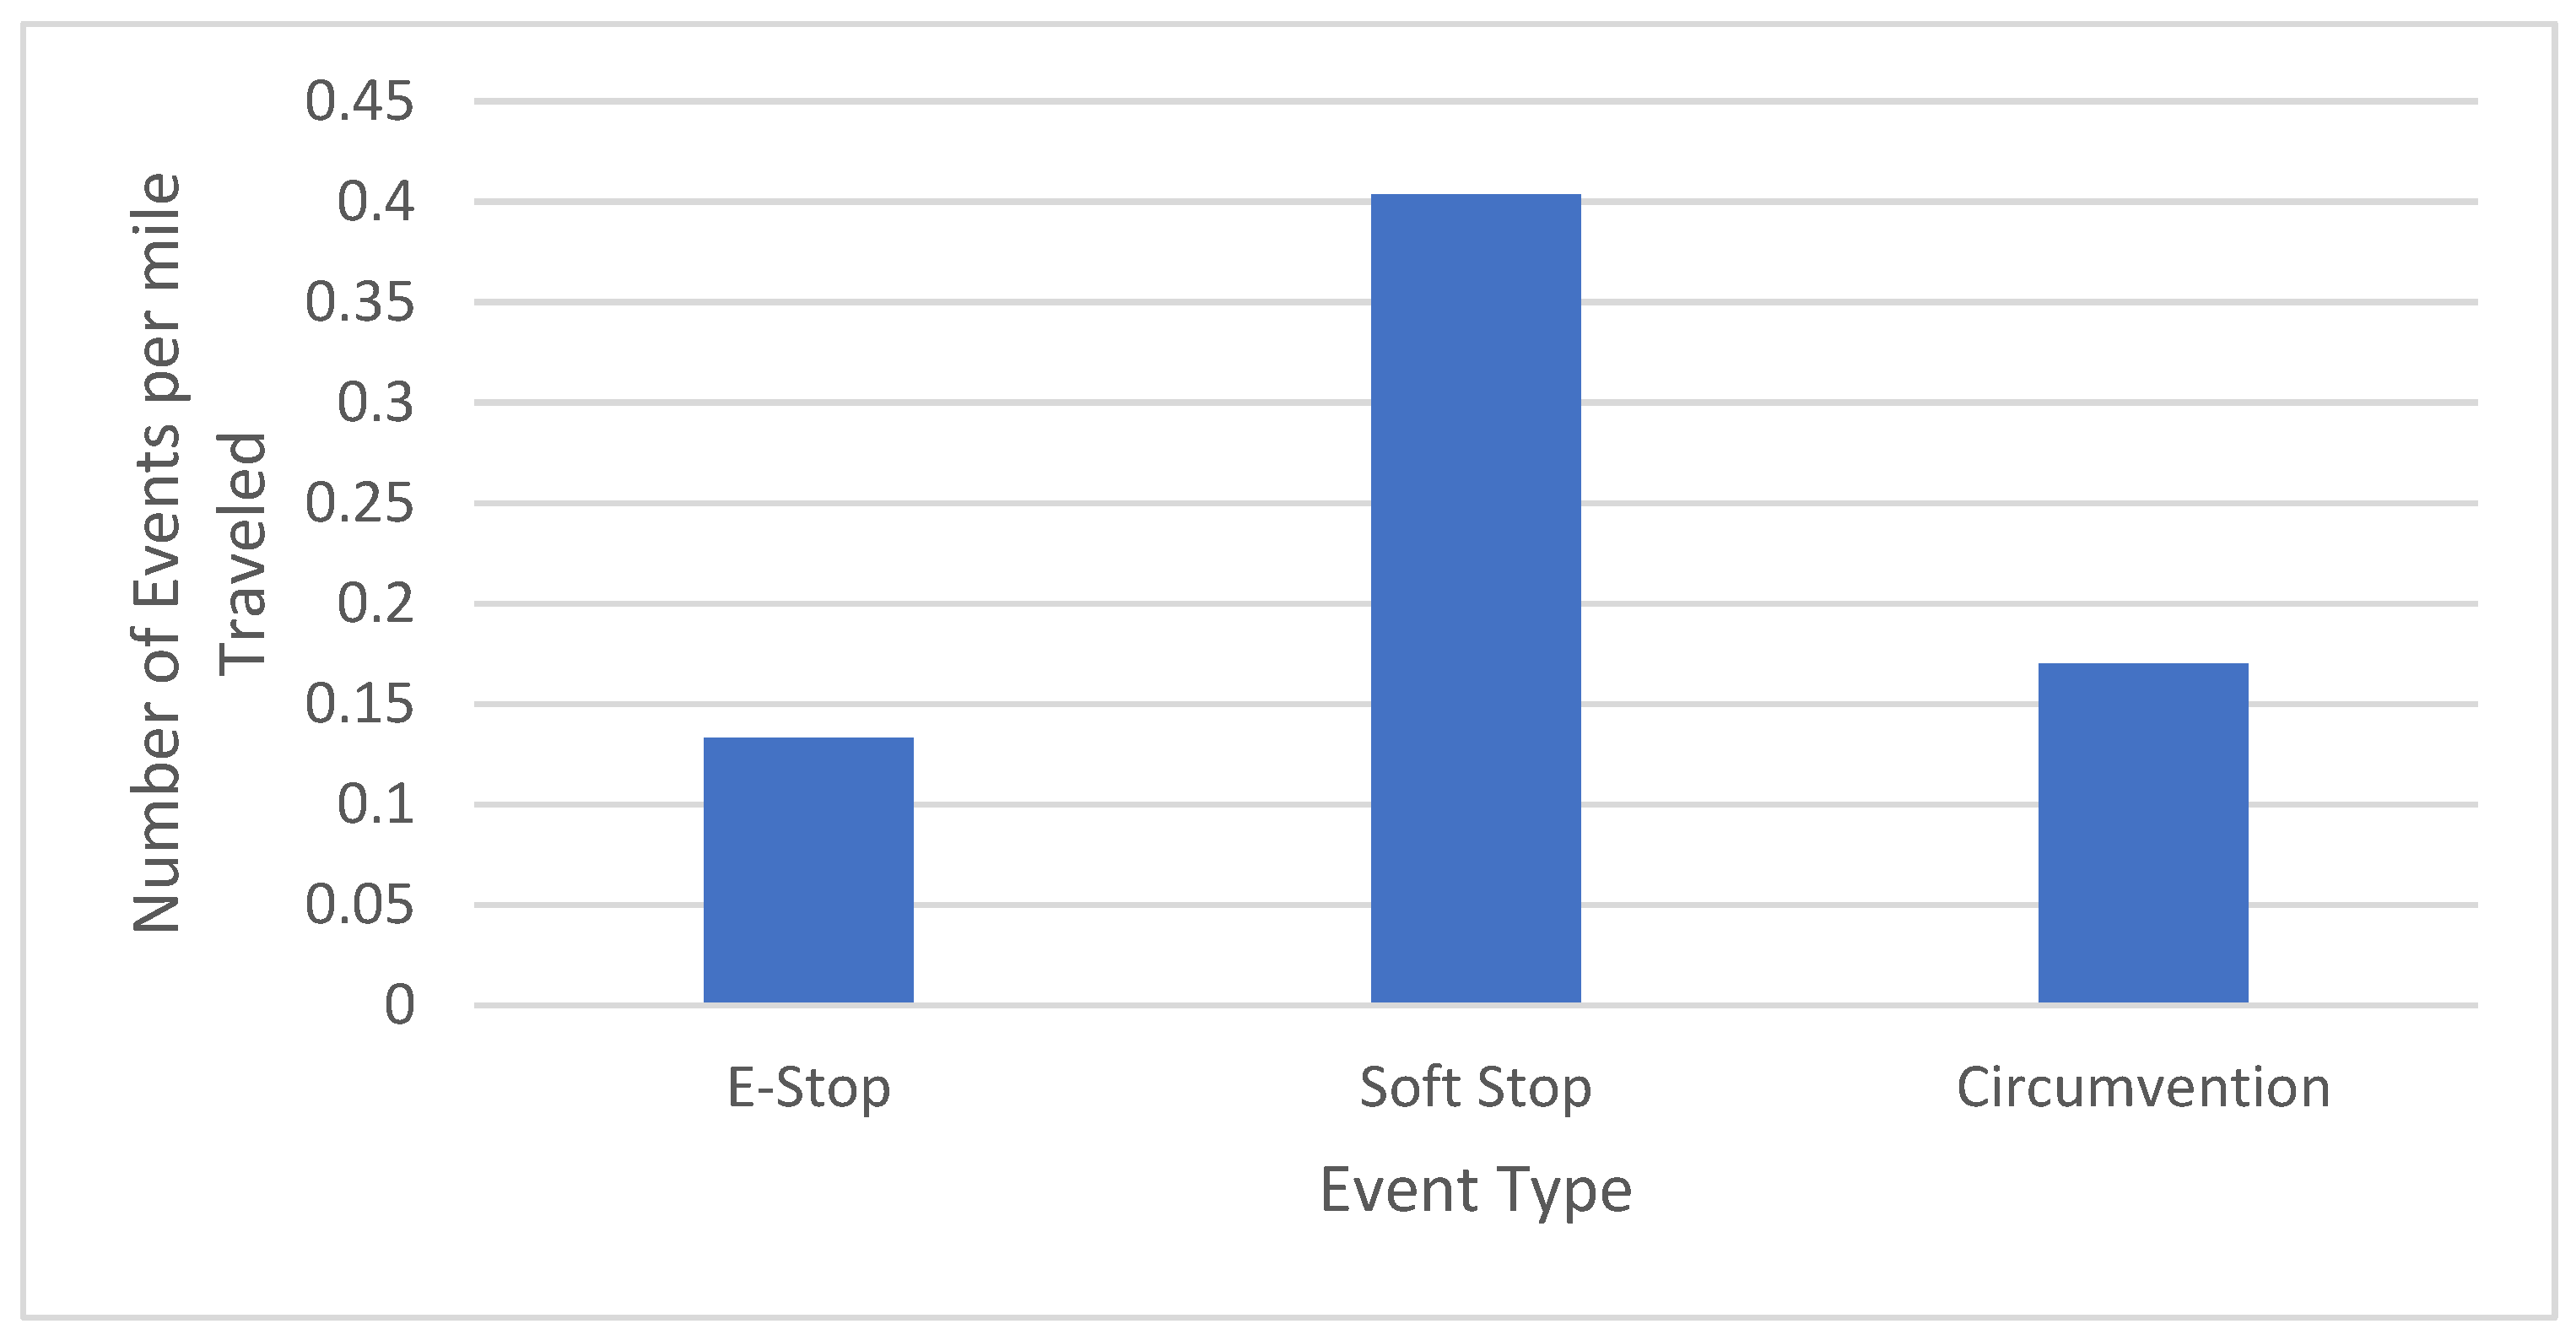
Figure 3 below presents the total number of events by trigger type. It is clear from the results that soft stop is the most common trigger type for disengagement.
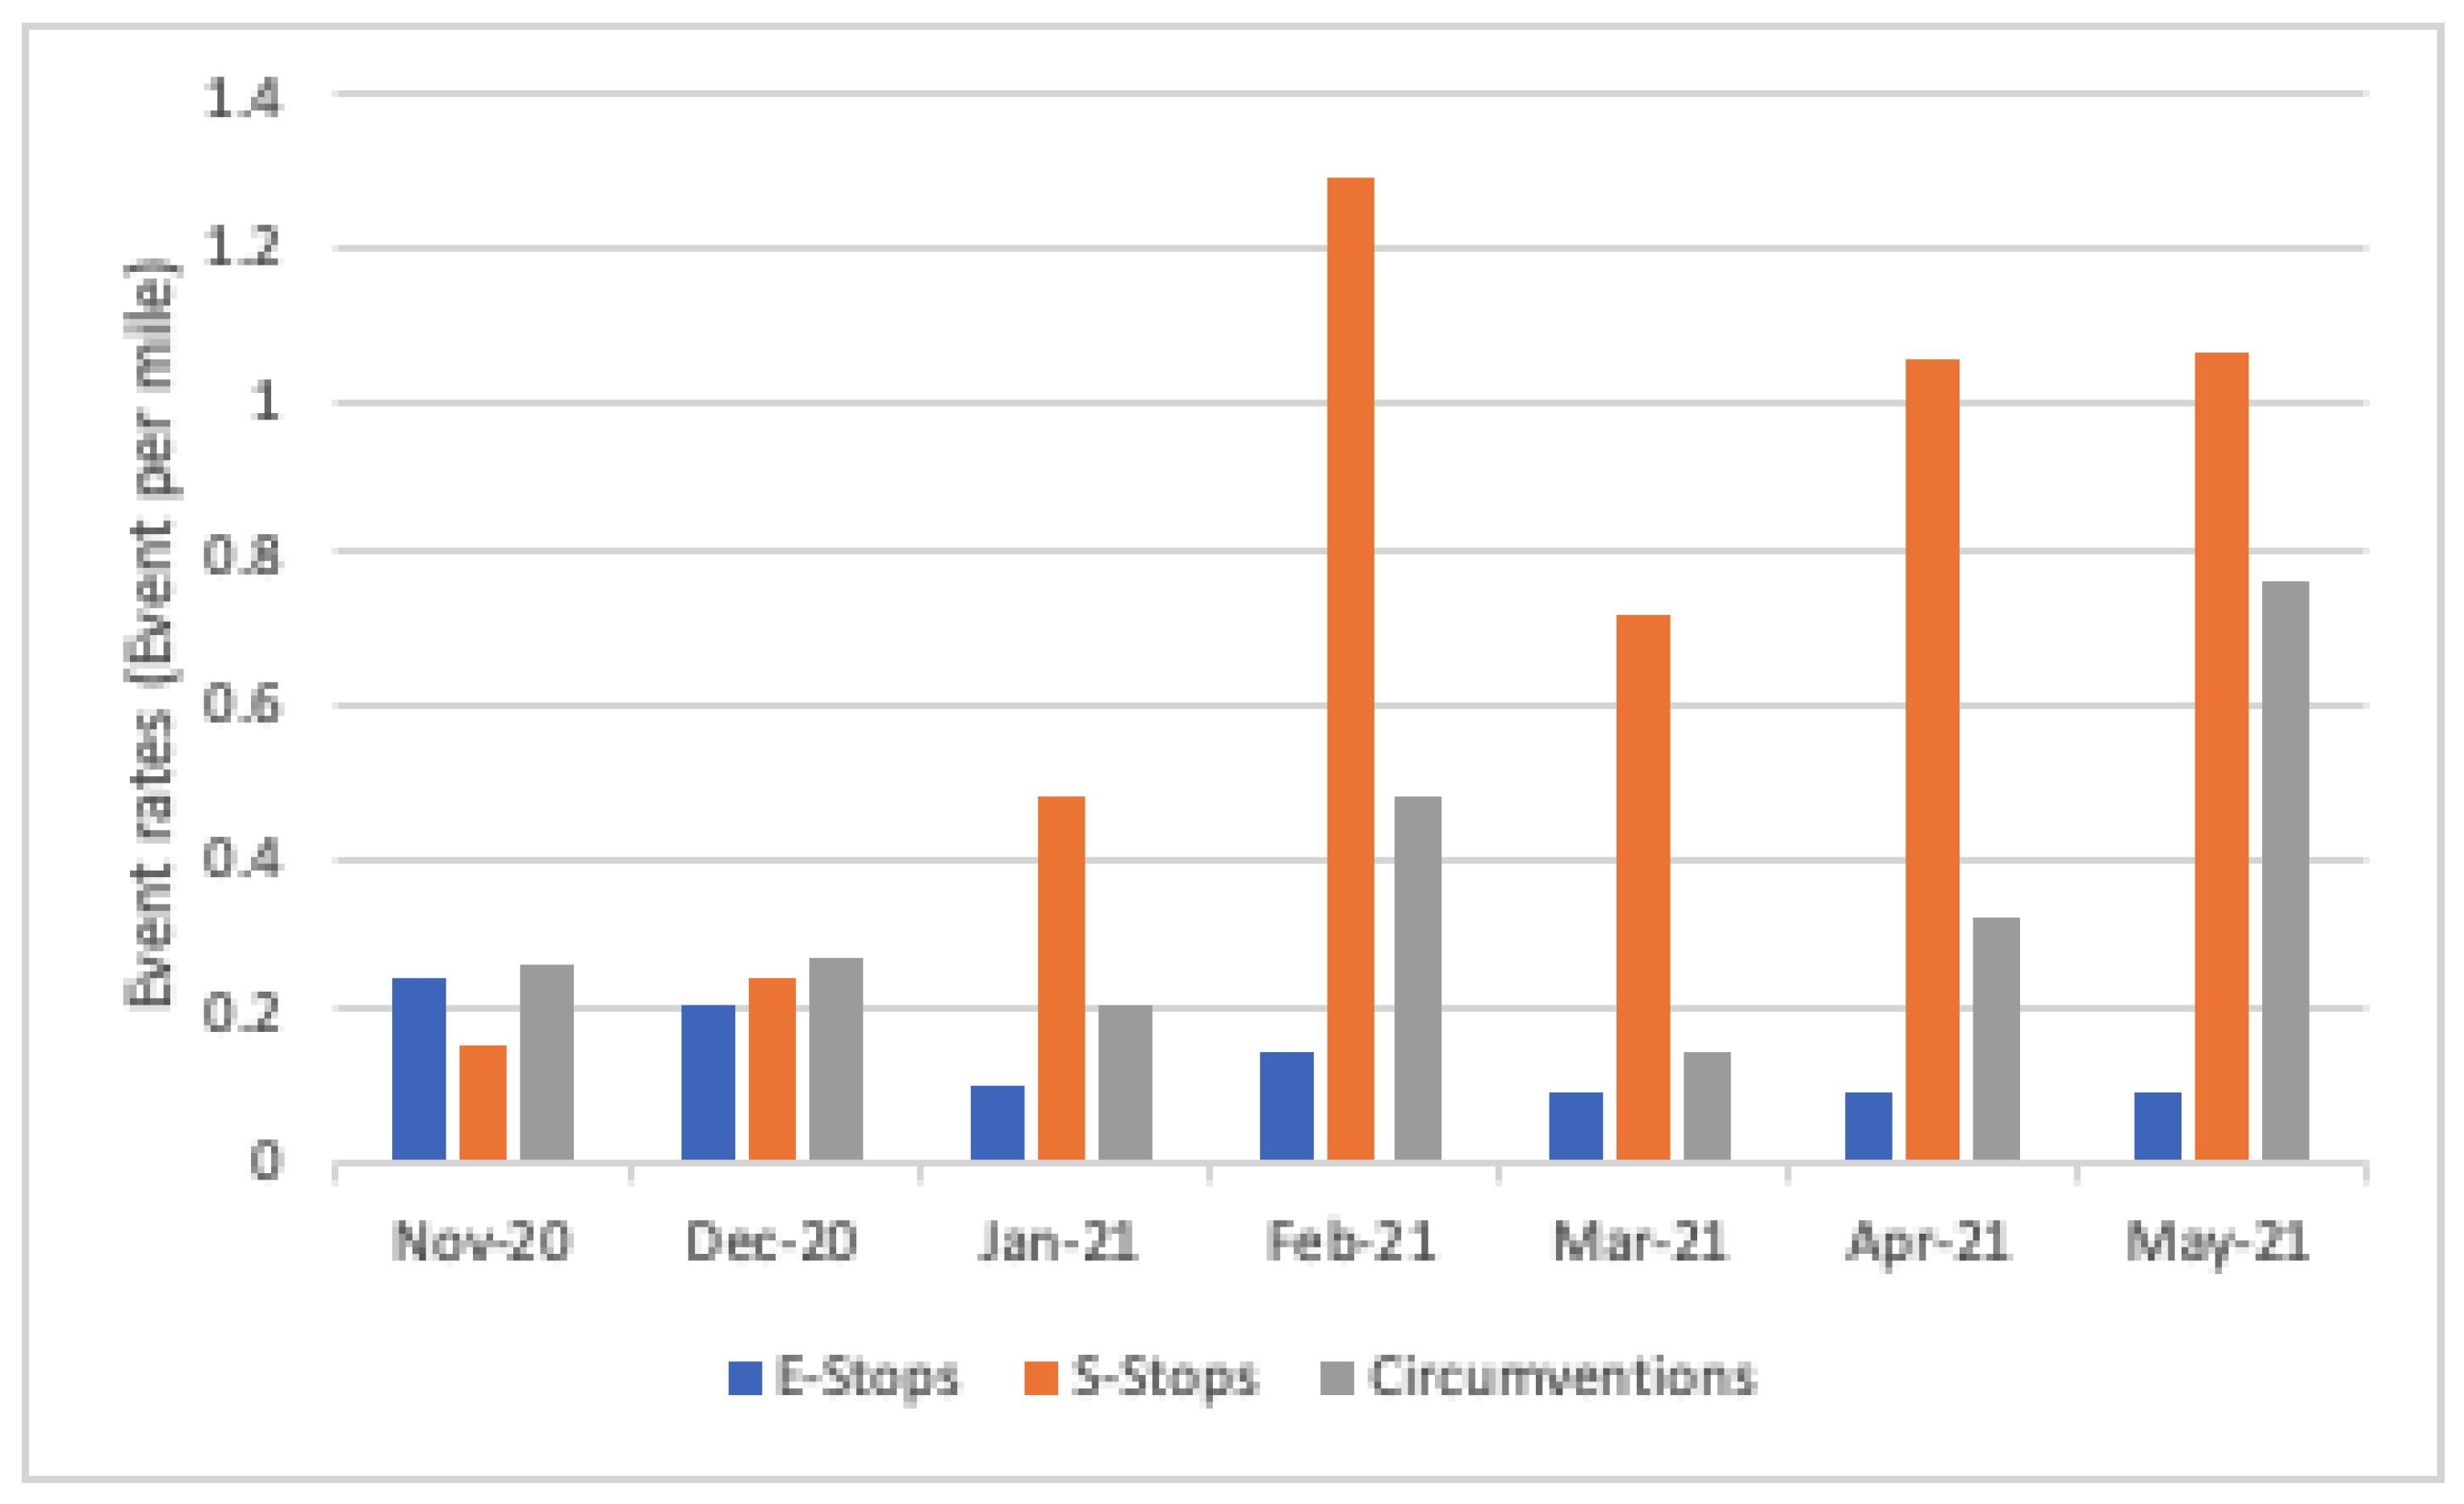
The total numbers of e-stop, soft stop, and circumvention events per mile traveled by month of data collection are presented in
Figure 4. The events per mile per month metric provides an indication of how well the LSAV automated control systems were able to manage the operational requirements and complexities of the route. Higher frequencies of disengagement suggest that the automated control capabilities could not fully manage the interactions on the route without abrupt stopping or relying on human intervention. The rate of soft stops was the highest, followed by circumventions and then e-stops. Additionally, it appears that the rate of soft stops increased over time, whereas the rate of e-stops appeared to decrease over time. The rate of circumventions was similar to the soft stops, in that it appeared to increase over time.
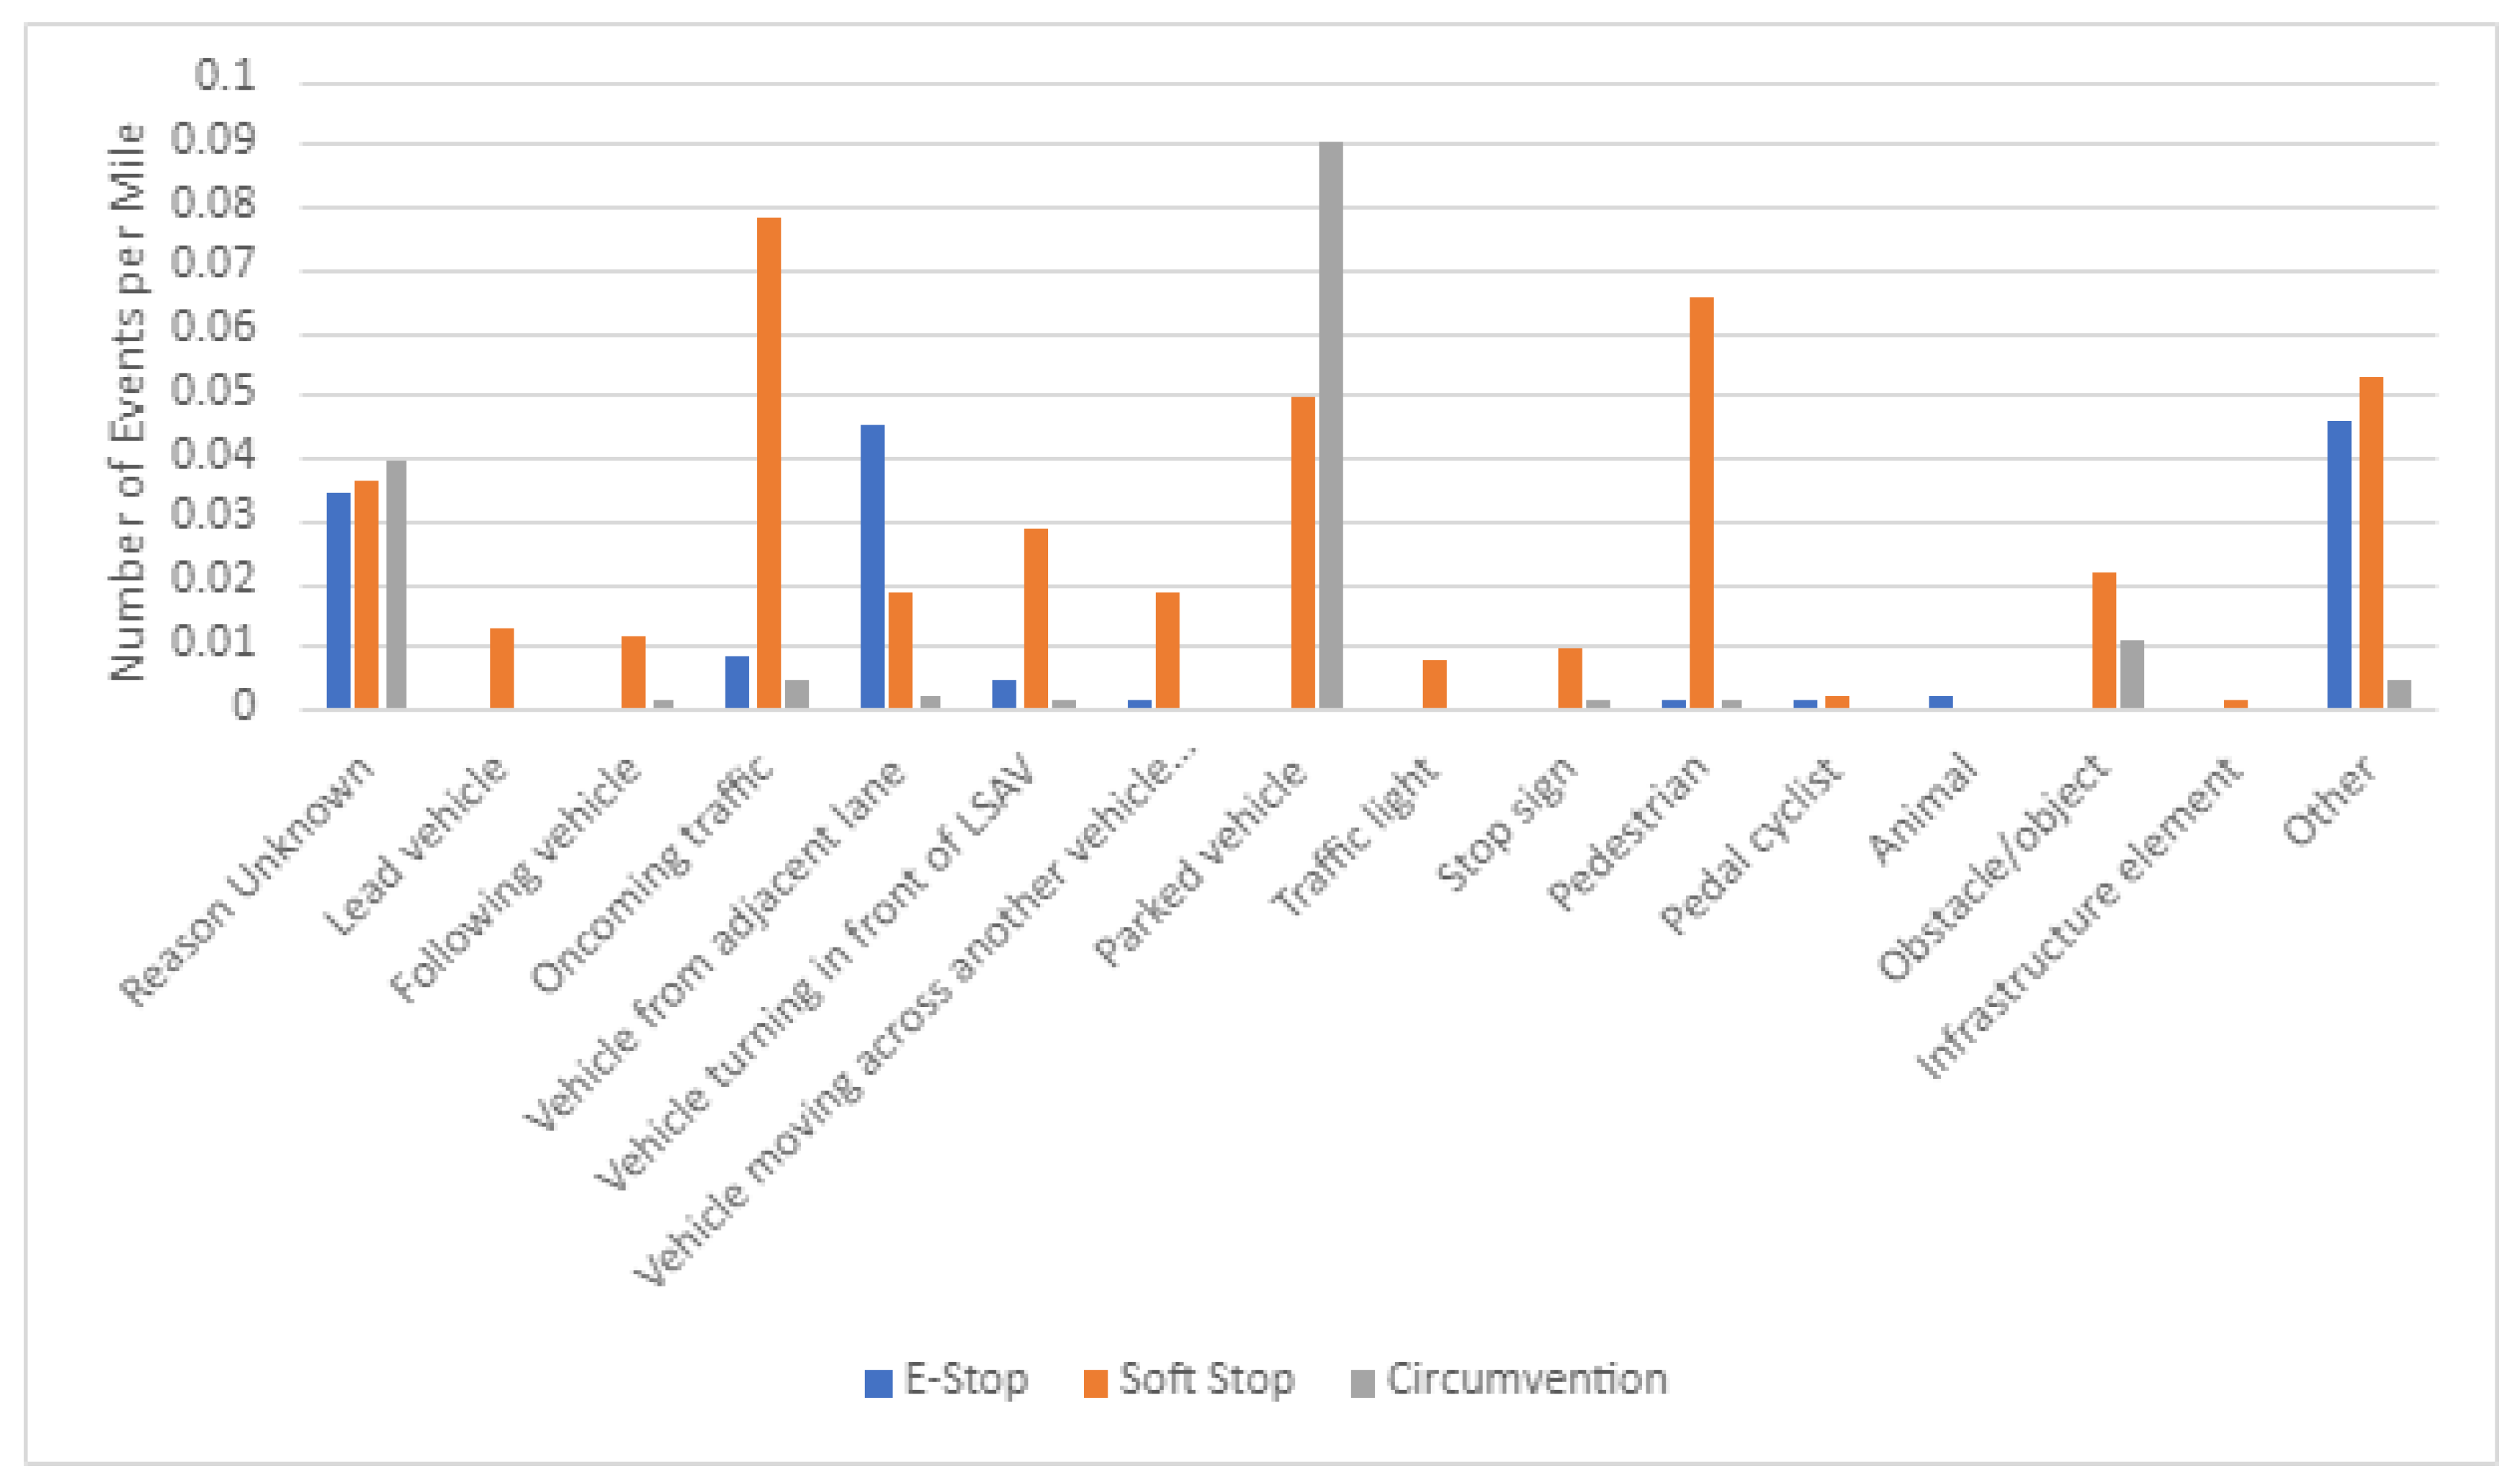
Data coders recorded the reason that the LSAV stopped for each disengagement event. Since the DAS was not able to record any system-generated data regarding disengagement causation, the reason classification was determined in this protocol by evaluating the video and DAS sensor data relative to the context of the event.
Figure 5 shows the rate per mile traveled for each of these reasons for stopping/circumvention by event type. Note that the most frequent reasons for stopping included oncoming traffic, parked vehicles, and pedestrian presence. Additionally, the rates of events per mile traveled that were coded as “other” and “unknown reasons” were quite high, which will be further explained below.
The unknown category accounts for those events where the analyst simply could not identify a likely reason for the event to have been triggered based on the available video and DAS data sources. Some potential causes of unknown triggers include changes in the shape or density of foliage near the roadway, sensor malfunctions, or system defects. EasyMile support staff were made aware of this issue and communicated their plans to provide a technology upgrade that they claim will help resolve or reduce the occurrence of these unnecessary e-stops. The installation of this upgrade did not take place in time for the VTTI team that was reviewing the data to make any conclusions about its effectiveness.
3.2. Triggered Event Results by Infrastructure Elements
The distribution of the triggered events by the infrastructure element revealed some of the challenges the LSAV faced in real-world environments. These results further show in detail the safety limitations of the LSAV automated driving system.
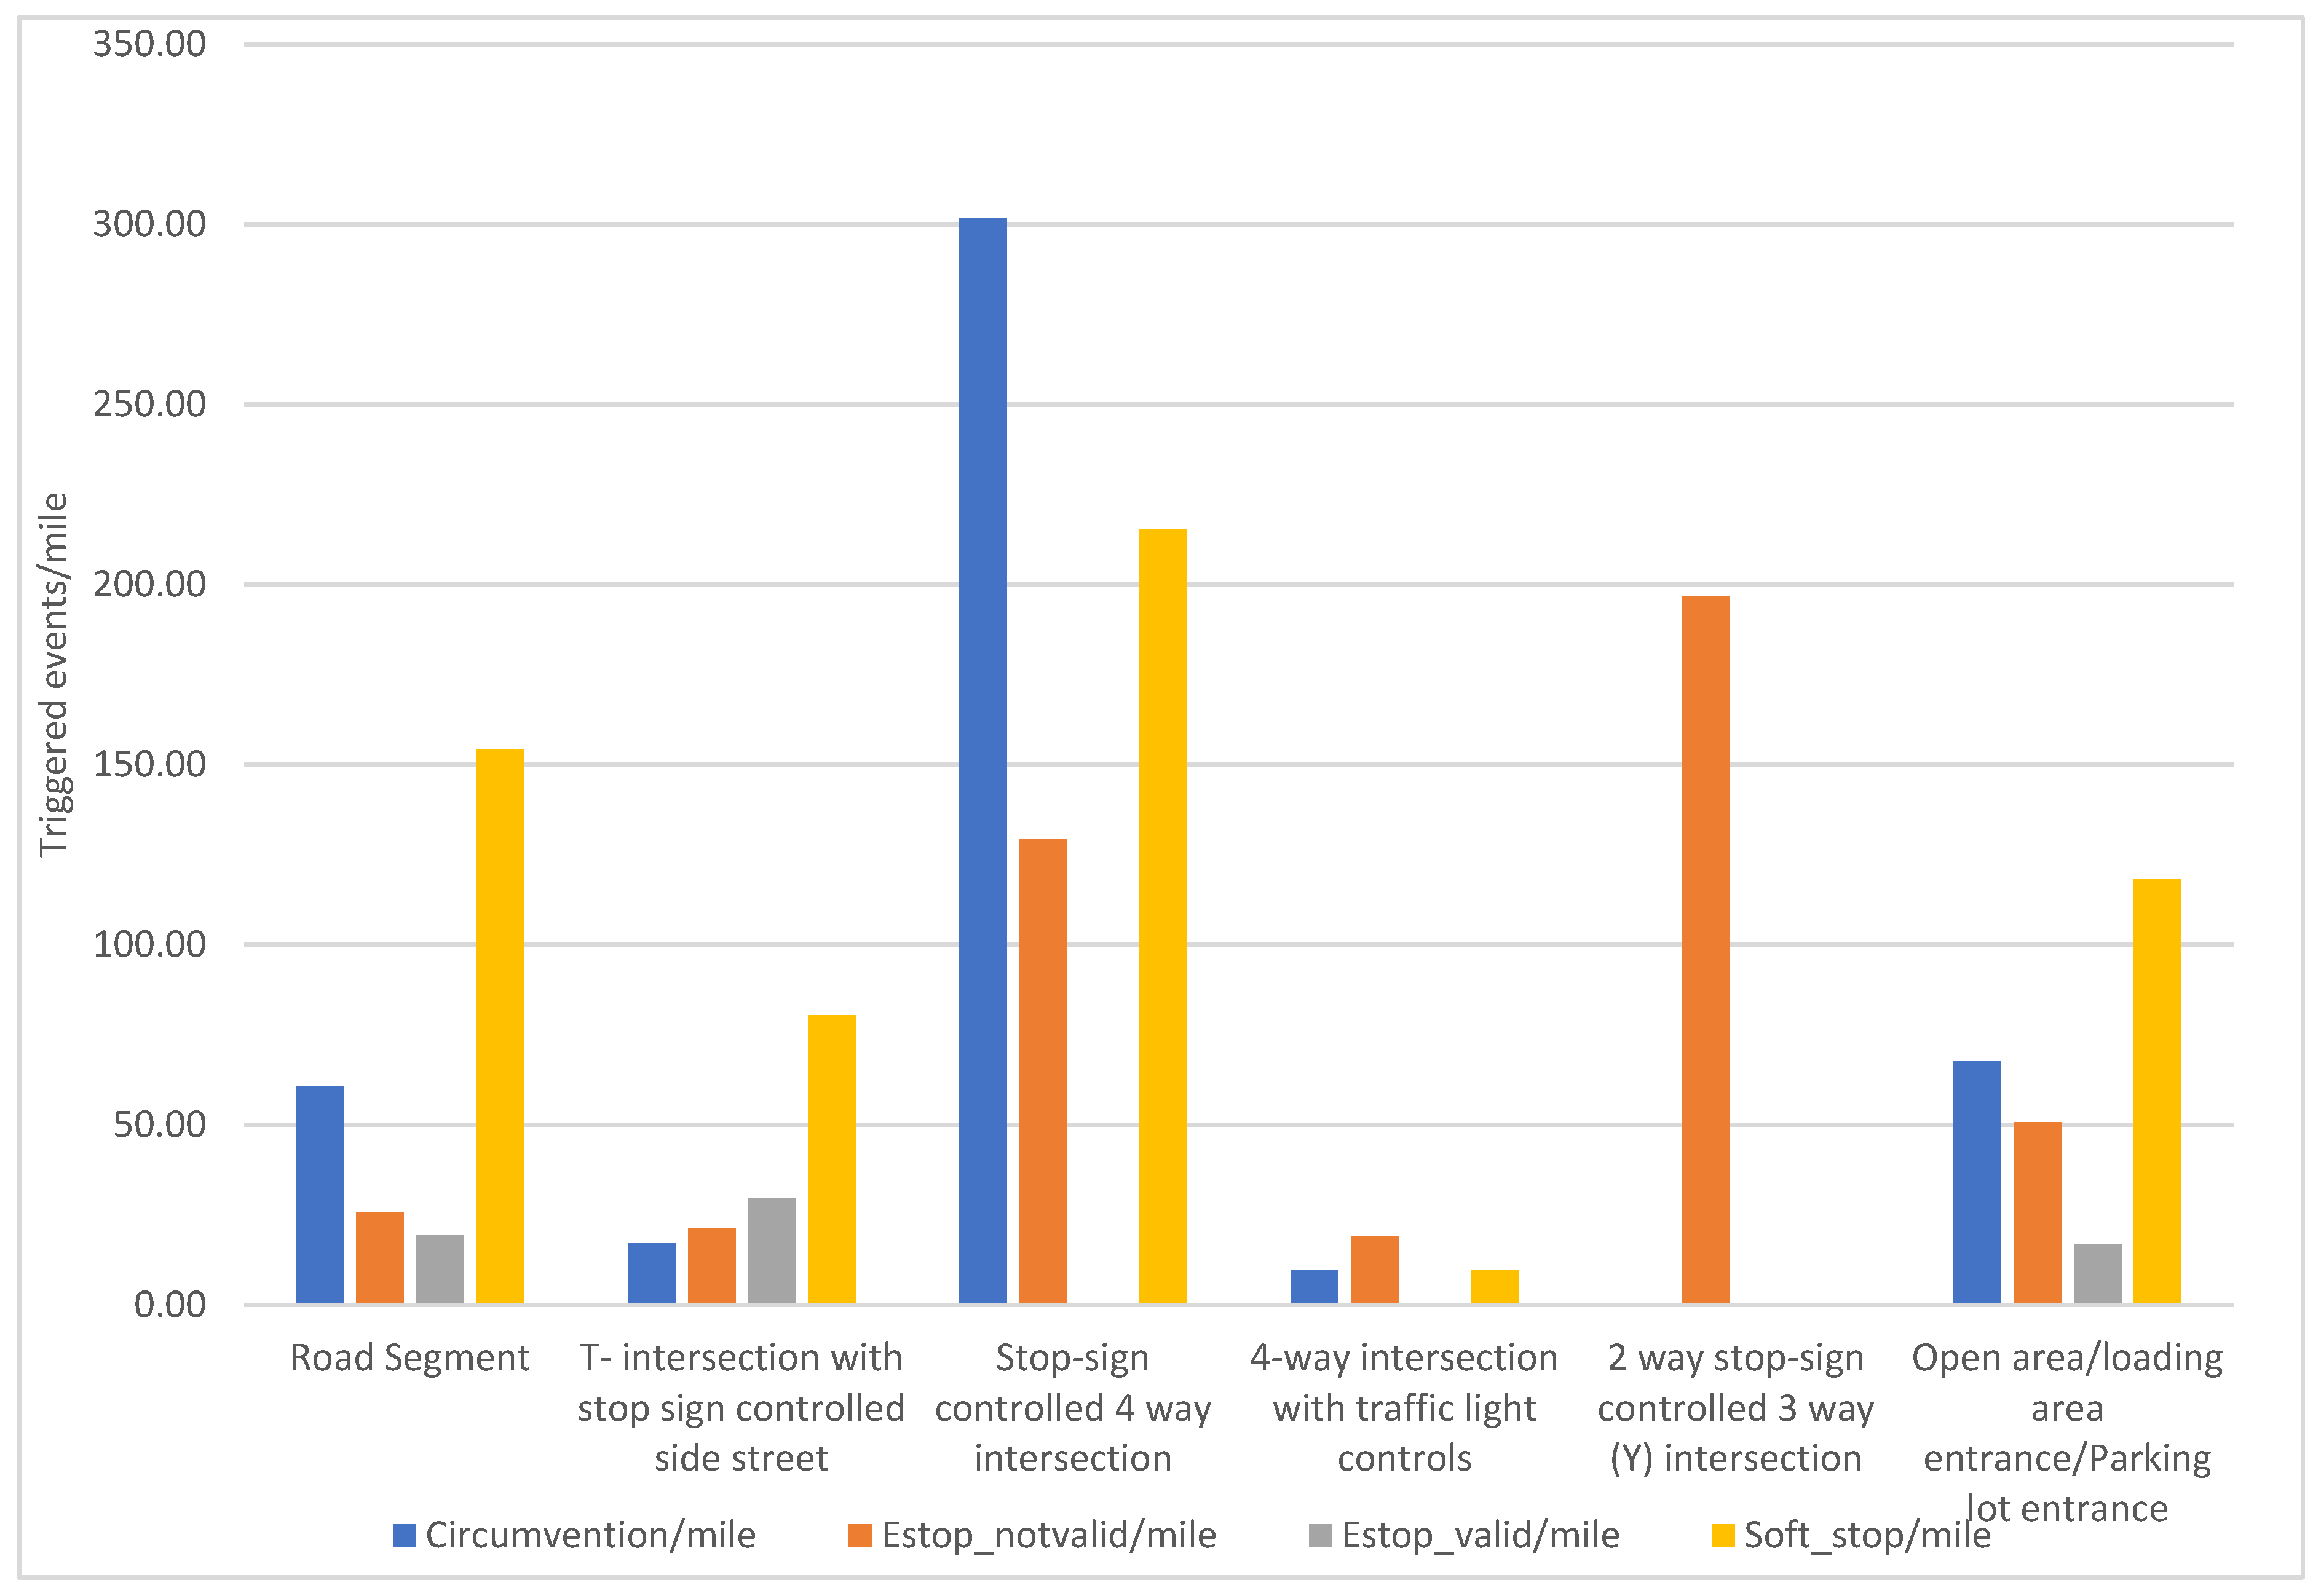
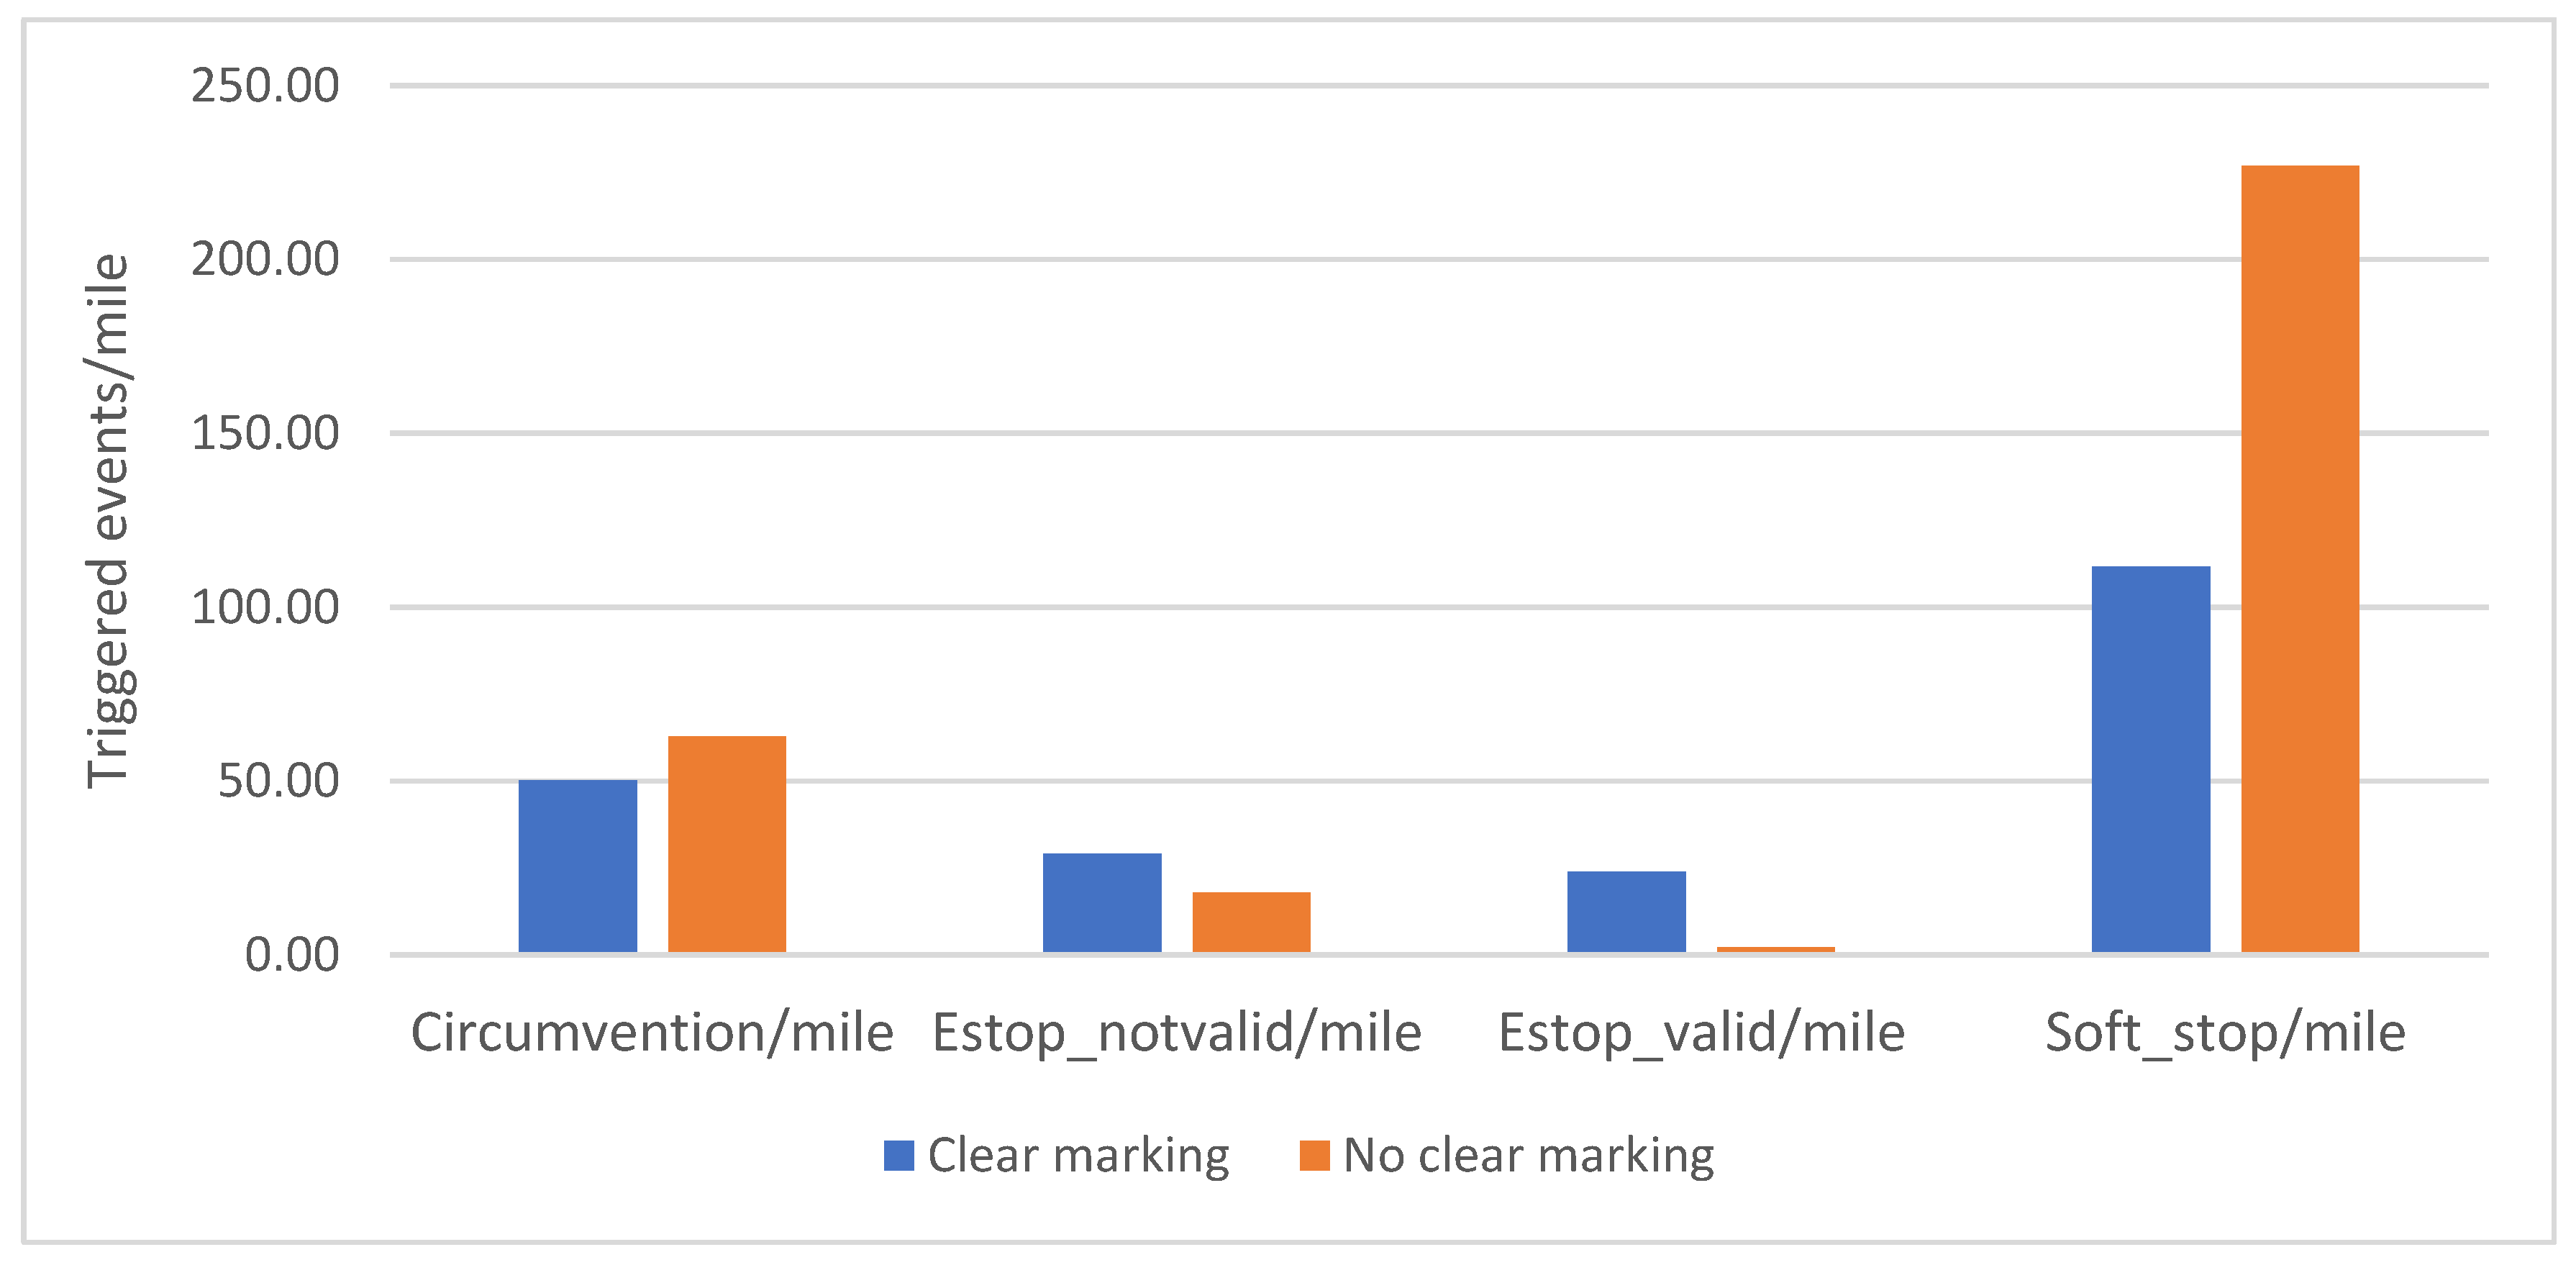
Figure 6,
Figure 7 and
Figure 8 show the rates of triggered events under different infrastructure elements.
The research team found that the route sections with stop-sign-controlled four-way intersections showed the highest rates in circumvention and soft stops, while route sections with T-intersections showed the highest rate for valid e-stops (see
Figure 6).
The results from
Figure 7 showed that route sections with three-lane roads (shared turning lane in the middle) had the highest rate of soft stops and valid e-stops compared to other types of lane configurations.
It is clear from the results in
Figure 8 that route sections with no clear markings on the pavement showed higher rates of soft stops and circumventions, while route sections with clear markings had higher rates for valid e-stops.
3.3. Safety-Critical Event Results
The following results will discuss the e-stops, soft stops, and circumventions that also resulted in a safety-critical incident. Recall that 41 of these events were further coded as safety-critical events. These events contain crash-related conflicts, near-crashes, and crashes. A crash-related conflict is defined as any circumstance that requires an evasive maneuver on the part of the subject vehicle or any other vehicle, pedestrian, cyclist, or animal that is less urgent than a rapid evasive maneuver (which is defined as a near- crash), but greater in urgency than a “normal maneuver” to avoid a crash. A crash avoidance response can include braking, steering, accelerating, or any combination of control inputs. There were no crashes observed during the data gathering period.
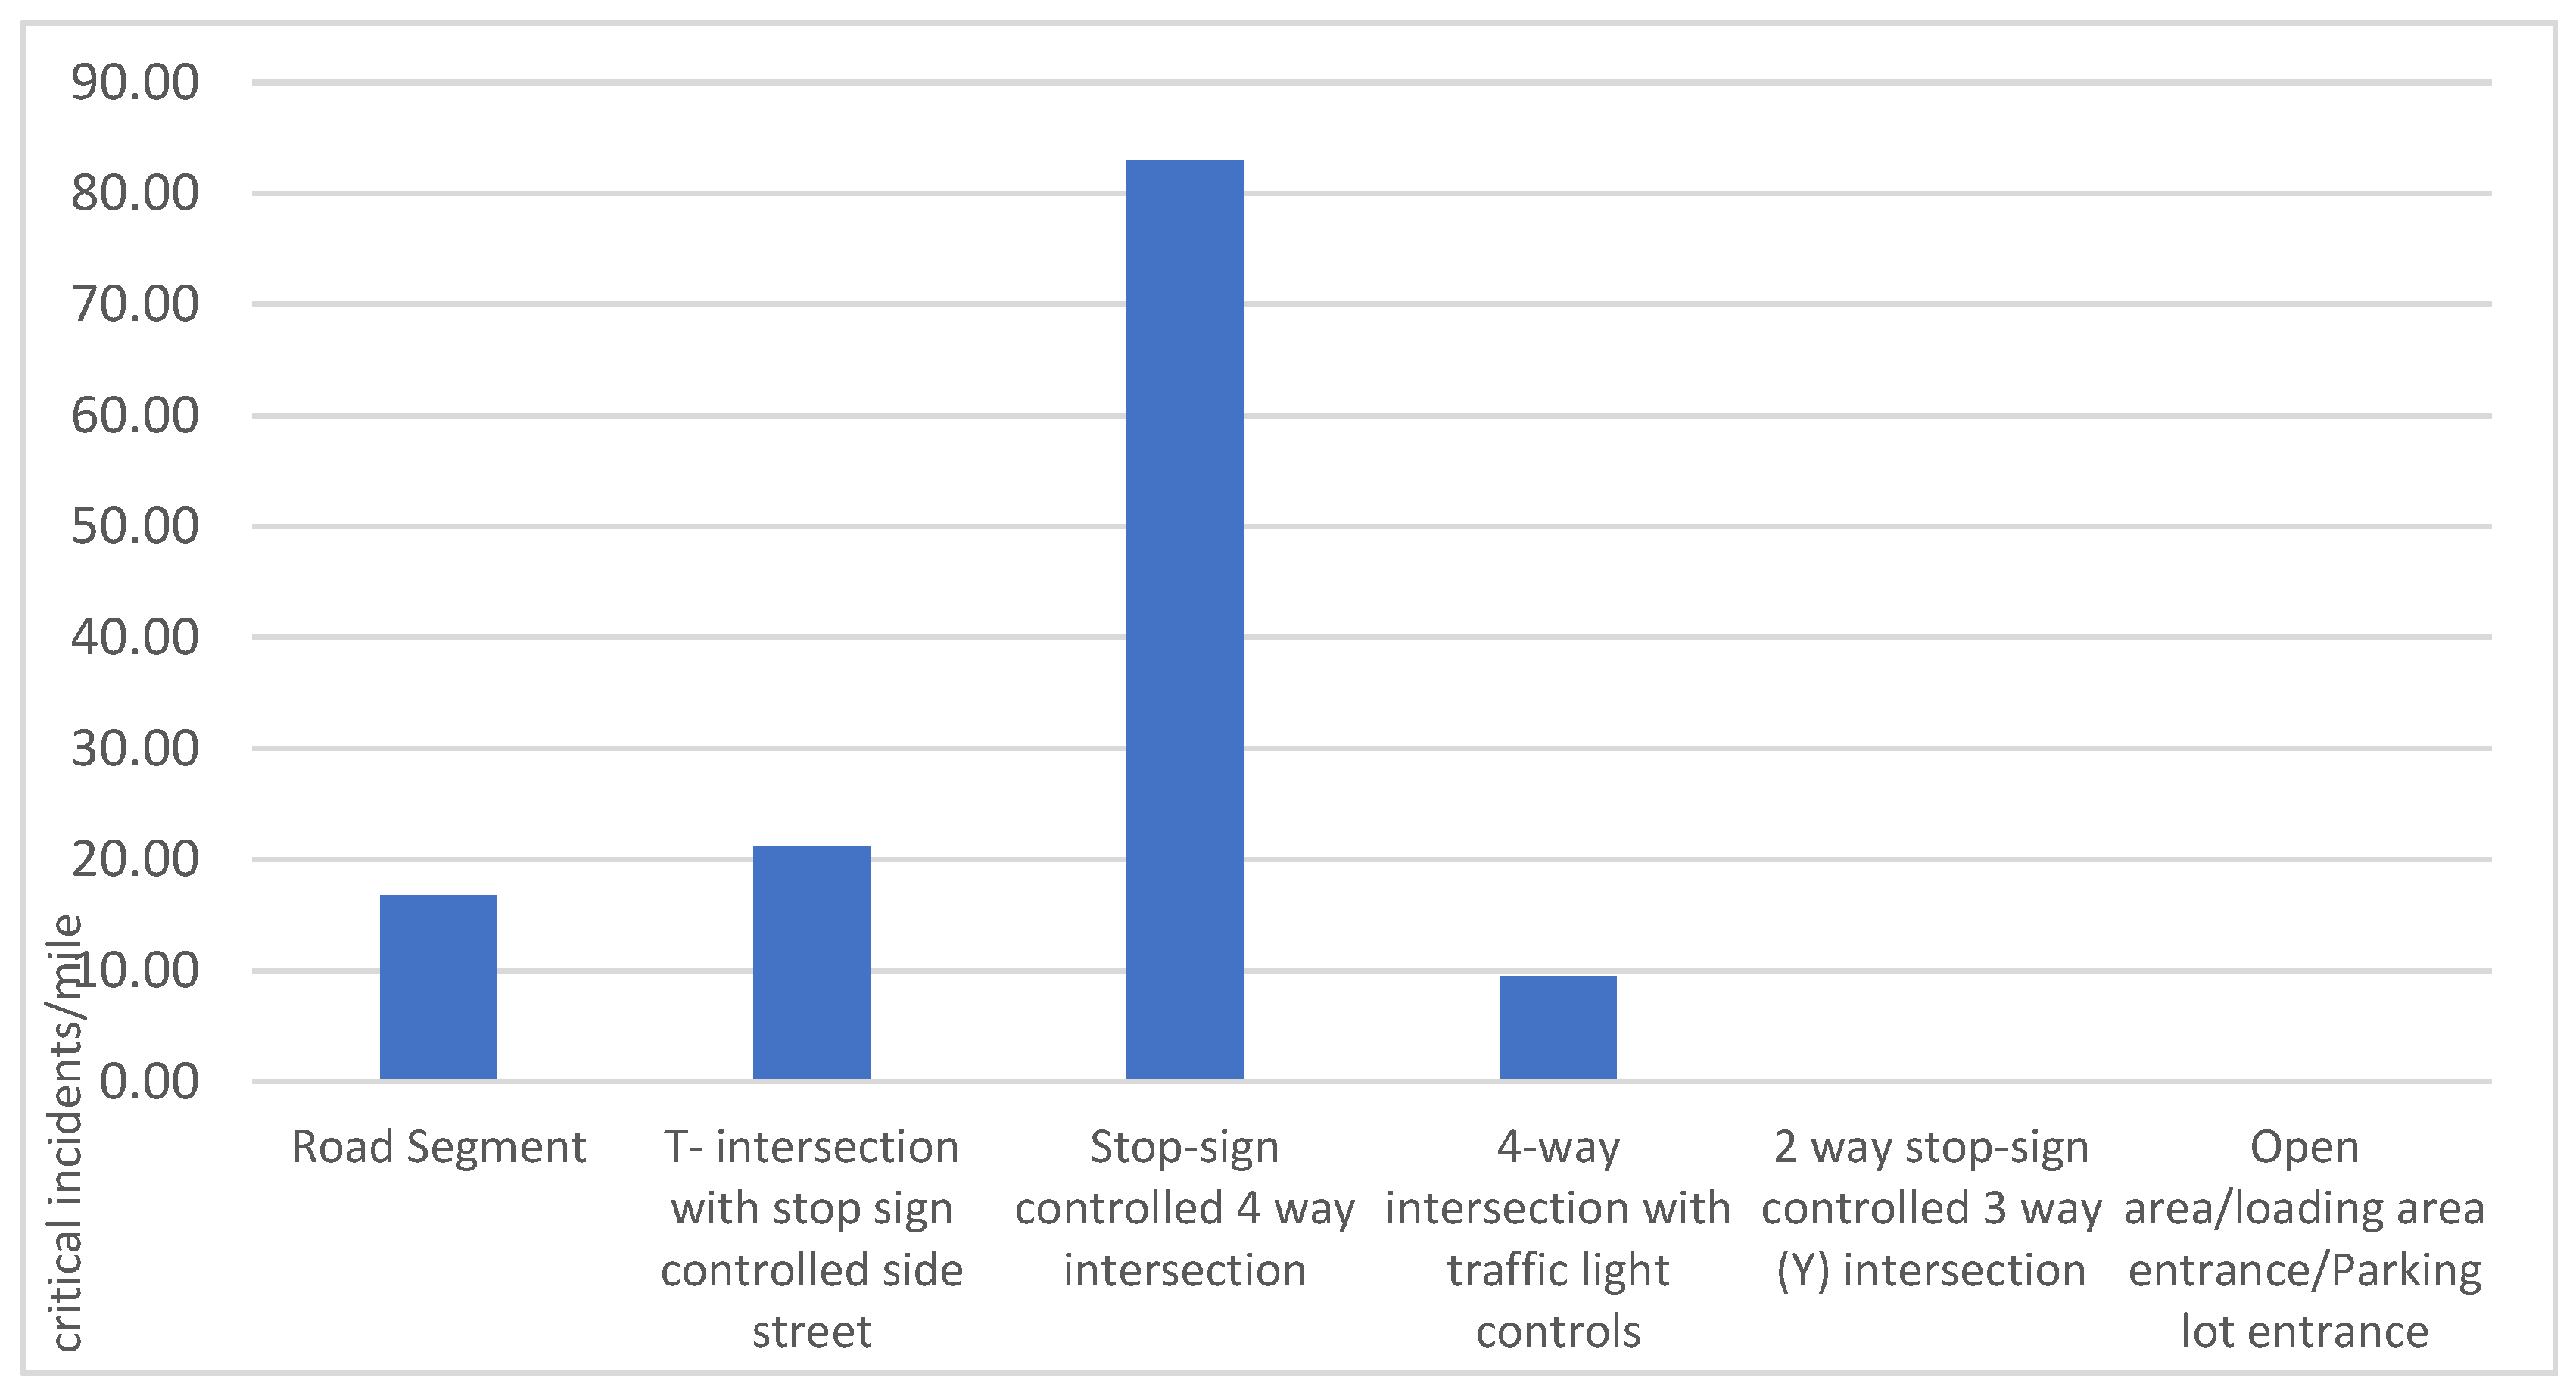
Figure 9 shows that stop-sign-controlled four-way intersections had a significantly higher rate of safety-critical events when compared to other route section types.
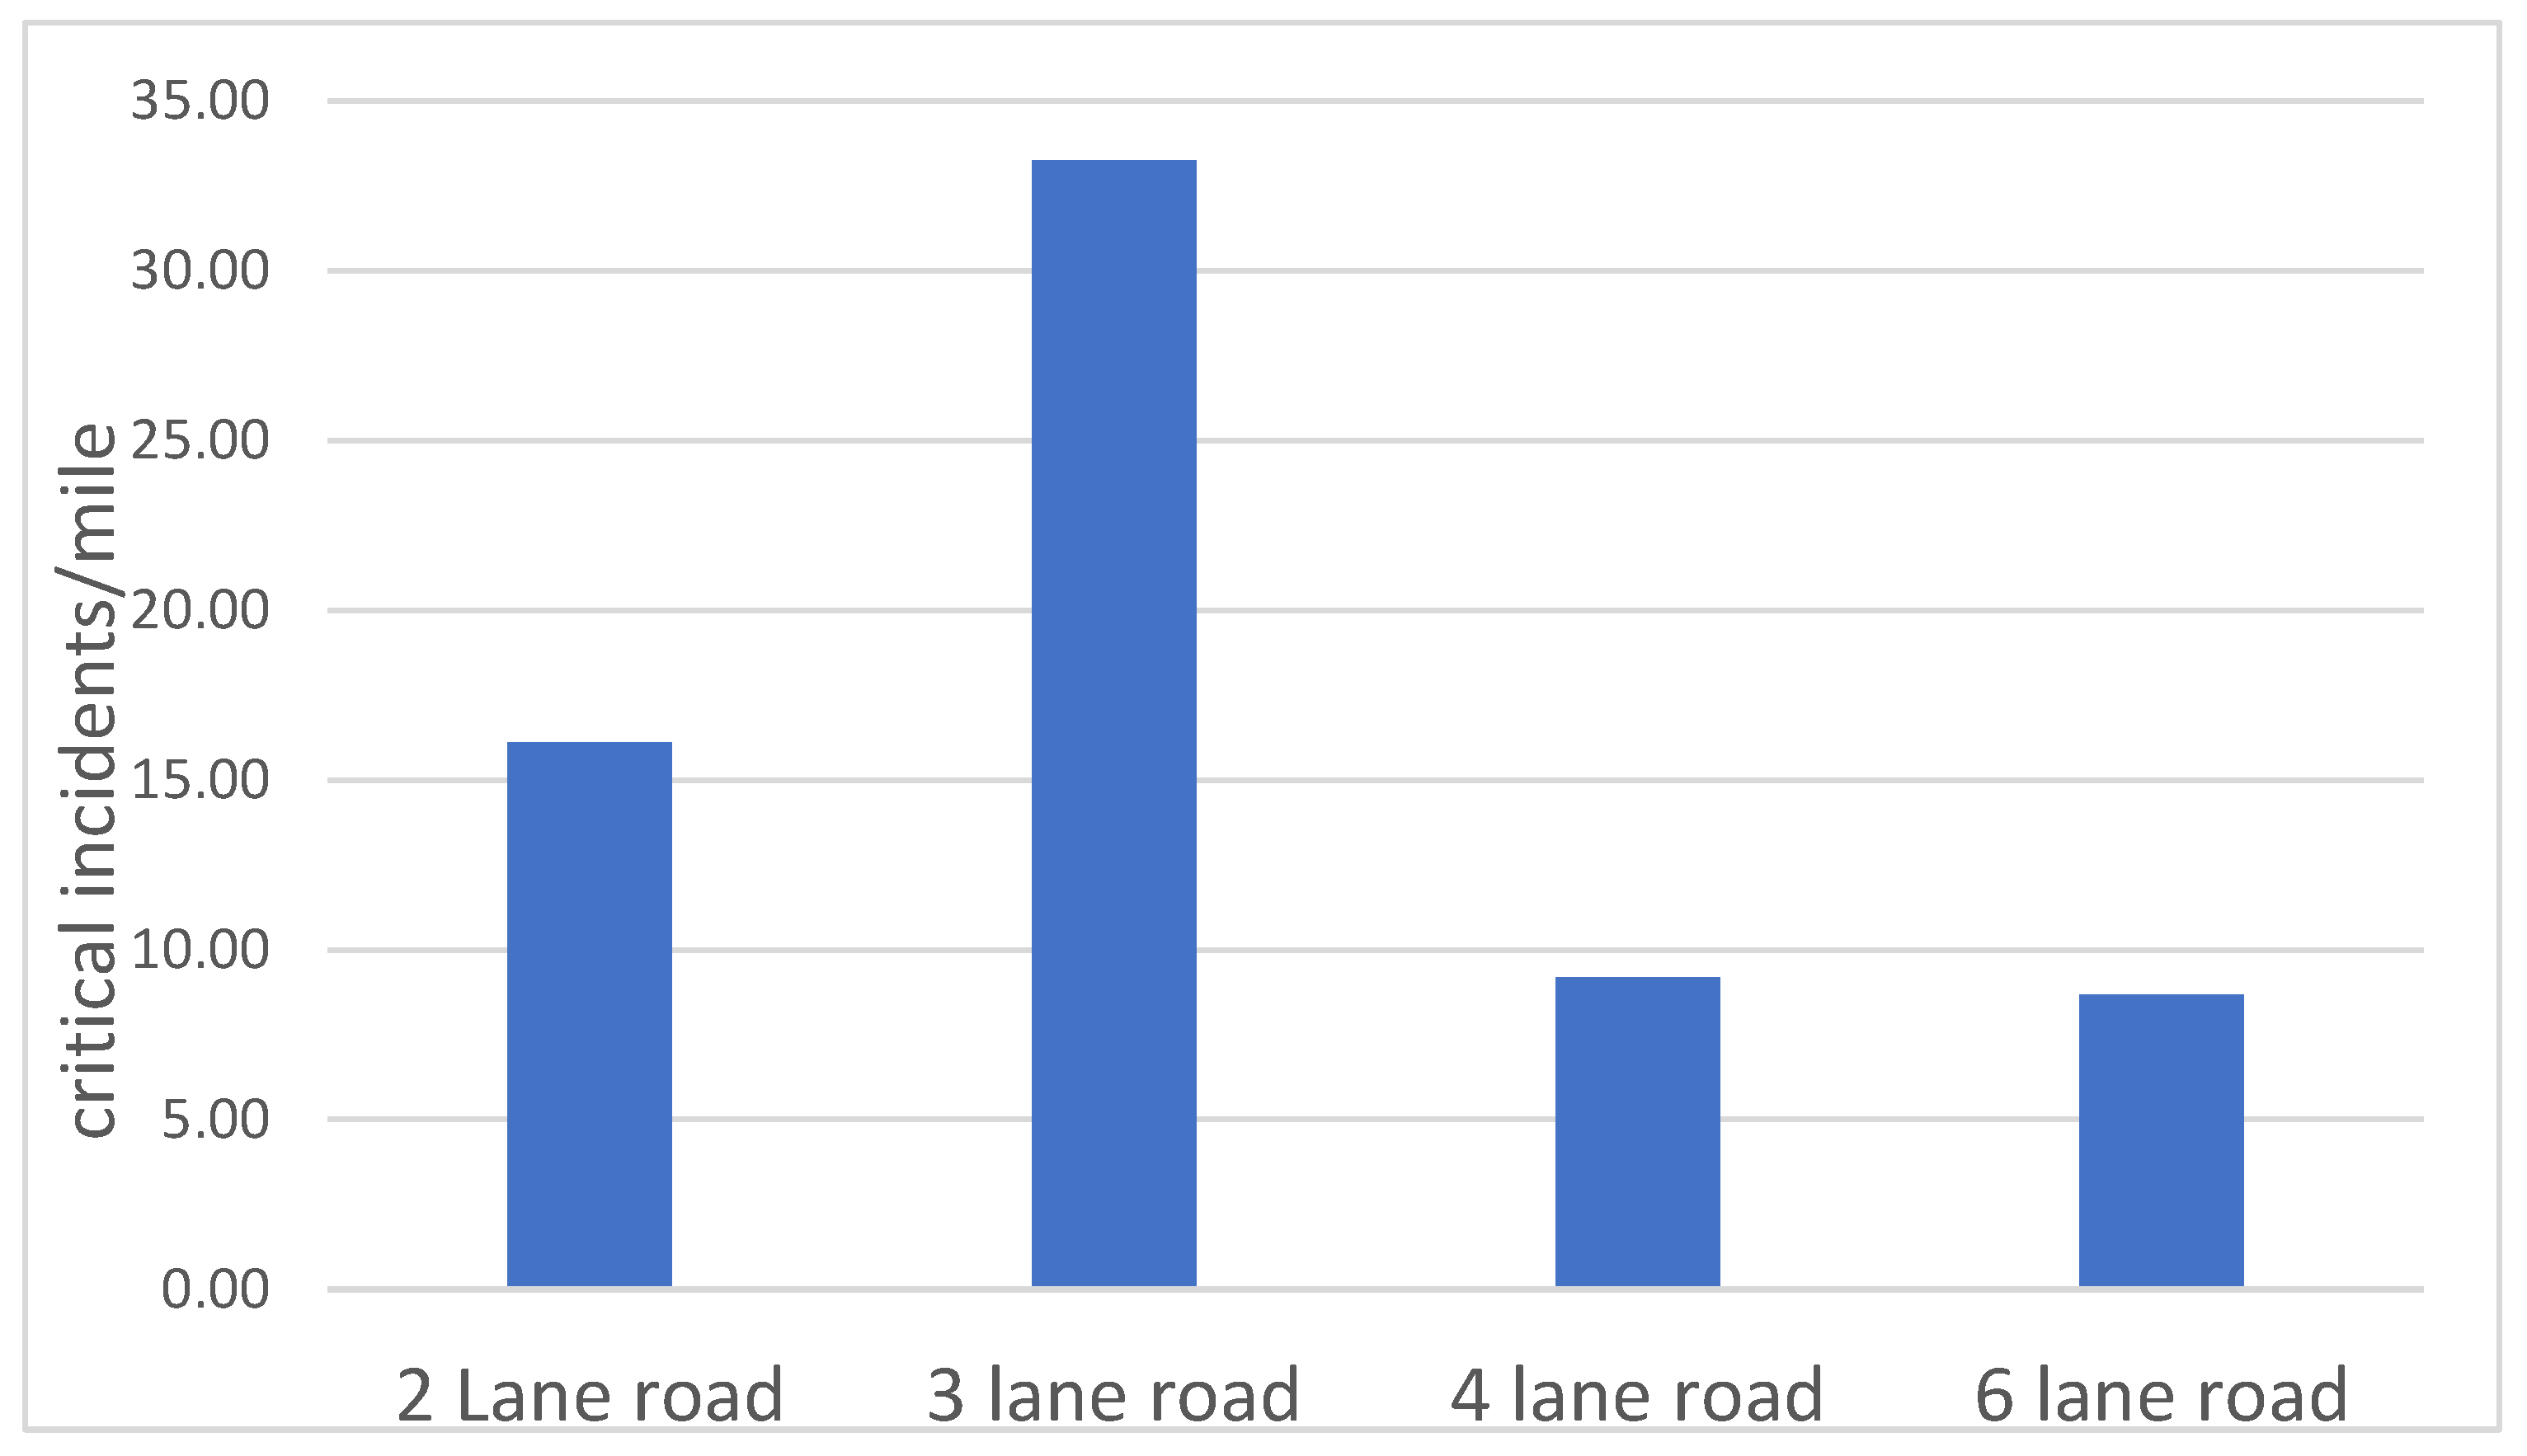
The results from
Figure 10 show that route sections with three-lane roads (shared turning lane in the middle) had the highest rate of safety-critical events when compared to other types of lane configurations.
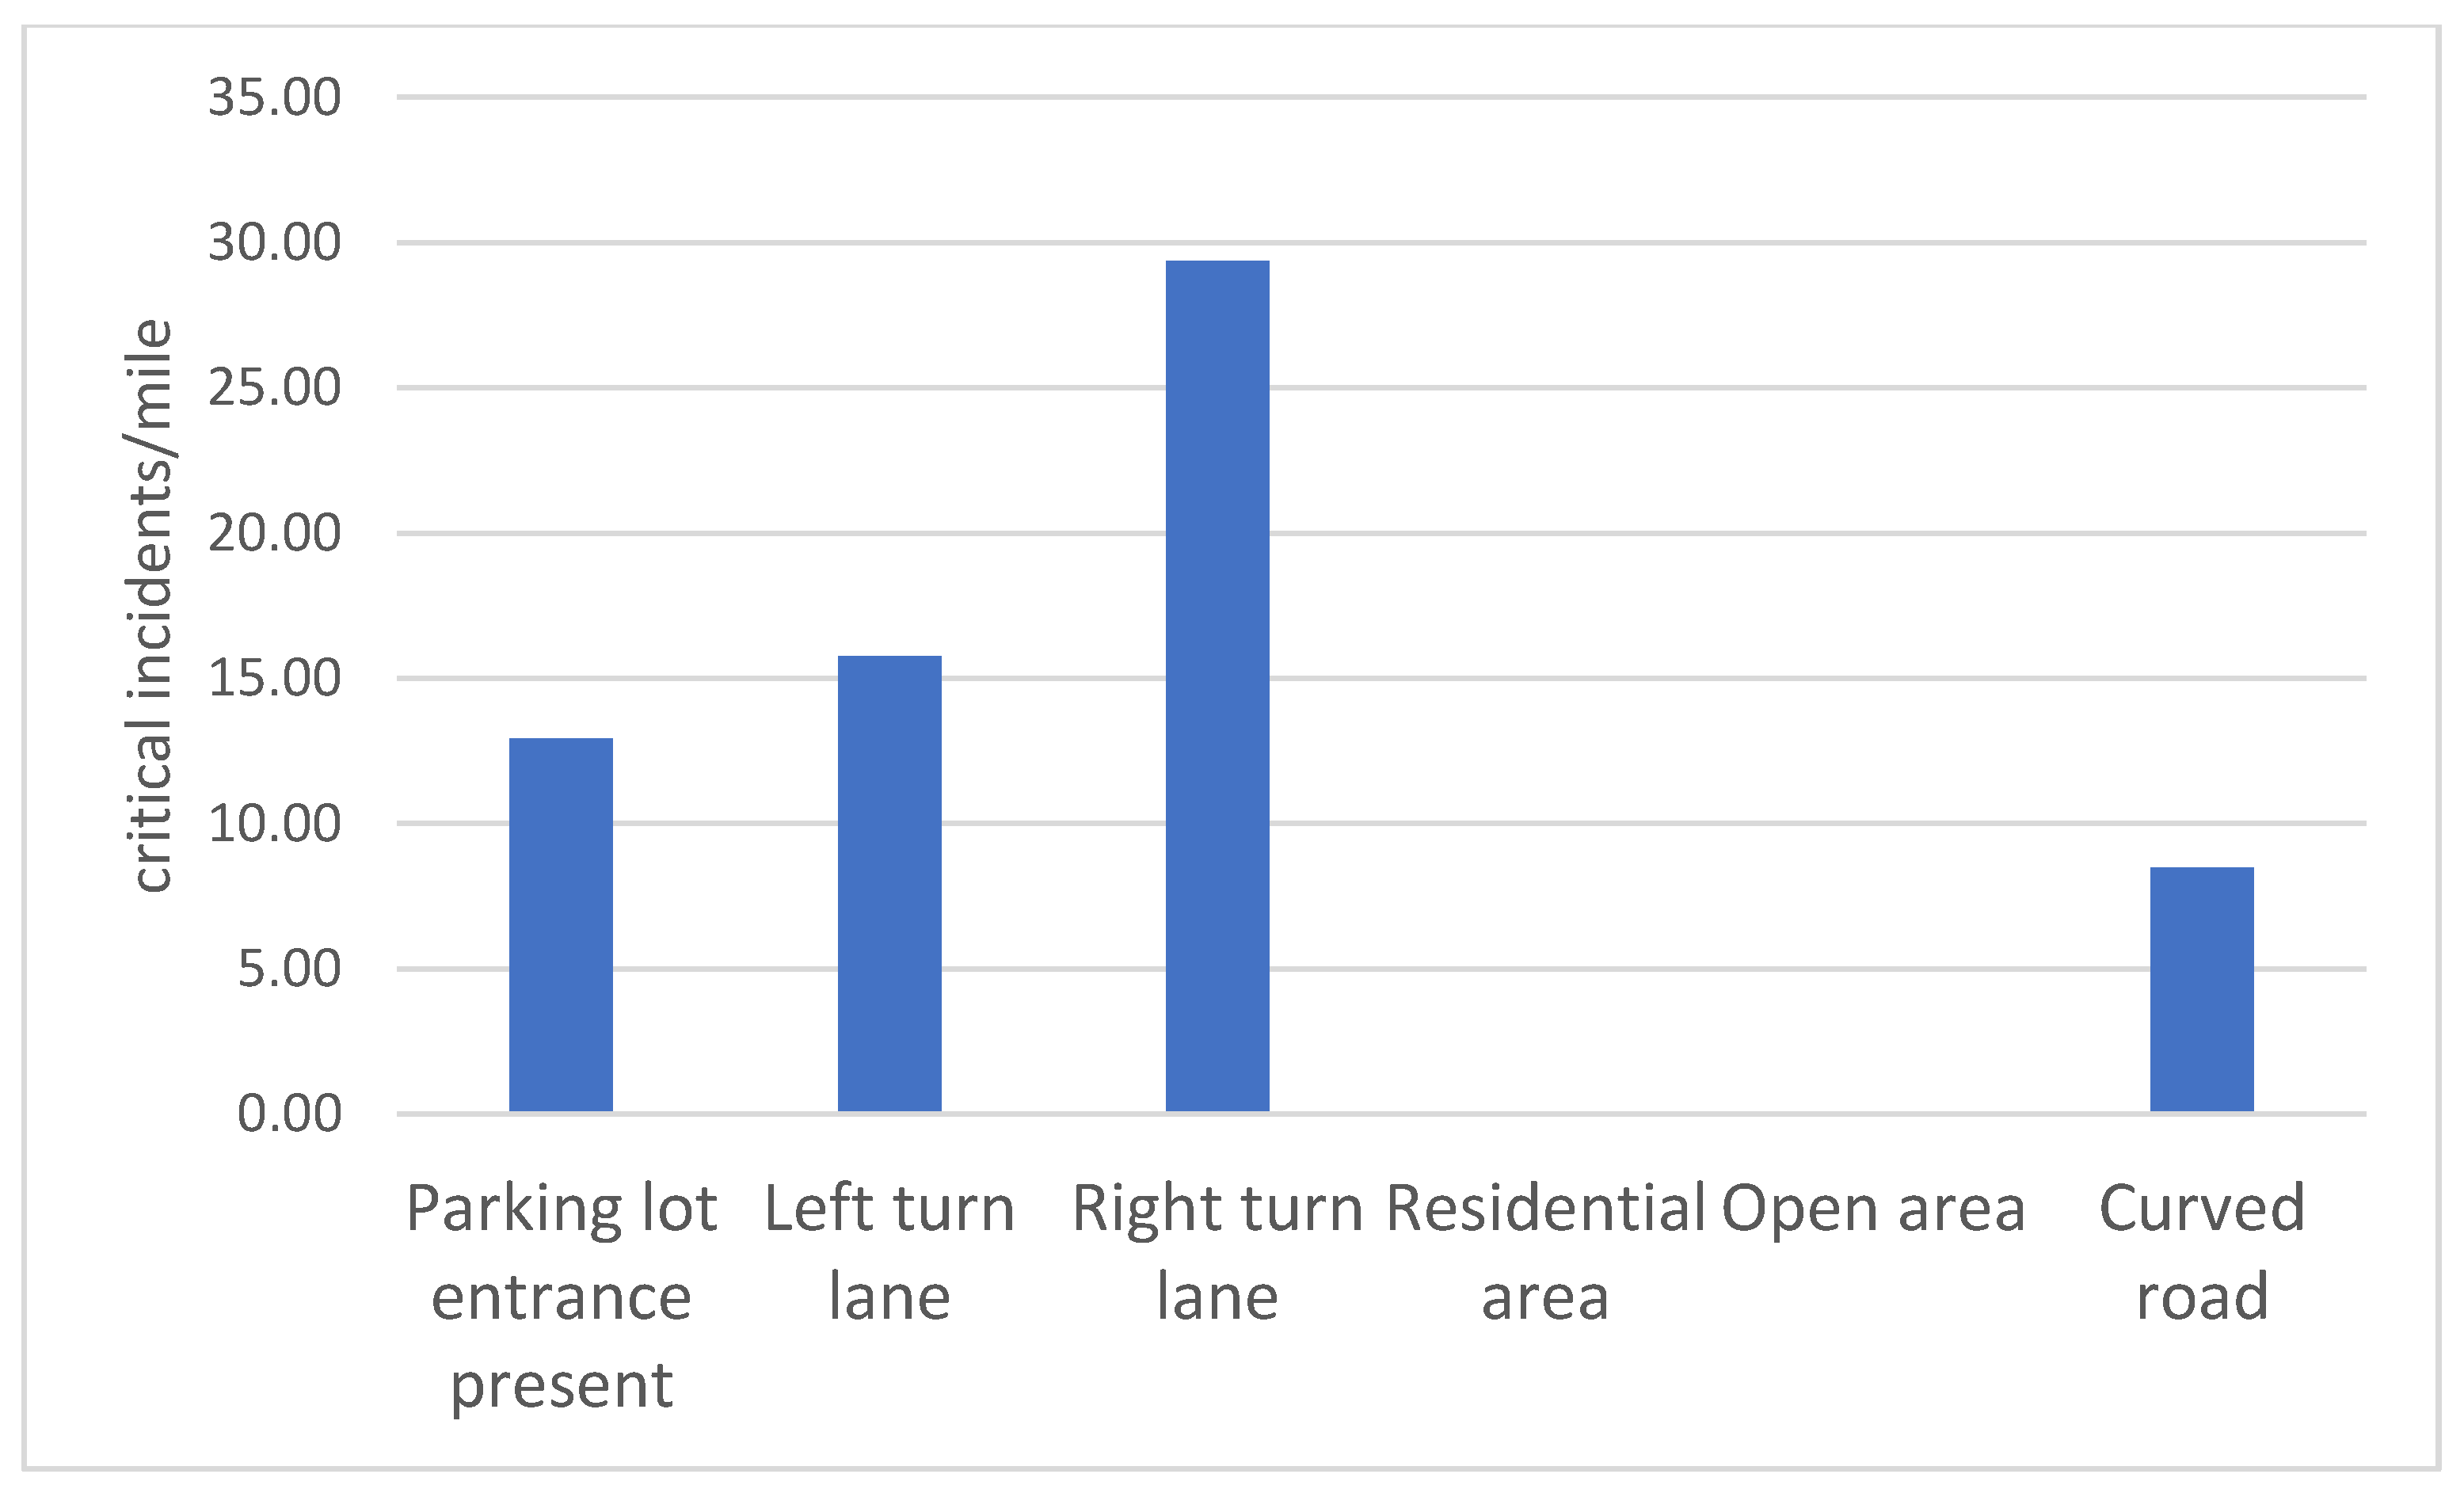
When designated turning lanes were present in the route section, the LSAV experienced higher rates of safety-critical incidents, as shown in
Figure 11. Right-turn lanes were more problematic than left-turn lanes. Parking lot entrances could be problematic as well, especially when several parking lot entrance ramps converged into a single route section.
3.4. Most Problematic Locations along the Route
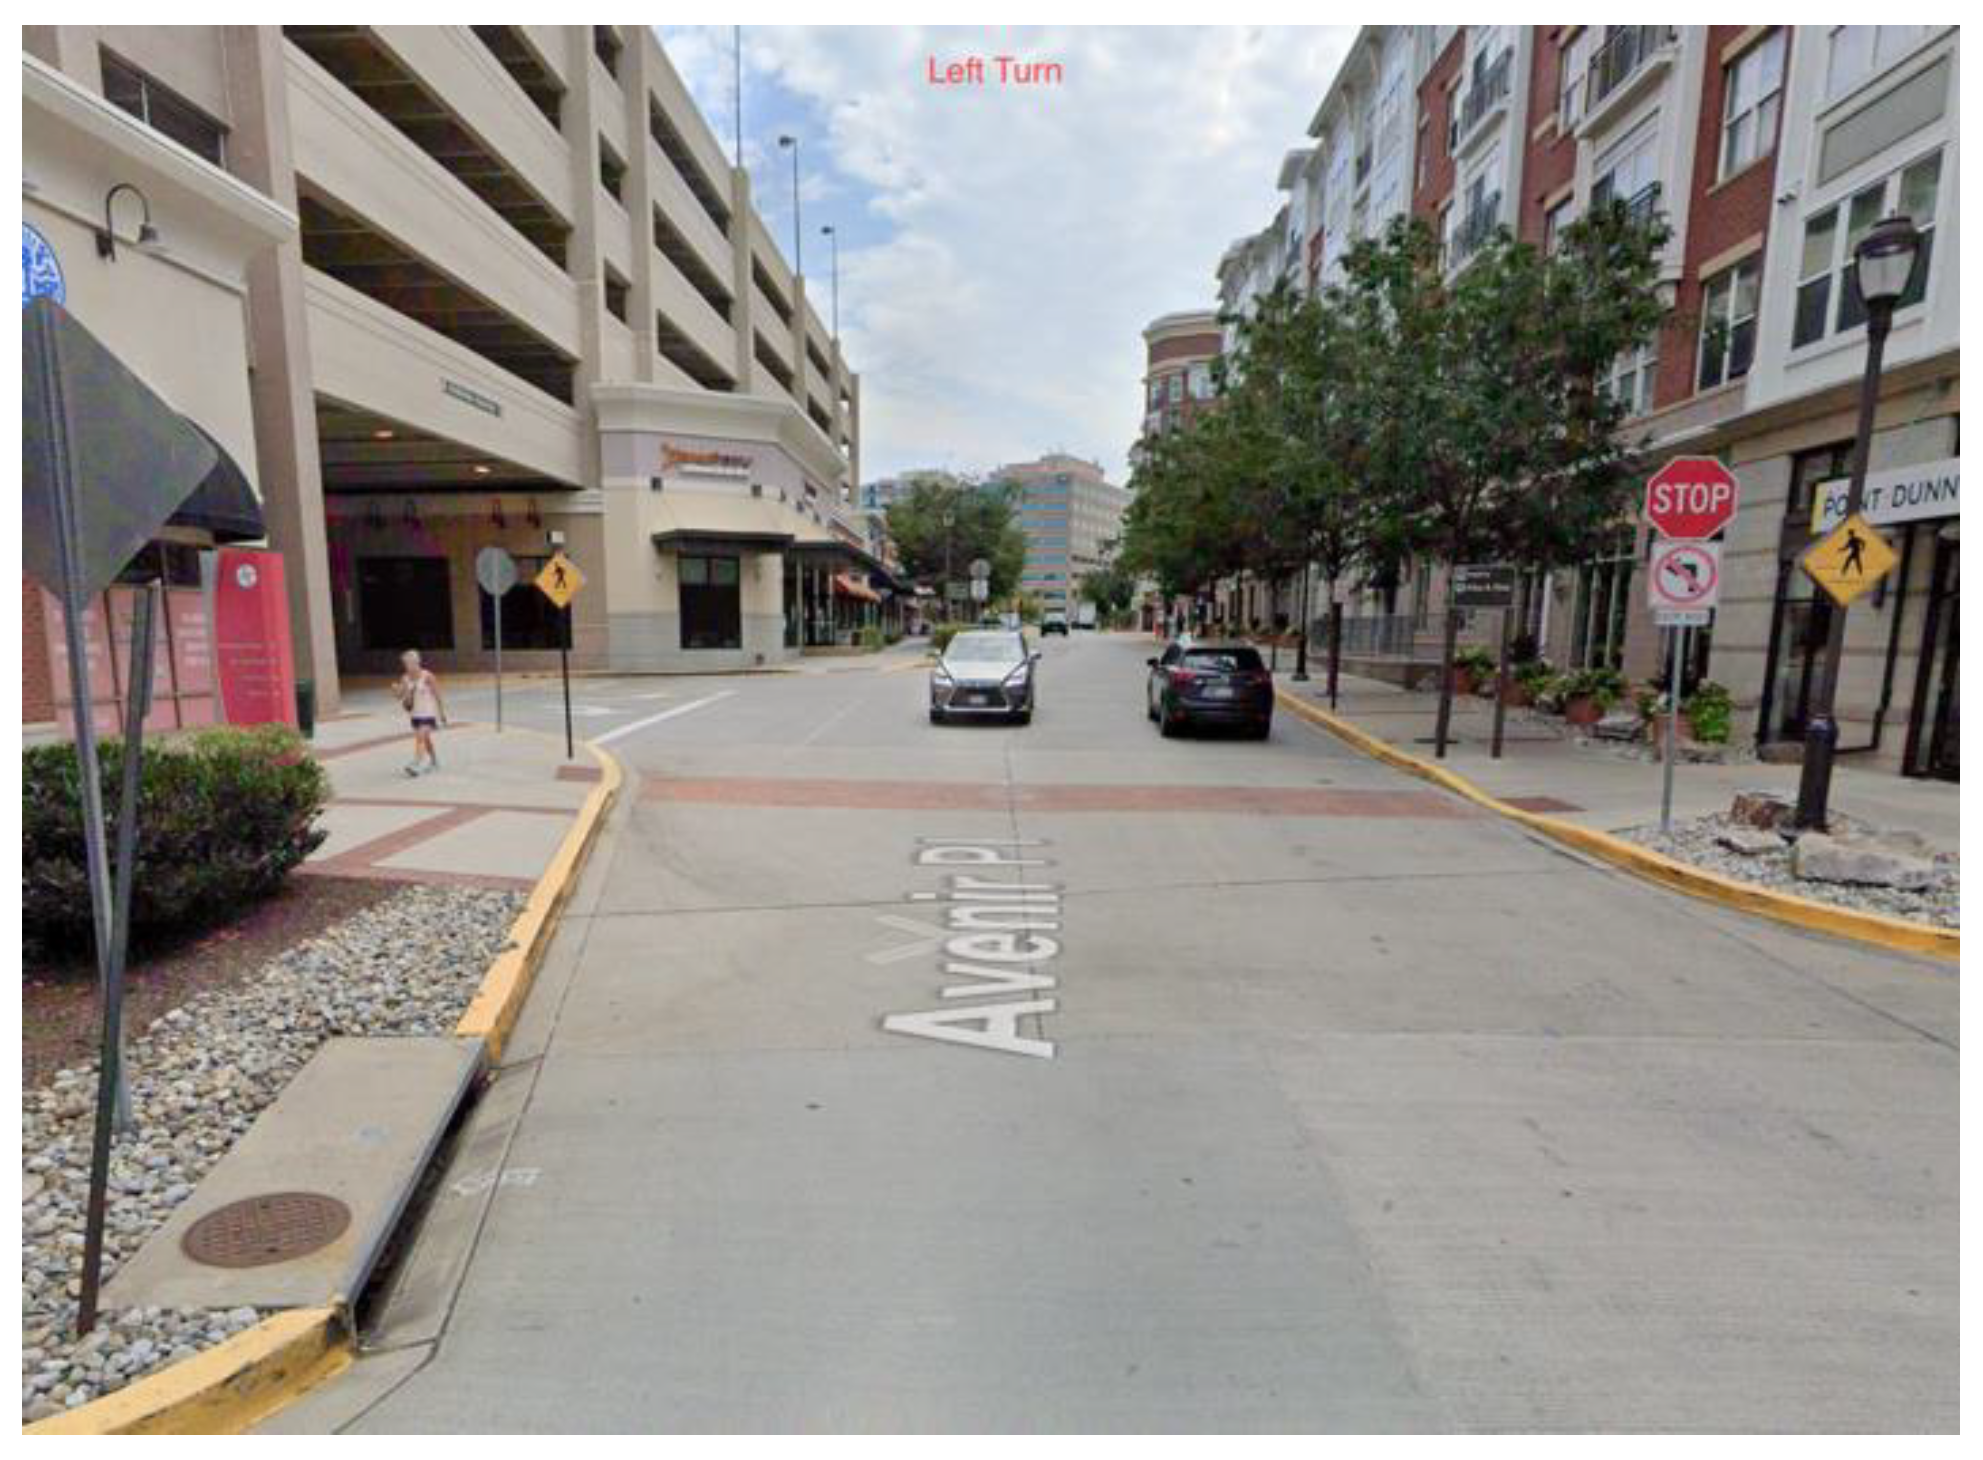
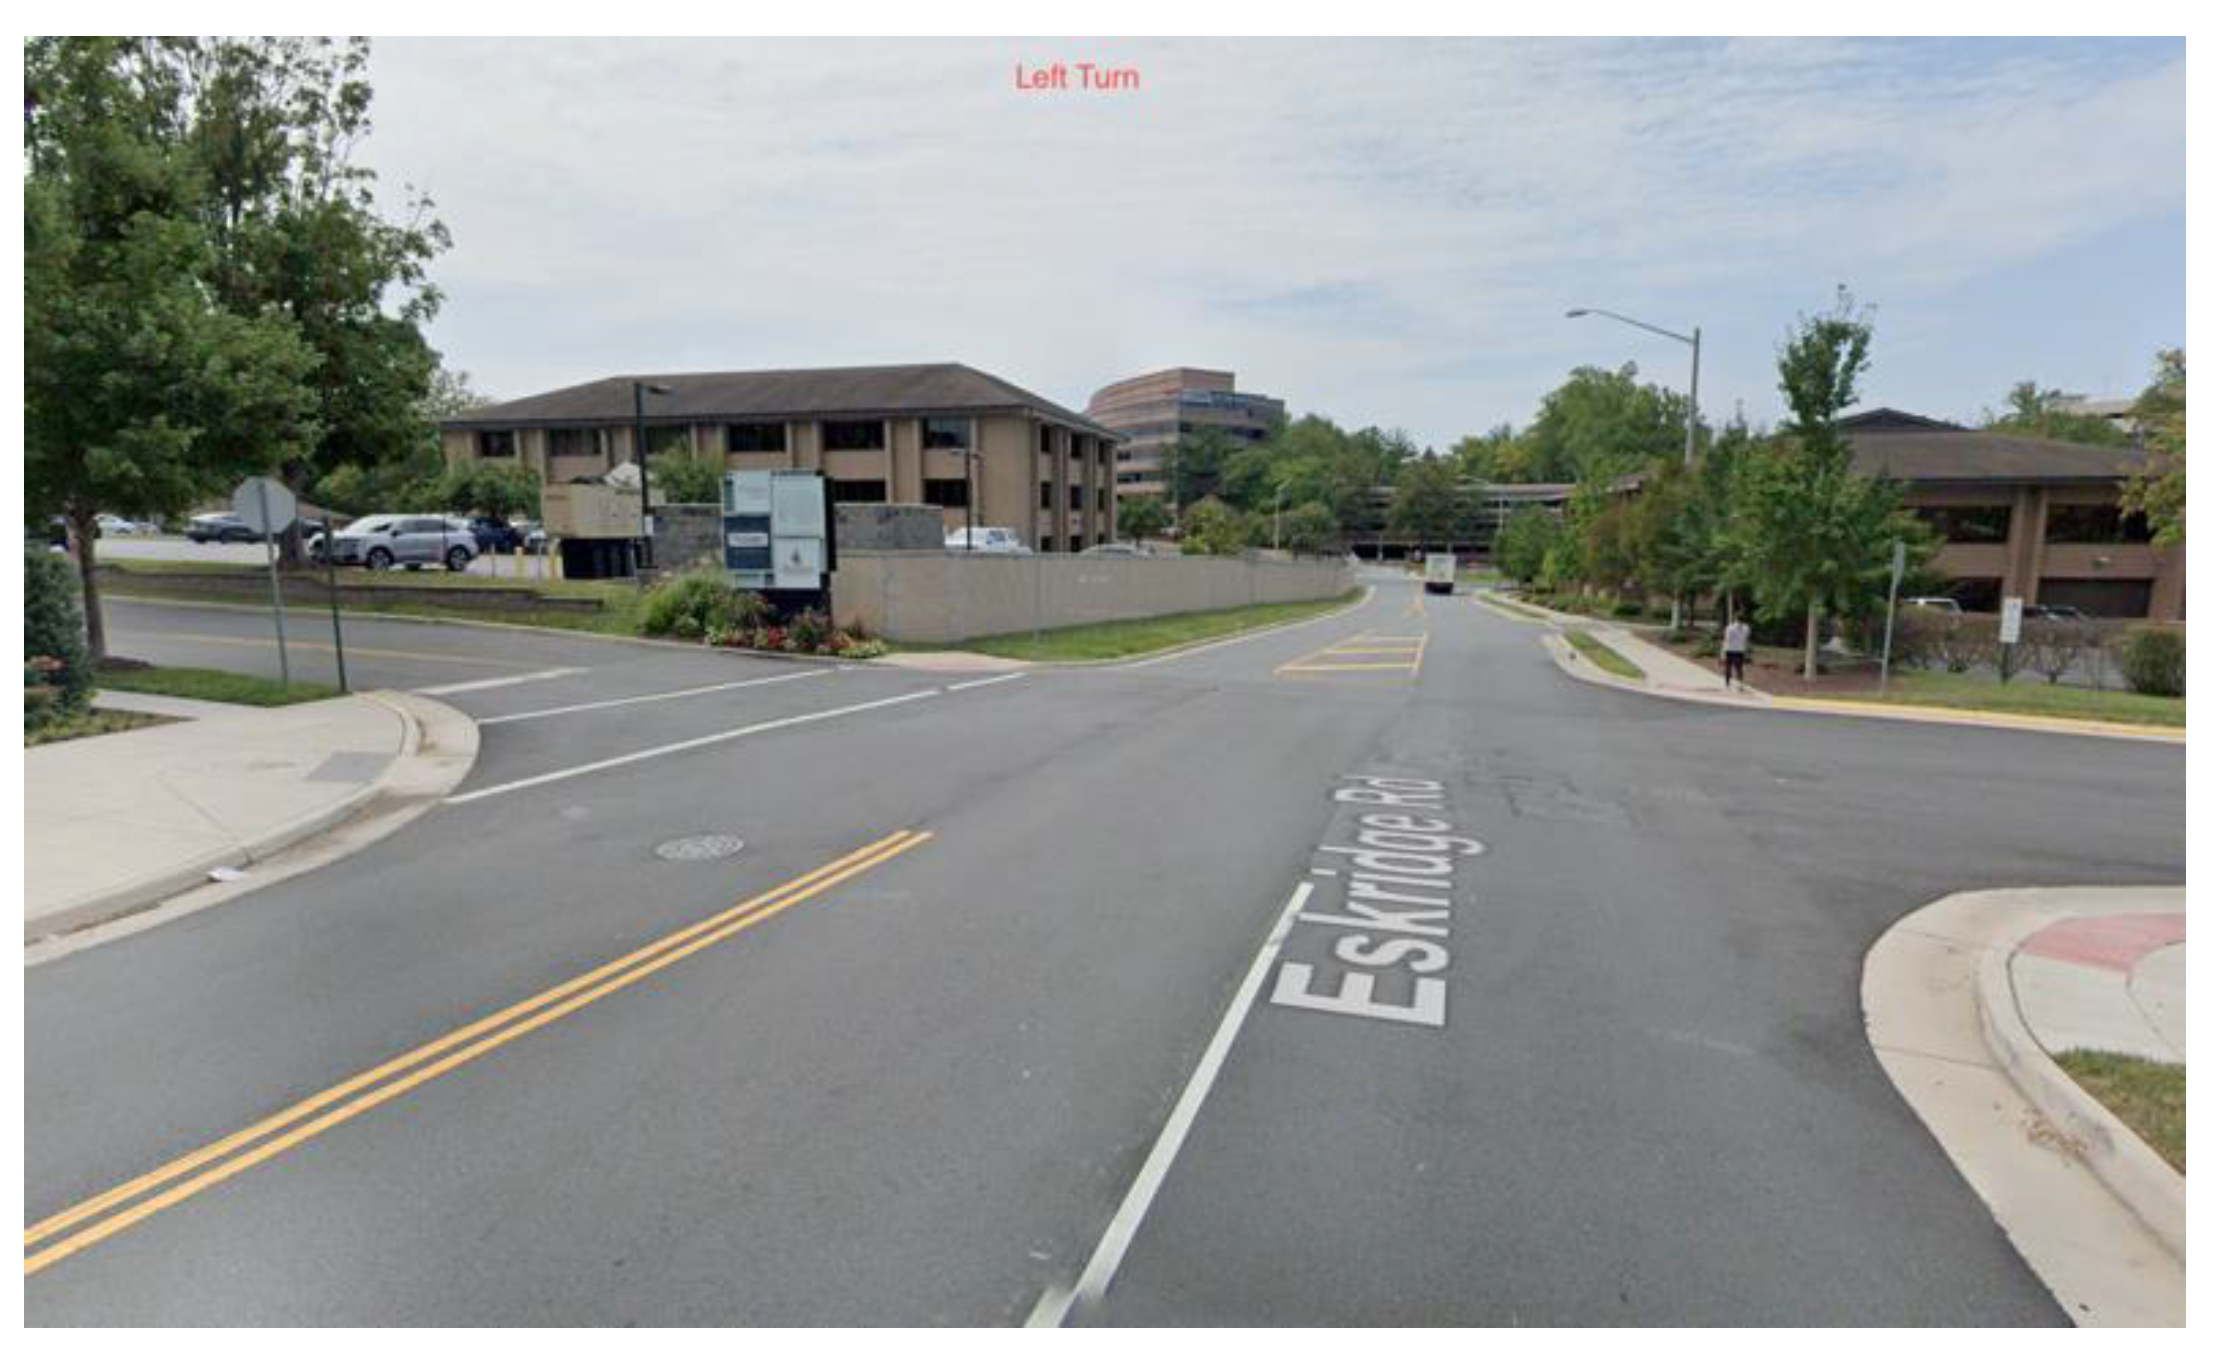
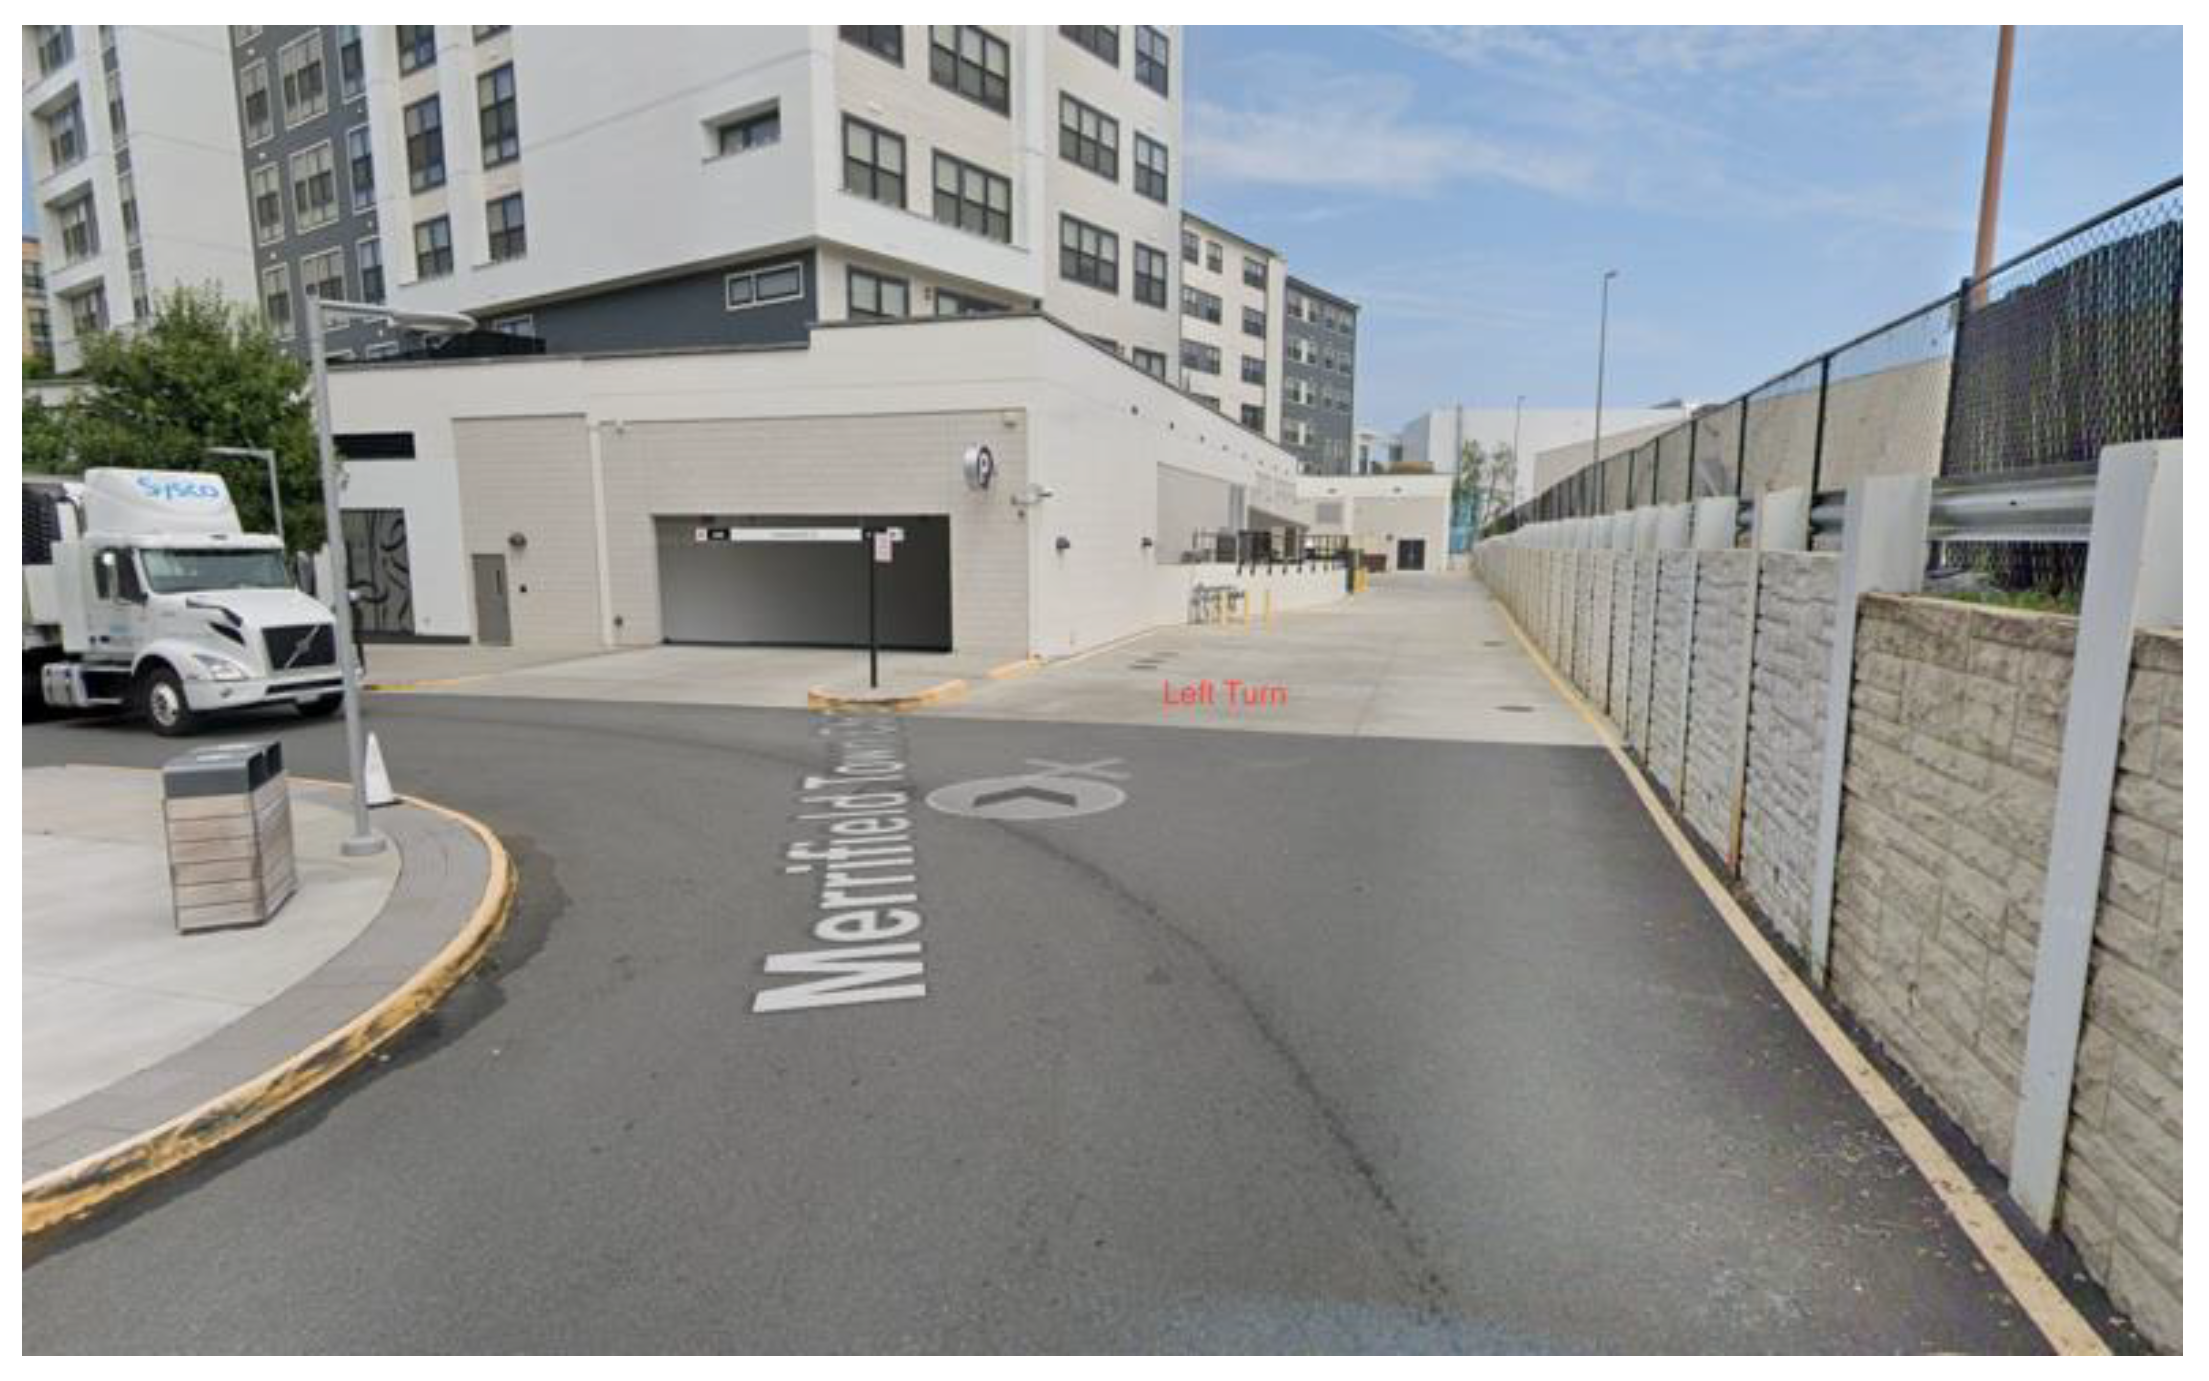
The research team identified a total of three route sections as the most problematic for the LSAV. Three intersection-type route sections and three road segments were selected based on the number of triggered events recorded within them. Interestingly, the two lists matched up perfectly. For each of the road segments identified as problematic, the intersections following the road segments were also identified as problematic. Thus, the two lists were combined into one list of the most problematic locations: the intersection in front of the Dunn Loring-Merrifield Metrorail Station, the intersection of Eskridge Road and Merrifield Cinema Drive, and the open area on Merrifield Town Center Drive. The LSAV movements were labeled to give a more intuitive understanding of the infrastructure elements at these locations.
The intersection in front of the Dunn Loring-Merrifield Metrorail Station. LSAV is traveling eastbound and turning left (
Figure 12).
- 2.
Intersection of Eskridge Road and Merrifield Cinema Drive. The LSAV is traveling southbound and turning left (
Figure 13).
- 3.
Open area on Merrifield Town Center Drive. The LSAV is following the road, which curves significantly to the left (
Figure 14).
3.5. Kinematics Data Analysis Results
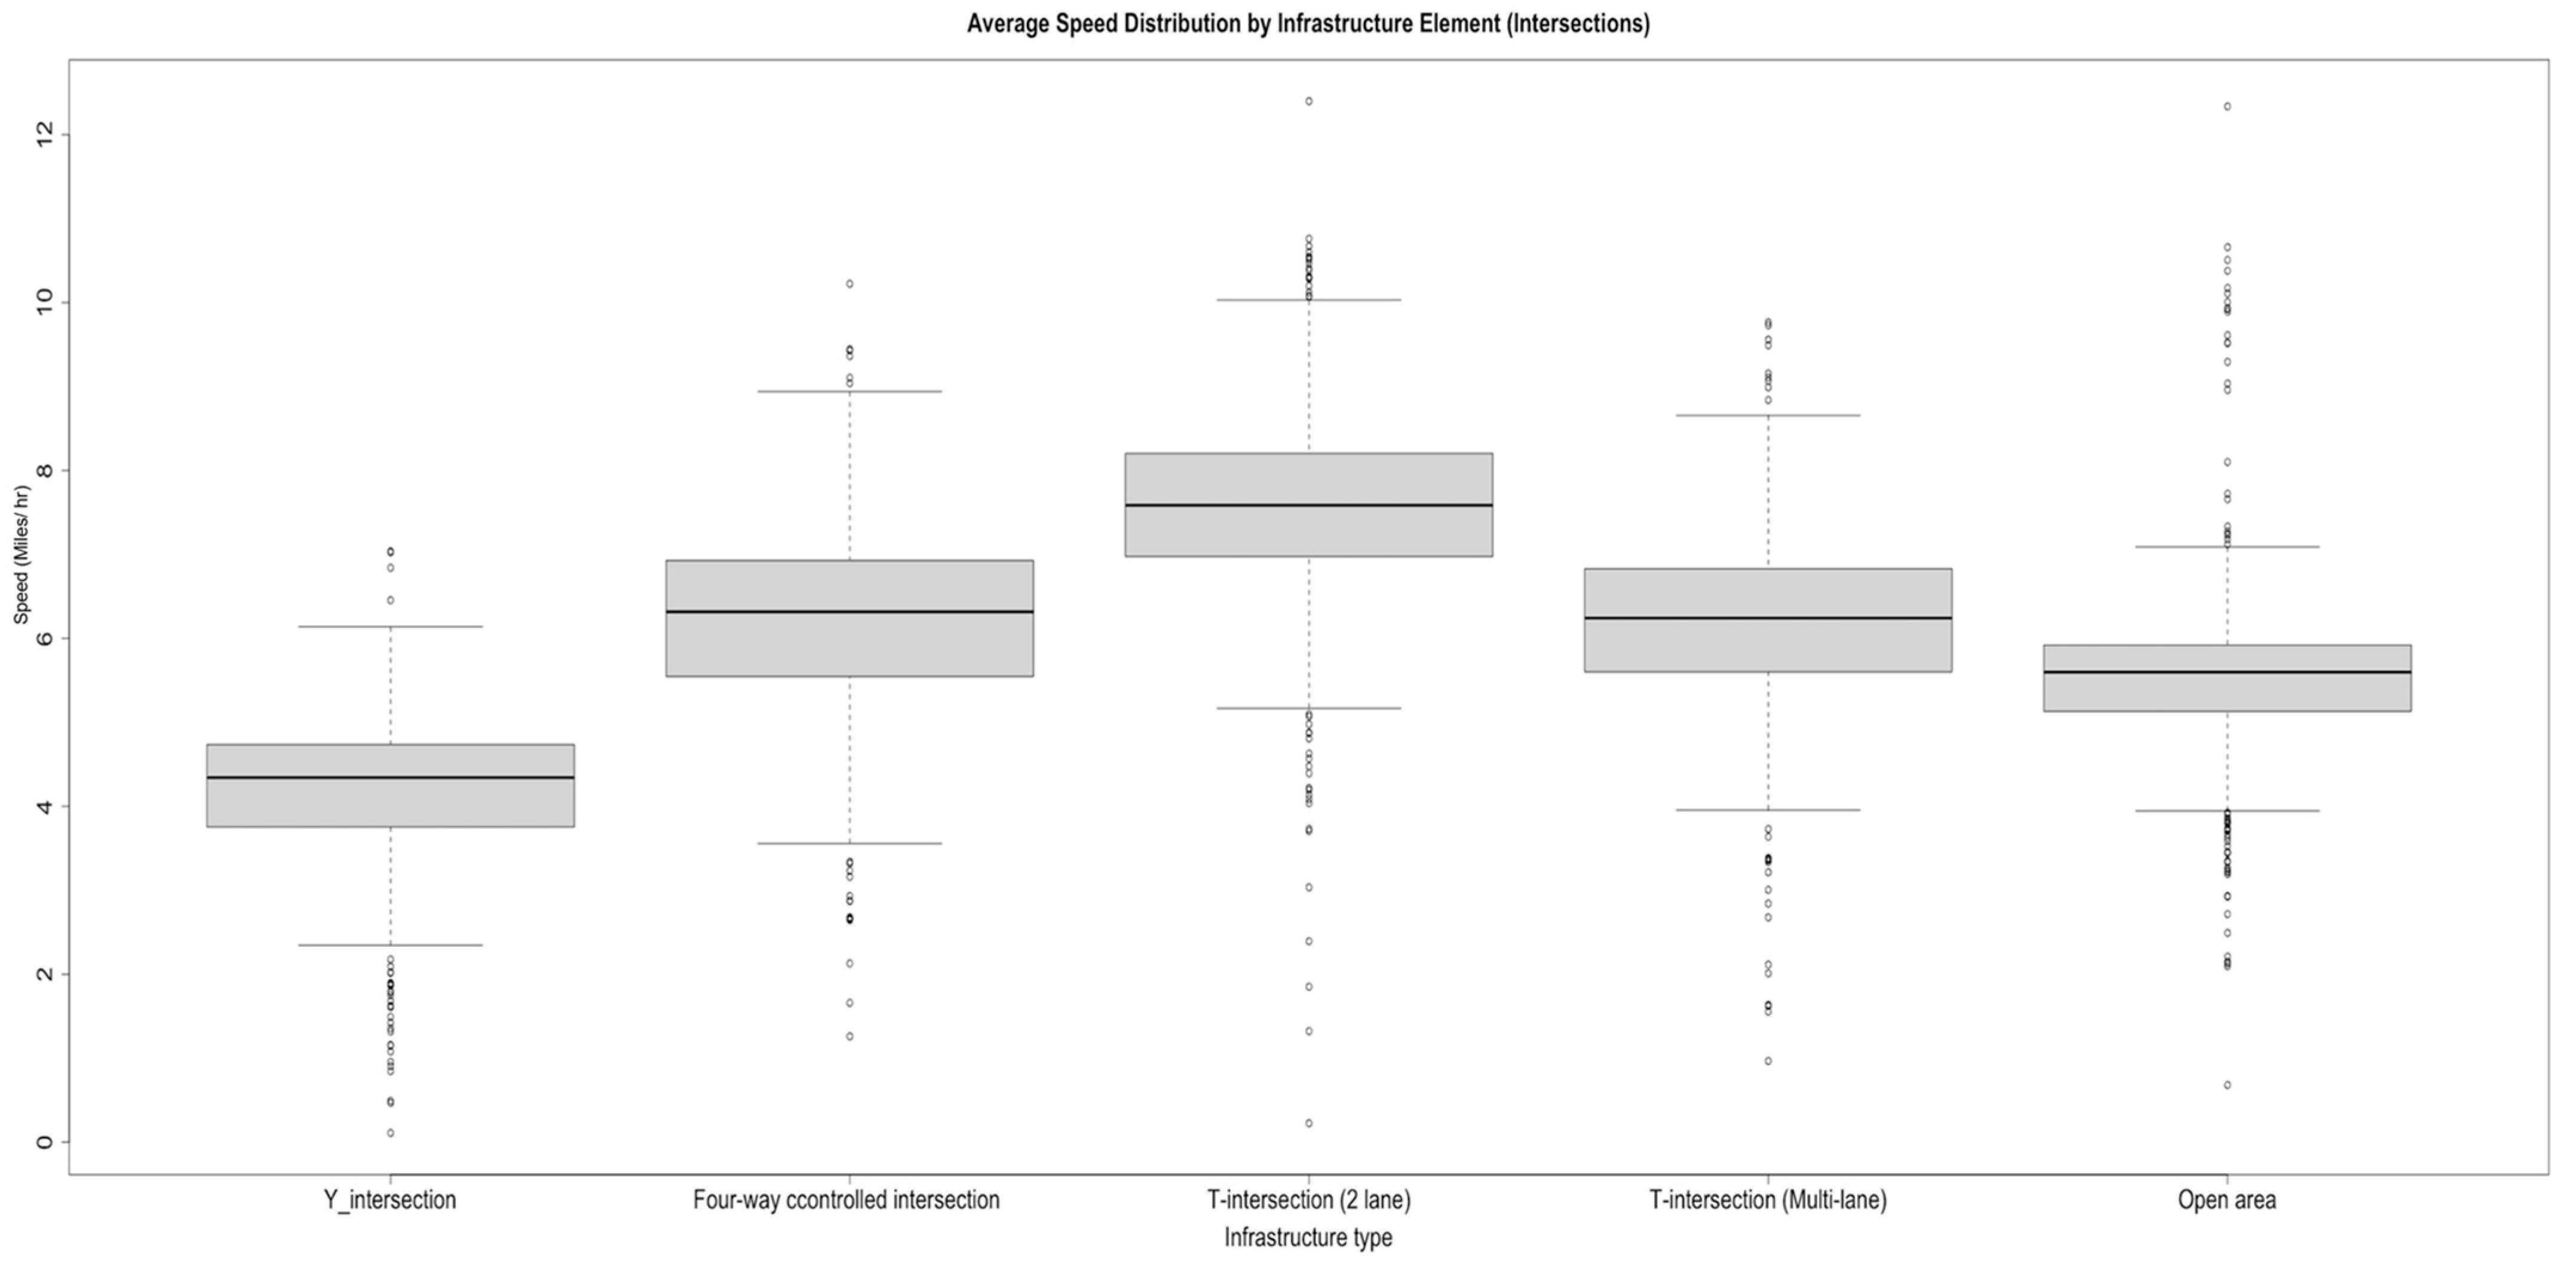
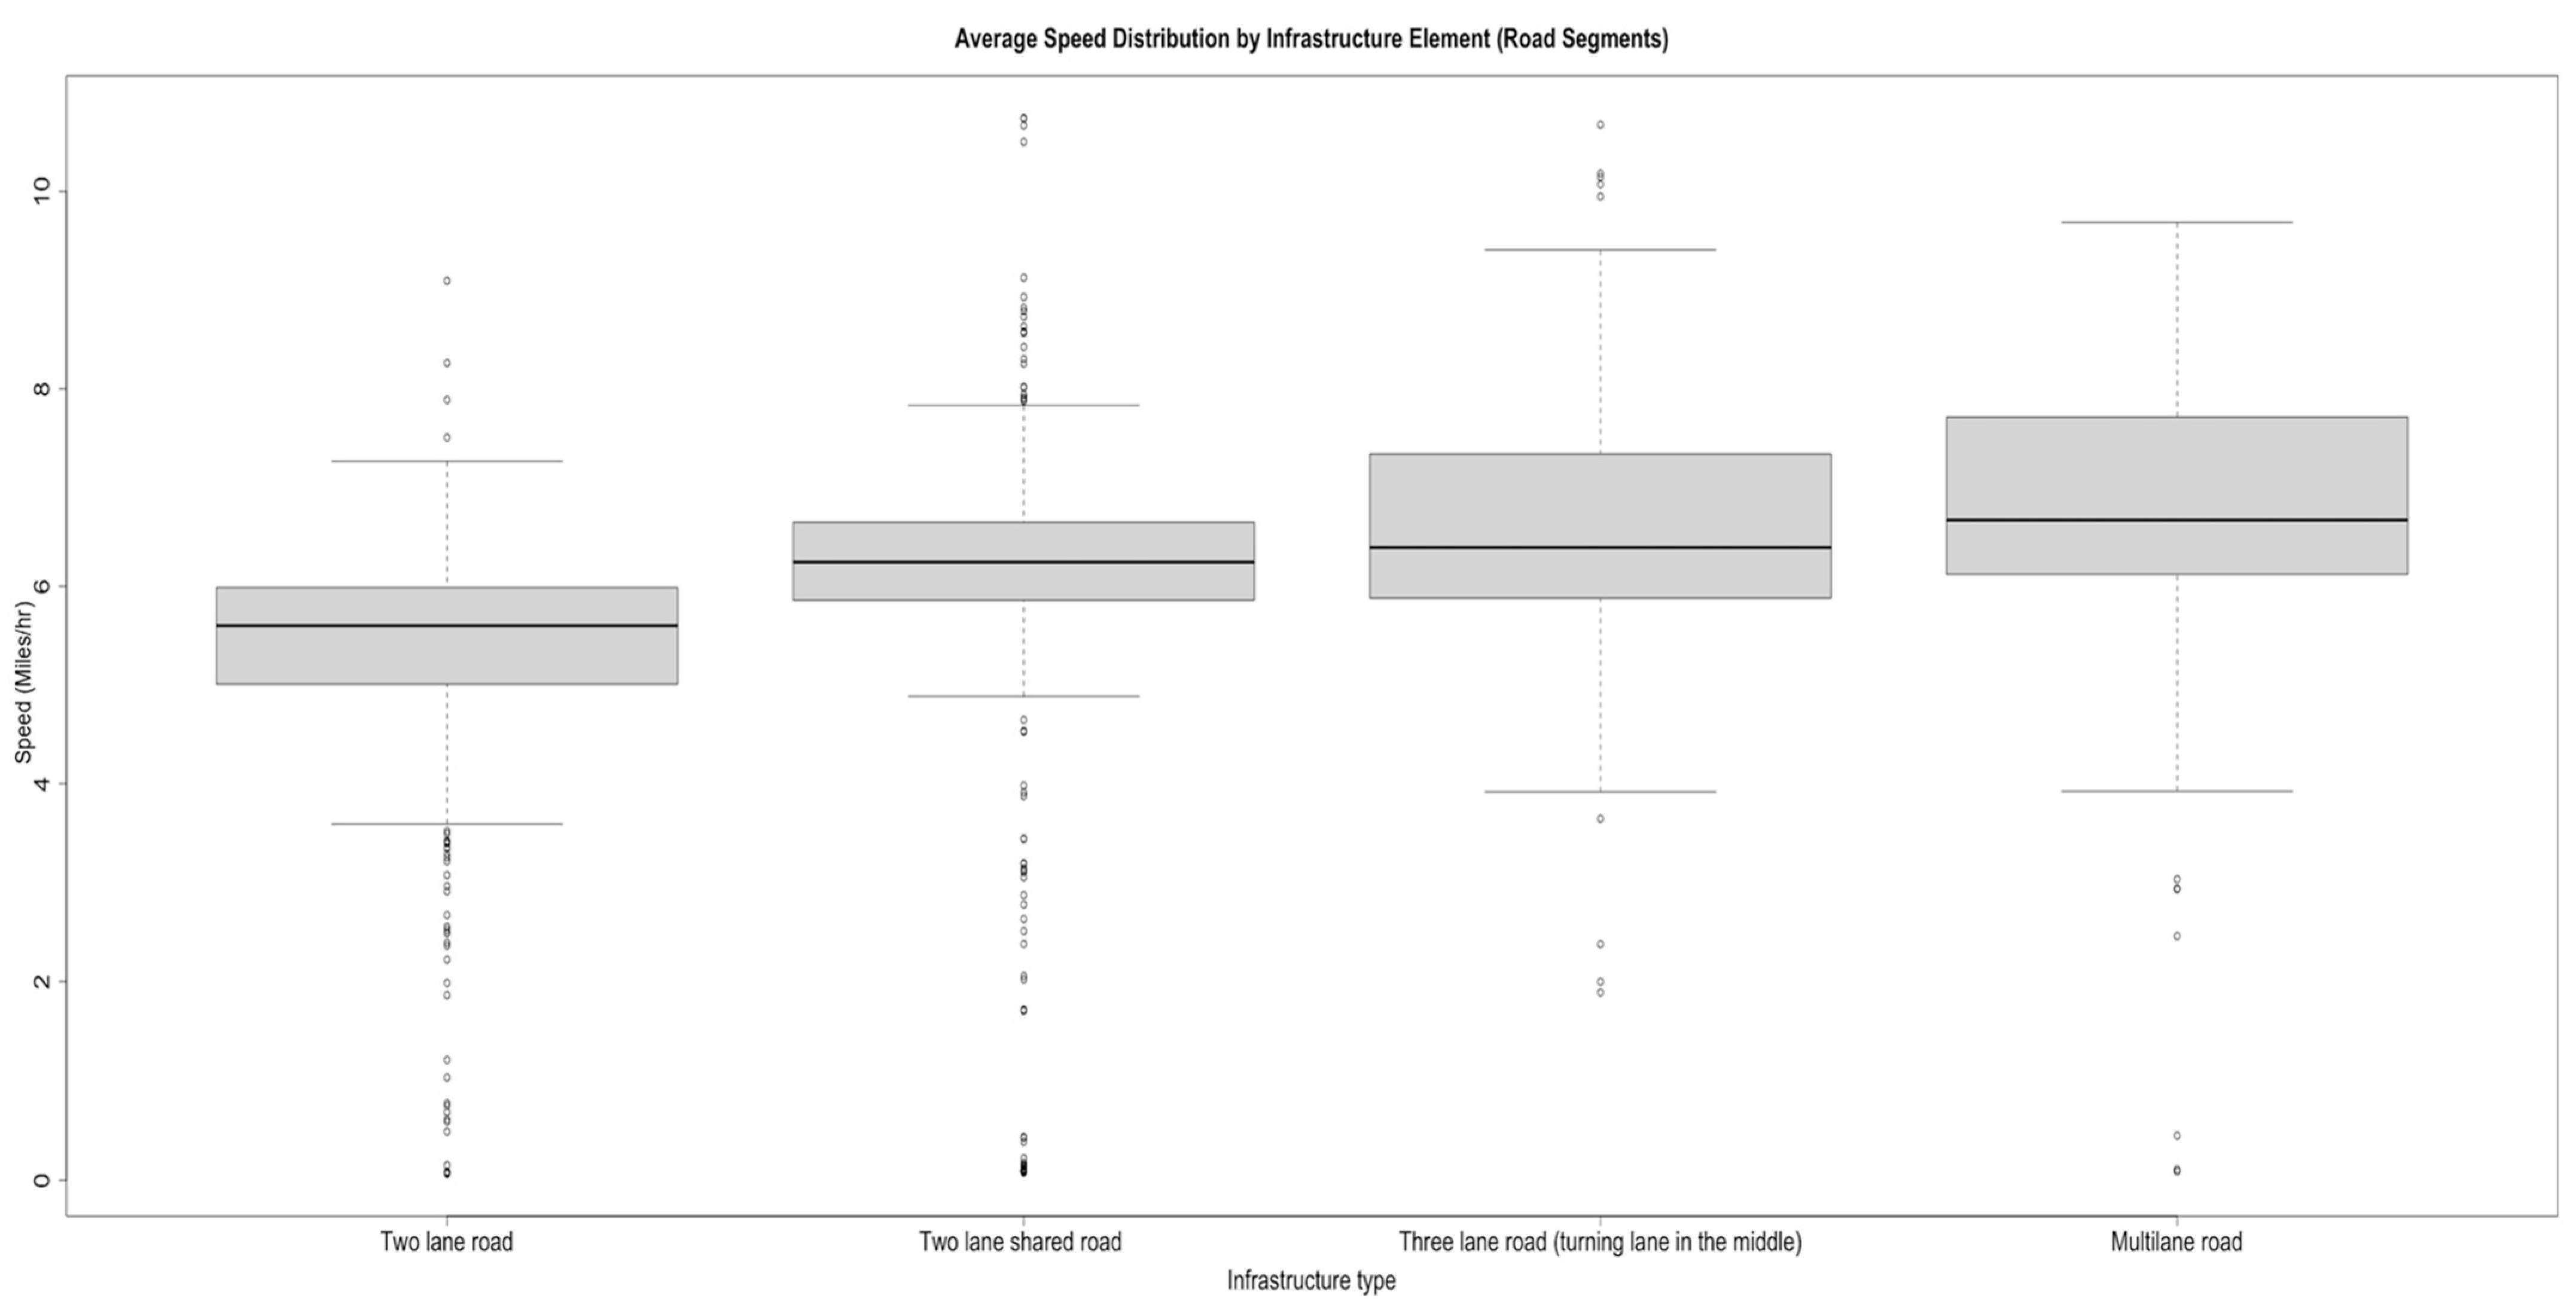
Kinematics data can serve as a reliable indicator of the LSAV performance on public roads. The LSAV operational speed was designed to be 14 mph, and the speed limit along the route was 25 mph. This designed operation speed was set to 14 mph according to the limitations of the LSAV’s automated systems and conservative automation algorithm. However, the actual operating speed calculated using the gathered kinematics data was determined to be significantly lower than the proposed 14 mph operational speed.
As seen in
Figure 15 and
Figure 16, the LSAV did not reach its planned operational speed of 14 mph. For intersections and open areas along the route, the average speed was between 4 and 8 mph, with T-intersections showing the highest speed distributions, and Y-intersections showing the lowest speed distributions. The average speed distribution was relatively consistent across different types of road segments, at around 6 mph. The lowest speed distribution was seen on two-lane roads, and the highest was on multilane roads, which is consistent with the trend seen in regular traffic. To evaluate the effect of triggered events on the LSAV’s average speed, the research team also conducted the same kinematics analysis without triggered events, finding no significant change in the results [
7].
4. Discussion
This infrastructure-based safety analysis focused on how different infrastructure elements affect the LSAV performance. Specifically, the effects of different intersection types, lane configurations, and clear markings were investigated. From the results, stop-sign-controlled four-way intersections and three-lane roads had the highest rate of safety-critical events when compared to other segment types/lane configurations. Three-lane roads (turning lane in the middle) had associated safety concerns due to vehicles passing the LSAV, potentially into oncoming traffic, and cutting in front of the LSAV, causing the e-stops. For triggered events, stop-sign-controlled four-way intersections showed the highest rates of circumventions and soft stops, which can be attributed to the LSAV’s conservative driving algorithms.
Additionally, the operator was more likely to intervene with the LSAV’s regular operation when there were no clear lane markings. This is also confirmed by the higher number of valid e-stops when clear markings were present, which can be counterintuitive. Turning lanes can be problematic for the LSAV as well. When left-turn lanes, residential areas, open areas, and curvy roads are present, the rates of soft stops are significantly higher. The three most problematic locations along the route also confirmed that left-turn lanes and left-turn movements showed the highest rate of triggered events. However, the rates were higher for valid e-stops and safety-critical events when a right-turn lane was present. This could be due to the operator not paying as much attention when the LSAV is turning right, since it is an easier maneuver compared to turning left.
The LSAV’s low speed is also concerning from a safety perspective. Based on the collected data, the LSAV was determined to travel at an average of about 6–8 mph on the route, which has a posted speed limit of 25 mph. This was also confirmed by the operations report provided by the manufacturer/deployer. The LSAV’s lower speed has several negative effects on the surrounding traffic environment. First, the LSAV’s lower speeds can create a shockwave effect and increase traffic congestion on the road segment. Moreover, the LSAV’s lower speed contributes to illegal and risky passing behavior of following drivers. After reviewing the results from this study, gathering opinions from transit experts, and reviewing experiences from other deployments, the research team recommends limiting the operation of LSAVs in a normal traffic environment.
What is more, the research team saw an increasing rate in soft stops and a decreased rate in emergency stops during the 7 months of data gathering. A report from the LSAV deployment in Ann Arbor, Michigan, also confirmed that human operators onboard intervened with the LSAV’s normal operation more frequently as the deployment progressed. This was not necessarily for safety purposes, but for the comfort of passengers. It also suggests that human operators adapt to a different intervention behavior during LSAV deployment, which shows that there is room for improvement of the automation system itself. The reasons and circumstances for the different operator interventions observed can serve as valuable feedback for the manufacturer to improve the algorithm as well. Neither the deployment management company nor the manufacturer provide such a feedback loop for current deployments.
One of the limitations for LSAVs noted through expert interviews is that LSAVs currently do not have the ability to understand where riders onboard are located. An interview with transit experts from the Blacksburg Transit revealed that it is beneficial for a conventional bus driver to have a general understanding of the position of onboard passengers. This knowledge is taken into consideration by bus drivers to ensure passenger safety while they make emergency or evasive maneuvers. Currently, there are no LSAVs on the market that have the ability to perform this task, which makes some of the maneuvers abrupt, uncomfortable, and potentially risky for riders.
Another limitation of LSAVs is their lower passenger capacity. The LSAV in this study did not see many passengers during the data gathering period. This could be due to the COVID-19 pandemic. However, transit experts at the Blacksburg Transit have pointed out that the low capacity of the LSAV can be problematic for its practicality, even outside of the pandemic, especially paired with its lower speed. The research team suggests that the current ridership data and current transit routes be examined and studied before the deployment of the LSAV, to best take advantage of its functionalities. Based on the research findings, the LSAV is best used to fill the gap of first/last-mile services and should be used on routes with lower conventional transit ridership, since it interferes with traffic.
It is important to note that the data used for this analysis were collected during the height of the first wave of the COVID-19 pandemic. Thus, traffic patterns, pedestrian traffic, and even passenger presence represented in these data may not reflect the type, frequency, or severity of interactions that may have been seen during non-pandemic times. However, these data represent the best data available for this analysis. Therefore, while the results derived from this dataset provide information regarding this pilot deployment, the results should also be interpreted with that caveat in mind. In addition, the results section provides descriptive statistics only, as this pilot project is focused on one LSAV vehicle operating on a limited schedule (Monday through Thursday from 10:00 a.m. until 2:00 p.m.).
Future research on the topic should utilize the growing naturalistic driving dataset of LSAV deployments. The COVID-19 pandemic significantly affected the number of road users present, resulting in the small number of safety-critical events observed in this analysis. Thus, research conducted after the pandemic may see an increased number of triggered events and safety-critical events, which will vastly increase the power of the analysis. A more direct comparison between different infrastructure elements with controlled baseline events may also reveal more relationships between the performance of LSAVs and the traffic environment they operate in [
7].
5. Conclusions
Analysis of video data gathered from the 7-month deployment revealed the following for LSAV deployments in the real world: four-way stop-sign-controlled intersections and three-lane roads with a turning lane in the middle were generally problematic for the LSAV. Three-lane roads also had safety concerns due to vehicles passing the LSAV, potentially into oncoming traffic, and cutting in front of the LSAV, causing e-stops. Signalized intersections were not as problematic as the research team predicted. The LSAV was caught operating in the intersection during the yellow or red phase at least once a week, but the research team did not observe any safety-critical events and only a few triggered events. Turning lanes are, however, problematic. Right-turn lanes saw the highest rates of safety-critical events and e-stops, while left-turn lanes saw more circumventions and soft stops, which could be due to the operator not paying as much attention when the LSAV is turning right, since it is an easier maneuver compared to turning left. Residential areas, open areas, curvy roads, and segments without clear lane markings saw more circumventions and soft stops. This indicates that the human operator was more likely to intervene with the normal operation of the LSAV when these infrastructure characteristics were present, which could be a representation of the LSAV’s safety limitations, since human operators did not trust the automated system under these scenarios. LSAVs currently do not have the ability to understand the positions of their passengers, which will make some of the automated maneuvers abrupt, uncomfortable, and potentially risky for passengers onboard. These maneuvers can be reduced through more comprehensive training of onboard human operators. The LSAV’s low passenger capacity can be problematic for its practicality. Due to these limitations, LSAVs are currently best used to fill in the gap of first/last-mile services, which normally involve roads with lower speed limits that have the potential to limit the LSAV’s exposure to normal traffic environments, and routes with adequate ridership (keep in mind that the LSAV only seats 12 passengers). Until all safety concerns are addressed, LSAVs should not serve as replacements for current conventional transit buses.
Author Contributions
Conceptualization, Y.H. and S.K.; methodology, Y.H. and S.K.; software, J.P.T.V.; validation, M.M. and S.K.; formal analysis, Y.H.; investigation, Y.H.; resources, M.M. and S.K.; data curation, J.P.T.V.; writing—original draft preparation, Y.H. and S.K.; writing—review and editing, Y.H. and S.K.; visualization, J.P.T.V.; supervision, S.K.; project administration, S.K.; funding acquisition, S.K. All authors have read and agreed to the published version of the manuscript.
Funding
This project was funded by the Safety through Disruption (Safe-D) National University Transportation Center, a grant from the U.S. Department of Transportation—Office of the Assistant Secretary for Research and Technology, University Transportation Centers Program. Additional funding was also provided through the Virginia Transportation Research Council and the Virginia Department of Rail and Public Transportation.
Institutional Review Board Statement
Virginia Tech Human Research Protection Program Protocol no. 21-366 reviewed and approved on 16 April 2021. The study was conducted in accordance with the Declaration of Helsinki, and approved by the Institutional Review Board of Virginia Polytechnic Institute and State University (protocol no. 21-366) on 16 April 2021.
Informed Consent Statement
Not applicable.
Data Availability Statement
The dataset is available from the Safe-D website data base.
Acknowledgments
The research team would like to thank Michael Fountain, Julie McCafferty, and Michael Buckley for their contribution to the research project. The research team would also like to state that the results in this article were presented to the sponsors of the project and made publicly available in the format of a non-peer reviewed report by the sponsors. A large portion of the material presented was extracted from that report, which was also prepared by the same research team. The link and the citation for the report is provided in the reference section of the paper.
Conflicts of Interest
The authors declare no conflict of interest.
References
- Valdes, V.; Torn, G.W.; Mortensen, S.; Diggs, D. Strategic Transit Automation Research Plan (0116); Federal Transit Administration: Washington, DC, USA, 2018. Available online: https://www.transit.dot.gov/automation-research (accessed on 2 February 2023).
- Nesheli, M.; Li, L.; Palm, M.; Shalaby, A. Driverless shuttle pilots: Lessons for automated transit technology deployment. Case Stud. Transp. Policy 2021, 9, 723–742. [Google Scholar] [CrossRef]
- Kolodge, K.; Sarah, C.; Huei, P. Mcity Driverless Shuttle: What We Learned about Consumer Acceptance; University of Michigan: Ann Arbor, MI, USA, 2020; pp. 1–11. [Google Scholar]
- Haque, A.M.; Brakewood, C. A synthesis and comparison of American automated shuttle pilot projects. Case Stud. Transp. Policy 2020, 8, 928–937. [Google Scholar] [CrossRef]
- Aecom Technical Services, Inc. ABC Phase 1 Feasibility Study Report; Aecom Technical Services, Inc.: Los Angeles, CA, USA, 2020. [Google Scholar]
- Standard J3016_202104; Taxonomy and Definitions for Terms Related to On-Road Motor Vehicle Automated Driving Systems. SAE International: Troy, MI, USA, 2021.
- Hong, Y.; Klauer, S.; Mollenhauer, M.; Talledo Vilela, J.P.; Goodall, N.; Fontaine, M.D. Evaluation Tools for Low-Speed Automated Vehicle Transit Readiness of the Area. 2022. Available online: https://vtechworks.lib.vt.edu/bitstream/handle/10919/114057/05-113%20Final%20Report.pdf?isAllowed=y&sequence=1 (accessed on 2 February 2023).
Figure 1.
Fairfax Relay autonomous electric shuttle route.
Figure 1.
Fairfax Relay autonomous electric shuttle route.
Figure 2.
Five camera views: forward view (top, left); inside the LSAV shuttle (top, right); left side of the shuttle (bottom, left); rear view of the shuttle (bottom, middle); and right side of the shuttle (bottom, right).
Figure 2.
Five camera views: forward view (top, left); inside the LSAV shuttle (top, right); left side of the shuttle (bottom, left); rear view of the shuttle (bottom, middle); and right side of the shuttle (bottom, right).
Figure 3.
Rate of e-stops, soft stops, and circumventions identified by EasyMile and reviewed by data coders at VTTI.
Figure 3.
Rate of e-stops, soft stops, and circumventions identified by EasyMile and reviewed by data coders at VTTI.
Figure 4.
E-stops, soft stops, and circumventions per mile traveled by month.
Figure 4.
E-stops, soft stops, and circumventions per mile traveled by month.
Figure 5.
Rates of reasons that an e-stop, soft stop, or circumvention occurred.
Figure 5.
Rates of reasons that an e-stop, soft stop, or circumvention occurred.
Figure 6.
Triggered event rates by route section type.
Figure 6.
Triggered event rates by route section type.
Figure 7.
Triggered event rates by lane configuration.
Figure 7.
Triggered event rates by lane configuration.
Figure 8.
Triggered event rates by lane marking.
Figure 8.
Triggered event rates by lane marking.
Figure 9.
Safety-critical event rate by route section type.
Figure 9.
Safety-critical event rate by route section type.
Figure 10.
Safety-critical event rate by lane configuration.
Figure 10.
Safety-critical event rate by lane configuration.
Figure 11.
Safety-critical event rate by special infrastructure elements.
Figure 11.
Safety-critical event rate by special infrastructure elements.
Figure 12.
Front view of intersection at the Dunn Loring-Merrifield Metrorail Station (from the LSAV perspective).
Figure 12.
Front view of intersection at the Dunn Loring-Merrifield Metrorail Station (from the LSAV perspective).
Figure 13.
Front view of intersection at Eskridge Rd and Merrifield Cinema Dr (from the LSAV perspective).
Figure 13.
Front view of intersection at Eskridge Rd and Merrifield Cinema Dr (from the LSAV perspective).
Figure 14.
Front view of open area on Merrifield Town Center Dr (from the LSAV perspective).
Figure 14.
Front view of open area on Merrifield Town Center Dr (from the LSAV perspective).
Figure 15.
Average LSAV traveling speed distribution by intersection types.
Figure 15.
Average LSAV traveling speed distribution by intersection types.
Figure 16.
Average LSAV traveling speed distribution by road segment types.
Figure 16.
Average LSAV traveling speed distribution by road segment types.
Table 1.
Data elements included in the LSAV data coding protocols for the safety analysis.
Table 1.
Data elements included in the LSAV data coding protocols for the safety analysis.
| Variable | Option |
|---|
| Trigger type | Type of triggered event that stopped the shuttle |
| Trigger reason | Reason that the vehicle may have come to a stop |
| Road users present | The presence of other road users (i.e., vehicle, pedestrians) when triggered event occurred |
| Road user position | Position of other road users in relation to the LSAV |
| Traffic density | Level of traffic flow or Level of Service at the time of the triggered event |
| Weather | Weather condition at time of the event |
| Surface condition | Surface condition at the time of the event |
| Pre-incident maneuver | LSAV maneuver just prior to the triggered event |
| Passenger presence | The presence of passengers onboard at time of the triggered event and their seating location |
| Passenger seatbelt/seatbelt unknown | Any seatbelt location where no seatbelt was worn (due to the camera angle or sun glare, it was sometimes not possible to detect if a seatbelt was being worn or not) |
| Passenger age | General age group of the passenger(s) onboard the LSAV |
| Passenger effects | Were passengers negatively impacted by the sudden stopping of the vehicle (i.e., stumbled, fell, etc.) |
| Provoked behavior | Any illegal, unsafe, or aggressive behaviors provoked in other road users surrounding the triggered event (e.g., other vehicle takes right of way) |
| Number of safety-critical incidents that took place surrounding the event | Any conflicts with the LSAV (direct) or other road users (indirect) surrounding this triggered event |
| If a safety-critical event occurred: | |
| Precipitating event | Action that started the safety-critical conflict (e.g., LSAV slowed to a stop) |
| LSAV fault | Whether the LSAV was at fault, partial fault, or not at fault for the occurrence of the safety-critical event |
| Interaction count | Number of conflicts occurring within the triggered event |
| Direct/Indirect | Whether the interaction involved the LSAV (direct) or only involved other road users (indirect) |
| Interaction severity | If the interaction was a crash, near-crash, or critical incident |
| Interaction type | Similar to the type of crash/near-crash (e.g., road departure, rear-end strike) |
| Interaction nature | Type of conflict (e.g., conflict with lead vehicle) |
| LSAV evasive maneuver | Whether the LSAV performed an evasive maneuver |
| Other actors | Other type of road user(s) involved |
| Location of other actors | Other road user(s)’ position(s) in relation to the LSAV |
| Pre-incident maneuver of other actors | Other actors’ maneuver prior to the triggered event |
| Other actors’ behavior | Other actors’ behavior that may have contributed to the triggered event (i.e., illegal pass) |
| Visual obstruction | Any visual obstructions as part of the natural environment that may have contributed (i.e., hillcrest) |
| Infrastructure contributing factors | Any infrastructure contributing factors (i.e., roadway alignment) |
| Incident notes | Text box where the coder could write anything additional that was not captured in the above coding protocol |
Table 2.
Infrastructure variables included in the LSAV data coding protocols for the infrastructure analysis.
Table 2.
Infrastructure variables included in the LSAV data coding protocols for the infrastructure analysis.
| Infrastructure Variable | Definition | Examples |
|---|
| Route section type | Type of route section | Road segments/signal-controlled intersections, etc. |
| Lane configuration | Number of lanes, turning lanes, and bike lanes | Two-lane road with bike lane, etc. |
| Clear marking | Whether there are clear markings on the road or not | Without clear marking/with clear marking |
| Special elements | Open areas, parking lot entrances, visual obstructions, and other special elements worth noting | Loading area, residential areas, bus terminals, etc. |
| Disclaimer/Publisher’s Note: The statements, opinions and data contained in all publications are solely those of the individual author(s) and contributor(s) and not of MDPI and/or the editor(s). MDPI and/or the editor(s) disclaim responsibility for any injury to people or property resulting from any ideas, methods, instructions or products referred to in the content. |
© 2023 by the authors. Licensee MDPI, Basel, Switzerland. This article is an open access article distributed under the terms and conditions of the Creative Commons Attribution (CC BY) license (https://creativecommons.org/licenses/by/4.0/).

