Abstract
Complex installations that involve dangerous substances, such as oil and gas or nuclear plants, must mandatorily undergo a quantitative risk assessment (QRA) according to current regulations. This requires, among others, the simulation of hundreds of accidental scenarios, which are typically carried out using empirical tools due to their fast response. Nonetheless, since they are not able to guarantee sufficient accuracy, especially when complex geometries are involved, computational fluid dynamics (CFD) tools are increasingly used. In this work, a high-pressure accidental release of a sour gas (CH4-H2S) in an offshore platform under several wind conditions is considered. A methodology used to perform a wind sensitivity analysis via CFD, while avoiding high computational costs, is presented. The wind intensity impact on some risk-related figures of merit, such as the high lethality or irreversible injuries areas, is discussed in relation to the flammability and toxicity limits of the released mixture. The results show that even a very low amount of H2S in the released mixture can strongly affect the threat zones. A progressive decrease in the toxic and flammable volumes in the platform is observed as the wind velocity increases; nonetheless, a saturation effect appears in high wind speed scenarios.
1. Introduction
Past accident history suggests that, despite the fact that severe scenarios in large industrial plants are quite rare, they can lead to dramatic consequences for people’s health, the environment, business, and asset integrity [1,2]. In recent years, the robustness of safety methodologies has considerably increased to guarantee that the technological development is accompanied by adequate safety considerations.
In this sense, particular attention is paid to risk-relevant plants (chemical, oil and gas, nuclear, etc.) in which dangerous substances and equipment are involved, as demonstrated by the strict regulations introduced to enhance their safety demonstration methodologies [3,4].
This work focuses on the oil and gas (O&G) offshore activities, and in this framework, the reference regulation is the EU Offshore Safety Directive 2013/30/EU, which defines the quantitative risk assessment (QRA) as the most suitable tool for safety assessment.
In particular, where natural gas extraction is concerned, one of the major safety issues is related to the presence of hydrogen sulfide (H2S) traces, as it is a flammable and toxic gas with the potential to cause major injuries and death; in this case, stricter safety constraints are imposed on the extraction process of CH4-H2S mixtures (sour gas) [5].
According to [6], the O&G industry is one of the most significant anthropogenic sources of H2S, and nowadays, several O&G extraction plants perform activities that involve sour gas, as reported by several works, including the works mentioned in the following section. In the North Sea, natural gas can contain up to 2 vol% of H2S [7]. The Kazakh gas fields of Kashagan and Tengiz present contents of H2S around 19 vol% and 16 vol%, respectively [8,9]. In the Sichuan Basin, the percentage of H2S in natural gas can vary between 10 vol% and 17 vol% [10], while in the Eastern Venezuela Basin, the concentration can be ~5 vol% [11].
Due to its corrosive nature, H2S can cause several types of damage to industrial components, increasing their failure rate, and hence their release frequency [12]. An accidental release of sour gas can lead to several major accidents, such as explosions, fires or toxic dispersions and the consequences can be dramatic for the people and the environment, as observed during the Lodgepole blowout accident in Alberta in 1982 [13]. In fact, it can cause severe eye and respiratory irritation, and, at high concentrations, it can cause immediate human deaths [14]. It is also highly dangerous for vegetation, as high concentrations can inhibit root growth and compromise plant growth [15]. If it is dispersed in water, it can affect the marine fauna, as exposure to fishes causes hyperpnea, followed by final respiratory arrest [16]. For all these reasons, the evaluation of the consequences of an accidental sour gas release must be carefully addressed during the risk assessment of those plants.
The state-of-practice for the accident simulation for QRA purposes entails the use of simple tools based on empirical correlations, such as turbulent free-jet models [17], gas dispersion models [18] and jet fire models [19,20], which guarantee a fast response with no need for deep theoretical knowledge. On the other hand, these methods neglect geometry (i.e., the flow–object interaction is not modeled), and lead to highly conservative results with a consequent waste of resources when over-protection measures are implemented. This last consideration is true especially in the case of congested plants, such as offshore platforms, where a limited space is available, and in nuclear plants, where a major part of the equipment is inside a containment building to avoid external leakage of radioactive materials.
Complex methods, such as computational fluid dynamics (CFD), might be employed to guarantee the needed accuracy. Several authors have already used CFD approaches to reproduce accidents, such as the sour gas well blowout accident that occurred at Kaixian (China) in 2003, which caused 243 deaths [21,22].
Furthermore, CFD is widely used to simulate accidental gas dispersions, e.g., accidental H2 dispersions in automotive scenarios [23,24], CO2 releases from high-pressure pipelines [25,26] and high-pressure natural gas releases from pipelines [27]. In particular, a novel assessment tool based on CFD is proposed in [28,29,30] to estimate the extent of high-pressure methane jets impinging on differently shaped objects.
Despite its extensive use for single scenarios, CFD can be hardly integrated in a QRA, due to its expensive computational cost. Its response time is too long to permit the estimation of the consequences of hundreds of accidental scenarios during the plant design phase.
For this reason, the SEADOG laboratory at Politecnico di Torino proposed a novel approach called the source box accident model (SBAM) [31,32,33,34], which is based on ANSYS Fluent and used for the simulation of high-pressure gas releases in congested environments, guaranteeing a sustainable accuracy and computational cost compromise. The approach involves CFD and is based on the splitting of the accidental release phenomenon into the following two main physical steps: the supersonic release near the release hole and the far-field dispersion.
In this work, SBAM is employed to simulate a high-pressure sour gas release in a platform under several wind conditions. A sensitivity analysis of the wind speed is presented, since this represents a key parameter for the assessment of consequences related to hazardous substances’ releases [35].
In the literature, there are already several works that focus on wind sensitivity analysis of gas dispersions for QRA purposes. In [36,37], CFD analyses of the influence of wind on flammable gas clouds for hazardous area classification and on the H2S dispersion consequences are respectively proposed. In [38], gas dispersion wind is analyzed through the empirical-based software PHAST and in [39], a CFD-based empirical model for hazardous area classification is proposed. It must be remarked that none of these studies consider real-life complex geometrical arrangements because of the high computational cost and the associated complexity. To close this gap, this work proposes an alternative approach, employing SBAM, which allows us to deal with high-pressure releases, congested environments and high gradients in the main parameters (such as concentrations and speed).
The first objective of the present work is to describe an efficient way to perform a set of simulations with different wind conditions via CFD, without the need for high computational efforts. In fact, when dealing with external flows, CFD could require a prohibitive computing power, as large computational domains are needed to correctly reproduce the flow-field around the object of interest (e.g., a plant). Secondly, the wind intensity impact on the resulting damage areas and risk-related figure of merits is analyzed.
In the next section, the case study is introduced, as well as the flammability and toxicity limits related to the involved gas mixture. Section 2 is devoted to the methodology, and it is divided into the following two parts: the first part is related to the wind field simulation, while the second part is related to the dispersion. In Section 3, the results related to the gas dispersion under several wind conditions are discussed, and some conclusions and useful insights are proposed in Section 4.
Case Study
Figure 1 shows a platform geometry, in which the main components are represented by simple geometric shapes and secondary equipment is neglected.
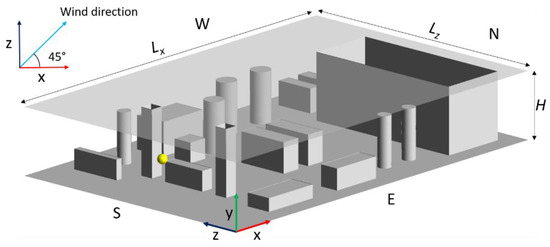
Figure 1.
Geometry of the platform production deck, with the release point in yellow and a schematic representation of the wind direction.
The domain ceiling is represented as transparent for visual purposes. For the sake of simulation, it is a plated ceiling. The cardinal points south (S), east (E), north (N) and west (W) are indicated to univocally identify the lateral faces of the platform. The domain dimensions are Lx = 30 m, Lz = 20 m and H = 5 m. The release position is represented by the yellow bullet in Figure 1, and its coordinates are x = 3 m, y = 2.5 m and z = 10 m, while the release direction is . The wind direction is schematically represented in the upper left corner of Figure 1. The other relevant parameters are as follows:
- Release pressure and temperature: prel = 50 bar and Trel = 300 K;
- Release hole diameter: drel = 3 cm;
- Released gas mixture mole composition: 99 mol% CH4, 1 mol% H2S;
- Wind velocities: Uref = 2-4-6-8-10 m/s;
- Ambient temperature: Ta = 300 K.
The release pressure and hole diameter (when a circular hole is assumed) are chosen in agreement with [40], which suggests the most frequent values for these parameters basing on the review of loss of containment accidents in the O&G field. Trel is defined by assuming that the leakage involves a piece of equipment, such as a pipeline or a tank, in thermal equilibrium with the external environment. The mixture composition that is chosen is realistic, considering that a natural gas well with a much higher H2S concentration is unlikely to be exploited due to its toxicity level. Different values of Uref are chosen to assess their impact on flammability and toxicity quantitative consequences, in terms of volumes and masses. The following flammability and toxicity limits for the involved substances are introduced to determine the zones of installation where a flammable or toxic concentration can be reached in case of an accident:
- LFL: lower flammability limit;
- UFL: upper flammability limit;
- IDLH: immediately dangerous to life and health concentration;
- LC50: lethal dose at which 50% of the population is killed in a given time following exposure.

Table 1.
CH4 and H2S flammability and toxicity limits.
Since both gases are flammable, the LFL and UFL of the released mixture can be evaluated using the Le Chatelier’s rule, as was the case in [44], considering that the mole concentration of CH4 (CCH4) is 99% and the H2S mole concentration (CH2S) is 1%.
where i indicates the i-th species. Considering an analogous formula for the UFL and the values in Table 1, the following values are obtained for the mixture:
- LFLmix = 4.994%;
- UFLmix = 16.104%.
These flammability limits values are considered for the representation of the flammable areas and the calculation of the flammable quantities in the discussion of results in Section 3.
2. Methodology
2.1. Wind Field Simulation
When simulating gas dispersion in an open environment, particular attention must be paid to the generation of the wind field. The case study considered in this paper presumes the generation of the wind field inside the platform, where the gas dispersion takes place. The standard procedure to correctly obtain a wind field that interacts with a body is to build a larger computational domain that contains the body, in order to impose the velocity boundary conditions as far as necessary. Several works have used this approach, especially for the study and optimization of tall buildings, which are exposed to relevant wind intensities [45,46,47]. These works hint that the sizing of the computational domain must assure a fully developed pressure field behind the body, since the pressure coefficient is of interest when designing a building. Considering this constraint, the following dimensions suggested for the domain are expressed as a function of the body height (H):
- The wind inlet must be imposed at 5H from the body;
- The outlet BCs must be imposed at 15H from the body;
- The height of the domain should be 6H.
These choices guarantee a fully developed pressure field around the body, but, on the other side, imply high computational effort due to the large computational domain size. Moreover, if gas dispersion must be simulated in the domain, a fine grid resolution must be guaranteed in the volume, leading to an unsustainable computational cost. This work proposes an alternative criterion for the computational domain sizing, that is, the domain has to be large enough to guarantee a fully developed velocity profile that impacts the platform. Figure 2 presents the platform geometry and the external box that represents the computational domain. The distance between the platform borders and the box sides is indicated by L. The following four different box sizes are investigated by varying L:
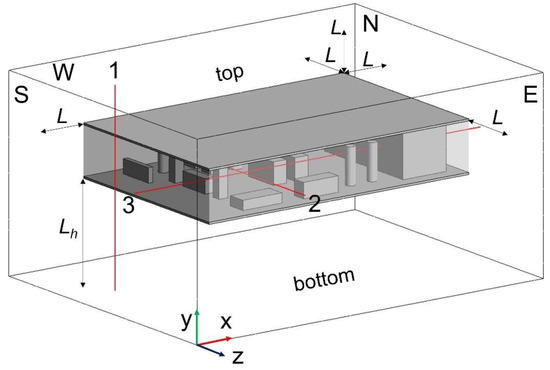
Figure 2.
External box for the wind simulation with probe lines (in red). The letters S, E, W, N indicated the lateral sides of the box while the other two faces are named top and bottom.
- L = H = 5 m;
- L = 2H = 10 m;
- L = 3H = 15 m;
- L = 4H = 20 m.
Lh represents the platform distance from the ground (the sea, in this case); it is the only physical boundary that is kept constant and equal to 10 m, a plausible platform height above the sea level. The simulations are performed in ANSYS Fluent, by setting up a steady-state simulation that solves a RANS formulation of the governing equations. In particular, the k-ω SST model is used, as it is suggested for most of the industrial applications [48]. A wall with no slip condition is imposed on the box bottom and on the platform walls. The logarithmic wind profile defined by Equation (2) is imposed through a user-defined function on the S and E box faces.
Uref is the reference velocity that is set equal to 10 m/s. In fact, it is expected that the dimensioning of the domain, which is performed for the largest Uref, is conservative for the lower velocities, since it is reasonable to assume that a lower velocity contributes to the profile development. The reference height yref, which corresponds to Uref, is set equal to Lh + H = 15 m and the surface roughness z0 is set equal to 0.1, assuming that the open sea surface is similar to land with mature crops [49]. The wind direction is set to be consistent with the one indicated in Figure 1. Moreover, the turbulent kinetic energy k and the specific dissipation rate ω are prescribed at the inlet faces (S and E). These parameters are evaluated through Equations (3) and (4), as proposed in the ANSYS Fluent manual [48], where they are expressed as a function of the turbulence intensity I, the reference velocity Uref and the turbulent length scale l.
The turbulent intensity I is evaluated through the correlation proposed by IEC [50], as shown in Equation (5), where Iref is set equal to 0.14 to obtain the average of its possible value range (0.12–0.16).
The constant Cμ is a turbulence model constant that is equal to 0.09 [48] and the turbulence length l is evaluated by the expression l = 0.4δ suggested in [48], where the boundary layer thickness δ is evaluated as suggested in [51] for turbulent flows. The resulting turbulence parameters values imposed at the boundaries are k = 5.05 m2/s2 and ω = 391 s−1.
On the top box boundary, a symmetry condition is imposed, as demonstrated in [45,46]. Atmospheric pressure is imposed on the N and W boundaries. The fluid is assumed to be incompressible due to the low-speed velocities involved, and the energy equation is not solved as there is no thermal imbalance. An unstructured tetrahedral mesh is generated in the domain with a higher element density in the deck region and a progressively coarser discretization towards the outer boundaries. In particular, in the region inside the deck, a maximum element size of 0.5 m is imposed, with a face refinement value of 0.15 m for the objects with a 1.2 growth rate. A control volume is set around the deck that imposes an element size of 1 m, while in the remaining portion of the domain, a target size of 1.5 m is set. Face refinement is imposed at the inlet boundaries with a 0.5 m size and the refinements are generated at the object walls and on the ground to guarantee a y+ value between 30 and 300, which is the suggested range needed to solve the boundary layer through wall functions [48]. These specifications are used for all the simulations and the total number of elements obtained for the cases with L = 5-10-15-20 m is ~1.7-1.8-2-2.1 × 10⁶, respectively. The results obtained via the simulation of the different domain sizes are compared by taking the velocity profiles on the three probe lines (one for each axis direction) depicted in red in Figure 2, which are dimensioned for the smallest domain (L = 5 m). The velocity profiles obtained on these lines are shown in Figure 3, Figure 4 and Figure 5.
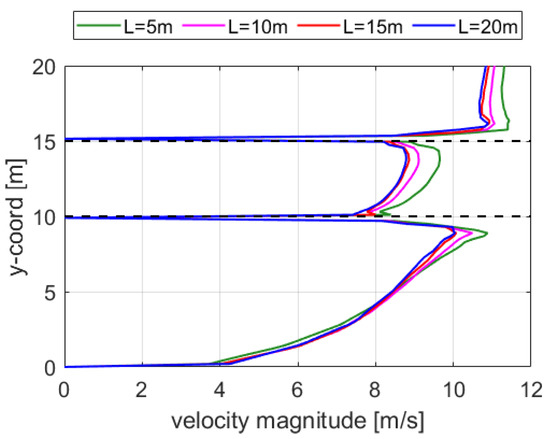
Figure 3.
Velocity profiles along line 1 for different L values. The portion of the velocity profile between the black dashed lines impacts the platform.
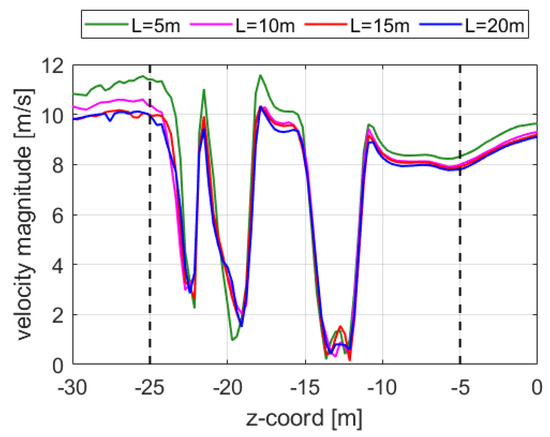
Figure 4.
Velocity profiles along line 2 for different L values. The portion of the velocity profile between the black dashed lines is inside the platform.
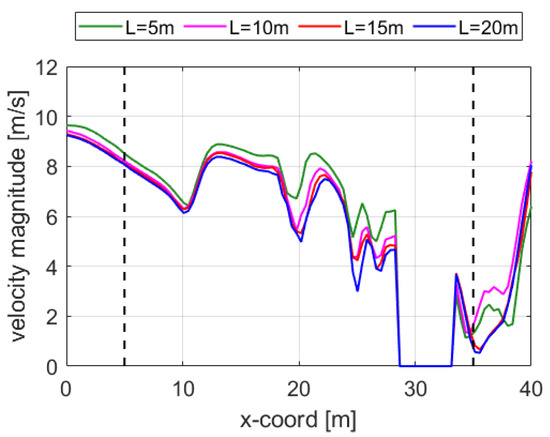
Figure 5.
Velocity profiles along line 3 for different L values. The portion of the velocity profile between the black dashed lines is inside the platform.
Figure 3 highlights that the logarithmic velocity profile that impacts the platform is consistent in all the simulations, and that there is a progressive increase in the mean velocity as L decreases. In fact, the further the inlet BC is imposed, the more similar the velocity profiles that impact the platform are, as suggested by the blue and magenta curves that correspond to the L = 15 m and L = 20 m domains, respectively. Since line 1 is adjacent to the platform, in relation to the heights 10 m (deck floor) and 15 m (deck ceiling), there is evidence of velocity discontinuities due to the no-slip condition imposed at the walls. Figure 4 and Figure 5 show the velocity profiles along line 2 and 3, respectively. These two lines pass across the platform; hence, some velocity discontinuities are expected in relation to the crossed obstacles. As for line 1, the trends show the same behavior; the farther the box boundaries (i.e., the higher the L), the closer the velocity profiles. Since the velocity profile obtained in the domain with L = 20 m seems to be qualitatively similar to the one obtained with L = 15 m, no further relevant changes were expected by increasing L. This result is confirmed by the relative percentage errors of the mean velocity shown in Table 2. The mean velocity percentage errors on the three probe lines are evaluated for the cases with L = 5-10-15 m, with respect to the case with L = 20 m.

Table 2.
Percentage mean velocity differences on probe lines 1, 2 and 3 obtained in the simulations with external box length of L = 5-10-15 m, with respect to the L = 20 m box.
It can be concluded that the domain with L = 15 m is sufficient to obtain a fully developed velocity profile that impacts the platform, since the relative percentage error is below 1.9% for all the probe lines. This choice allows a strong reduction in the domain size, and consequently in the computational effort, for the wind simulation, as confirmed by the following practical considerations. Using the criteria listed at the beginning of the paragraph, the resulting domain should have been the following:
- (5H + Lx + 15H)·(5H + Lz + 15H)·6H = 468,000 m3,
While with the criteria proposed here, the resulting computational domain volume is as follows:
- (3H + Lx + 3H)·(3H + Lz + 3H)·(10 + H + 3H) = 90,000 m3.
A volume reduction of ~80% is obtained. Furthermore, this domain is used only for the wind simulation, while the dispersion is assessed in the smallest possible domain, the platform itself (highlighted in Figure 2, in which volume is L·xLz·H = 3000 m3). Once the wind field is simulated in the box that contains the platform, the three velocity component profiles on the platform faces exposed to S and E, highlighted in light grey in Figure 2, are extrapolated to be used as boundary conditions in the dispersion simulations (see Section 2.2.1). In general, this method allows us to simulate several dispersion scenarios characterized by a different release position and/or direction but with the same wind conditions, considering only the platform as the computational domain, and thus saving computational time.
For the purposes of the sensitivity analysis proposed in this work, the release position and direction, as well as the wind direction, are fixed, while the wind intensity is varied. The wind velocity profiles related to Uref = 2-4-6-8 m/s are simulated in the L = 15 m domain.
2.2. Wind Sensitivity Analysis
2.2.1. CFD Model Overview: SBAM
The model used to perform the simulations, SBAM, is thoroughly described in [32] and its predictive capabilities are studied in [33]. If a gas is released at high pressure (10 bar or more), an under-expanded jet arises [52] with the formation of a normal shock, known as the Mach disk. This phenomenon occurs in a small region, near the release point, where the flow is compressible (Ma > 0.3) [53]. Moving away from the release point, the gas velocity becomes subsonic (Ma < 0.3), the flow can be assumed as incompressible, and gas dispersion occurs in the remaining and largest part of the domain (e.g., a platform). Consequently, the splitting of the phenomenon into a supersonic and compressible discontinuous flow (the release) and a subsonic, incompressible and smooth flow (the dispersion) is convenient for modelling purposes.
SBAM consists of simulating the release in a small domain and the source box (SB), which is dimensioned and modeled to contain all the compressibility effects and to capture the discontinuities in the Mach disk region, whilst guaranteeing a subsonic flow condition at its outlet boundaries. The results of this simulation in terms of velocity and hazardous gas mass fraction profiles on the outer faces of the SB represent the interface with the dispersion simulation, as they are some of its boundary conditions, whilst no turbulence parameter is involved in this coupling between the two simulations. Since the compressible phenomena are exhausted in the SB, the incompressible flow condition can be assumed in this last simulation.
This approach allows for relevant computational cost savings, especially in the case when several dispersion scenarios must be simulated, for example for QRA purposes. In fact, the same SB results can be used for many dispersion simulations that vary the release position and direction in the domain. In addition, if a set of relevant SBs characterized by different release pressures, release diameters, etc. are pre-calculated and the results are stored in a library, only the dispersion phase must be calculated case by case. This can lead to an increase in the speed of the analysis since the dispersion simulation is simpler and cheaper than the SB simulation. In the following sections, an overview of the numerical implementation is presented, since the methodology resembles the one used in [32,33]. However, additional details are provided in Appendix A.
SBAM: Source Box Simulation Setup
The SB is dimensioned following the procedure explained in [32] and using the parameters presented in the case study description; hence, the resulting characteristic length of the SB of this case study is LSB = 1.38 m.
Since the analysis is carried out in the framework of a platform, an obstacle is placed right in front of the release point inside the SB to account for and represent the real congested layout. In fact, it is highly probable that the gas jet after an accidental release impacts the multiple pipeline connections that exist on the platform, before dispersing through the larger bodies. In this case, a cylinder with a diameter of 30 cm is located at a distance of 45 cm from the release point. According to [32], the SB geometry is reduced to a fourth of its size due to symmetry exploitations, and an unstructured tetrahedral mesh that consists of ~4.5 × 10⁵ elements is generated, with a varying size from 1.75 mm, near the Mach disk region, to 4 cm at the outlet regions.
The simulation is performed in a steady state. The mixture CH4-H2S-air is loaded in the Fluent setup and the “Species Transport” model without chemical reactions is used. A pressure inlet of 50 bar, a CH4 mole fraction equal to 0.99 and a H2S mole fraction equal to 0.01 are imposed at the domain inlet to achieve the chosen pressure and simulate a sour gas release. The ideal gas law is solved to account for the strong density variations expected in the Ma > 0.3 regions. A pressure outlet set at the atmospheric pressure is imposed on all the external SB surfaces to reproduce the open surrounding environment. A wall with no-slip condition is imposed at the obstacle surface. More details about the governing equations and mesh features are available in Appendix A and Table A1 and Table A2.
SBAM: Dispersion Simulation Setup
The simulation domain is shown in Figure 1 and the external box is not considered in this simulation. The roof and the floor of the deck are plated walls, typical of gas extraction platforms, in order to limit the damage areas involved in an accidental scenario following a leakage.
The dispersion simulation is performed in a steady state, since the analyzed case studies involve a continuous release with a fixed mass flow rate and wind direction, and the final purpose is the estimation of the dangerous volumes and areas in their final configurations. In fact, SBAM is targeted to obtain QRA related results, guaranteeing higher accuracy with respect to the widely used empirical methods, and a computational effort reduction with respect to a standard CFD approach. In addition, in view of CFD-QRA integration, a transient simulation will lead to high computational costs. An unstructured tetrahedral mesh is generated with a total number of ~6.7 × 10⁶ elements, with face refinements at the source location and obstacle faces.
The inlet boundary conditions are imposed on the platform faces exposed to S-E (Figure 1), where a velocity inlet is imposed to reproduce the wind velocity by loading the profiles extrapolated from the previous wind simulations, taken with the different velocity values Uref = 2-4-6-8-10 m/s. On the faces exposed to N-W, a pressure outlet is used to impose an atmospheric pressure. In fact, as the lateral faces of the deck are open, the gas cloud can escape the domain. The deck floor and ceiling and all the obstacles inside the deck are modelled as walls with no-slip conditions. The results of the SB simulation are used as boundary conditions of the dispersion simulation and a box with the same dimensions as the SB is created in the domain in the release position, where CH4 m.f. (mass fraction), H2S m.f. and velocity profiles are imposed. More details about the governing equations and mesh features are available in Appendix A and Table A1 and Table A2.
3. Results and Discussion
3.1. Source Box Results
In Figure 6, the 3D visualization of the jet simulated in the SB is depicted, and some geometrical features of the SB can be observed, including the release hole, the SB shape shown in light grey (a cube with length LSB) and the cylindrical obstacle. The figure shows also that the jet has a supersonic core near the release point (red barrel structure) and rapidly slows down, also because of the interaction with the obstacle.
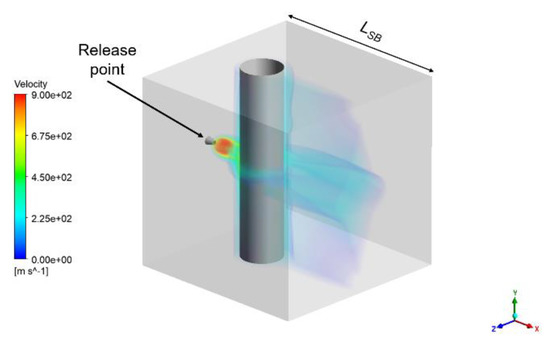
Figure 6.
The 3D visualization of the jet flow velocity in the SB. SB shapes are depicted in light grey and the release point and SB obstacle are depicted in dark grey.
The under-expanded jet structure is widely described from a theoretical point of view [52]; therefore, it is important to check if the simulation results are in good agreement with the theory. In Figure 7, a velocity contour plot on the SB middle-section clearly shows the presence of the Mach disk; in fact, a normal shock is represented by a discontinuity of the velocity that decreases from 1000 m/s to 10 m/s for a few cm (considering that the release hole diameter is 3 cm). In addition to these qualitative considerations, in Table 3, the Mach disk position obtained in the CFD simulation is compared with the theoretical simulation given by [52].
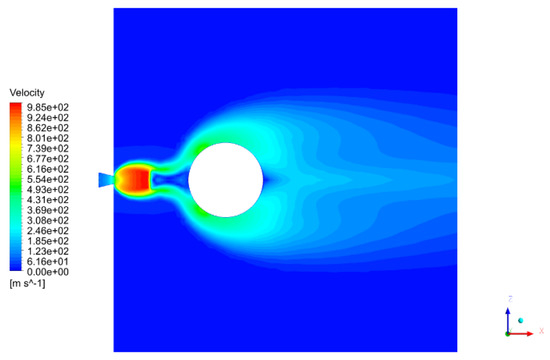
Figure 7.
Velocity contour plot on the SB middle plane transversal to the obstacle.

Table 3.
Theoretical vs. CFD Mach disk position.
A relative error smaller than 5% hints that the solution effectively reproduces the Mach disk position. All these considerations are useful to confirm the physical consistency of the solution. The CH4 mass fraction profiles, H2S mass fraction profiles and the velocity profiles (for the sake of brevity, the velocity magnitude profiles are shown instead of the three components) on the SB faces (Figure 8, Figure 9 and Figure 10) are extrapolated and used as boundary conditions in the dispersion simulation. The contours show how the flow remains around the cylinder due to the Coanda effect and a larger jet splits on the SB midplane, due to its higher momentum on the jet axis. The SB simulation time is about 24 h on a Dell Tower 7810 with an Intel Xeon e5-2630 v3 CPU with a 2.4 GHz core frequency (8 cores; 16 threads), a 64 GB RAM and a 1 TB HDD.
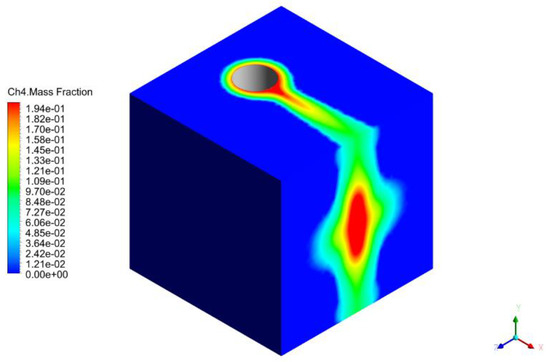
Figure 8.
CH4 m.f. contour plot on the SB faces.
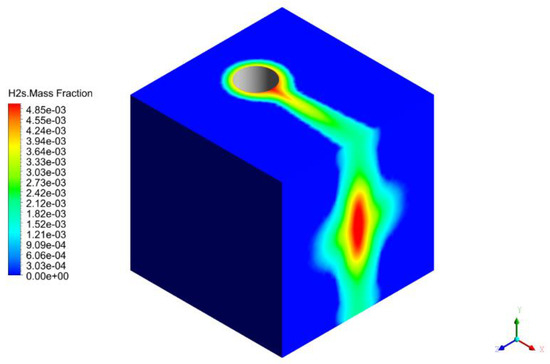
Figure 9.
H2S m.f. contour plot on the SB faces.
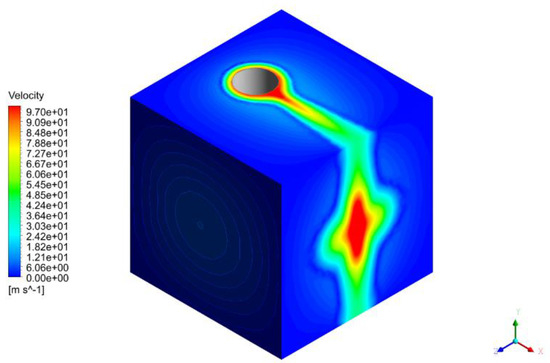
Figure 10.
Velocity magnitude contour plot on the SB faces.
3.2. Dispersion Results
The results of the five dispersion simulations taken with the different Uref are analyzed in terms of relevant quantities from a safety point of view. The flammability of the mixture represents a possible source of danger for people and damage to equipment integrity due to the possible ignition and consequent jet fire, flash fire or explosion. The high level of toxicity of H2S represents one of the most relevant sources of harm for workers’ health. The risks for people and the environment are two of the main outcomes of a QRA, and, for this purpose, an accurate reproduction of the associated consequences is crucial.
The irreversible injuries and high lethality areas for flammability and toxicity are defined according to the current regulations [54]. In Figure 11, the irreversible injury area for flammability (mixture concentration: 0.5 LFL) is represented in yellow and the high lethality area (flammable area) is represented in red. Both the areas are considered on a platform section at a height equal to 1.5 m, which is of interest, as it represents the average height at which human targets can be found.
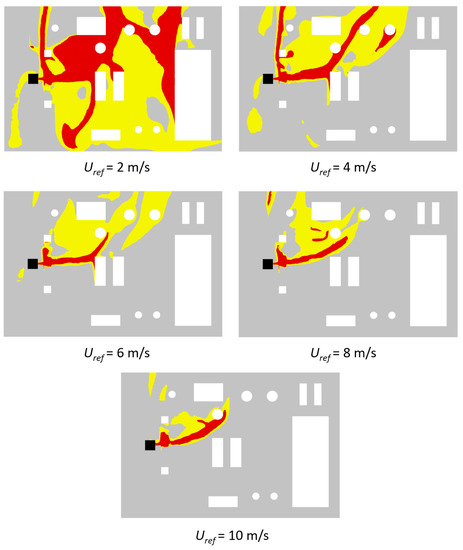
Figure 11.
Contour plots on a platform section at height 1.5 m: area with mixture concentration above 0.5 LFL in yellow and flammable areas in red.
The zones shape changes according to the wind intensity; the larger the Uref, the more the damage area shape resembles a plume with a concordant direction to the wind direction. In the case with Uref = 2 m/s, the influence of wind seems to be overcome by the jet inertia, since the development of the damage areas seems to be not affected by the wind direction. It must be also pointed out that the contour plane is 1 m under the release height and the gas dispersion is highly influenced by the interaction with the obstacles at that height. In fact, the lower the wind intensity, the higher the effect of the gas impingement on the objects. In particular, in the case with Uref = 2 m/s, the flammable area has a “branch” in the bottom left corner, which is caused by gas reflection on an obstacle at the center of the platform. An analogous situation can be observed for Uref = 4 m/s, where the yellow region spreads in the counterwind direction, while only a wind speed larger than or equal to 6 m/s seems to be able to relevantly influence the cloud shape. In fact, as Uref increases, the wind inertia becomes strong enough to severely affect the gas cloud development. A similar analysis can be carried out by looking at the toxicity consequence areas; the irreversible injuries areas (H2S concentration IDLH) in yellow and high lethality areas (H2S concentration LC50) in red, both taken at the same section, are shown in Figure 12. Due to the very low IDLH threshold level, as expected, the irreversible injuries areas due to toxicity are larger than the ones related to flammability. For all the considered wind velocities, a large portion of the platform is occupied by a cloud that is toxic for humans. On the contrary, the high lethality areas related to toxicity are smaller than the flammable ones for all the considered wind velocities. The LC50 area is very small due to the very low value of H2S percentage in the released mixture, which soon mixes with the surrounding air, reaching a dilution level below the LC50. The high lethality area due to flammability is more relevant than the one related to toxicity, as both gases are flammable, but only the H2S is toxic and its percentage in the mixture is very low. Despite this, its toxicity level is so high that the situation is reversed for the irreversible injuries area due to the extremely low value of the IDLH. To gain an insight into the 3D distribution of the cloud, the irreversible injuries volumes related to flammability and toxicity for the case with Uref = 10 m/s are reported in Figure 13 and Figure 14, respectively.
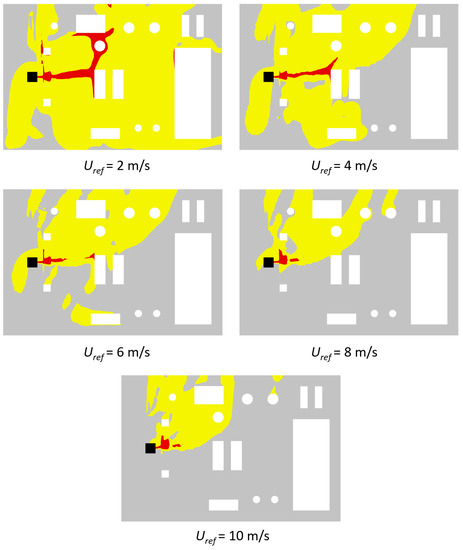
Figure 12.
Contour plots on a platform section at height 1.5 m: IDLH area in yellow and LC50 areas in red.
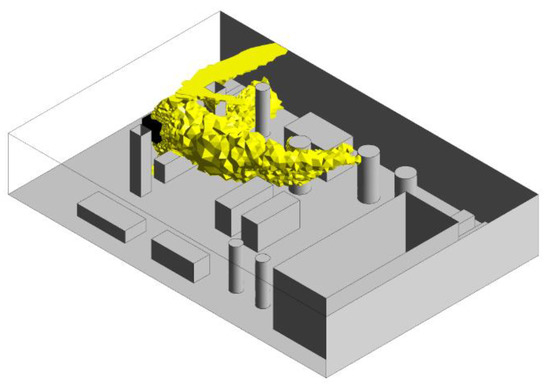
Figure 13.
The 0.5LFL volume for Uref = 10 m/s. The emitting cube is shown in black.
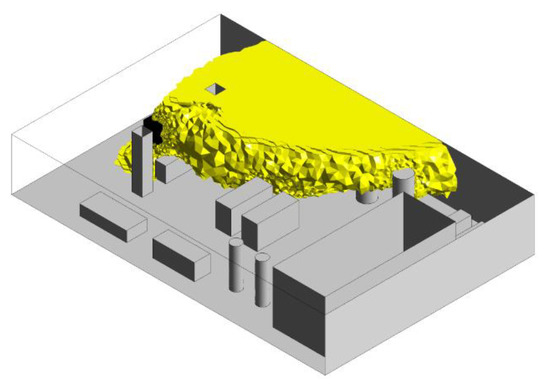
Figure 14.
IDLH volume for Uref = 10 m/s. The emitting cube is shown in black.
This comparison confirms the previous considerations about the 2D distributions on the platform section at a height of 1.5 m. Despite the fact that only the Uref = 10 m/s case is shown, the difference in the two volumes is representative of all the other cases, no matter if the wind influence is less relevant. To better analyze the scenarios, Table 4 shows some useful parameters, including the flammable volume Vflam, the volume related to 0.5LFL V05LFL, the toxic volume related to LC50 VLC50, the toxic volume related to IDLH VIDLH, and their percentage ratios with respect to the total domain volume, including Σflam, Σ05LFL, ΣIDLH and ΣLC50, respectively.

Table 4.
Risk-oriented quantities obtained in the 5 dispersion simulations.
The values in the table confirm the qualitative results shown in the contour and volume plots (Figure 11, Figure 12, Figure 13 and Figure 14); toxicity is the most relevant parameter for the irreversible injuries areas as much as flammability is for the high lethality areas. In particular, in the worst case, the 2 m/s case, VIDLH occupies almost 76% of the platform, while V05LFL reaches a value of about 65% of the total volume. This trend is confirmed in all the cases no matter the wind intensity, as VIDLH > V05LFL is always verified. Concerning the high lethality regions, VLC50 occupies almost 7% of the platform, while Vflam occupies about 30%. This difference is relevant, but it must be considered that, even if the released mixture is composed of only 1% of H2S, i.e., only 1% of the mixture has toxic properties, its effect on the damage areas is substantial. As expected, the higher the wind velocity, the lower the consequence volumes. The wind contributes to the dilution of the volumes, and consequently helps the flammable/toxic cloud to escape from the platform. To better understand the wind influence on the volumes, Figure 15 and Figure 16 can be observed.
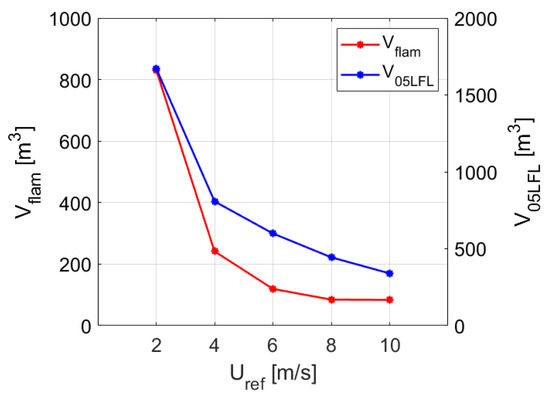
Figure 15.
Vflam and V05LFL as a function of Uref.
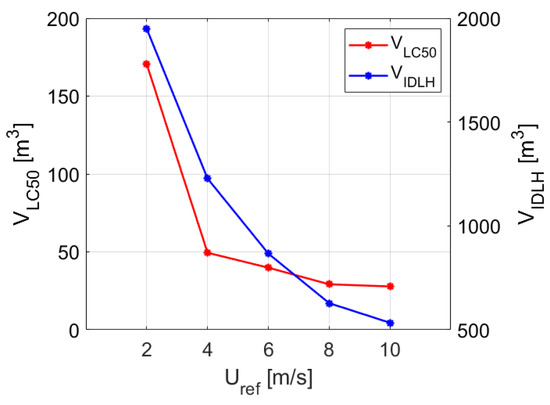
Figure 16.
VIDLH and VLC50 as a function of Uref.
It is interesting to notice that above a certain wind velocity, a saturation effect appears in all the graphs. The flammable volumes (Figure 15) demonstrate similar behavior as a function of the wind, and after a strong decrease from Uref = 2 m/s to Uref = 4 m/s, the value is stabilized. Looking at Figure 16, VLC50 also shows a sharp decrease between Uref = 2 m/s and Uref = 4 m/s and then shows stabilization, while VIDLH seems to not display a similar saturation effect and its decrease is still relevant, dropping from Uref = 4 m/s to Uref = 10 m/s. This is not surprising; in fact, in absolute terms, VIDLH assumes such large values because of its low threshold level (100 ppm) and this suggests that it is difficult to achieve sufficient dilution inside the platform to make the concentration decrease under that value. It must be pointed out that the reported values are related to the platform domain; in fact, the volumes outside the platform are not of interest for the analysis. In addition, it should be underlined that the damages related to the toxicity are only related to the toxic cloud, while on the other hand, the damage areas related to the flammability can be larger than the flammable cloud, as in cases of ignition, a flash fire or a VCE (vapor cloud explosion) can develop. In the last case, the damages caused by the VCE depend on the explosion blast wave and the lethal effects are not contained in the previously identified damage areas. In any case, it is worth noting that a small amount of H2S can lead to significant damage. Although CH4 and H2S are largely lighter and heavier than air, respectively, no stratification phenomena are observed in the domain. This can be explained by considering that in these scenarios, the inertia of the jet and of the wind are dominant; hence, the flow is merely convective and the diffusion effects are overwhelmed.
4. Conclusions
In this paper, a method to reproduce a wind field to be used in several gas dispersion simulations is presented and is used to perform a wind sensitivity analysis of a high-pressure sour gas release on an offshore platform.
The wind field is obtained by simulating the air flow around the platform, considering a sufficiently large external box. The latter is dimensioned, assuring that a fully developed wind velocity profile impacts the platform. The results show that the external box sides must be at a distance from the platform boundaries that is equal to 3 times the platform height. This methodology allows computational cost savings for the following reasons:
- A new criterion for the dimensioning of the wind simulation domain is defined; the volume is reduced by ~80% with respect to the state-of-the-art methodologies.
- The gas dispersion can be simulated in a smaller domain (in this case, in the platform) and not in a larger external box.
- Once the wind field is available, the results can be used to simulate several dispersion simulations.
Moreover, the wind fields related to the wind speeds equal to 2-4-6-8-10 m/s are calculated and used in the dispersion simulations, realized through SBAM, to assess their influence on the flammable and toxic consequences.
The case studies are characterized by a release of sour gas (99% CH4-1% H2S) at 50 bar from a circular hole with a diameter of 3 cm. The results show that, despite the very low amount of H2S released, the threat zones related to toxicity are relevant. In particular, the irreversible injuries areas related to toxicity are larger than the flammability areas, because of the very low IDLH of the H2S (100 ppm).
The dangerous zones and toxicity and flammability areas are strongly influenced by the wind intensity. In fact, as the wind increases, the dilution is enhanced, and the dangerous volumes decrease. Nonetheless, after a certain value of wind speed, the dangerous volume variation is less accentuated, and saturation effect appears, except for the IDLH volume.
Wind intensity is a crucial parameter for the assessment of the consequences of the accidental release of hazardous gases, as it largely affects the damage areas, especially in cases of low wind conditions.
Indeed, before taking decisions and defining additional preventive/protection measures, a careful analysis must be performed, considering both the obtained results and other interesting parameters, e.g., the type of equipment involved in the dangerous volumes, the distribution of the workers (people) inside the platform, etc.
The methodology shows that it is possible to save computational effort when performing these kinds of analyses, which are likely to be included in a QRA. In fact, threat areas and volumes obtained through these kinds of simulations can serve as input parameters for event tree analysis (ETA) in order to obtain a risk estimation [55]. Other useful insights can be gained by the results obtained from a contingency planning point of view, since safer areas on the platform could be identified, as well as preferable escape routes on the plant perimeter.
Author Contributions
A.M.: Conceptualization, Methodology, Software, Formal analysis, Investigation, Data curation, Writing—original draft, Writing—review and editing; Visualization. G.L.: Conceptualization, Methodology, Software, Investigation; Writing—review and editing. R.G.: Conceptualization, Methodology, Investigation, Writing—review and editing; Supervision. A.C.U.: Conceptualization, Methodology; Writing—review and editing. A.C.: Conceptualization, Resources, Writing—review and editing, Supervision, Project administration; Funding acquisition. All authors have read and agreed to the published version of the manuscript.
Funding
This research received no external funding.
Institutional Review Board Statement
Not applicable.
Informed Consent Statement
Not applicable.
Data Availability Statement
Not applicable.
Acknowledgments
The research presented in this paper has been sponsored by the Italian Ministry of Economic Development’s Directorate General for Infrastructures and Energy Systems and Geo-Mining Safety.
Conflicts of Interest
The authors declare no conflict of interest.
Appendix A
In this appendix, the governing equations and the numerical methods employed in SBAM are summarized and the main features of the mesh used for the SB and dispersion simulations are described. As a turbulent flow is involved, the Reynolds averaged formulation of the equations is presented. The quantities are divided into the mean and fluctuating components. For example, the velocity components are written as , where i = 1, 2, 3 denotes the Cartesian coordinates. In the following equations, the overbar is dropped from the mean for graphical purposes.
Appendix A.1. Governing Equations
Appendix A.1.1. Mass Conservation Equation
Appendix A.1.2. Momentum Conservation Equation
Appendix A.1.3. Turbulence Model Equations
In both the SB and the dispersion simulations, a RANS formulation of the momentum conservation equations is solved. In particular, the SST - and the standard - are employed in the SB and dispersion simulation as turbulence models, respectively. In the following section, the transport equations for the turbulent kinetic energy and the specific dissipation rate [48] are presented.
where i and j denote the Cartesian components, and are generation terms due to mean velocity gradients, and are diffusivity coefficients and are dissipation terms. The SST - model employs the same equations, except for an addendum in the right-hand side of the second equation, , which represents the cross-diffusion term [56,57].
Appendix A.1.4. Species Transport Equation
The species interaction is modeled through a convection–diffusion equation for each species i, to evaluate the mass fraction .
where is the rate of production due to chemical reactions, is a source term and is the mass diffusion term, evaluated through the formulation for turbulent flows. and are the mass and thermal diffusion coefficient, respectively, and is the turbulent Schmidt number set equal to 0.7 [48].
Appendix A.1.5. Energy Equation
The following energy equation is solved:
where is the energy, is the effective conductivity, is a source term and is the deviatoric stress tensor.
where is the effective viscosity [48].
Appendix A.1.6. Numerical Methods
A coupled pressure–velocity algorithm and a second-order upwind discretization scheme are employed. A pseudo-transient formulation of the equations is chosen to guarantee higher stability of the solution by exploiting under-relaxation factors and to help the convergence solution, which is judged considering the residuals and two monitored quantities as the velocity and gas species mass fractions at the outlet boundaries [48].
Appendix A.2. Grid Features
A grid independence study was performed for both the SB and the dispersion simulation, adopting the Grid Convergence Index (GCI) methodology for unstructured meshes [58]. The GCI gives a measure of the percentage distance of the computed solution to the asymptotic numerical value. This methodology requires the generation of three different meshes, a fine mesh (mesh 1), a medium mesh (mesh 2) and a coarser mesh (mesh 3).
For the SB simulations, the three meshes consist of ∼4.5 × 10⁵, ∼2 × 10⁵ and ∼1 × 10⁵ elements and the quantities for the GCI estimation are the average velocity, H2S mass fraction and CH4 mass fraction at the outlet. The GCIs related to the finest mesh (GCI12) and to the medium mesh (GCI23) are then estimated. Moreover, it is checked that the solution is in the asymptotic range by solving the following expression:
where is the effective mesh refinement factor and the formal order of accuracy of the algorithm. The results related to the SB simulation are summarized in the following table.

Table A1.
Grid Convergence Index values for the SB simulation.
Table A1.
Grid Convergence Index values for the SB simulation.
| Average Velocity | CH4 Mass Fraction | H2S Mass Fraction | |
|---|---|---|---|
| GCI12 | 0.0205 | 0.0003 | 0.0003 |
| GCI23 | 0.0783 | 0.0090 | 0.0090 |
| 1.05 | 0.99 | 0.99 |
At first, it can be noted that the condition for the asymptotic range is satisfied for all quantities; therefore, we can deduce that the solution is well converged. Mesh 1 is considered to be accurate enough for the calculations, since its error (GCI12) is lower than 0.0205.
The same procedure is applied to the dispersion case, where the three meshes considered consist of ~6.7 × 10⁶, ~3.2 × 10⁶, ~1.3 × 10⁶ elements and the considered quantities for the GCI calculations are the average velocity at the outlet and the flammable and toxic volumes. The results are summarized in the following table.

Table A2.
Grid Convergence Index for the dispersion simulation.
Table A2.
Grid Convergence Index for the dispersion simulation.
| Average Velocity | Flammable Vol. | Toxic Vol. | |
|---|---|---|---|
| GCI12 | 0.0104 | 0.0160 | 10−5 |
| GCI23 | 0.0217 | 0.0348 | 1.5 × 10⁻⁴ |
| 1.01 | 1.01 | 1.00 |
The condition for the asymptotic range is satisfied for all quantities; therefore, we can deduce that the solution is well converged. Mesh 1 is considered to be accurate enough for the calculations, since its error (GCI12) is lower than 0.016.
References
- Sales, J.; Mushtaq, F.; Christou, M.D.; Nomen, R. Study of major accidents involving chemical reactive substances: Analysis and lessons learned. Process Saf. Environ. Prot. 2007, 85, 117–124. [Google Scholar] [CrossRef]
- Khan, F.I.; Abbasi, S.A. Major accidents in process industries and an analysis of causes and consequences. J. Loss Prev. Process Ind. 1999, 12, 361–378. [Google Scholar] [CrossRef]
- Paté-Cornell, M.E. Risk analysis and risk management for offshore platforms: Lessons from the Piper Alpha accident. J. Offshore Mech. Arct. Eng. 1993, 115, 179–190. [Google Scholar] [CrossRef]
- Necci, A.; Tarantola, S.; Vamanu, B.; Krausmann, E.; Ponte, L. Lessons learned from offshore oil and gas incidents in the Arctic and other ice-prone seas. Ocean Eng. 2019, 185, 12–26. [Google Scholar] [CrossRef]
- Bagheri, M.; Alamdari, A.; Davoudi, M. Quantitative risk assessment of sour gas transmission pipelines using CFD. J. Nat. Gas Sci. Eng. 2016, 31, 108–118. [Google Scholar] [CrossRef]
- Rubright, S.L.M.; Pearce, L.L.; Peterson, J. Environmental toxicology of hydrogen sulfide. Nitric Oxide-Biol. Chem. 2017, 71, 1–13. [Google Scholar] [CrossRef]
- Worden, R.H.; Smalley, P.C.; Barclay, S.A. H2S and diagenetic pyrite in North Sea sandstones: Due to TSR or organic sulphur compound cracking? J. Geochem. Explor. 2003, 78–79, 487–491. [Google Scholar] [CrossRef]
- Zempolich, W.; Negri, A.; Leo, C.; van Ojik, K.; Verdel, A. The Kashagan Discovery: An Example of the Successful Use of a Multidisciplined Approach in Reducing Geologic Risk. Am. Assoc. Pet. Geol. Bull. 2002, 86, 1–2. [Google Scholar] [CrossRef]
- Warner, J.L.; Baskin, D.K.; Hwang, R.J.; Carlson, R.M.K.; Clark, M.E. Geochemical Evidence for Two Stages of Hydrocarbon Emplacement and the Origin of Solid Bitumen in the Giant Tengiz Field, Kazakhstan. In Oil and Gas of the Greater Caspian Area 55; American Association of Petroleum Geologists: Tulsa, OK, USA, 2007. [Google Scholar] [CrossRef]
- Liu, W.; Tenger; Bo, G.; Zhang, Z.; Zhang, J.; Zhang, D.; Fan, M.; Fu, X.; Zheng, L.; Liu, Q. H2S formation and enrichment mechanisms in medium to large scale natural gas fields (reservoirs) in the Sichuan Basin. Pet. Explor. Dev. 2010, 37, 513–522. [Google Scholar] [CrossRef]
- Mi, J.; Zhang, B.; Shen, Z.; Huang, W.; Casalins, A.; Liu, C. The experimental study on H2S generation during thermal recovery process for heavy oil from the Eastern Venezuela Basin. J. Nat. Gas Geosci. 2017, 2, 201–208. [Google Scholar] [CrossRef]
- Li, D.P.; Zhang, L.; Yang, J.W.; Lu, M.X.; Ding, J.H.; Liu, M.L. Effect of H2S concentration on the corrosion behavior of pipeline steel under the coexistence of H2S and CO2. Int. J. Miner. Metall. Mater. 2014, 21, 388–394. [Google Scholar] [CrossRef]
- Layfon, D.W.; Cederwall, R.T. Predicting and Managing the Health Risks of Sour-Gas Wells. JAPCA 1987, 37, 1185–1190. [Google Scholar] [CrossRef]
- OSHA. Hydrogen Sulfide. 2021. Available online: https://www.osha.gov/sites/default/files/publications/hydrogen_sulfide_fact.pdf (accessed on 11 July 2021).
- Zhang, P.; Luo, Q.; Wang, R.; Xu, J. Hydrogen sulfide toxicity inhibits primary root growth through the ROS-NO pathway. Sci. Rep. 2017, 7, 868. [Google Scholar] [CrossRef] [PubMed]
- Torrans, E.L.; Clemens, H.P. Physiological and biochemical effects of acute exposure of fish to hydrogen sulfide. Comp. Biochem. Physiol. Part C Comp. 1982, 71, 183–190. [Google Scholar] [CrossRef] [PubMed]
- Chen, C.J.; Rodi, W. Vertical turbulent buoyant jets: A review of experimental data. NASA Sti/Recon Tech. Rep. A 1980, 80, 23073. [Google Scholar]
- Davidson, G.A. Simultaneous trajectory and dilution predictions from a simple integral plume model. Atmos. Environ. 1989, 23, 341–349. [Google Scholar] [CrossRef]
- The Netherlands Organization of Applied Scientific Research. Methods for the Calculation of Physical Effects (Yellow Book); Publication Series on Dangerous Substances; Ministerie van Verkeer en Waterstaat: Hague, The Netherlands, 2005; p. 870.
- Zamejc, E. API Standard 521 new alternative method to evaluate fire relief for pressure relief device sizing and depressuring system design. J. Loss Prev. Process Ind. 2014, 27, 21–31. [Google Scholar] [CrossRef]
- Qingchun, M.; Laibin, Z. CFD simulation study on gas dispersion for risk assessment: A case study of sour gas well blowout. Saf. Sci. 2011, 49, 1289–1295. [Google Scholar] [CrossRef]
- Zhang, B.; Chen, G.M. Quantitative risk analysis of toxic gas release caused poisoning—A CFD and dose-response model combined approach. Process Saf. Environ. Prot. 2010, 88, 253–262. [Google Scholar] [CrossRef]
- Venetsanos, A.G.; Baraldi, D.; Adams, P.; Heggem, P.S.; Wilkening, H. CFD modelling of hydrogen release, dispersion and combustion for automotive scenarios. J. Loss Prev. Process Ind. 2008, 21, 162–184. [Google Scholar] [CrossRef]
- Choi, J.; Hur, N.; Kang, S.; Lee, E.D.; Lee, K.B. A CFD simulation of hydrogen dispersion for the hydrogen leakage from a fuel cell vehicle in an underground parking garage. Int. J. Hydrogen Energy 2013, 38, 8084–8091. [Google Scholar] [CrossRef]
- Liu, X.; Godbole, A.; Lu, C.; Michal, G.; Venton, P. Source strength and dispersion of CO2 releases from high-pressure pipelines: CFD model using real gas equation of state. Appl. Energy 2014, 126, 56–68. [Google Scholar] [CrossRef]
- Liu, X.; Godbole, A.; Lu, C.; Michal, G.; Venton, P. Study of the consequences of CO2 released from high-pressure pipelines. Atmos. Environ. 2015, 116, 51–64. [Google Scholar] [CrossRef]
- Deng, Y.; Hu, H.; Yu, B.; Sun, D.; Hou, L.; Liang, Y. A method for simulating the release of natural gas from the rupture of high-pressure pipelines in any terrain. J. Hazard. Mater. 2018, 342, 418–428. [Google Scholar] [CrossRef]
- Colombini, C.; Maugeri, G.; Zanon, G.; Rota, R.; Busini, V. Unignited high-pressure methane jet impinging a pipe rack: Practical tools for risk assessment. J. Loss Prev. Process Ind. 2021, 69, 104378. [Google Scholar] [CrossRef]
- Colombini, C.; Carminati, E.; Parisi, A.; Rota, R.; Busini, V. Safety evaluations on unignited high-pressure methane jets impacting a spherical obstacle. J. Loss Prev. Process Ind. 2022, 74, 104631. [Google Scholar] [CrossRef]
- Colombini, C.; Iannantuoni, C.; Rota, R.; Busini, V. Unignited high-pressure methane jet impacting a cylindrical obstacle: An assessment tool for consequences analysis. J. Loss Prev. Process Ind. 2022, 76, 104593. [Google Scholar] [CrossRef]
- Carpignano, A.; Corti, T.; Uggenti, A.C.; Gerboni, R. Modelling of a supersonic accidental release in Oil&Gas offshore: Characterisation of a source box. Geoing. Ambient. Min. 2017, 152, 58–64. [Google Scholar]
- Moscatello, A.; Uggenti, A.C.; Gerboni, R.; Carpignano, A. A novel approach to high-pressure gas releases simulations. J. Loss Prev. Process Ind. 2021, 72, 104531. [Google Scholar] [CrossRef]
- Moscatello, A.; Gerboni, R.; Ledda, G.; Uggenti, A.C.; Piselli, A.; Carpignano, A. CFD gas release model performance evaluation through wind tunnel experiments. J. Loss Prev. Process Ind. 2021, 75, 104715. [Google Scholar] [CrossRef]
- Pappalardo, F.; Moscatello, A.; Ledda, G.; Uggenti, A.C.; Gerboni, R.; Carpignano, A.; di Maio, F.; Mereu, R.; Zio, E. Quantification of Uncertainty in CFD Simulation of Accidental Gas Release for O & G Quantitative Risk Assessment. Energies 2021, 14, 8117. [Google Scholar]
- Lines, I.G.; Deaves, D.M.; Atkins, W.S. Practical modelling of gas dispersion in low wind speed conditions, for application in risk assessment. J. Hazard. Mater. 1997, 54, 201–226. [Google Scholar] [CrossRef]
- Barros, P.L.; Luiz, A.M.; Nascimento, C.A.; Neto, A.T.P.; Alves, J.J.N. On the non-monotonic wind influence on flammable gas cloud from CFD simulations for hazardous area classification. J. Loss Prev. Process Ind. 2020, 68, 104278. [Google Scholar] [CrossRef]
- Zhang, B.; Chen, G.M. Hydrogen sulfide dispersion consequences analysis in different wind speeds: A CFD based approach. In Proceedings of the 2009 International Conference on Energy and Environment Technology (ICEET 2009), Guilin, China, 16–18 October 2009; Volume 3, pp. 365–368. [Google Scholar] [CrossRef]
- Liao, N.; Huang, K.; Chen, L.; Wang, Z.; Wu, J.; Zhang, F. Numerical simulation of gas dispersion during cold venting of natural gas pipelines. Adv. Mech. Eng. 2018, 10, 1687814018755244. [Google Scholar] [CrossRef]
- Nascimento, C.A.; Luiz, A.M.; Barros, P.L.; Neto, A.T.; Alves, J.J. A CFD-based empirical model for hazardous area extent prediction including wind effects. J. Loss Prev. Process Ind. 2021, 71, 104497. [Google Scholar] [CrossRef]
- Vivalda, C.; Gerboni, R.; Carpignano, A. A practical approach to risk-based gas monitoring system design for oil and gas offshore platforms. In Proceedings of the PSAM 14—Probabilistic Safety Assessment and Management, Los Angeles, CA, USA, 16–21 September 2018. [Google Scholar]
- NIOSH. Documentation for Immediately Dangerous to Life or Health Concentration. 2021. Available online: http://niosh.dnacih.com/nioshdbs/idlh/idlhintr.htm (accessed on 11 July 2021).
- OSHA. Hydrogen Sulfide Properties. 2021. Available online: https://www.osha.gov/hydrogen-sulfide/hazards (accessed on 11 July 2021).
- Zlochower, I.A.; Green, G.M. The limiting oxygen concentration and flammability limits of gases and gas mixtures. J. Loss Prev. Process Ind. 2009, 22, 499–505. [Google Scholar] [CrossRef]
- Liao, S.Y.; Cheng, Q.; Jiang, D.M.; Gao, J. Experimental study of flammability limits of natural gas-air mixture. J. Hazard. Mater. 2005, 119, 81–84. [Google Scholar] [CrossRef] [PubMed]
- Abu-Zidan, Y.; Mendis, P.; Gunawardena, T. Optimising the computational domain size in CFD simulations of tall buildings. Heliyon 2021, 7, e06723. [Google Scholar] [CrossRef]
- Revuz, J.; Hargreaves, D.M.; Owen, J.S. On the domain size for the steady-state CFD modelling of a tall building. Wind Struct. Int. J. 2012, 15, 313–329. [Google Scholar] [CrossRef]
- Blocken, B. Computational Fluid Dynamics for urban physics: Importance, scales, possibilities, limitations and ten tips and tricks towards accurate and reliable simulations. Build. Environ. 2015, 91, 219–245. [Google Scholar] [CrossRef]
- ANSYS. ANSYS Fluent User’s Guide. 2018. Available online: https://www.afs.enea.it/project/neptunius/docs/fluent/html/ug/main_pre.htm (accessed on 1 January 2020).
- Wiernga, J. Representative roughness parameters for homogeneous terrain. Bound.-Layer Meteorol. 1993, 63, 323–363. [Google Scholar] [CrossRef]
- IEC. Wind Turbines e Part 1: Design Requirements; Technical Report 61400e1 Ed.3; International Electrotechnical Commission: Geneva, Switzerland, 2005. [Google Scholar]
- Schlichting, H. Boundary-Layer Theory, 7th ed.; McGraw-Hill: New York, NY, USA, 1979; pp. 596–600. [Google Scholar]
- Franquet, E.; Perrier, V.; Gibout, S.; Bruel, P. Free underexpanded jets in a quiescent medium: A review. Prog. Aerosp. Sci. 2015, 77, 25–53. [Google Scholar] [CrossRef]
- Munson, B.R.; Okiishi, T.H.; Huebsch, W.W.; Rothmayer, A.P. Fluid Mechanics; Wiley: Singapore, 2013. [Google Scholar]
- Decreto del Presidente del Consiglio dei Ministri. Linee Guida per la Predisposizione del Piano d’Emergenza Esterna di cui all’Articolo 20, Comma 4, del Decreto Legislativo 17 Agosto 1999, n. 334e. 2005. Available online: https://www.anci.it/wp-content/uploads/linee-guida-piano-emergenza-esterna.pdf (accessed on 1 January 2020).
- Fu, S.; Yan, X.; Zhang, D.; Li, C.; Zio, E. Framework for the quantitative assessment of the risk of leakage from LNG-fueled vessels by an event tree-CFD. J. Loss Prev. Process Ind. 2016, 42, 42–52. [Google Scholar] [CrossRef]
- Menter, F. Zonal two equation kw turbulence models for aerodynamic flows. In Proceedings of the 23rd Fluid Dynamics, Plasmadynamics, and Lasers Conference, Orlando, FL, USA, 6–9 July 1993; p. 2906. [Google Scholar]
- Wilcox, D.C. Turbulence Modeling for CFD; DCW Industries: La Canada, CA, USA, 1998; p. 2. [Google Scholar]
- Roache, P.J. Perspective: A Method for Uniform Reporting of Grid Refiniment Studies. J. Fluids Eng. 1994, 116, 405–413. [Google Scholar] [CrossRef]
Publisher’s Note: MDPI stays neutral with regard to jurisdictional claims in published maps and institutional affiliations. |
© 2022 by the authors. Licensee MDPI, Basel, Switzerland. This article is an open access article distributed under the terms and conditions of the Creative Commons Attribution (CC BY) license (https://creativecommons.org/licenses/by/4.0/).