Article

How Did COVID-19 Pandemic Impact Safety Performance on a Construction Project? A Case Study Comparing Pre and Post COVID-19 Influence on Safety at an Australian Construction Site

1
School of Medical & Health Sciences, Edith Cowan University, 270 Joondalup Drive, Joondalup, WA 6027, Australia
2
Sustainable Minerals Institute Industry Safety and Health Centre, The University of Queensland, Brisbane, QLD 4072, Australia
*
Author to whom correspondence should be addressed.
Safety 2022, 8(4), 77; https://doi.org/10.3390/safety8040077
Submission received: 21 September 2022 / Revised: 7 November 2022 / Accepted: 16 November 2022 / Published: 22 November 2022
(This article belongs to the Topic Advances in Construction and Project Management)

Abstract

:
COVID-19 had a significant impact on construction projects due to labor shortages and COVID-19 restrictions, yet little is known about the impact it had on construction safety. To address this gap, an Australian construction project was selected to study the impact of COVID-19 on safety performance, safety climate and safety leadership. The study collected data from safety climate surveys, leading and lagging safety indicators and used linear regression to compare safety performance pre and post the onset of COVID-19. Our results showed after the onset of COVID-19 there was a significant reduction (Pr > F at 0.05%) in incident rate, an improvement in supervisor safety leadership and safety climate, and satisfaction with organisational communication. The study identified the increase level of safety awareness due to COVID-19 did not result in an increase in the level of engagement in safety leadership. Interestingly, participation in the safety leadership activities did not improve until a change of Project Manager occurred. The study determined leaders who establish a positive safety climate within a project could negate the safety performance impact of COVID-19. The study confirms the importance of site safety leadership in maintaining engagement in risk management and the value of focused safety communication.

1. Introduction

In early 2020 the COVID-19 pandemic caused major disruption to the global and Australian construction industry. Prior to the COVID-19 pandemic, global employment within the construction industry was 7.7% and projected to contribute up to 13.4% of the GDP [1]. High COVID-19 case numbers resulted in government orders restricting movement to reduce spread of the disease and to slow transmission [2,3,4]. In Australia, the result was a 13.9 billion AUD annual contraction in construction work and the loss of an estimated 76,500 jobs with further reductions of 7.3% predicted in 2020/2021 [5,6,7,8]. The restrictions together with construction workers contracting COVID-19 also impacted labor supply for construction projects with an average 35–40% of a projects workforce either ill or not working whilst completing isolation requirements. The industry has also experienced supply chain disruptions, increases in the cost and shortage of building materials as COVID-19 caused factory closures and port to port shipment delays [6,7]. The European International Contractors [6] predicted economic setbacks across the industry including “insolvency of stakeholders along entire supply chains”. However, the Australian Federal and State governments recognized continued investment in construction and mining sectors would buffer the Australian economy and provided stimulus to keep people working. The Federal government invested in a $1.5 billion infrastructure COVID-19 stimulus package on road and rail projects across all states [9]. Subsequently the construction, mining and resources sectors were classified as ‘essential’ industries allowing the work to continue provided mandatory COVID-19 controls were implemented.
In response, organisational COVID-19 management plans were developed to formalize compliance with Governmental mandates and internal approaches to manage the health risk to construction workers. COVID-19 management plans were developed to minimize the risk of introducing COVID-19 into the work environment and minimize spreading of the disease in the workplace. The COVID-19 management plans comprised COVID-19 policy, risk management, health factors (COVID-19 symptom monitoring, hygiene, mental wellbeing) with a heavy reliance on communication. The constant evolution of COVID-19 and the change in management response required by organization meant effective communication was critical to effective COVID-19 risk management. The workforce relied on organizations to interpret and make sense of the COVID-19 restrictions and protection measures being mandated by government agencies which kept the workforce informed throughout the evolution of the pandemic [10].
Organization COVID-19 impacts have resulted in changes to daily work routines, work methods, logistics, material supplies and resource constraints at all levels of the organization [11]. The effect of these changes has increased levels of worker anxiety and stress [12] with the associated risk to the health and safety of the workforce by the extended periods of COVID-19 conditions and distractions. To reduce worker stress and anxiety the construction organizations need to provide a safe working environment preventing the spread of COVID-19 across construction sites through health and hygiene controls, reduction in community contacts and keeping the site teams informed on the status of changes in COVID-19 controls and conditions [13]. Organizations had to develop strategies to manage the constantly changing conditions, the effects of delays in supply chains and labor shortages with project leaders under increased pressure to deliver project work schedules with reduced manning, extended hours of work and uncertainty of future COVID-19 conditions.
To meet the COVID-19 risk management objectives fly in/fly out (FIFO) workers were required to work extended rosters, adhere to minimal contact measures in the workplace and in accommodation camps. To minimize close contact work teams began working in ‘bubbles’ with enhancement of personal hygiene measures and separate meal arrangements with workers usually eating alone in their rooms at camp. For those workers who travelled internationally or interstate as travel restrictions were imposed, they had to make the decision to either stay work or return home resulting in workers being away from their family and support networks for extended durations (6 to 9 months). Changes in work schedules in response to COVID-19 including extended shifts and rosters, uncertainty of FIFO logistical arrangements, introduction of COVID-19 testing affected workers’ job satisfaction, attitude and well-being as workers attempt to cope with factors outside of their control [14]. The measures implemented to reduce potential spread and contain COVID-19 infections in the workplace and FIFO accommodation also increased social isolation for workers, a psychological risk [15] for workers already removed from their normal social networks and support arrangements. Therefore, the construction industry has mitigated the social isolation through the inclusion of mental health measures in COVID-19 management plans [10].
This paper presents the impact of COVID-19 on a construction project safety performance using actual project safety data and the moderating effect of site leadership measured through safety climate perceptions.

2. Literature Review

2.1. Impact of COVID-19 on Safety Performance

Research on the effect that COVID-19 had on the health and safety performance within the construction industry has been predominantly post the advent of COVID-19 and based on interview and/or survey techniques or a review of policies and control practices [11,13,15,16,17]. The early COVID-19 pandemic research [12,15,18,19,20] provided a better understanding of the perceptions of people working within the industry and enabled construction organizations to adapt risk management programs to prevent and/or mitigate COVID-19 effects on worker health and wellbeing. However, minimal research has measured the direct impact of COVID-19 on construction worker safety performance using actual project safety performance leading and lagging indicators.
Construction workplace safety performance measurement currently uses a variety of indicators which measure event frequency (injury and/or incident) which are considered ‘lagging indicators’. Leading indicators in the form of actions taken to mitigate safety hazards (safety observations, hazard reports) and communication activities (pre-start briefing, toolbox meeting) and viewed as antecedents of events [21,22]. Incident and injury frequency rates are indirect safety performance measures as they measure the ‘absence of safety’ [23]. The risk of relying on incident and injury frequency rates is they fail to detect escalating risks that deteriorate safety performance until after the events have occurred [24,25]. Due to the limitations of using event rates to measure safety alternative leading indicators using measures of safety-related activity have been identified and modelled to predict safety events in a workplace [22,26,27]. Lingard [28] identified the relationship between leading indicators and event frequency is variable and depending on the timing of the measure may have a circular relationship. An event (injury) may cause an increase in safety activity (e.g., toolbox meeting), so the event predicts an increase in a leading indicator, equally the leading indicator (low frequency of the activity) may predict the event.
Measuring construction safety performance, given the decentralized organization structure [28], is complex as leading indicators are inter-related and not always directly related to the lagging indicators of incident or injury performance [29]. To measure the impact of COVID-19 on safety performance consideration needs to be given to lagging measures (incident and/or injury rates), leading indicators which measure field level risk activity (e.g., hazard reporting, critical control verifications) and the leadership behaviours which support the creation of positive safety climate (e.g., supervisor observations).

2.2. Interrelationship between Safety Performance and Safety Climate

Workplaces with more positive safety climate have a better safety performance as workers hazard recognition and safety risk perception increase [30], improve safety compliance as a function of supervisor safety leadership [31,32] and participation in safety practices [33]. Safety climate models differentiate two dimensions of safety performance; safety participation and safety compliance through determinants of performance (e.g., personal risk tolerance), performance antecedents (e.g., knowledge, skills) and measuring behaviours specifically involved in work tasks [30,34,35]. Safety compliance is the adherence to rules and procedures whereas safety participation is the engagement in safety activities to improve safety outcomes [34,36]. Significantly safety compliance is adhered to as it serves as it is cost effective and immediately available choice strategy and readily adaptable to the situation compared with more engineered solutions [37]. Whereas safety participation can be viewed as a form of safety citizenship relating to discretionary actions which contribute to organization safety outcomes [38]. Both dimensions, safety participation and safety compliance, are required in a safety management program. Compliance and discipline provide routine and reliability whilst initiative and participation improve the capacity for safe decisions and behaviours in less predictable situations [36].

2.3. Leadership Aspects Impacting Workers during COVID-19

Leaders create safety climate at the organizational and supervisory levels [32,36,39], and frontline supervisors influence the safety behaviors of their workers [40,41]. However, the organizational safety climate will modify the effects of supervisory safety climate [32,39,42]. COVID-19 was a major disruption to the relationships between project management, supervisors, and the workers. By studying pre and post COVID-19 safety climate, the factors affecting the relationships between stakeholders became more evident. Establishing these factors enabled management to improve support to frontline leaders, in particular, to positively influence workers compliance and participation in safety processes, and the project safety performance.
Safety climate arises from individual’s experiences and perceptions being shared socially in the workplace. These shared perceptions arise from two antecedents being, symbolic social interactions and supervisory leadership [43,44]. When faced with complex and potentially ambiguous work situations individuals will attempt to make sense of the situations through social interactions with others, to gain an understanding of how to interpret and respond to the situations [45]. Through the repeated social exchanges, particularly supervisors, the leader creates the safety climate as they make sense of organisational requirements and the observed supervisor actions and practices [46].
Effective leaders establish meaningful high-quality relationships with their workers and care for their wellbeing particularly in high-risk situations found on construction projects. The observed practices and social exchanges between supervisor and worker, or between workers, affect the work group safety climate perceptions and perceived priorities within the work unit, e.g., prioritizing safety over production demands [44]. Measuring safety climate builds an understanding of the social mechanisms impacting either the social interactions which build common and aligned safety attitudes within a project, or factors affecting frontline leaders at the point in time.
An early study indicated COVID-19 acted as a distraction reducing workers and line supervision capacity to focus on the day-to-day safety risks [13]. Almohassen et al. [15] identified whilst there was a general heightened awareness of core safety elements during the pandemic the importance rating of the elements was not different after COVID-19. Three exceptions were identified, ‘participation in safety programs’, ‘report safety and health concerns’, and ‘identification of hazards associated with emergency and non-routine situations’. All relate to the heightened awareness of COVID-19 and the health controls imposed on construction sites to prevent spread of the disease.
The COVID-19 pandemic progressed it was a major disruption event on projects with increased pressure on site leaders to implement the COVID-19 management plan. Leaders were expected to communicate COVID-19 changes to the workforce, maintain morale, ensure hygiene measures and social distancing were applied whilst maintaining production schedules. Amidst the juggling of COVID-19 measures site leaders were responsible to maintain a positive safety climate as the project safety risks had not diminished with high-risk activities continuing to be conducted. In the absence of a positive safety climate [18,47] workers’ perception of COVID-19 risks, and the systems, practices, and behaviours of leaders to manage COVID-19 risks, had the potential to increase workers anxiety or become a distraction from the high-risk work being conducted [16,17,48]. The site leaders (project manager, construction manager, supervisors) set the safety climate on the project site which directly affects the attitude and behaviours of the workers [18]. Site leaders who can establish a positive safety climate will generate higher levels of safety participation across the workforce and reduce “at risk’ behaviours of the workers [32,35,49]. To achieve a reduction in risk during COVID-19 leaders needed to have the skill, knowledge, and capability to communicate changes to keep workers informed whilst balancing project schedule, materials, equipment [50]. Site leaders also need to moderate perceived increased work pressures as sites continue to meet construction schedules impacted by labor and material shortages [19]. Almohassen et al. [15] identified the changes in safety practices which occurred during the pandemic, however a greater understanding of leadership factors and safety climate which support safe outcomes would benefit site leaders managing major project disruptions like the COVID-19 pandemic.

2.4. Measuring Construction Safety Climate

Building on Mohamed’s [51] safety climate measurement model designed for the construction industry Saunders [29] further developed the instrument to extend to other stakeholders (e.g., owners, engineers, subcontractors). The safety cultures which shape construction project safety ‘decision-making’ in Australian construction projects is complex [52] so it is important to discern differences between safety climate perceptions between organizations. The outputs of safety climate surveys provide project management an insight into organization, team and individual safety perceptions and factors influencing either the social interaction or effective supervisor modelling of positive safety.

3. Study Objectives

Insights gained from comparison of safety performance and safety climate measures pre and post COVID-19 disruptions will benefit organizations and project leaders to focus on practices and behaviours which support effective risk management throughout the disruption event.
The study aims to:
  • Evaluate COVID-19 influence on the safety climate and safety performance of a construction project.
  • Evaluate the influence of leadership on a construction project safety performance under the impact of COVID-19.
This paper is novel in that it provides insights from a construction project which experienced pre and post COVID-19 conditions and provides direct measurement of safety performance throughout the pandemic phenomenon. The data and safety perceptions of the workers reflect the journey the construction project went through learning to manage COVID-19 on site, the direct impacts on labor and material shortages, isolation of the workers and the challenges facing the site leaders. The study also provides commentary of the additional complexity facing construction project throughout COVID-19 and the decisions taken by organizations to maintain ‘safe work environments’ on remote sites.

4. Methods

4.1. Project Selection

An Australian construction project (Table 1) was opportunistically selected for the study as the project had mobilized to the field prior to the COVID-19 pandemic (August 2019–6 months prior to first wave) and continued for a further eighteen months through the COVID-19 pandemic for a total of 72 weeks. Two safety climate surveys were conducted one in January 2020 (pre-COVID), and one in October 2020 (post COVID). The participating organization changed out the Project Manager (Lead A) to (Lead B) at the end of week 43 which provided a comparison of the safety impact between two different leaders on the same project.

4.2. Safety Climate Survey

The Saunders et al. [31] safety climate survey was selected as it had been developed for construction organizations and measured individual, team, supervisor, and management factors. The safety climate survey provided a point in time benchmarking tool measuring eleven (11) attributes of worker safety climate perceptions (Table 2) comprising 35 questions. The safety climate survey was structured to measure organization, team, and individual safety perceptions across eleven Likert like units of questions (Table 2) with two questions of free text on safety risks and safety improvements identified by participants. The question responses were formatted into a Likert-5 level response format and uploaded to the Microsoft Forms® survey tool for digital data capture and produced in hard copy for field-based personnel.
Participants in the survey were recruited in two ways, attendance at a site safety meeting and through an email distribution list provided by the organization. Site based surveys were facilitated by the organization, where the researcher (Selleck) attended the project work site, attended the weekly safety toolbox meeting with the workers, provided an overview of the survey aims, ethics being applied and handed out hard copy survey forms. Workers were provided time to complete the survey which were deposited by the participants anonymously in a box provided. The collection box remained available until the shift. The process was repeated for the cross shift a week later.
Personnel with access to computers were emailed the Microsoft Forms® survey link to complete the survey within the two weeks, with a reminder on day 7 and day 13. Participation in the survey was voluntary and anonymous with basic demographical information and response to questions collated into the MS Form® database for analysis. All participants were asked to provide consent on the survey forms consistent with the ethics requirements for the research and where consent was not provided to use the data, the information was excluded from the analysis. Incomplete hard copy forms were excluded from the survey results and not uploaded into Microsoft Forms® data set.
The safety climate survey was depl”yed ’wice during the study, one month after the mobilization of the project into the field prior to COVID-19 pandemic being present in the region (end of January 2020) under Leader A and repeated post COVID-19 impact on the project in October 2020 under Leader B. The survey in both instances was conducted across two weeks to capture all three crews on the project with time provided for the site team to complete during the weekly safety meeting.
The Microsoft Forms® survey analytics was used for comparative analysis and to provide a report of the response summary to the participating company.
Each participant’s Likert Scale scores were averaged using following formulas to transform data so comparative statistical analysis could be conducted on responses from the two sets of surveys.
Average Likert Scale Score (x) = sum (Qi score + Qii score + … Qn score)/n scores
where: Qi = participant score for (i) Likert scale question, n = number of Likert questions with Likert Scale (Minimum value = 0, Maximum value = 5).
Statistical analysis was conducted to highlight the significance of the relationship between variables including organisational elements and safety perception factors.

4.3. Safety Performance

The participating organization provided two safety performance data sets; incident events and counts of risk management activities (Table 3).

4.4. Statistical Analysis Method

The data was analyzed using R statistical package [53] applying exploratory analysis steps to understand the relationships and strength of relationships between the data set factors and the independent variables [54].

4.4.1. Safety Climate Survey Model

The Safety Climate Survey statistical model tests each of the Likert Scale like parameter to identify if there is a significant difference in the means due to the factors (COVID, Organization, Gender, Age). The model analyzed for differences in means between pre/post COVID surveys, participant Organizations (Client, Principal Contractor, Sub-Contractor), gender (male, female, non-disclosed) and age groups (<18, 18–29, 30–39, 40–49, 50–59, 60–69, >69). Each of the factors may contribute to differences in safety perception measures between the two survey events and is represented by Equation (2):
Lm(var x ~ COVID + ORGANIZATION + GENDER + AGE, data = data set)
e.g., Lm(COM_Avg ~ COVID + ORGANIZATION + GENDER + AGE, data = sc_survey_data)
where linear regression of the mean scores (Lm) is applied to ‘var x’ which represents the perception measure (Likert scale unit or Organization Element) being analysed. The linear regression model includes all four factors (COVID, Organization, Gender, Age) to determine significance (p = <0.05).
The results return regression analysis of the mean scores (F) and determines significance (Pr > F) at 0.05% significance level. Variables identified as potentially different from the exploratory analysis were fitted to linear regression model with significance calculated using multi-regression analysis (ANOVA) and checked for assumptions of normality and homoskedasticity. The effect size was for significant variables (p = 0.05) was calculated using the estimated marginal means of the variable within the statistical model (Equation (3)).
Emmeans (var x, pairwise ~ FACTOR)
e.g., emmeans(COM_avg, pairwise ~ AGE)
The significance between groups was confirmed through post hoc Tukey honest significant difference (Equation (4)) which compares other means of every factor to the means of every other factor and identifies any difference between two means that is greater than the standard error.
Qs = (YA − YB)/SE
where YA is the larger of the two means being compared, YB is the smaller of the two means being compared, and SE is the standard error of the sum of the means.

4.4.2. Safety Performance Model

The Safety Performance model tests the factors (COVID, LEAD) which may contribute to differences in perception measures between the two survey events and is represented by Equation (5).
Lm(var x ~ COVID + LEAD < data = data set)
e.g., Lm(INCIDENT Rate ~ COVID + LEAD, data = P1_safety_stats)
where linear regression is applied to ‘var x’ which represents the perception measure (Likert scale unit) being analyzed.
Variables identified as potentially different from the exploratory analysis were fitted to linear regression model with significance calculated using multi-regression analysis (ANOVA) and checked for assumptions of normality and homoskedasticity. The effect size was for significant variables (p = 0.05) was calculated using the estimated marginal means of the variable within the statistical model (Equation (6)).
Emmeans (var x, pairwise ~ FACTOR)

5. Results

5.1. Safety Climate Survey

The COVID-19 surveys were undertaken by a total of 194 participants across the two survey events. Sixty-eight (68) participants completed surveys in the pre-COVID survey and 126 in the post-COVID survey representing 79% and 91%, respectively of the onsite workforce, an overall response rate of 85%. Fourteen (14) surveys were incomplete, and 14 participants elected to not participate in the research leaving 166 surveys included in the study. The response rate compares favorably for similar research-based safety climate surveys including construction industry surveys [29,55,56,57,58]. Participation rate in the initial baseline safety climate survey was impacted by the rostering of workers and limited involvement by white collar workers. The post-COVID-19 survey had an increase in participation rate, however access to participants across the three different rosters was limited due to COVID-19 restrictions.

5.1.1. Demographics

A shift in the age distribution for the project’s working population was observed between the two surveys. The second survey had a 11.1% reduction in the 18 to 29 age group an increase of 9.5% and 4.9% in the 40 to 49 and 50 to 59 age groups, respectively. (Figure 1).
There was a change in participation with sub-contractors representing 81.2% of the October 2020 survey participants compared to 56.5% in January 2020. (Figure 2). There was limited participation in either survey by Owner organization representatives (2 participants).
The participants surveyed were predominantly from the equipment operator and trades occupations with limited input from superintendent/construction management, engineering, catering, and administration occupations. There was a significant increase in the Equipment Operator roles between the January and October surveys. (Figure 3).
The site-based field occupations conduct high risk activities which means understanding their safety perceptions provides an opportunity for project leaders to effectively manage potential safety risks.

5.1.2. Measures of Difference between Safety Climate Surveys–Pre/Post COVID-19

Plotting of participant scores by Likert scales identified a similar profile and spread of scores between the two surveys except for Safety Communication (COM_Avg). The average safety communication perception scores have improved between the two surveys with more participants ranking the communication higher on the Likert scale (0–5) with 0 low score and 5 high score of safety rated perceptions (Figure 4).
Linear regression models were fitted to all variables (Likert scale units) and the different organization elements (organization, team or individual) with ANOVA of the fitted means used to identify significance between the Likert scale units. The analysis identified significant difference between the survey results for Likert Scale measures of Communication, Supportive Environment, Work Hazard Identification, Worker Involvement and organization elements of Team and Individual safety perceptions (Table 4).

5.1.3. Communication Safety Perceptions–COVID and Age Factor Analysis

Initial data exploration identified potential data ‘outliers’ in the Organization (Owners–Figure 5) and Age (<18 and >70–Figure 6) factor groups where participants of the age group were only in one of the surveys. Further analysis of the data excluded ‘Owners’ and the two outlier age groups.
The average safety perceptions associated with communication were affected by two factors, COVID-19 (p = <0.001) and age (p = 0.1) with the distribution of the data by age (Figure 7). The size of the effect was tested by Estimated Marginal Means with results for COVID and AGE factors shown in Table 5. ANOVA assumptions of normality and homoskedasticity were confirmed through visual inspection of residuals plots.
At the 5% confidence level there is sufficient evidence (F(1, 154) = 12.38, p = 0.0006) to claim the mean Communication Average score between COVID groups are different. Post COVID scores are on average 0.289 units higher.
Statistical evaluation of AGE factor identified a weak correlation with Communication Average scores (F(4154) = 1.99, p = 0.098). The 40–49 age group (group a) were significantly different (t = 2.246, p = 0.026) and confirmed through post hoc Tukey analysis (Figure 8). The 18–29 age group was not significant at the 5% confidence level, however, was identified as a separate group (group b) in post hoc Tukey analysis (Figure 7). The other age groups (group ab) were not differentiated from each other, however, was identified through post hoc Tukey analysis as being different from both the 18–29 age group and 40–49 age group (Figure 7).

5.1.4. Supportive Environment Safety Perceptions–Age Factor Analysis

Data analysis without the outlier age groups (<18 and >70) identified a significant difference in the average safety perceptions around Supportive Environment between age groups (F(4154) = 4.53, p = 0.0017) at the 5% confidence level. Post hoc analysis (Tukey HSD mean = 3.85) identified three different sub age groups. The 40–49 and 60–69 formed group a with average supportive environment score > 4. The 30–39 and 50–59 age groups (group b) had the lowest average scores with the 30–39 age group having the widest variance in mean scores. The 18–29 age group (group ab) was differentiated from the other ages with a median average score and moderate variation in mean scores.

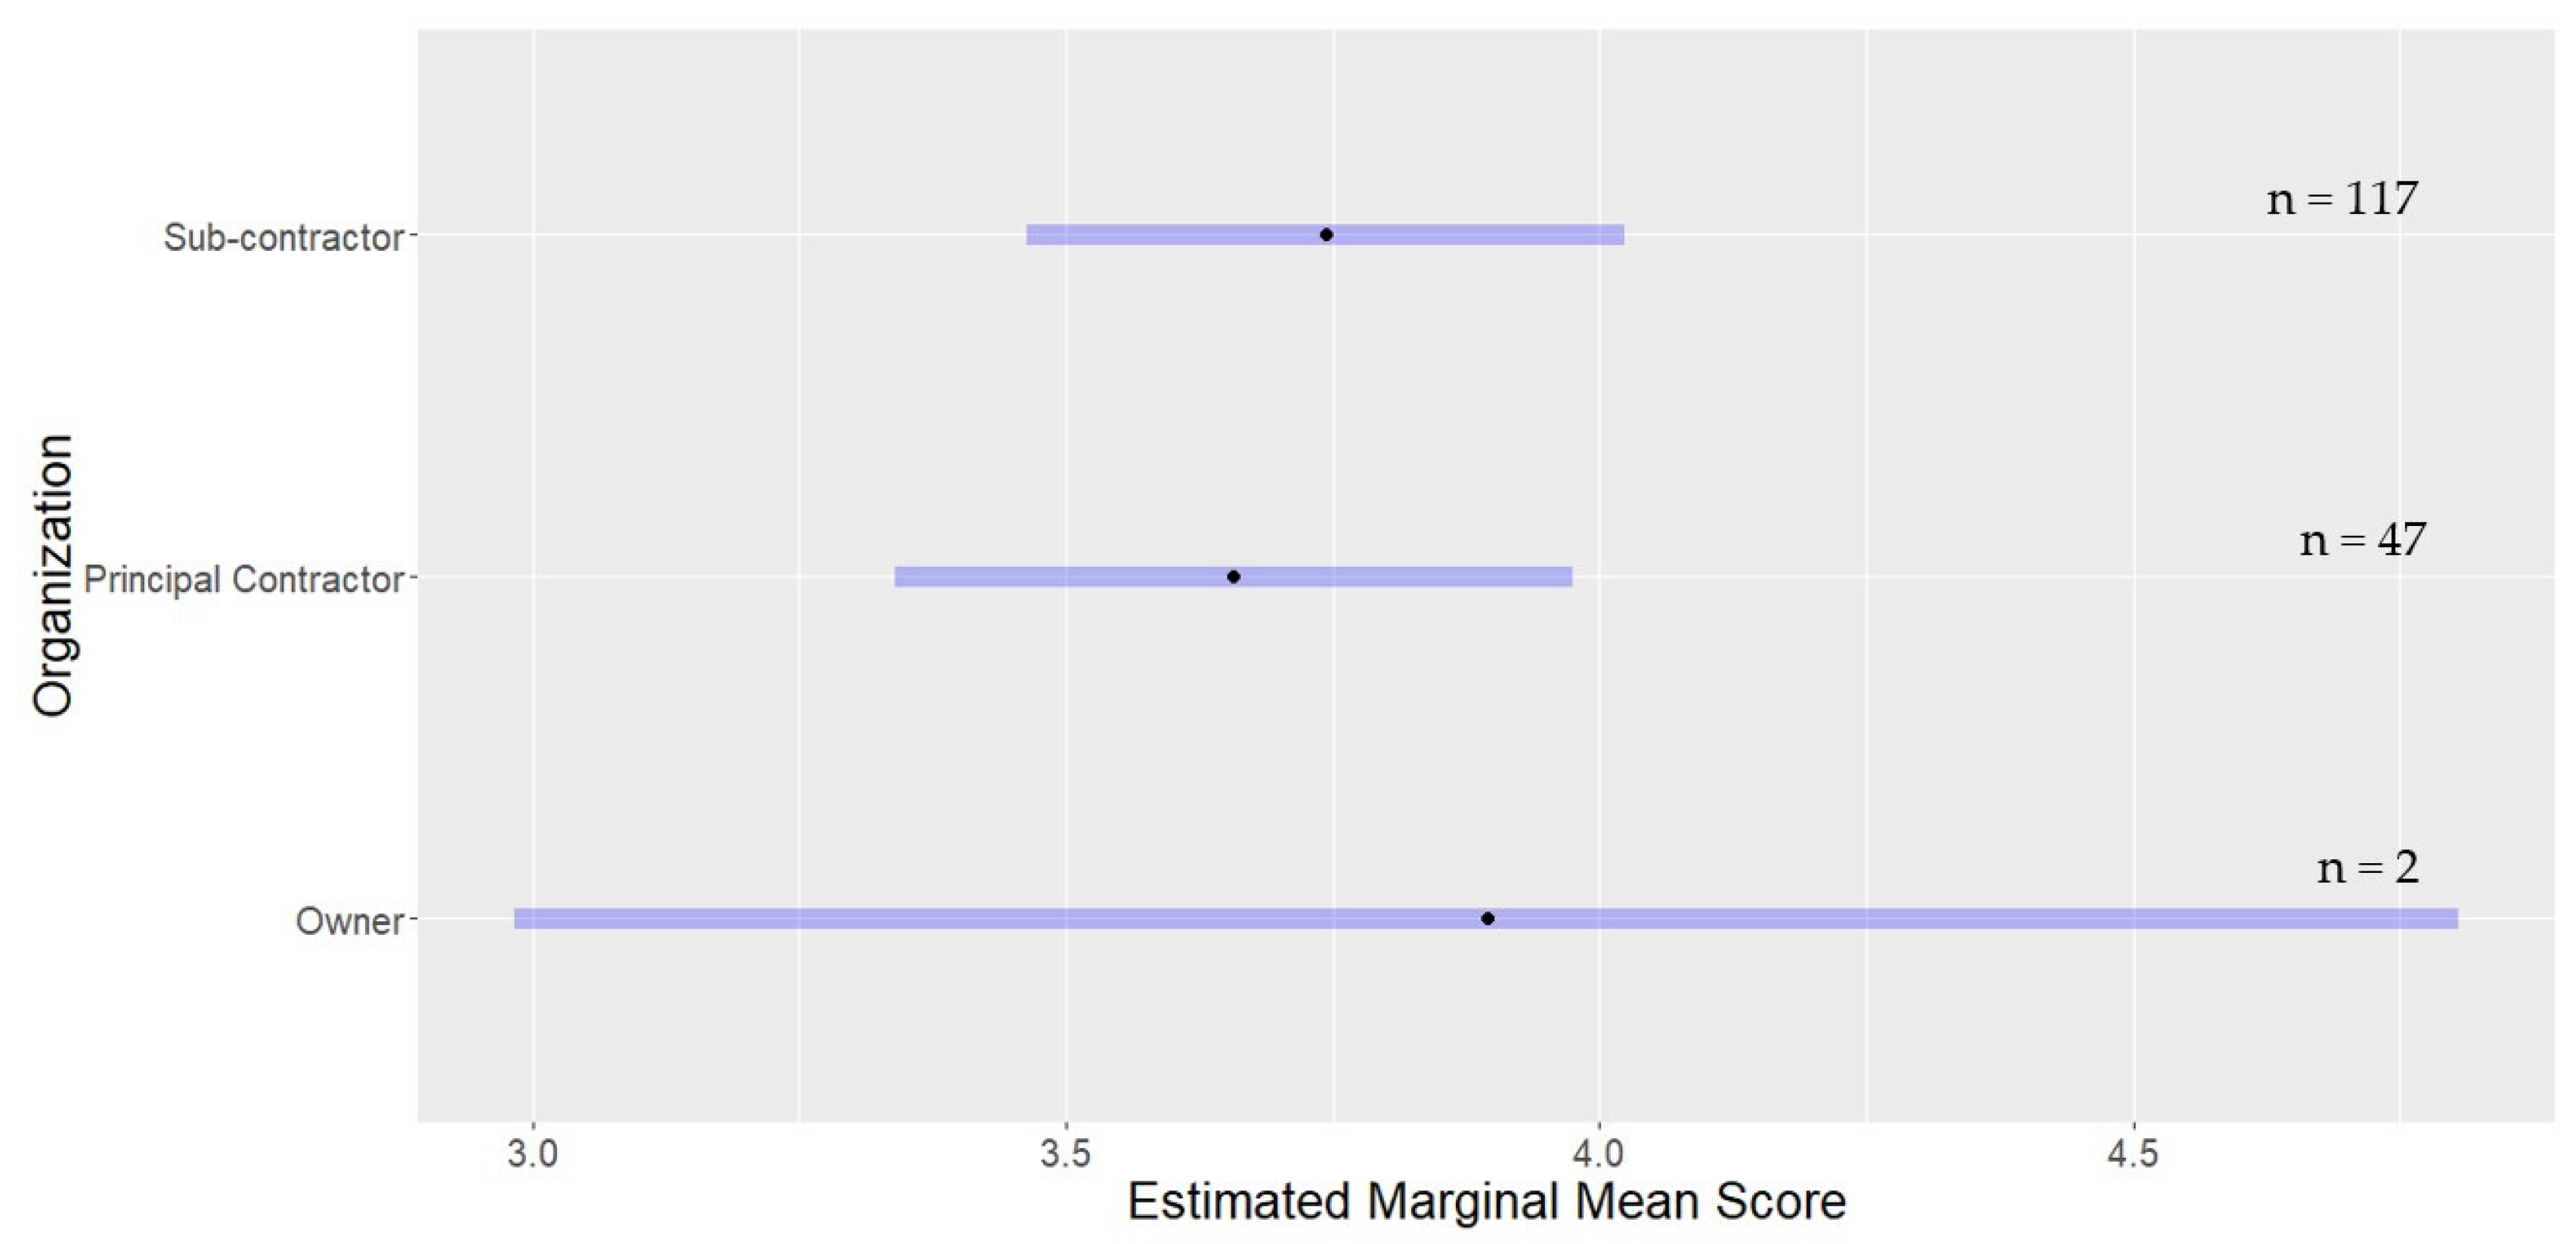
5.1.5. Organization Factor Analysis–Work Hazard Identification and Workers Involvement

The exclusion of outliers (Owner, age groups) was applied to the linear regression model for both Work Hazard Identification and Workers Involvement sets of Likert Scale data with size effects measured by Estimated Marginal Means.
Safety perceptions for Work Hazard Identification and Workers Involvement were significantly different between Principal Contractor and Subcontractor organizations at the 5% confidence level confirmed through post hoc Tukey analysis. Principal Contractor average scores are lower than Subcontractor average scores (Table 6).

5.1.6. Organization Factor Analysis–Team and Individual Safety Perception Elements

The exclusion of outliers (Owner, age groups) was applied to the linear regression model for both Team and Individual elements data for ANOVA analysis with size effects measured by Estimated Marginal Means (Table 7).
Safety perceptions for Team was significantly different between Principal Contractor and Subcontractor at the 5% confidence level and confirmed by post hoc Tukey analysis. Individual average safety perception scores were not different when measured by post hoc Tukey analysis.

5.1.7. Safety Climate Survey Summary

The safety climate perceptions were significantly influenced by COVID, Organization and Age factors (Table 8). COVID influenced Communication safety perceptions which varied by age group as did Supportive Environment. Differences in safety perceptions between Principal Contractor and Subcontractors was identified for Work Hazard Identification, Worker Involvement and Team attributes. Results identified COVID-19 adversely impacted management safety communication which as Table 8 shows also influences organizations and different age groups safety perceptions.

5.2. Safety Performance Results

The leading and lagging safety performance measure trends over time were graphed for the COVID and LEAD factors for exploratory analysis. Visual trends were observed for Hazard Observations (Figure 8a,b), incident rate (Figure 9a,b), Supervisor Observation & Interventions (Figure 10a,b) and MAP checks (Figure 11a,b) and were selected for statistical analysis.
Each selected safety performance parameter was fitted to linear regression model for ANOVA to test significance by COVID and Leader factors with Estimated Marginal Means used to assess the scale of the difference. ANOVA assumptions of normality and homoskedasticity were confirmed through visual inspection of residuals plots. A summary of the ANOVA outputs by safety performance parameter are provided in Table 9.

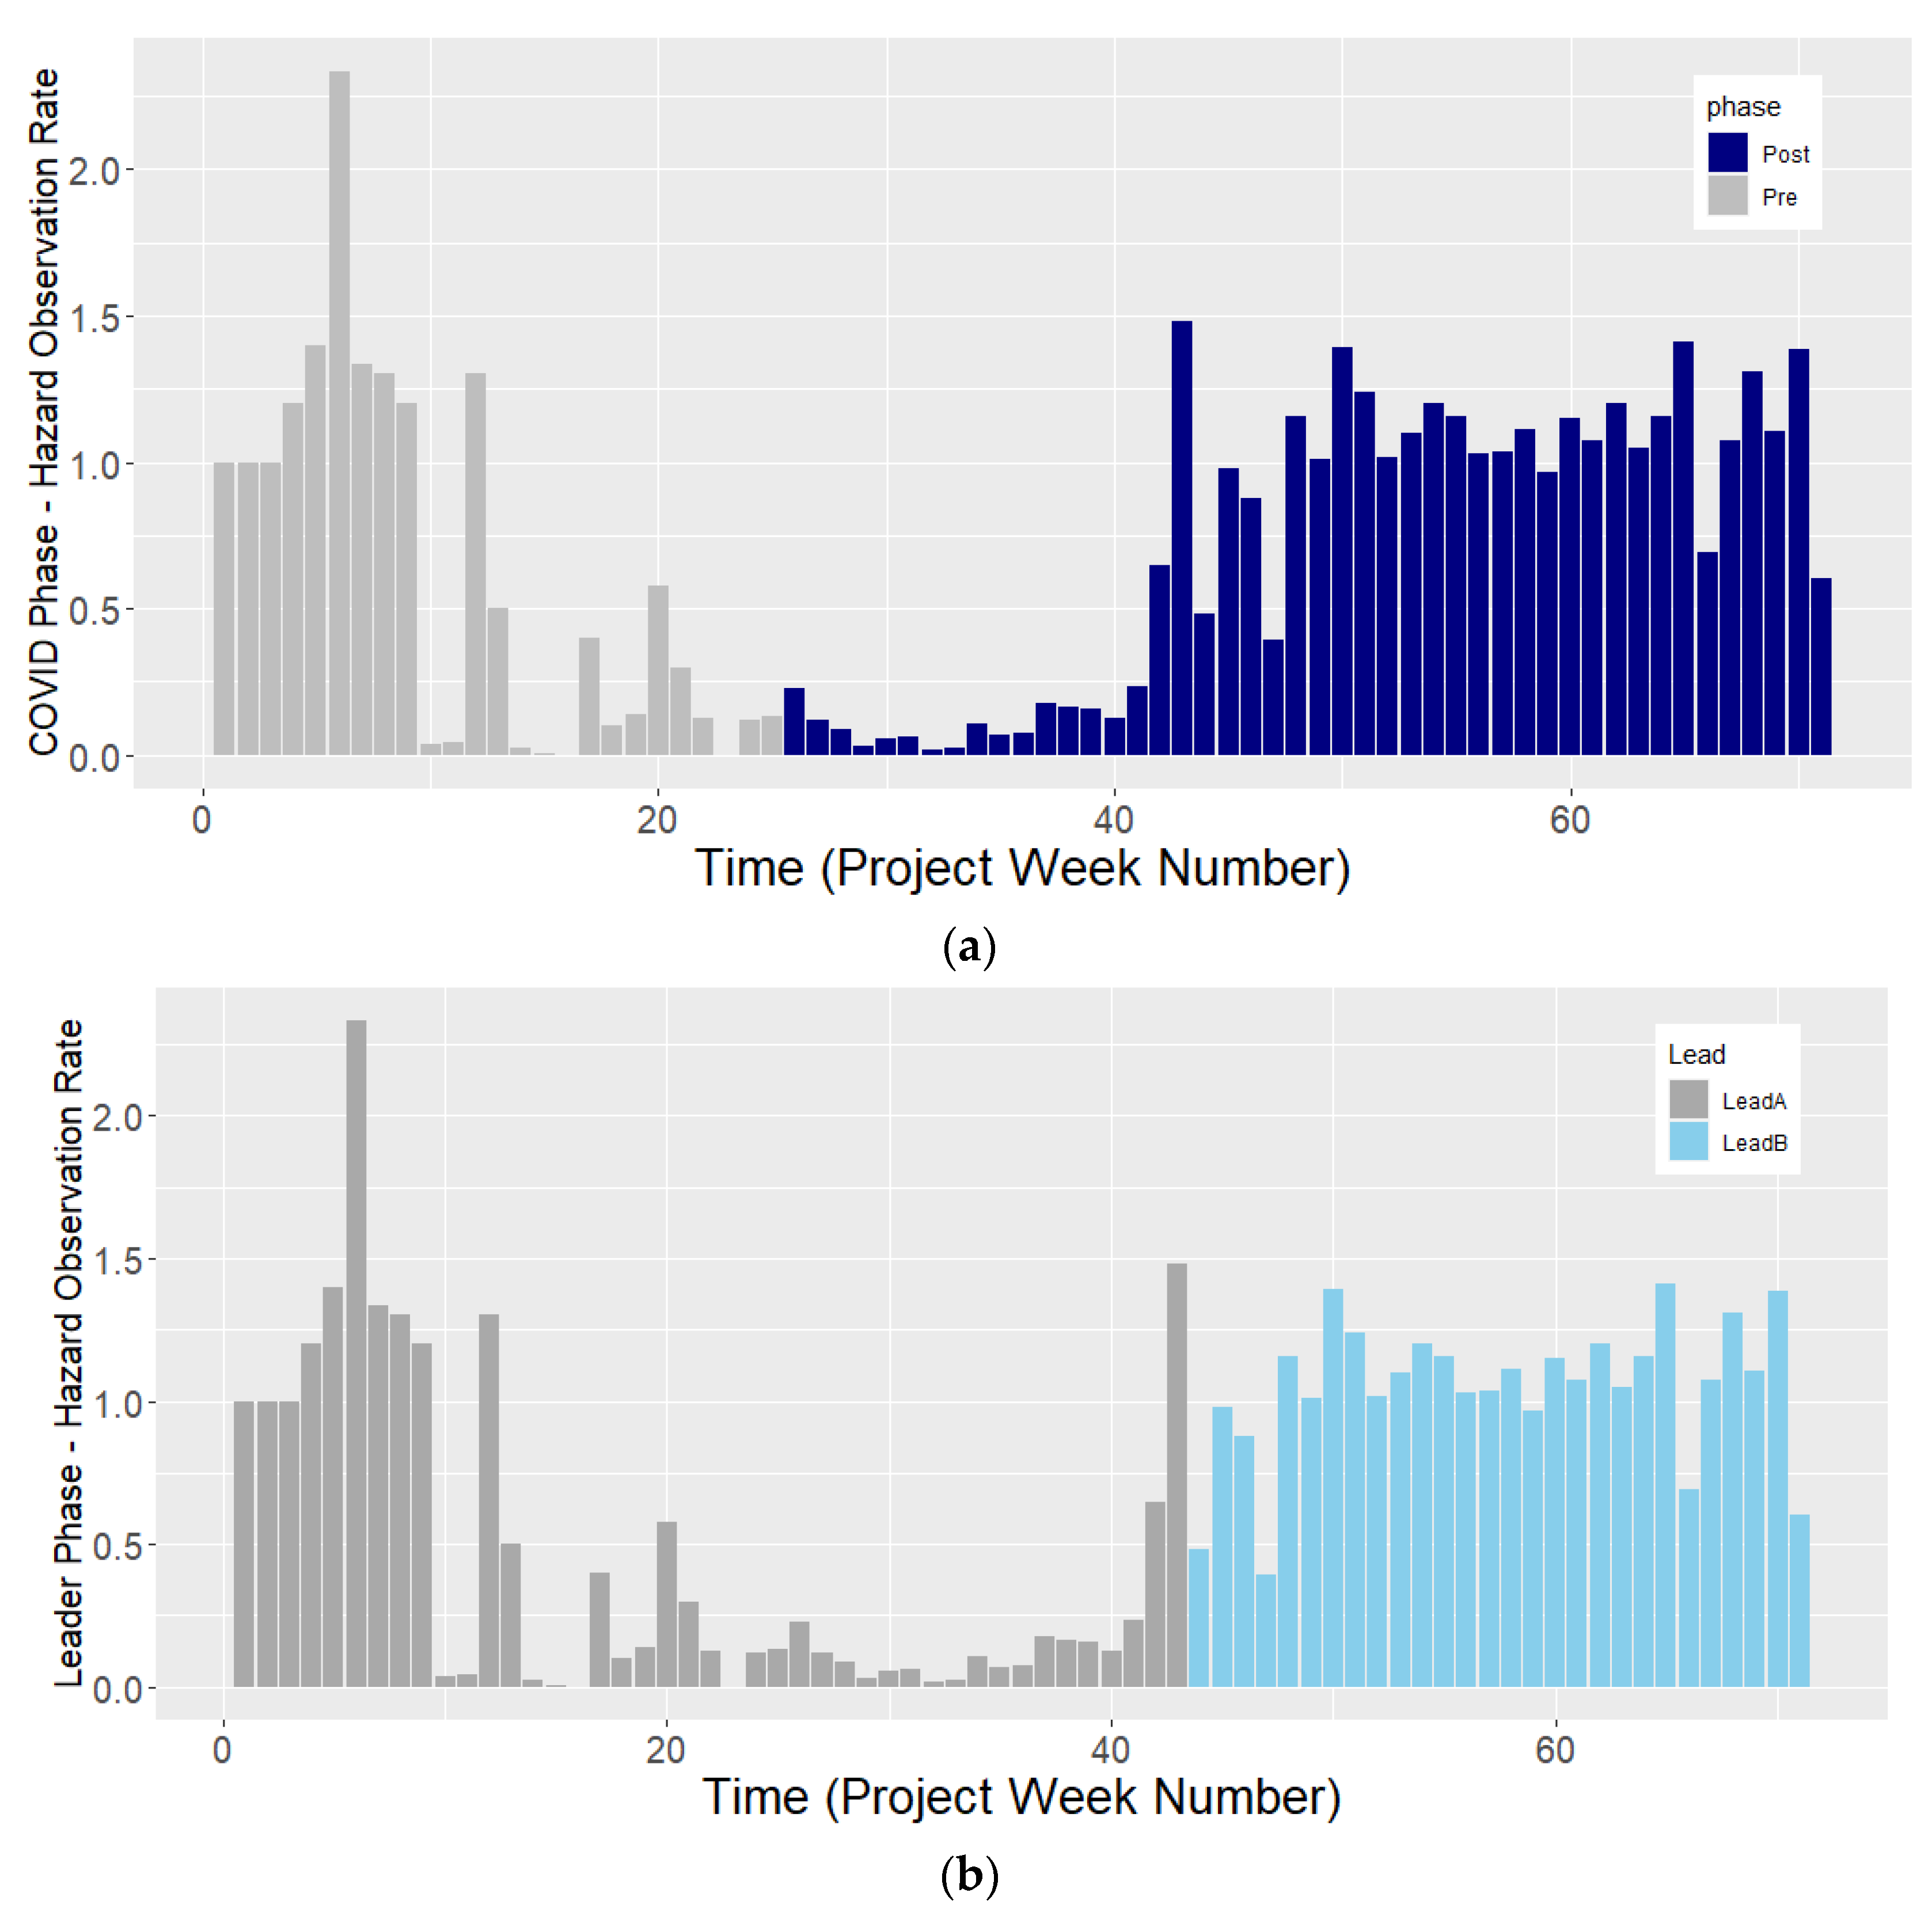
5.2.1. COVID-19 Effect

The project safety performance as measured by Total Incident rate improved significantly in the eight weeks post COVID-19 affecting site operations (Figure 9a). The incident rate deteriorated again and plateaued but did not return to the original levels and was on average significantly lower post COVID-19. The mean incident rate between Pre and Post COVID was different (F(1,68) = 19.9, p = 3.1 × 10⁻⁵) where the post COVID incident frequency rate is on average 183 units lower.
The Supervisor Observation (SO&I) rate was significantly different between Pre and Post COVID (F(1,18) = 8.2, p = 0.0056) with the Post COVID rate being on average 0.23 units higher than Pre-COVID rate.

5.2.2. Leader Effect

Leaders influenced frontline risk management practices of Hazard Observations (HAZOB), Supervisor Observations (SO&Is) and Critical Control verification (MAP Check) rates. On average Leader B improved the rate of all frontline risk management practices, HAZOBs by 0.83 units (F(1,68) = 38.7, p = 3.5 × 10⁻⁸), SOIs by 0.76 units (F(1,68) = 6.7, p = 0.11) and Critical Control verification rate by 1.75 units (F(1,68) = 18.36, p = 5.905 × 10⁻⁵).
The times series graphs (Figure 8a,b, Figure 10a,b and Figure 11a,b) for each of the risk management practices show a similar trend with risk management practices slowing down or ceasing in the case of MAP Checks with the onset of COVID-19 impacts (week 25) and not increasing again until under the influence of Leader B.
In summary the project had a significant improvement in incident rate and SOIs post COVID. Leader B improved the rate of leading indicators including Hazard Observations, Supervisor Observations & Interventions and MAP Checks.

6. Discussion

The research evaluated the effect of COVID-19 on a construction project by comparing pre and post COVID-19 safety performance and the influence of leaders on the worker safety perceptions. The project was operational prior to COVID-19 and had completed a baseline safety climate survey to compare post COVID-19 results. The results are unique as the data shows the project throughout the COVID-19 transition period and operating under the new COVID-19 conditions and provides direct comparative data pre and post COVID-19.
COVID-19 as a factor was identified in total incident rate and supervisor observations and worker perceptions around safety conversations. Leaders influenced the frontline risk management activities of hazard observations, supervisor observations and critical control verifications (MAP Checks). Project leadership was not static during the study as the Project Manager (primary leader) was changed by the organization in response to deteriorating safety performance and broader management of COVID-19 effects on the project. The statistical modelling did factor in the change to ensure the effects of COVID-19 were not over-estimated due to the change in leaders. The analysis does provide insights into the safety climate dynamics operating within a construction site when external stress events are introduced.
The overall reduction in incident rate following the impact of COVID-19 is consistent with other studies where COVID-19 heightened the risk awareness of workers [10,11,12,15]. The decentralization of construction organizations [28] with management control at site directed through the Project Manager and supervisors has meant front line leaders have a direct influence of on safety performance [59]. The supervisor role is pivotal on a construction project as it directly influences work group safety attitudes and risk-taking behaviour [48] resulting in a reduction in injuries [29]. Alruqi [59] supported this view when comparing safety climate to safety performance within the construction industry whereby supervisor behaviour is important in improving safety climate and reducing injuries.

6.1. Influence of Leadership through COVID-19 and Safety Perceptions

Studies have also reported the heightened level of risk awareness by workers due to COVID-19 has also applied to other safety management practices [11,36]. The results from this study differ from previous findings as the frontline risk management practices do not increase worker risk management practice in response to COVID-19 but decrease under Leader A. However, the trend does reinforce the relationship between supervisors and the safety climate set on the project. Supervisors responded to COVID-19 by increasing the SOIs with the workers including associated safety orientated communication. The engagement by supervisors was recognized by the workers in the safety climate surveys where workers perceived there was an increase in ‘safety communication’ post COVID-19 than pre-COVID-19.
The increased worker engagement through SOI’s by supervisors in the post COVID-19 period and prior to the commencement by Leader B did not result in an increase in other risk management activity by the workers as measured by hazard observations (HAZOBs). The increase on average of worker hazard observations (HAZOBs) and re-instatement of supervisors completing Critical Control (MAP Check) verifications was associated with the influence of Leader B. The safety climate at the site is set by the Project Manager (Leader A/Leader B) who can influence positively by providing support for supervisors and their work teams or negatively with a focus on production and ongoing perceived production pressure by supervisors and the workers [18].
Project supervisors and workers will perceive to be under greater production pressure due to delays caused by material and labor shortage, disrupted rosters and imposed COVID-19 control activities [12]. In the absence of pro-active and positive safety leadership under COVID-19, the project safety climate will deteriorate and a reduction in worker safety motivation, participation in safety programs and safety compliance will occur [18,29]. The decline in worker hazard observations (HAZOBs) and Critical Control verifications post COVID-19 under Leader A supports Guo’s [47] safety climate prediction.
Post COVID-19 when the project was under stress due to the health, logistics and supply issues the perceived safety climate improved. Initially under Leader A as the continuous changes, due to COVID-19 increasing rate of spread, were communicated, and then improved even further under Leader B. In the post COVID-19 period the change in safety communication positively influenced the perceived safety climate and safety participation as the frequency of risk management activities (HAZOBs, MAP Checks) increased, a finding consistent with previous research [29,32,47]. Leader B in the post COVID-19 period set up the communications and actions required to re-instate supervisor interactions improving the ‘social support’ for the workers and establish a positive ‘supporting environment’. COVID-19 factors including increased work pressure arising from shortage of labor and restricted logistics arrangements initially caused a deterioration in worker safety participation and safety compliance. Under Leader B’s guidance the perceptions related to work pressure improved, workers became more involved and work hazard identification improved. By increasing the rate of supervisor observations (SOIs) and Critical Control (MAP Check) verifications, Leader B re-instated the social interactions and supervisory leadership both antecedents of a shared safety climate [43,44]. COVID-19 was a major disruption on the project which caused a drop in frontline risk activities after the initial three-week period. However, Leader B demonstrated generating a positive safety climate through communication and committed risk management actions offset the impact of the COVID-19 disruption and improved safety performance. A similar conclusion was reached in an oil and gas COVID-19 study recommending ‘companies should maintain a positive perception of health and safety culture to improve workplace safety even during the pandemic’ [60].

6.2. Influence of Age on Safety Perceptions

Safety communications across the project were influenced by age group of the workers with younger personnel (18–29-year-old group) having a lower perception on the effectiveness of safety communication and the supporting environment than other age groups. Younger worker safety perceptions are influenced by organisational relationships, mental stress, and job security [61] all of which were subject to changes and the associated pressure due to the COVID-19 impact on the project. The ‘supporting environment’ provides the organisational structure and support to safely undertake work under instruction from the supervisor and guidance of the work team. This age group safety perception of the ‘supporting environment’ was on average > 1.05 units lower than all other age groups surveyed and reflects the dependency younger construction workers have on stable organisational support.
Older construction workers, (in this instance > 30 years old) safety perceptions are dominated by factors of workload and job satisfaction [61,62,63]. Two age groups (40–49 and 60–69 years old) perceived safety communication on average at a higher level than the other age groups. One theory is these groups represent supervisory or management roles and have a more positive perspective as they are directly engaged in the safety communication processes on projects. This was unable to be validated due to limitations of the data set.

6.3. Influence of Organization on Safety Perceptions

Organisational factors, specifically differences between principal contractor and subcontractor safety perceptions were identified for Work Hazard Identification, Worker Involvement and Team factors with subcontractors on average having a higher safety perception. Subcontractors are used on construction projects to undertake specific scopes of work relevant to the specific skill sets of the contracting company and usually operate independently of other subcontractors with oversight provided by principal contractor representatives. In working within self-contained teams, the subcontractor leaders have more direct contact with their workers. The higher level of perceived safety by subcontractors reflects this organisational structure with subcontractor leaders directly influence frontline risk management activities, engaging with the workers and engendering a team environment.
The differences Identified in safety perceptions between principal contractor and subcontractors reflects the complex social ecosystem which exists within a construction project. Principal contractor representatives in Australian construction industry were found to be more focused on getting the job done given the range and scope of the project than consulting or communicating with subcontractor personnel to resolve schedule clashes or other issues or ensuring safe work practices [64]. The safety attitudes and behaviours are shaped by professional; organization and industry cultures which influence the operations at site, and it is common for misalignment between organizations, even to the point there is no shared view of safe practices [64].
Leadership attributes were potentially more pronounced due to COVID-19 given the pressures on resources, time and schedule COVID-19 introduced which resulted in a change of Project Manager during the study. The change in leaders however also provided an opportunity to model the effect of different leaders under COVID-19 conditions.
Two disruption events occurred during the study, COVID-19 and change in project leaders, resulting in transition periods as the project personnel learned how to ‘normalize’ the effect of the change in day-to-day work. The data indicates during the transition periods (3 to 4 weeks) the change had an exaggerated short-term effect on the performance measure (e.g., MAP checks, incident rate) which was not quantified. Further analysis is required to explore the impact of “transitions” on safety performance
COVID-19 presented a major disruption event to the study project with increased level of stress within the organizations involved through impacts to workers, labor shortage, supply chain and increased schedule pressure. Organizations have become entrenched in ‘administering’ safety with a focus on producing ‘pieces of paper’ and by default the pieces of paper have become more important than the activities which produce them [65]. The comparative difference between the project leaders in the study emphasized the importance frontline leaders have in delivering safety outcomes primarily through worker engagement and effective communication on safety priorities. Organizations looking to manage through disruption events, and, by extension, catastrophic incidents would benefit from ‘checking in’ with the worker safety perceptions and how to improve worker engagement to ensure the wellbeing and safety of workers.

6.4. Limitations

There are a few limitations of the study which need to be acknowledged. First the study was limited to one construction project operating under fly in: fly out manning in remote Western Australia with personnel experiencing long periods of isolation physically away from immediate personal support networks. Managed under joint venture management structures with stringent client COVID-19 imperatives which constantly changed, a level of misalignment occurred between organizations not usually present within a construction project. While the study confirmed the importance of site leaders in setting the safety climate identified in previous research [32,40] further longitudinal research is needed to validate the inter-relationships identified. Second, under the unique circumstances the aspects directly related to participation rates (high rates) and misaligned safety perceptions between organizations, these should not be extrapolated as typical construction project work arrangements. Further research to across multiple projects is needed to test the results from this study. Third, the safety climate survey used was modelled and validated through research [29] to test inter-organization and supervisor level safety climate factors, while the safety climate measures were sensitive enough to detect differences in real test situations further validation across multiple case study sites is needed. Finally, COVID-19 was a significant disruptive event and while being a focus of the study also introduced a potential bias in perceptions relevant to management commitment as organization management were not able to have a present on the work site.

7. Conclusions

Safety performance as measured by incident rate improved under the effect of COVID-19 which is consistent with the inherent increase in safety awareness due to COVID-19 reported in previous studies [10,11]. The increased safety and wellbeing awareness due to COVID-19 did not result in an increased level of engagement in front-line risk management activities. The frontline risk management activities reduced over time under the influence of COVID-19 and did not improve until a change of Project Manager occurred. The study identified the effect of leadership and power of setting a positive safety climate to increase worker motivation, participation in risk management processes and compliance to safety requirements.
The safety climate on a project is perceived differently by different organizations working with the site environment or by different age groups. The dynamics with the construction site organizations collectively shape the safety climate on site with the sub-contractors having a more direct relationship with their worker generating a more positive safety climate than the principal contractor. Younger members of a construction workforce perceive the safety climate more negatively than older work-force members.
The study benefits construction frontline leaders managing disruption events, either externally imposed (e.g., COVID-19) or internally (e.g., organization changes), the positive impact of worker engagement and consistent safety communication has on safety climate and safety performance. Through positive engagement frontline leaders enable workers to build resilience and maintain a focus on risk management practices.

Author Contributions

Conceptualization, R.S.; methodology, R.S. and M.H.; investigation, R.S.; formal analysis, R.S.; resources, R.S.; supervision, M.C. and M.H.; writing original draft, R.S.; writing—review and editing, M.C. and M.H.; validation, R.S. All authors have read and agreed to the published version of the manuscript.

Funding

This research is supported by an Australian Government Research Training Program (RTP) Scholarship.

Institutional Review Board Statement

The research has been conducted in accordance with Edith Cowan University Human Research Ethics Committee (HREC) approval for Project number 20293 Selleck granted on 12 June 2018 (valid from 12 June 2018 to 31 March 2022) which meets the requirements of the National Statement on Ethical Conduct in Human Research.

Informed Consent Statement

Consent was obtained from participants to use the safety climate survey responses as part of the survey method. Safety performance statistics provided by the participating company were de-identified prior to being provided to the researcher. No harm has resulted from the safety climate survey or other participation in this research.

Data Availability Statement

Restrictions apply to the availability of these data. Data was obtained confidentially from four third party construction companies and is available upon request from the corresponding author with the permission of participating companies.

Acknowledgments

The authors would like to express thanks to the construction company which provided access to the construction project site, provided safety performance data, and participated in this research.

Conflicts of Interest

The authors confirm there are no competing interest associated with this research.

References

  1. International Labor Organization. ILO Sectoral Brief: Impact of COVID-19 on the Construction Sector; International Labour Organization: Geneva, Switzerland, 2021. [Google Scholar]
  2. WA Government. COVID-19 Coronavirus: State of Emergency Declarations; WA Government: Western Australia, Australia, 2020.
  3. Australian Health Protection Principal Committee (AHPPC). Australian Health Protection Principal Committee (AHPPC) Advice to National Cabinet on 30 March 2020. 2020. Available online: https://www.health.gov.au/news/australian-health-protection-principal-committee-ahppc-advice-to-national-cabinet-on-30-march-2020-0 (accessed on 31 March 2022).
  4. Australian Health Protection Principal Committee (AHPPC). Australian Health Protection Principal Committee (AHPPC) Statement on the Review of Physical Distancing and Person Density Restrictions; Australian Government Department of Health and Aged Care: Canbera, Australia, 2020. Available online: https://www.health.gov.au/news/australian-health-protection-principal-committee-ahppc-statement-on-the-review-of-physical-distancing-and-person-density-restrictions (accessed on 31 March 2022).
  5. Bleby, M. Construction Sheds $14 billion since March, in The Australian Financial Review. 2020. Available online: https://www.afr.com/property/commercial/construction-sheds-14-billion-since-march-20200519-p54ukk (accessed on 31 March 2022).
  6. European International Contractors. COVID-19 and the Global Construction Business; European International Contractors: Berlin, Germany, 2020; Available online: https://www.eic-federation.eu/COVID-19-and-global-construction (accessed on 31 March 2022).
  7. Deloitte. The Impact of COVID-19 on Infrastructure Projects and Assets; Deloitte Nigeria: Lagos, Nigeria, 2020; Available online: https://www2.deloitte.com/content/dam/Deloitte/ng/Documents/finance/ng-the-Impact-of-COVID-19-on-Infrastructure-project-and-assets_27052020.pdf (accessed on 21 February 2022).
  8. Department of Infrastructure Transport Regional Development Communications and the Arts. Infrastructure Investment Response to COVID-19. 2020. Available online: https://investment.infrastructure.gov.au/about/national-initiatives/response-to-covid-19.aspx#:~:text=In%20June%202020%2C%20the%20Australian,commence%20within%206%20months%3B%20and (accessed on 29 March 2022).
  9. Australian Health Protection Principal Committee (AHPPC). Australian Health Protection Principal Committee (AHPPC) 2020–2022. Available online: https://www.health.gov.au/committees-and-groups/australian-health-protection-principal-committee-ahppc (accessed on 31 March 2022).
  10. Alsharef, A.; Banerjee, S.; Uddin, S.; Albert, A.; Jaselskis, E. Early Impacts of the COVID-19 Pandemic on the United States Construction Industry. Int. J. Environ. Res. Public Health 2021, 18, 1559. [Google Scholar] [CrossRef]
  11. Pamidimukkala, A.; Kermanshachi, S. Impact of COVID-19 on field and office workforce in construction industry. Proj. Leadersh. Soc. 2021, 2, 100018. [Google Scholar] [CrossRef]
  12. Stiles, S.; Golightly, D.; Ryan, B. Impact of COVID-19 on health and safety in the construction sector. Hum. Factors Ergon. Manuf. 2021, 31, 425–437. [Google Scholar] [CrossRef] [PubMed]
  13. Del Rio-Chanona, R.M.; Mealy, P.; Pichler, A.; Lafond, F.; Farmer, J.D. Supply and demand shocks in the COVID-19 pandemic: An industry and occupation perspective. Oxf. Rev. Econ. Policy 2020, 36, S94–S137. [Google Scholar] [CrossRef]
  14. Parker, S.; Fruhen, L. Impact of FIFO Work Arrangements on the Mental Health and Wellbeing of FIFO Workers; Center for Transformative Design, Government of Western Australia Mental Health Commission: Perth, Australia, 2018. Available online: https://www.mhc.wa.gov.au/media/2547/impact-of-fifo-work-arrangement-on-the-mental-health-and-wellbeing-of-fifo-workers-full-report.pdf (accessed on 21 February 2022).
  15. Almohassen, A.S.; Alkhaldi, M.S.; Shaawat, M.E. The effects of COVID-19 on safety practices in construction projects. Ain Shams Eng. J. 2022, 14, 101834. [Google Scholar] [CrossRef]
  16. Nnaji, C.; Karakhan, A.A. Technologies for safety and health management in construction: Current use, implementation benefits and limitations, and adoption barriers. J. Build. Eng. 2020, 29, 101212. [Google Scholar] [CrossRef]
  17. Jones, W.; Gibb, A.G.; Chow, V. Adapting to COVID-19 on construction sites: What are the lessons for long-term improvements in safety and worker effectiveness? J. Eng. Des. Technol. 2021, 20, 66–85. [Google Scholar] [CrossRef]
  18. Onubi, H.O.; Yusof, N.; Hassan, A.S. Perceived COVID-19 Safety Risk and Safety Behavior on Construction Sites: Role of Safety Climate and Firm Size. J. Constr. Eng. Manag. 2021, 147, 04021153. [Google Scholar] [CrossRef]
  19. Choudhari, R. COVID-19 pandemic: Mental health challenges of internal migrant workers of India. Asian J. Psychiatry 2020, 54, 102254. [Google Scholar] [CrossRef] [PubMed]
  20. Fargnoli, M.; Lombardi, M. Safety Climate and the Impact of the COVID-19 Pandemic: An Investigation on Safety Perceptions among Farmers in Italy. Safety 2021, 7, 52. [Google Scholar] [CrossRef]
  21. Shea, T.; De Cieri, H.; Donohue, R.; Cooper, B.; Sheehan, C. Leading indicators of occupational health and safety: An employee and workplace level validation study. Saf. Sci. 2016, 85, 293–304. [Google Scholar] [CrossRef]
  22. Hinze, J.; Thurman, S.; Wehle, A. Leading indicators of construction safety performance. Saf. Sci. 2013, 51, 23–28. [Google Scholar] [CrossRef]
  23. Dekker, S.; Pitzer, C. Examining the asymptote in safety progress: A literature review. Int. J. Occup. Saf. Ergon. 2016, 22, 57–65. [Google Scholar] [CrossRef] [PubMed]
  24. Lofquist, E.A. The art of measuring nothing: The paradox of measuring safety in a changing civil aviation industry using traditional safety metrics. Saf. Sci. 2010, 48, 1520–1529. [Google Scholar] [CrossRef] [Green Version]
  25. Hopkins, A. Management walk-arounds: Lessons from the Gulf of Mexico oil well blowout. Saf. Sci. 2011, 49, 1421–1425. [Google Scholar] [CrossRef]
  26. Hallowell, M.R.; Hinze, J.W.; Baud, K.C.; Wehle, A. Proactive Construction Safety Control: Measuring, Monitoring, and Responding to Safety Leading Indicators. J. Constr. Eng. Manag. 2013, 139, 04013010. [Google Scholar] [CrossRef]
  27. Salas, R.; Hallowell, M. Predictive Validity of Safety Leading Indicators: Empirical Assessment in the Oil and Gas Sector. J. Constr. Eng. Manag. 2016, 142, 04016052. [Google Scholar] [CrossRef]
  28. Lingard, H.; Hallowell, M.; Salas, R.; Pirzadeh, P. Leading or lagging? Temporal analysis of safety indicators on a large infrastructure construction project. Saf. Sci. 2017, 91, 206–220. [Google Scholar] [CrossRef]
  29. Saunders, L.W.; Kleiner, B.M.; McCoy, A.; Ellis, K.P.; Smith-Jackson, T.; Wernz, C. Developing an inter-organizational safety climate instrument for the construction industry. Saf. Sci. 2017, 98, 17–24. [Google Scholar] [CrossRef]
  30. Pandit, B.; Albert, A.; Patil, Y.; Al-Bayati, A.J. Impact of safety climate on hazard recognition and safety risk perception. Saf. Sci. 2018, 113, 44–53. [Google Scholar] [CrossRef]
  31. Petitta, L.; Probst, T.; Barbaranelli, C.; Ghezzi, V. Disentangling the roles of safety climate and safety culture: Multi-level effects on the relationship between supervisor enforcement and safety compliance. Accid. Anal. Prev. 2017, 99, 77–89. [Google Scholar] [CrossRef] [PubMed]
  32. Kapp, E. The influence of supervisor leadership practices and perceived group safety climate on employee safety performance. Saf. Sci. 2012, 50, 1119–1124. [Google Scholar] [CrossRef]
  33. Zhang, R.P.; Lingard, H.; Oswald, D. Impact of Supervisory Safety Communication on Safety Climate and Behavior in Construction Workgroups. J. Constr. Eng. Manag. 2020, 146, 04020089. [Google Scholar] [CrossRef]
  34. Griffin, M.A.; Neal, A. Perceptions of safety at work: A framework for linking safety climate to safety performance, knowledge, and motivation. J. Occup. Health Psychol. 2000, 5, 347–358. [Google Scholar] [CrossRef] [PubMed]
  35. Al-Bayati, A. Impact of Construction Safety Culture and Construction Safety Climate on Safety Behavior and Safety Motivation. Safety 2021, 7, 41. [Google Scholar] [CrossRef]
  36. Dov, Z. Safety climate and beyond: A multi-level multi-climate framework. Saf. Sci. 2008, 46, 376–387. [Google Scholar] [CrossRef]
  37. Reason, J. Organizational Accidents Revisited; CRC Press: Boca Raton, FL, USA, 2016. [Google Scholar] [CrossRef]
  38. Newton, D.W.; LePine, J.A. Organizational citizenship behavior and job engagement: “You gotta keep’em separated!”. In The Oxford Handbook of Organizational Citizenship Behavior; Oxford Library of Psychology: Oxford, UK, 2018; pp. 43–54. [Google Scholar]
  39. Griffin, M.A.; Hu, X. How leaders differentially motivate safety compliance and safety participation: The role of monitoring, inspiring, and learning. Saf. Sci. 2013, 60, 196–202. [Google Scholar] [CrossRef]
  40. Zohar, D. Modifying supervisory practices to improve subunit safety: A leadership-based intervention model. J. Appl. Psychol. 2002, 87, 156–163. [Google Scholar] [CrossRef]
  41. Barling, J.; Loughlin, C.; Kelloway, E.K. Development and test of a model linking safety-specific transformational leadership and occupational safety. J. App. Psych. 2002, 87, 488. [Google Scholar] [CrossRef]
  42. Neal, A.; Griffin, M.; Hart, P. The impact of organizational climate on safety climate and individual behavior. Saf. Sci. 2000, 34, 99–109. [Google Scholar] [CrossRef]
  43. Schneider, B.; Gonzalez-Roma, V.; Ostroff, C.; West, M. Organizational climate and culture: Reflections on the history of the constructs in the Journal of Applied Psychology. J. Appl. Psychol. 2017, 102, 468–482. [Google Scholar] [CrossRef] [Green Version]
  44. Zohar, D.; Tenne-Gazit, O. Transformational leadership and group interaction as climate antecedents: A social network analysis. J. Appl. Psychol. 2008, 93, 744–757. [Google Scholar] [CrossRef] [PubMed] [Green Version]
  45. Weick, K.E.; Sutcliffe, K.M.; Obstfeld, D. Organizing and the Process of Sensemaking. Organ. Sci. 2005, 16, 409–421. [Google Scholar] [CrossRef] [Green Version]
  46. Dragoni, L. Understanding the Emergence of State Goal Orientation in Organizational Work Groups: The Role of Leadership and Multilevel Climate Perceptions. J. Appl. Psychol. 2005, 90, 1084–1095. [Google Scholar] [CrossRef] [Green Version]
  47. Guo, B.H.W.; Yiu, T.W.; Gonzalez, V.A. Predicting safety behavior in the construction industry: Development and test of an integrative model. Saf. Sci. 2016, 84, 1–11. [Google Scholar] [CrossRef]
  48. Clark, S. The relationship between safety climate and safety performance: A meta-analytic review. J. Occup. Health Psych. 2006, 11, 315–327. [Google Scholar] [CrossRef] [PubMed]
  49. Stiles, S.; Ryan, B.; Golightly, D. Evaluating attitudes to safety leadership within rail construction projects. Saf. Sci. 2018, 110, 134–144. [Google Scholar] [CrossRef] [Green Version]
  50. Nawaz, W.; Koç, M. Development of a systematic framework for sustainability management of organizations. J. Clean. Prod. 2018, 171, 1255–1274. [Google Scholar] [CrossRef]
  51. Mohamed, S. Safety Climate in Construction Site Environments. J. Constr. Eng. Manag. 2002, 128, 375–384. [Google Scholar] [CrossRef]
  52. Woolley, M.; Goode, N.; Salmon, P.; Read, G. Who is responsible for construction safety in Australia? A STAMP analysis. Saf. Sci. 2020, 132, 104984. [Google Scholar] [CrossRef]
  53. R Core Team. R: A Language and Environment for Statistical Computing; R Foundation for Statistical Computing: Vienna, Austria, 2020. [Google Scholar]
  54. Hyndman, R.J.; Athanasopoulos, G. Forecasting: Principles and Practice; OTexts: Columbia, MO, USA, 2018. [Google Scholar]
  55. Cheung, C.M.; Zhang, R.P. How Organizational Support Can Cultivate a Multilevel Safety Climate in the Construction Industry. J. Manag. Eng. 2020, 36, 04020014. [Google Scholar] [CrossRef] [Green Version]
  56. Kasim, H.; Hassan, C.R.C.; Hamid, M.D.; Emami, S.D.; Danaee, M. The relationship of safety climate factors, decision making attitude, risk control, and risk estimate in Malaysian radiation facilities. Saf. Sci. 2018, 113, 180–191. [Google Scholar] [CrossRef]
  57. Barbaranelli, C.; Petitta, L.; Probst, T.M. Does safety climate predict safety performance in Italy and the USA? Cross-cultural validation of a theoretical model of safety climate. Accid. Anal. Prev. 2015, 77, 35–44. [Google Scholar] [CrossRef] [PubMed]
  58. Glendon, A.; Litherland, D. Safety climate factors, group differences and safety behaviour in road construction. Saf. Sci. 2001, 39, 157–188. [Google Scholar] [CrossRef]
  59. Alruqi, W.M.; Hallowell, M.R. Critical success factors for construction safety: Review and meta-analysis of safety leading indicators. J. Constr. Eng. Manag. 2019, 145, 04019005. [Google Scholar] [CrossRef]
  60. Guzman, J.; Recoco, G.A.; Pandi, A.W.; Padrones, J.M.; Ignacio, J.J. Evaluating workplace safety in the oil and gas industry during the COVID-19 pandemic using occupational health and safety Vulnerability Measure and partial least square Structural Equation Modelling. Clean. Eng. Technol. 2022, 6, 100378. [Google Scholar] [CrossRef]
  61. Stoilkovska, B.B.; Pančovska, V.; Mijoski, G. Relationship of safety climate perceptions and job satisfaction among employees in the construction industry: The moderating role of age. Int. J. Occup. Saf. Ergon. 2015, 21, 440–447. [Google Scholar] [CrossRef] [PubMed]
  62. Siu, O.-L.; Phillips, D.R.; Leung, T.-W.; Siu, O.-L.; Phillips, D.R.; Leung, T.-W. Age differences in safety attitudes and safety performance in Hong Kong construction workers. J. Saf. Res. 2003, 34, 199–205. [Google Scholar] [CrossRef] [Green Version]
  63. Wadick, P. Safety culture among subcontractors in the domestic housing construction industry. Struct. Surv. 2010, 28, 108–120. [Google Scholar] [CrossRef]
  64. Lingard, H.; Oswald, D. Safety at the Front Line: Social Negotiation of Work and Safety at the Principal Contractor–Subcontractor Interface. J. Constr. Eng. Manag. 2020, 146, 1–11. [Google Scholar] [CrossRef]
  65. Smith, G. Paper Safe: Triumph of Bureaucracy in Safety Management; G Smith: Perth, Australia, 2018; pp. 7–8. [Google Scholar]
Figure 1. Comparative Age Demographic (n = 166).
Safety 08 00077 g001
Figure 2. Participating Organizations.
Safety 08 00077 g002
Figure 3. Comparative Participation by Roles.
Safety 08 00077 g003
Figure 4. Safety Communication Average Scores by Participants (n = 166).
Safety 08 00077 g004
Figure 5. Estimated Marginal Means Distribution by Organization Safety Communication.
Safety 08 00077 g005
Figure 6. Estimated Marginal Means Distribution by ORGANISATION for Safety Communication.
Safety 08 00077 g006
Figure 7. Communication Safety Perceptions by COVID and AGE Factors (n = 166).
Safety 08 00077 g007aSafety 08 00077 g007b
Figure 8. (a) Hazard observation rate by COVID Phase, (b) Hazard observation rate under different Project Leaders.
Safety 08 00077 g008
Figure 9. (a) Total incident rate by COVID Phase, (b) Total incident rate under different Project Leaders.
Safety 08 00077 g009
Figure 10. (a) Supervisor observation & intervention rate by COVID Phase, (b) Supervisor observation & intervention rate under different Project Leaders.
Safety 08 00077 g010
Figure 11. (a) MAP check rate by COVID Phase, (b) MAP check rate under different Project Leaders.
Safety 08 00077 g011aSafety 08 00077 g011b
Table 1. Project Details.
Project ParametersDetails
LocationPilbara Western Australia
ScopeInfrastructure–earthworks, rail formation, tunnel, and bridges
Contract ModelProcure, Construct
Contract StructureJoint Venture–self perform with specialist sub-contractors
Workhours1,120,000 with 270 persons on site at peak
DurationTotal: 23 months. On site: 16 months
Value>$500 k AUD
Table 2. Structure of Safety Perception Survey.
Organizational ElementsLikert Scale Units–Group of Questions
Company (ORG Avg)Management Commitment (MC Avg)
Communication (COM Avg)
Rules and Procedures (RUL Avg)
Overall Safety Climate
Team (TEAM Avg)Supportive Environment (SUP Avg)
Supervisory Environment (VIS Avg)
Workers Involvement (WI Avg)
Individual (IND Avg)Personal Appreciation of Risk
Work Hazard Identification (HAZ Avg)
Work Pressure (WKP Avg)
Competence (CMP Avg)
Context QuestionsSafety Risks
Safety Improvements
Table 3. Summary of Project Safety Performance Data-Risk Management Activities (Weekly).
MeasureUnit
Personal Risk Assessments% completed a
Hazard Reports% completed
Supervisor Observations and Interventions% completed
Major Accident Prevention (MAP) Critical Control Checks% completed
Major Accident Prevention (MAP) Audits% completed
Exposure hoursCount
Total number of incidentsCount
Total incident frequency ratesFrequency rate b
a % completed = (number of activities completed/planned number of activities) per 100. b Frequency rate = No of injuries in period per 1,000,000/exposure hours in period.
Table 4. Safety Climate Survey Likert Scale & Organization Elements ANOVA Results.
Factor: COVID-19 (df 1:154)
Likert ScaleSum SquaresMean SquareF ValuesPr (>F)Significant
Communication4.4554.45512.063<0.001Yes
Supporting Environment0.0000.000030.00010.994-
Work Hazard Identification0.0580.0580.1070.744-
Workers Involvement0.5000.50031.0870.299-
Individual Element0.0320.0320.1220.727-
Team Element0.0030.0030.0080.929-
Factor: ORGANIZATION (df 2:154)
Likert ScaleSum SquaresMean SquareF valuesPr (>F)Significant
Communication0.0280.0280.7720.782-
Supporting Environment2.2741.1372.1680.118-
Work Hazard Identification4.6234.6238.5150.004Yes
Workers Involvement2.7822.7816.0420.015Yes
Individual Element1.0181.0183.9160.049Yes
Team Element2.1952.1946.9660.009Yes
Factor: GENDER (df 2:154)
Likert ScaleSum SquaresMean SquareF valuesPr (>F)Significant
Communication0.3840.1920.5950.594-
Supporting Environment0.2870.1430.2720.761-
Work Hazard Identification0.0620.0310.0570.944-
Workers Involvement0.2340.1170.2540.776-
Individual Element0.0080.0040.0150.985-
Team Element0.3260.1630.5170.597-
Factor: AGE (df 6:154)
Likert ScaleSum SquaresMean SquareF valuesPr (>F)Significant
Communication3.9150.6521.7670.109 *Outliers skew
Supporting Environment11.0391.8393.5080.003Yes
Work Hazard Identification1.9960.3330.6130.719-
Workers Involvement3.3700.5611.2190.299-
Individual Element1.0000.1670.6410.697-
Team Element3.7520.6351.9840.071 *Outliers skew
* Further model analysis required given data distribution across the groups with potential outliers skewing results.
Table 5. Safety Communication by Age Group Estimated Marginal Means Across COVID Phase.
Age Group Estimate Marginal MeanStandard ErrorT ValuePr (>[t])
30–390.0690.1400.4950.621
40–4903590.1602.2460.026
50–590.1290.1650.7810.436
60–690.3620.2041.7720.078 1
1 significant at 10% confidence level when further tested ad hoc by Tukey (HSD).
Table 6. Safety perceptions for Work Hazard Identification and Workers Involvement.
Likert ScaleF ValuePr > (F)Emmeans (Principal Contractor/Subcontractor)
Work Hazard Identification8.5150.004−0.428
Workers Involvement6.0420.016−0.298
Table 7. Organizational Factors for Team and Individual Elements of Safety Perceptions.
Likert ScaleF ValuePr > (F)Emmeans (Principal Contractor/Subcontractor)
Team6.9840.009−0.304
Individual3.9160.049 *−0.214
* Confirmed not to be different when measured by post hoc Tukey analysis.
Table 8. Summary of Significance by Safety Climate Measure and Project Factors.
Safety Climate
Measure
Project Factors
COVIDOrganizationAgeGender
Safety communicationYesYesYes *-
Supporting environment--Yes-
Work Hazard Identification-Yes--
Worker Involvement-Yes--
Individual-Yes--
Team-Yes--
* Specific age groups.
Table 9. Safety Performance for COVID and LEADER Factors–ANOVA Results.
Factor: COVID-19 (df 1:68)
Performance IndicatorSum SquaresMean SquareF ValuesPr (>F)Significant
Hazard Observations0.1640.1640.8190.369-
Supervisor Observations7.7697.7698.1920.0056Yes
Critical Control Verifications0.5430.5430.2950.589-
Total Incident Rate703,387703,38719.9373.096 × 10−5Yes
Factor: ORGANIZATION (df 2:154)
Performance IndicatorSum SquaresMean SquareF valuesPr (>F)Significant
Hazard Observations7.6247.62438.6873.49 × 10−8Yes
Supervisor Observations6.4016.4016.7490.011Yes
Critical Control Verifications33.73733.73718.3565.905 × 10−5Yes
Total Incident Rate19,05919,0590.5400.469-
Publisher’s Note: MDPI stays neutral with regard to jurisdictional claims in published maps and institutional affiliations.

