Article

Use of Virtual Reality to Increase Awareness of Line-of-Sight Hazards around Industrial Equipment

Centre for Research in Occupational Safety and Health, School of Kinesiology and Health Sciences, Laurentian University, Sudbury, ON P3E 2C6, Canada
*
Author to whom correspondence should be addressed.
Safety 2022, 8(3), 52; https://doi.org/10.3390/safety8030052
Submission received: 24 May 2022 / Revised: 1 July 2022 / Accepted: 11 July 2022 / Published: 14 July 2022

Abstract

:
Impaired operator line of sight has been implicated in several pedestrian–equipment accidents and fatalities in the mining industry. Existing training methods for conveying visibility information lack worker engagement and may be insufficient to capture the dynamic, three-dimensional nature of blind spots around industrial equipment. The present study utilized a custom virtual reality experience intended to shift the way in which visibility information is presented. Visibility knowledge, confidence levels and safe pedestrian behaviors around the load-haul-dump vehicle were examined among participants in control and experimental (virtual reality and conventional training) groups (n = 72). Results demonstrate that the virtual reality intervention was not effective for increasing visibility knowledge and safe pedestrian behaviors relative to controls, although the performances of the virtual reality and conventional training groups were comparable. A discrepancy was identified in the perceived versus actual visibility knowledge and safe pedestrian behaviors at the rear of the load-haul-dump vehicle among the virtual reality training group. The findings suggest poor knowledge transfer between the three-dimensional virtual reality experience and the two-dimensional visibility plot used. The work also speaks to the importance of emphasizing rear-facing visibility deficits around machinery within industry safety training materials.

Graphical Abstract

1. Introduction

The load-haul-dump (LHD) is a large haulage vehicle used in underground mining operations to transport raw materials along the narrow tunnel drifts of a mine [1,2]. LHD operators must have sufficient sight lines in order to effectively identify and respond to pedestrians, equipment and other hazards in the surrounding environment [3]. The visibility profile of an LHD vehicle is known to be quite poor, which has been attributed to a number of positional, design and environmental factors [2,3,4,5,6,7]. In a three-dimensional visibility analysis modeled with Classic JACK software, Eger and colleagues found that operators of five LHD models had between 20–55% visibility within a 470 m2 box plot area [2]. Operators of LHD vehicles sit sideways to the direction of travel to accommodate the bi-directional nature of the machine. This seating position has been associated with impaired line of sight (LOS), particularly on the side opposite to the operator and at ground heights of 2 m or less [2,3,5,8]. Eger and colleagues identified the front right corner of the LHD as the region with the poorest visibility around the LHD, requiring a 1.7 m tall pedestrian to stand over 4 m from the LHD bucket to be seen by the operator [3].
There are limited data available concerning the visibility-related accidents and fatalities occurring in LHD vehicles. In Ontario, the mining industry has the second-highest fatality rate from workplace incidents, despite accounting for less than 1% of provincial employment [8]. In a review by Groves and colleagues, the LHD accounted for 5% of the 190,940 fatalities and injuries analyzed [9]. Accidents and fatalities resulting from pedestrian–equipment interactions continue to be problematic, despite legislated attempts to mitigate the problem. Struck-by, crushing and pinning incidents between pedestrians and equipment have accounted for nearly 60% of fatalities between 1996 and 2009 in the Ontario mining industry [10]. Within this period, poor visibility due to restricted line-of-sight (LOS) among equipment operators was cited as a causal factor in four coroner inquests [11]. A review of visibility-related fatalities in the construction industry identified that 72.6% of equipment-related incidents occurred when the vehicles were driving in reverse [6]. Further, underground mining vehicles have been identified as a key hazard implicated in work-related injuries and fatalities [10,12,13]. The Mines and Aggregates Safety and Health Association (MASHA) reported 117 accidents involving LHDs per year in Ontario mines between 1986 and 2002, citing impaired LOS as a contributing factor [5]. Although fatality rates in the mining sector are declining, much work is to be carried out to eliminate workplace deaths caused by pedestrian–equipment interactions.
Equipment operators and pedestrians working in underground mines must be capable of accurately perceiving the level of risk inherent to one’s work environment, namely, as it relates to visibility hazards. In doing so, workers acquire the knowledge to engage in rapid and effective hazard detection, thus facilitating accident prevention. Some research suggests a mismatch between the actual and perceived visibility reported by operators and pedestrians around mobile equipment [14]. Leduc and colleagues documented a difference between the actual and perceived visibility among operators and spotters of construction equipment, with many estimates being both overestimated by considerable amounts [14]. For instance, visibility to ground level at the rear of a dump truck is virtually nonexistent, yet survey respondents ranked it, on average, between 2 to 3 on a 5-point scale [14]. Similarly, researchers have identified inconsistencies in the perceived versus actual vehicle design components causing impaired LOS among operators of LHD vehicles [3]. These discrepancies in LOS perception represent an errant mental model, which may point to insufficient or ineffective training methods.
Trainees generally obtain workplace safety knowledge by means of occupational health and safety training sessions, peer observations and accident exposures [15,16,17]. Safety knowledge obtained from peer observations is particularly susceptible to misinformation due to potential biases in the attitudes, practices and perceptions of safety held by workers [16,18]. Conventional training methods (i.e., videos, lectures, written materials) are passive in nature and lack worker involvement, which can result in reduced concentration levels during training sessions and/or negative safety outcomes [19,20,21]. A meta-analysis by Burke and colleagues demonstrated that training forms lacking worker engagement were approximately three times less effective for knowledge and skill acquisition when compared to training forms with moderate to high engagement [20]. Materials delivered in conventional training sessions tend to be unchanged year after year, with large volumes of information being presented in a short period of time [22].
Visibility topics may be absent from formal occupational health and safety training materials [14]. One-third of LHD operators in a study by Eger and colleagues reported that visibility-related issues around mobile equipment were not discussed during training or in safety meetings [3]. For those who receive formal visibility training, blind spots around mobile equipment are commonly depicted using 2D diagrams [23]. This may be problematic, particularly for pedestrians without experience in operating large machinery, as it is difficult to conceive the dimensions of a three-dimensional, moving blind space around a particular piece of machinery. Differences in pedestrian visibility at the head and foot level, for example, may not be captured on a 2D blind spot depiction. The factors presented with respect to conventional training methods suggest that an alternate method of training should be pursued [23].
Li and Tay suggest that gaming may be a more attractive learning format for refreshing previously learned knowledge [24]. Many high-risk domains have employed the use of virtual reality (VR) for safety-related training, including aviation, defense, surgery and transportation [25]. Using VR for safety training has been considered advantageous because trainees can gain repetitive exposure to hazardous scenarios without being subjected to undue risk [21,25]. In a pilot study by Godwin and colleagues (2016), novice participants could more accurately draw a true representation of limited visibility around a mining machine after having viewed a VR video from the operator’s perspective [26]. In virtual environments, trainees can be immersed in hazardous scenarios that would otherwise be arduous or impossible to replicate in real life, demanding significant time, money, equipment or personnel [21,27,28]. Additionally, VR can be modified to reflect various equipment, work environments and language preferences, while offering an avenue to quantify trainee performance prior to hazard exposure in real life [23]. VR training is thought to facilitate the development of perceptuomotor and decision-making skills because trainees can immediately observe the outcomes of their decisions or actions, unlike conventional training forms [21,25]. Moreover, safety training using VR has been explored as a way to facilitate improvements in hazard detection among trainees [27,28,29,30,31], with some studies showing beneficial effects [19,32,33,34]. This is meaningful because the failure to recognize a hazard is a known contributor to fatalities and injuries [35].
The visibility profile of an LHD vehicle is fairly poor, and the high prevalence of visibility-related fatalities emphasizes the motivation to develop adequate visibility training interventions. Conventional forms of visibility-related training commonly utilize static, two-dimensional (2D) depictions of LOS, which may have poor transfer of knowledge to the dynamic, three-dimensional environments present around industrial equipment in underground mines. Hence, we sought to develop a VR environment that allows participants to interact with the concept of blind spots around industrial equipment in a novel context. The purpose of this study was to assess whether virtual reality training has increased efficacy for enhancing visibility knowledge, confidence and safe behaviors around LHD vehicles relative to desktop training methods. Second, we intended to determine whether there are differences in the perceived versus actual visibility knowledge and safe pedestrian behaviors. It is hypothesized that the VR training group will experience benefits relative to desktop training and control groups for (1) confidence remaining in operator LOS in the forward and reverse directions, (2) visibility knowledge and (3) safe pedestrian behaviors around LHD vehicles.

2. Materials and Methods

Seventy-two university students from Laurentian University in Sudbury, Canada, participated in the experiment after providing informed consent. Participants were randomly assigned to either the control group (n = 25; age range 19–32; mean (SD) 21.46 (2.43); 8 men and 17 women) or one of two intervention groups: VR (n = 21; age range 19–40; mean (SD) 21.62 (4.40); 10 men and 11 women) or desktop training (n = 26; age range 21–35; mean (SD) 24.35 (4.04); 18 men and 8 women). A convenience sample method was utilized, whereby participants from three classes at Laurentian University were assigned to one of three intervention groups: control, desktop training or VR training (Figure 1). A small proportion of participants reported having some experience with mining equipment (control n = 0; 0%; desktop n = 4; 15.38%; VR n = 4; 19.05%). The experimental protocol was approved by the Laurentian University Research Ethics Board (REB file 6006069) and is in accordance with the Tri-Council Policy Statement: Ethical Conduct for Research Involving Humans.
Participants were not permitted to participate in more than one intervention. Participants from all three intervention groups completed a visibility questionnaire following their intervention, when applicable. The participants assigned to the control group completed the visibility questionnaire with no education or contextual information provided. The desktop intervention was intended to mimic a desktop training experience and, as such, incorporated a 5 min verbal education period and a diagram of the operator’s blind spots surrounding an LHD vehicle. The education component was delivered by the researchers and contained information about the orientation of the LHD operator relative to the machine’s direction of travel. Lastly, the participants assigned to the VR group were immersed in a 10 min VR experience in which they operated a virtual LHD vehicle within an immersive underground mine environment. The operator sits sideways to the direction of travel and is able to observe and interact with the interior and exterior of the LHD.
The VR environment was configured using the Unity 3D game engine, C# and C++ processing languages and Arduino SDK programing. The virtual environment is built for the Oculus Rift Developer Kit 2 (DK2) headset, joystick and foot pedals, allowing participants to maneuver the LHD through the mine to collect ore at one of two muck piles and then return to deposit ore at the ore pass. The LHD vehicle’s direction of movement reflected the way the machine movement was explained in desktop training. While the desktop training group were verbally educated on the operator’s orientation relative to the machine’s direction of movement, VR group participants were able to experience this unique orientation in the VR training module. The participants were prompted to avoid potential hazards in the virtual environment, including the walls and ceilings of the mine drifts, pedestrians, and other industrial equipment. The dimensions of the LHD model used in this study were 18.9 m length, 4.7 m width and 4.2 m height. With the joystick, users were able to steer, control the position of the LHD bucket and change the gears of the LHD (1, 2, neutral, reverse 1 or reverse 2). The foot pedals were used to accelerate and brake within the virtual environment. This particular aspect may not be representative of driving a real-world LHD; however, it is consistent with passenger-vehicle driving, allowing for a university population to be used as study participants. The virtual mine can include up to five pedestrians and up to three other industrial vehicles, each of which have a designated location within the simulated environment. The virtual reality training allowed participants to experience the blind spots around an LHD vehicle shown in the traditional training in three dimensions.
Demographics were obtained from all participants regarding age, sex and experience with mining equipment. Participants then completed a four-item self-assessment of confidence, perceived visibility knowledge and behaviors, consisting of one multiple-choice question and four 5-point Likert scale questions (Figure A1). Responses from the Likert scale questions were assigned a value of 0 (if ≤2) or 1 (if ≥3). Additionally, the researchers designed a custom 11-item quantitative multiple-choice questionnaire (MPQ) to address the participants’ theoretical knowledge of and behaviors around industrial equipment. The MPQ consisted of one free-hand shading task on an LHD visibility plot and 10 multiple-choice questions, among which were several LOS scenarios involving an LHD vehicle (Figure A2, Figure A3, Figure A4, Figure A5 and Figure A6). The multiple-choice questions were scored out of 2 points each, whereby one option was the most correct (value of 2), another option may have been reasonably correct (value of 1), and the other two options were incorrect (value of 0). The sum of the answers (on a total score of 22) was analyzed, and further, questions were grouped into two areas of focus, and scores were tallied for LOS scenarios involving both forward and backward travel of the LHD (4 questions each).
Statistical analyses were conducted using IBM SPSS Statistics version 26.0.0.1. Descriptives are presented using frequencies due to the categorical nature of the data. A Shapiro–Wilk test was performed on all variables to determine if they were normally distributed. Non-parametric tests were utilized to account for the non-normal data distribution. Categorical variables were analyzed using the chi-square or Fisher’s exact test (2 × c), on the basis of the expected cell counts. Findings were considered statistically significant if p < 0.05. The Kruskal–Wallis test was used to test for differences between the intervention groups. For post hoc multiple comparisons, the Mann–Whitney U-test was used to conduct pairwise comparisons between groups. A Bonferroni correction was applied to correct for increased risk of Type I errors, with statistical significance set at p < 0.0167.

3. Results

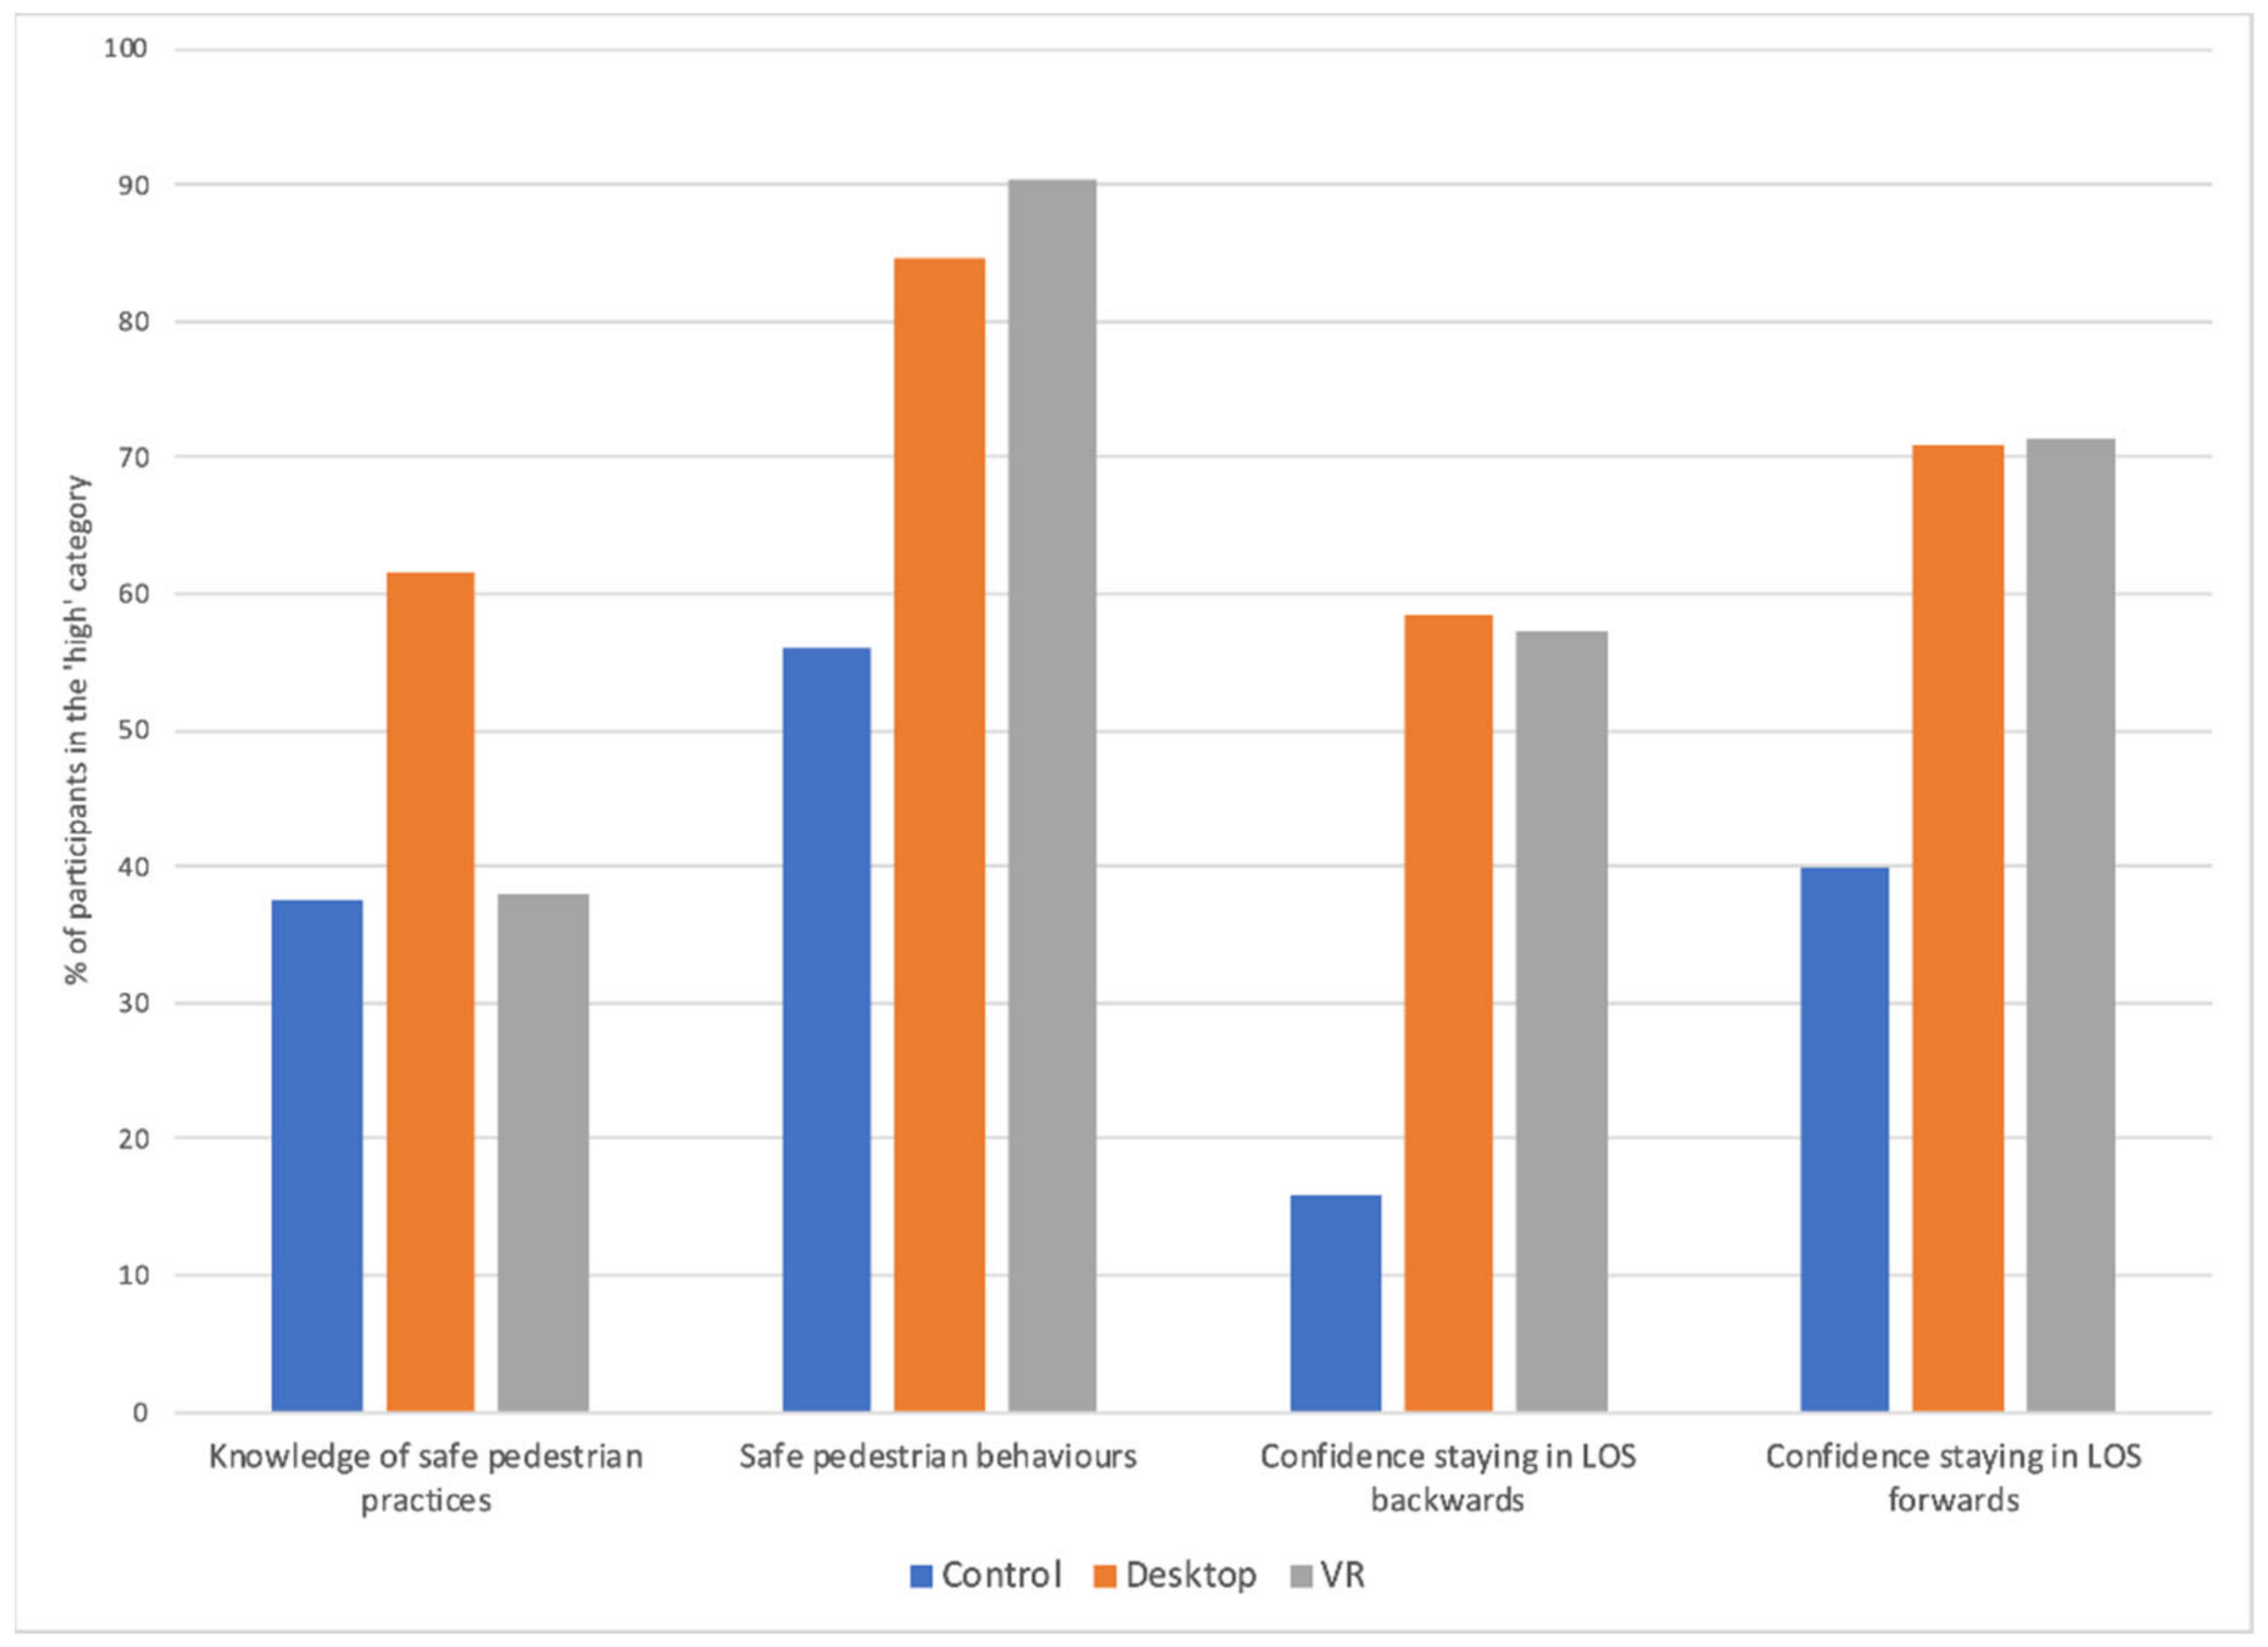
3.1. Self-Assessment of Confidence, Knowledge and Behaviors

All participants completed a four-item self-assessment of perceived visibility knowledge, safe pedestrian behaviors and confidence in remaining in operator LOS in the forward and backward directions.

3.1.1. Self-Assessment of Safe Pedestrian Behaviors and Knowledge

The control group participants ranked their levels of safe pedestrian behaviors lower than those in the VR and desktop groups, which ranked similarly (Figure 2). Comparatively, the desktop group participants ranked their knowledge of safe pedestrian practices higher than those in the control and VR groups, which ranked similarly (Figure 2). Independence of categorical variables was assessed using a chi-square or Fisher’s exact test on the basis of the expected cell counts. Results indicated that a greater proportion of controls (44%, n = 11) than expected reported low perceived levels of safe pedestrian behaviors around industrial equipment (χ2(2) = 10.224, p = 0.006). Results of the Kruskal–Wallis test supported this finding, which indicates that the perceived levels of safe pedestrian behaviors were significantly different between the intervention groups, H(2) = 10.080, p = 0.006 (Table 1). Reported safe pedestrian behaviors were significantly higher among the VR (91% in ‘high’ category, n = 19) and desktop (88% in ‘high’ category, n = 22) groups compared to controls (U = 172.000, z = −2.558, p = 0.011, r = −0.301; U = 212.500, z = −2.494, p = 0.013, r = −0.294), although no significant differences were found between VR and desktop groups.

3.1.2. Self-Assessment of Confidence in Remaining in Operator LOS

Control group participants ranked their confidence levels in staying within operator LOS in the forward and backward directions lower than those in the VR and desktop groups, which ranked similarly (Figure 2). Control group participants also reported greater than expected levels of low confidence (84%, n = 21) remaining in the operator’s LOS while driving in reverse (χ2(2) = 10.906, p = 0.004). This finding was supported by the results of the Kruskal–Wallis and Mann–Whitney U-tests, indicating that confidence in remaining in LOS in the reverse direction was significantly different between the intervention groups, H(2) = 10.753, p = 0.005 (Table 1). Confidence levels in remaining in operator LOS in the reverse direction were significantly higher among VR (57% in ‘high’ confidence category) (U = 154.500, z = −2.886, p = 0.004, r = −0.340) and desktop (58% in ‘high’ confidence category) (U = 187.500, z = −2.917, p = 0.004, r = −0.344) groups compared to controls (16% in ‘high’ confidence category), although no significant differences in confidence were found between the desktop and VR groups.
Results of the chi-square test also indicate that male participants (forward 72%, n = 26; reverse 56%, n = 20) reported higher than expected confidence, while female participants (forward 54%, n = 19; reverse 71%, n = 25) reported lower than expected confidence in their ability to remain within operator LOS in forward and reverse directions (χ2(1) = 5.161, p = 0.031; χ2(1) = 5.296, p = 0.031). Furthermore, the results of Fisher’s exact test demonstrate that participants with some mining experience (100% in ‘high’ knowledge category, n = 8) showed significantly greater perceived knowledge of safe pedestrian behaviors around industrial equipment compared to participants without mining experience (41% in ‘high’ knowledge category, n = 26) (RR 0.413; 95% CI, 0.307–0.554, p = 0.002). The proportion of participants reporting high levels of confidence in remaining in the operator’s LOS while driving both forwards and backwards was significantly higher among the subgroup with mining experience (forward 100%, n = 8; reverse 88%, n = 7) compared to those without (forward 54%, n = 34; reverse 37%, n = 23) (RR 0.540; 95% CI, 0.430–0.678, p = 0.018; OR 12.174; 95% CI, 1.41–105.26, p = 0.008). When accounting for age (≤22 years or x ≥ 23 years), there were no unexpected counts in any category. All other categories in the remaining variables of sex, mining experience and intervention group were non-significant for measures of perceived knowledge, safe pedestrian behaviors and confidence levels.

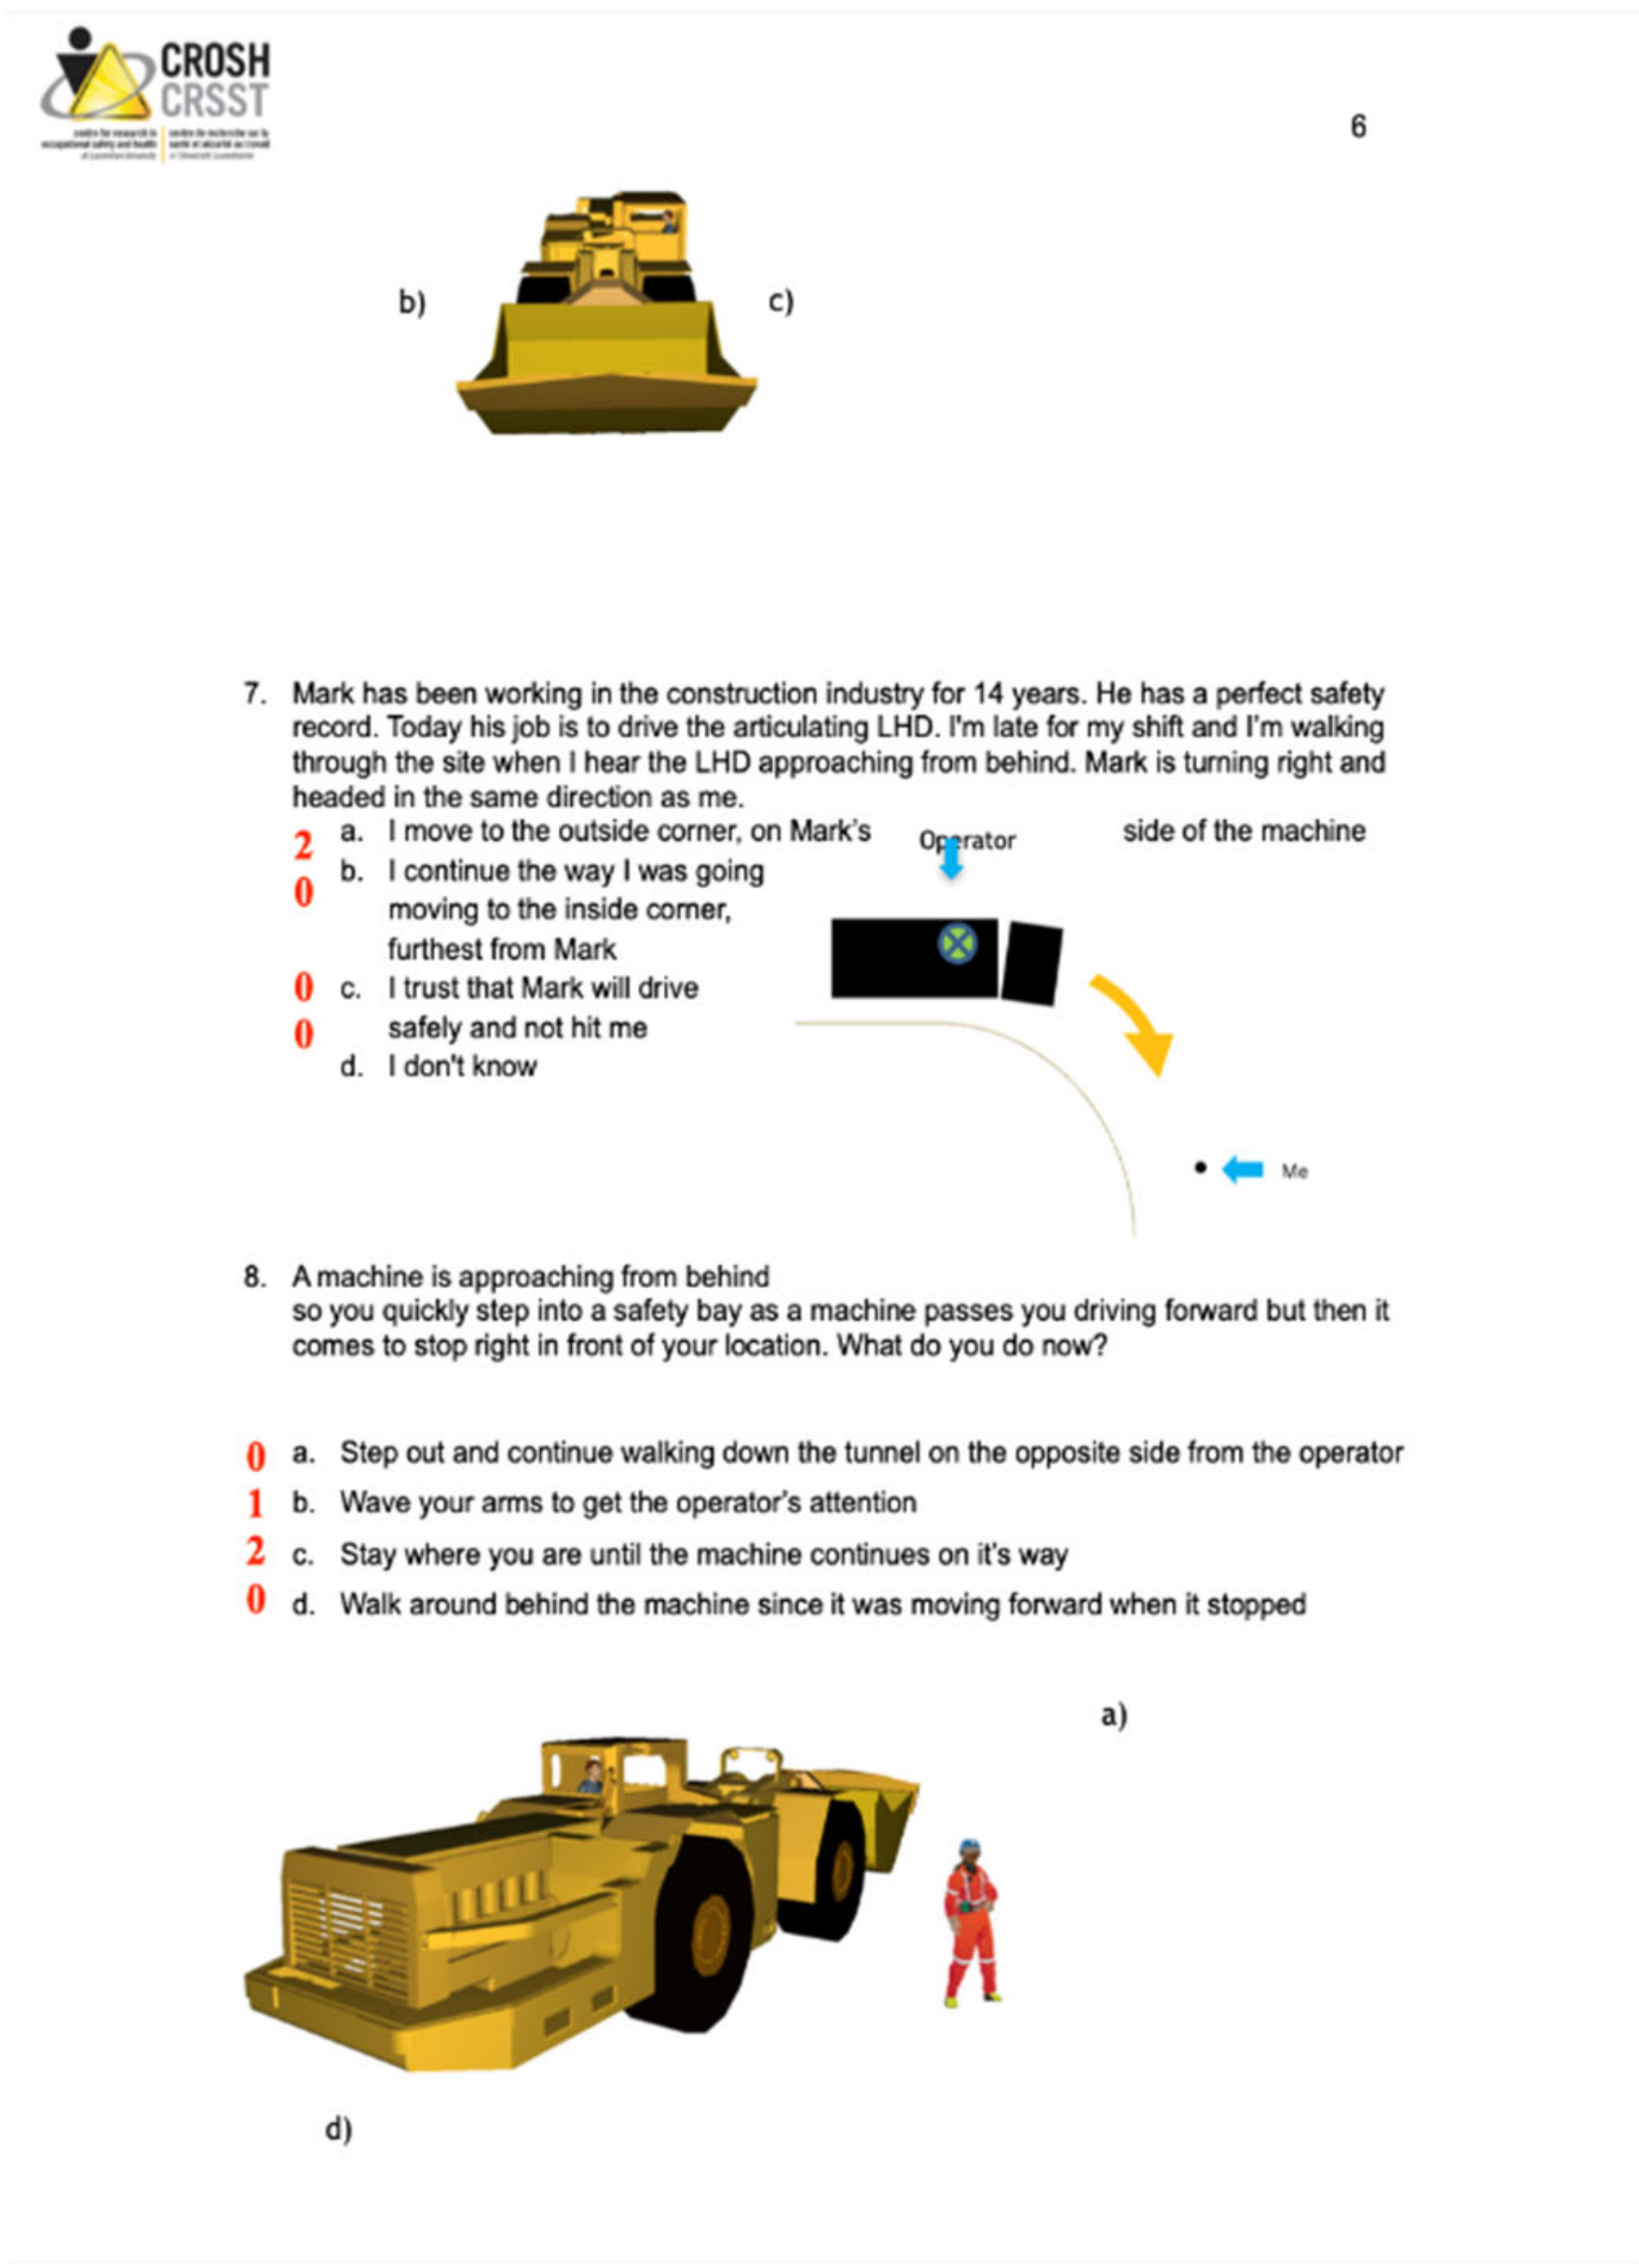
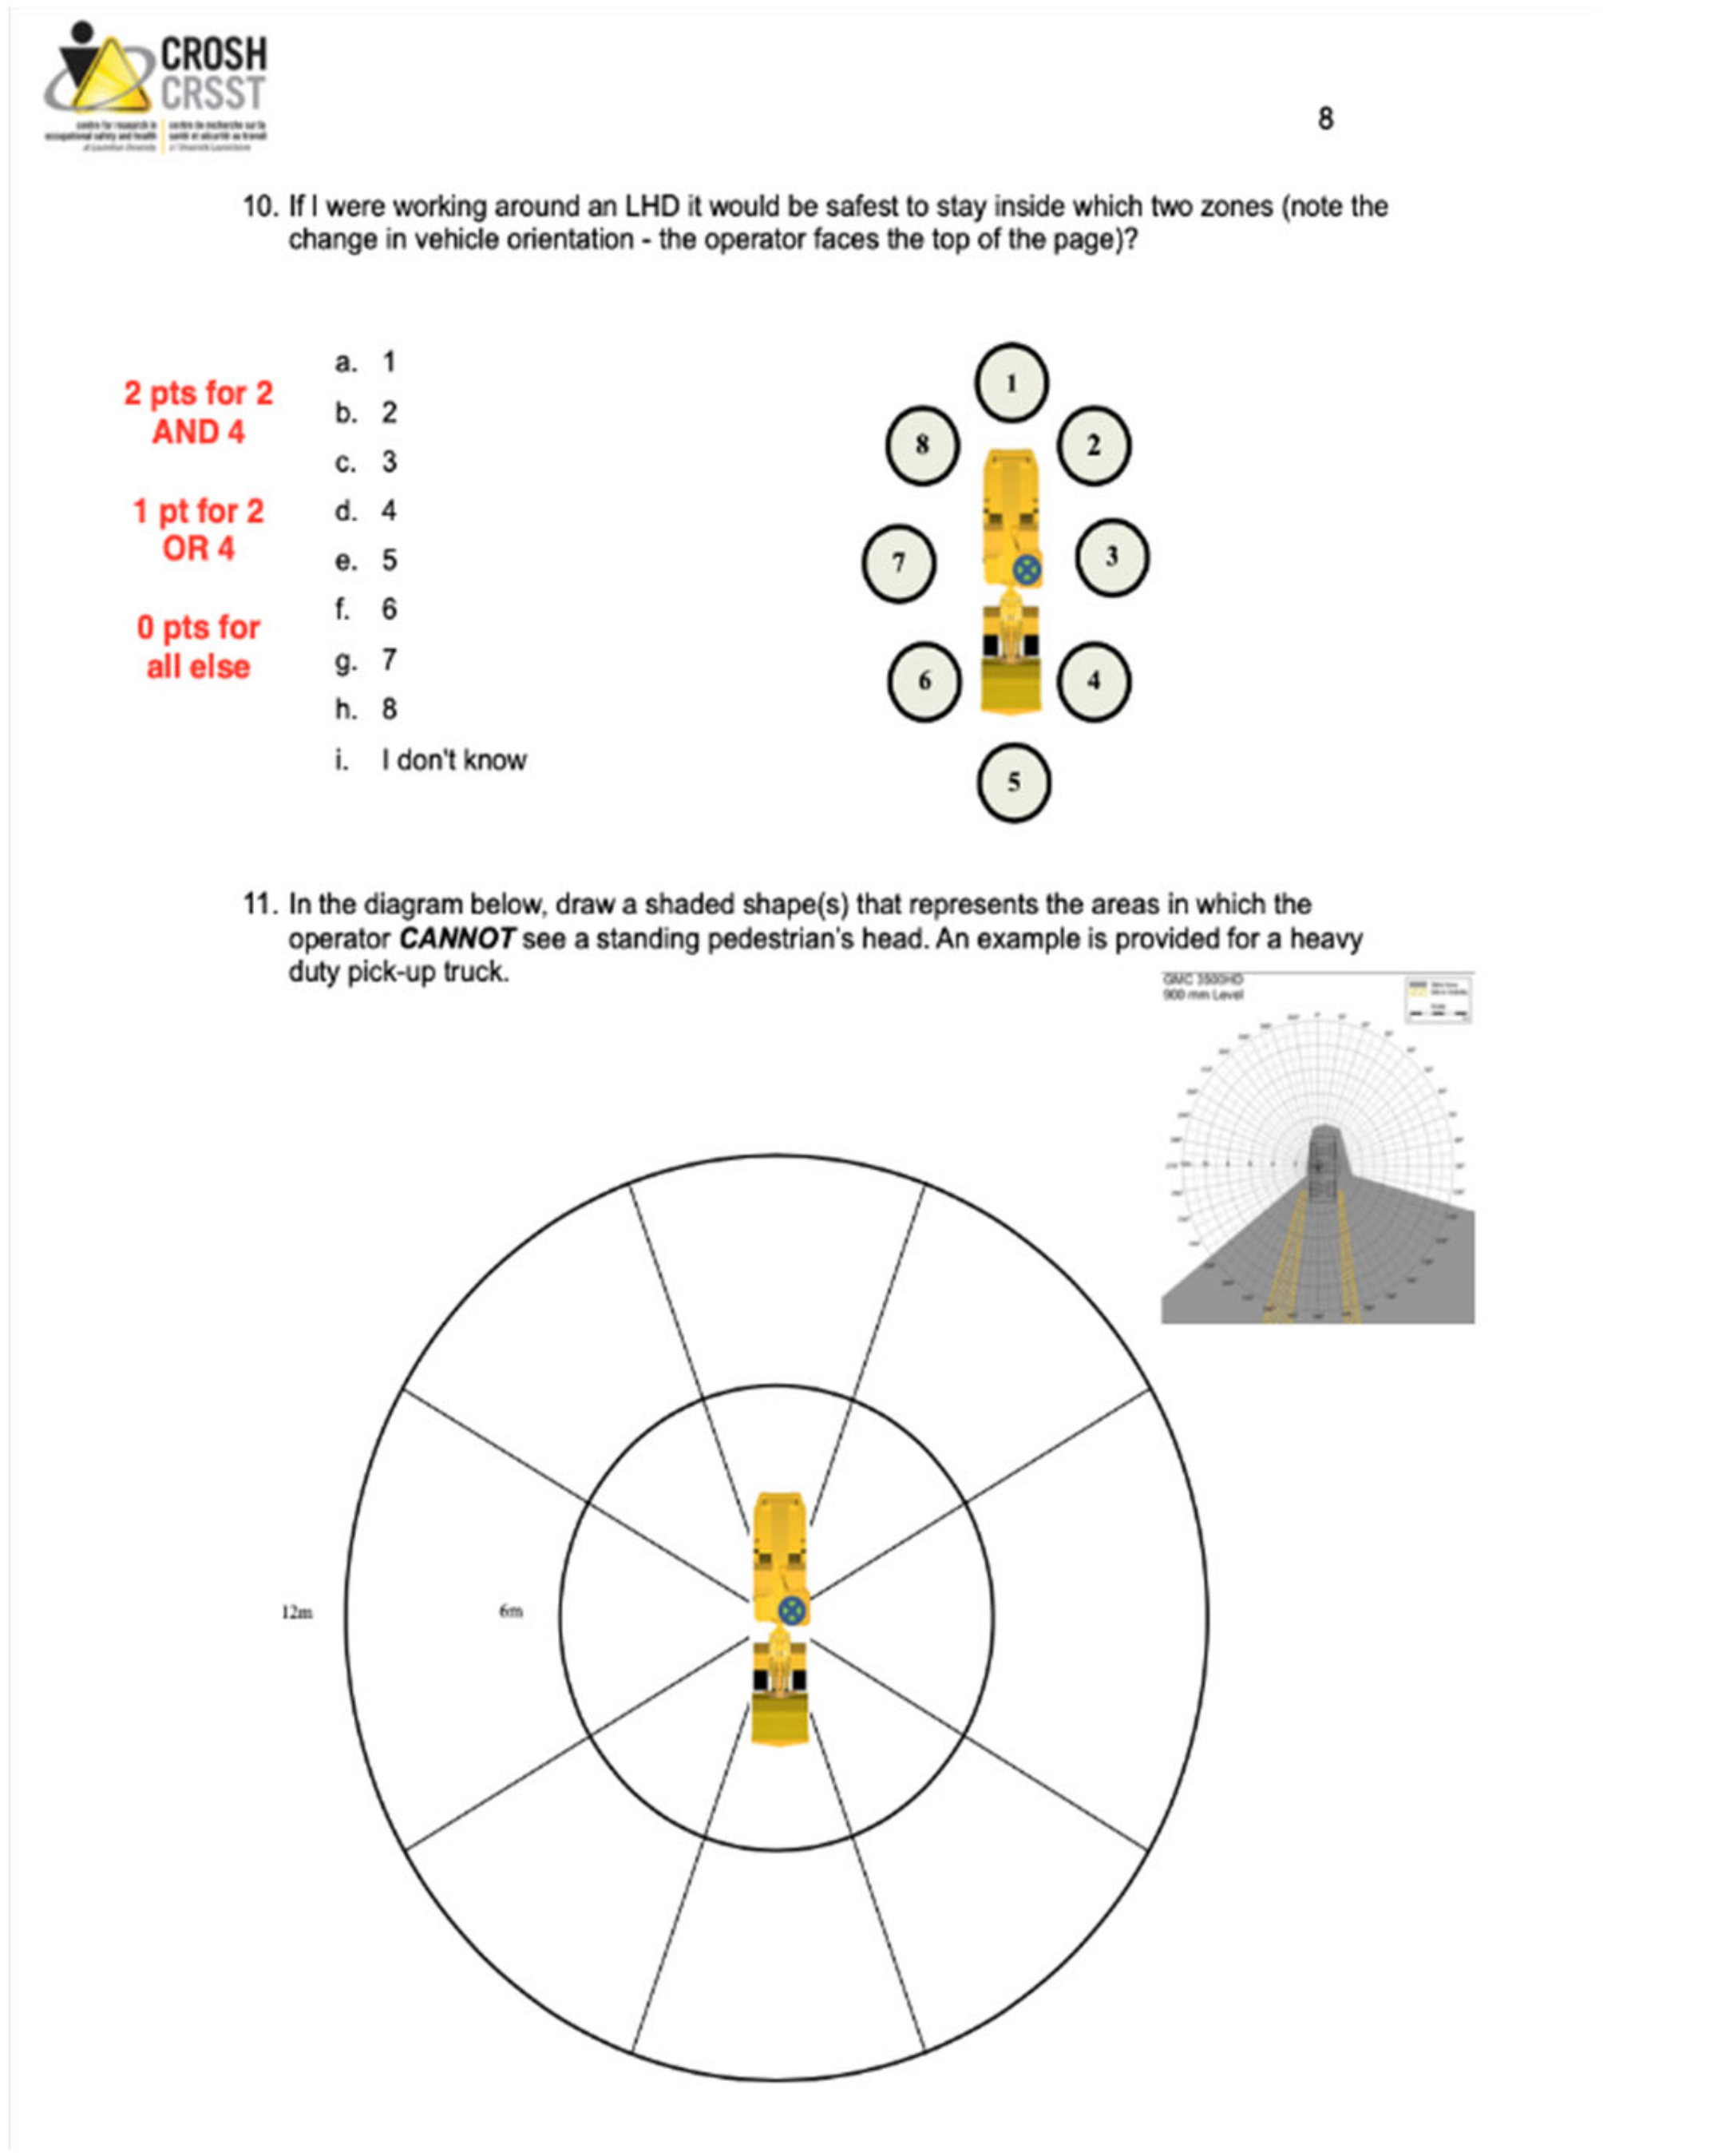
3.2. Multiple-Choice Questionnaire

The second part of the mixed-methods questionnaire included an 11-item MPQ assessing theoretical visibility knowledge and pedestrian behaviors around an LHD vehicle. Total questionnaire scores for each group were analyzed in conjunction with groupings of rear-facing and front-facing question scores using the Kruskal–Wallis and Mann–Whitney U-tests. The levels of visibility knowledge and safe pedestrian behaviors measured by the MPQ were generally low among all participants, as total questionnaire scores averaged 66% or lower. The VR group achieved scores approaching or slightly above 80% on front- and rear-facing subgroups. The VR group participants scored marginally higher relative to the control and desktop groups on the total, front-facing and rear-facing scores, although the differences were not significant due to the high variability present among the data (Figure 3). Findings of the Kruskal–Wallis test indicate that total, front-facing, rear-facing questionnaire scores did not significantly differ between the intervention groups, H(2) = 2.467, p = 0.291, H(2) = 3.656, p = 0.161, H(2) = 3.438, p = 0.179 (Table 1).
When questions were examined independently, significant between-group differences were found for two out of eleven questions. Among these were a rear-facing LOS scenario (question 2), which was significantly different between the intervention groups, H(2) = 12.928, p = 0.002. The VR and desktop training groups scored higher on this question when compared to controls (U = 130.000, z = −3.494, p = 0.000, r = −0.412; U = 230.000, z = −2.077, p = 0.038, r = −0.245). Score differences between the control and desktop groups are presented, despite being non-significant with a Bonferroni correction because a p value of less than 0.05 is given, and the association is approaching a medium effect size. Question scores also differed significantly between groups on an LOS scenario pertaining to safest practices for approaching an LHD, H(2) = 6.066, p = 0.048. Interestingly, the post hoc analysis showed significantly higher scores among controls compared to participants in the desktop training group (U = 205.000, z = −2.419, p = 0.016, r = −0.285), whereas no other groups differed significantly.

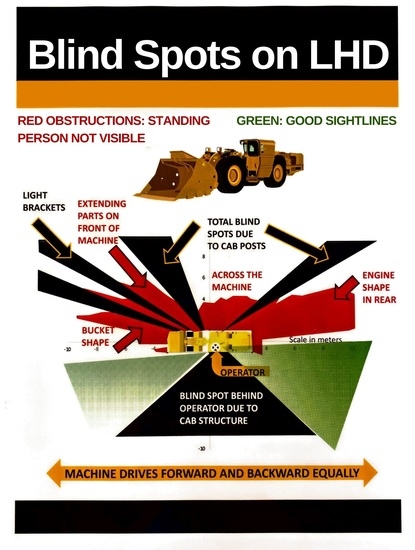
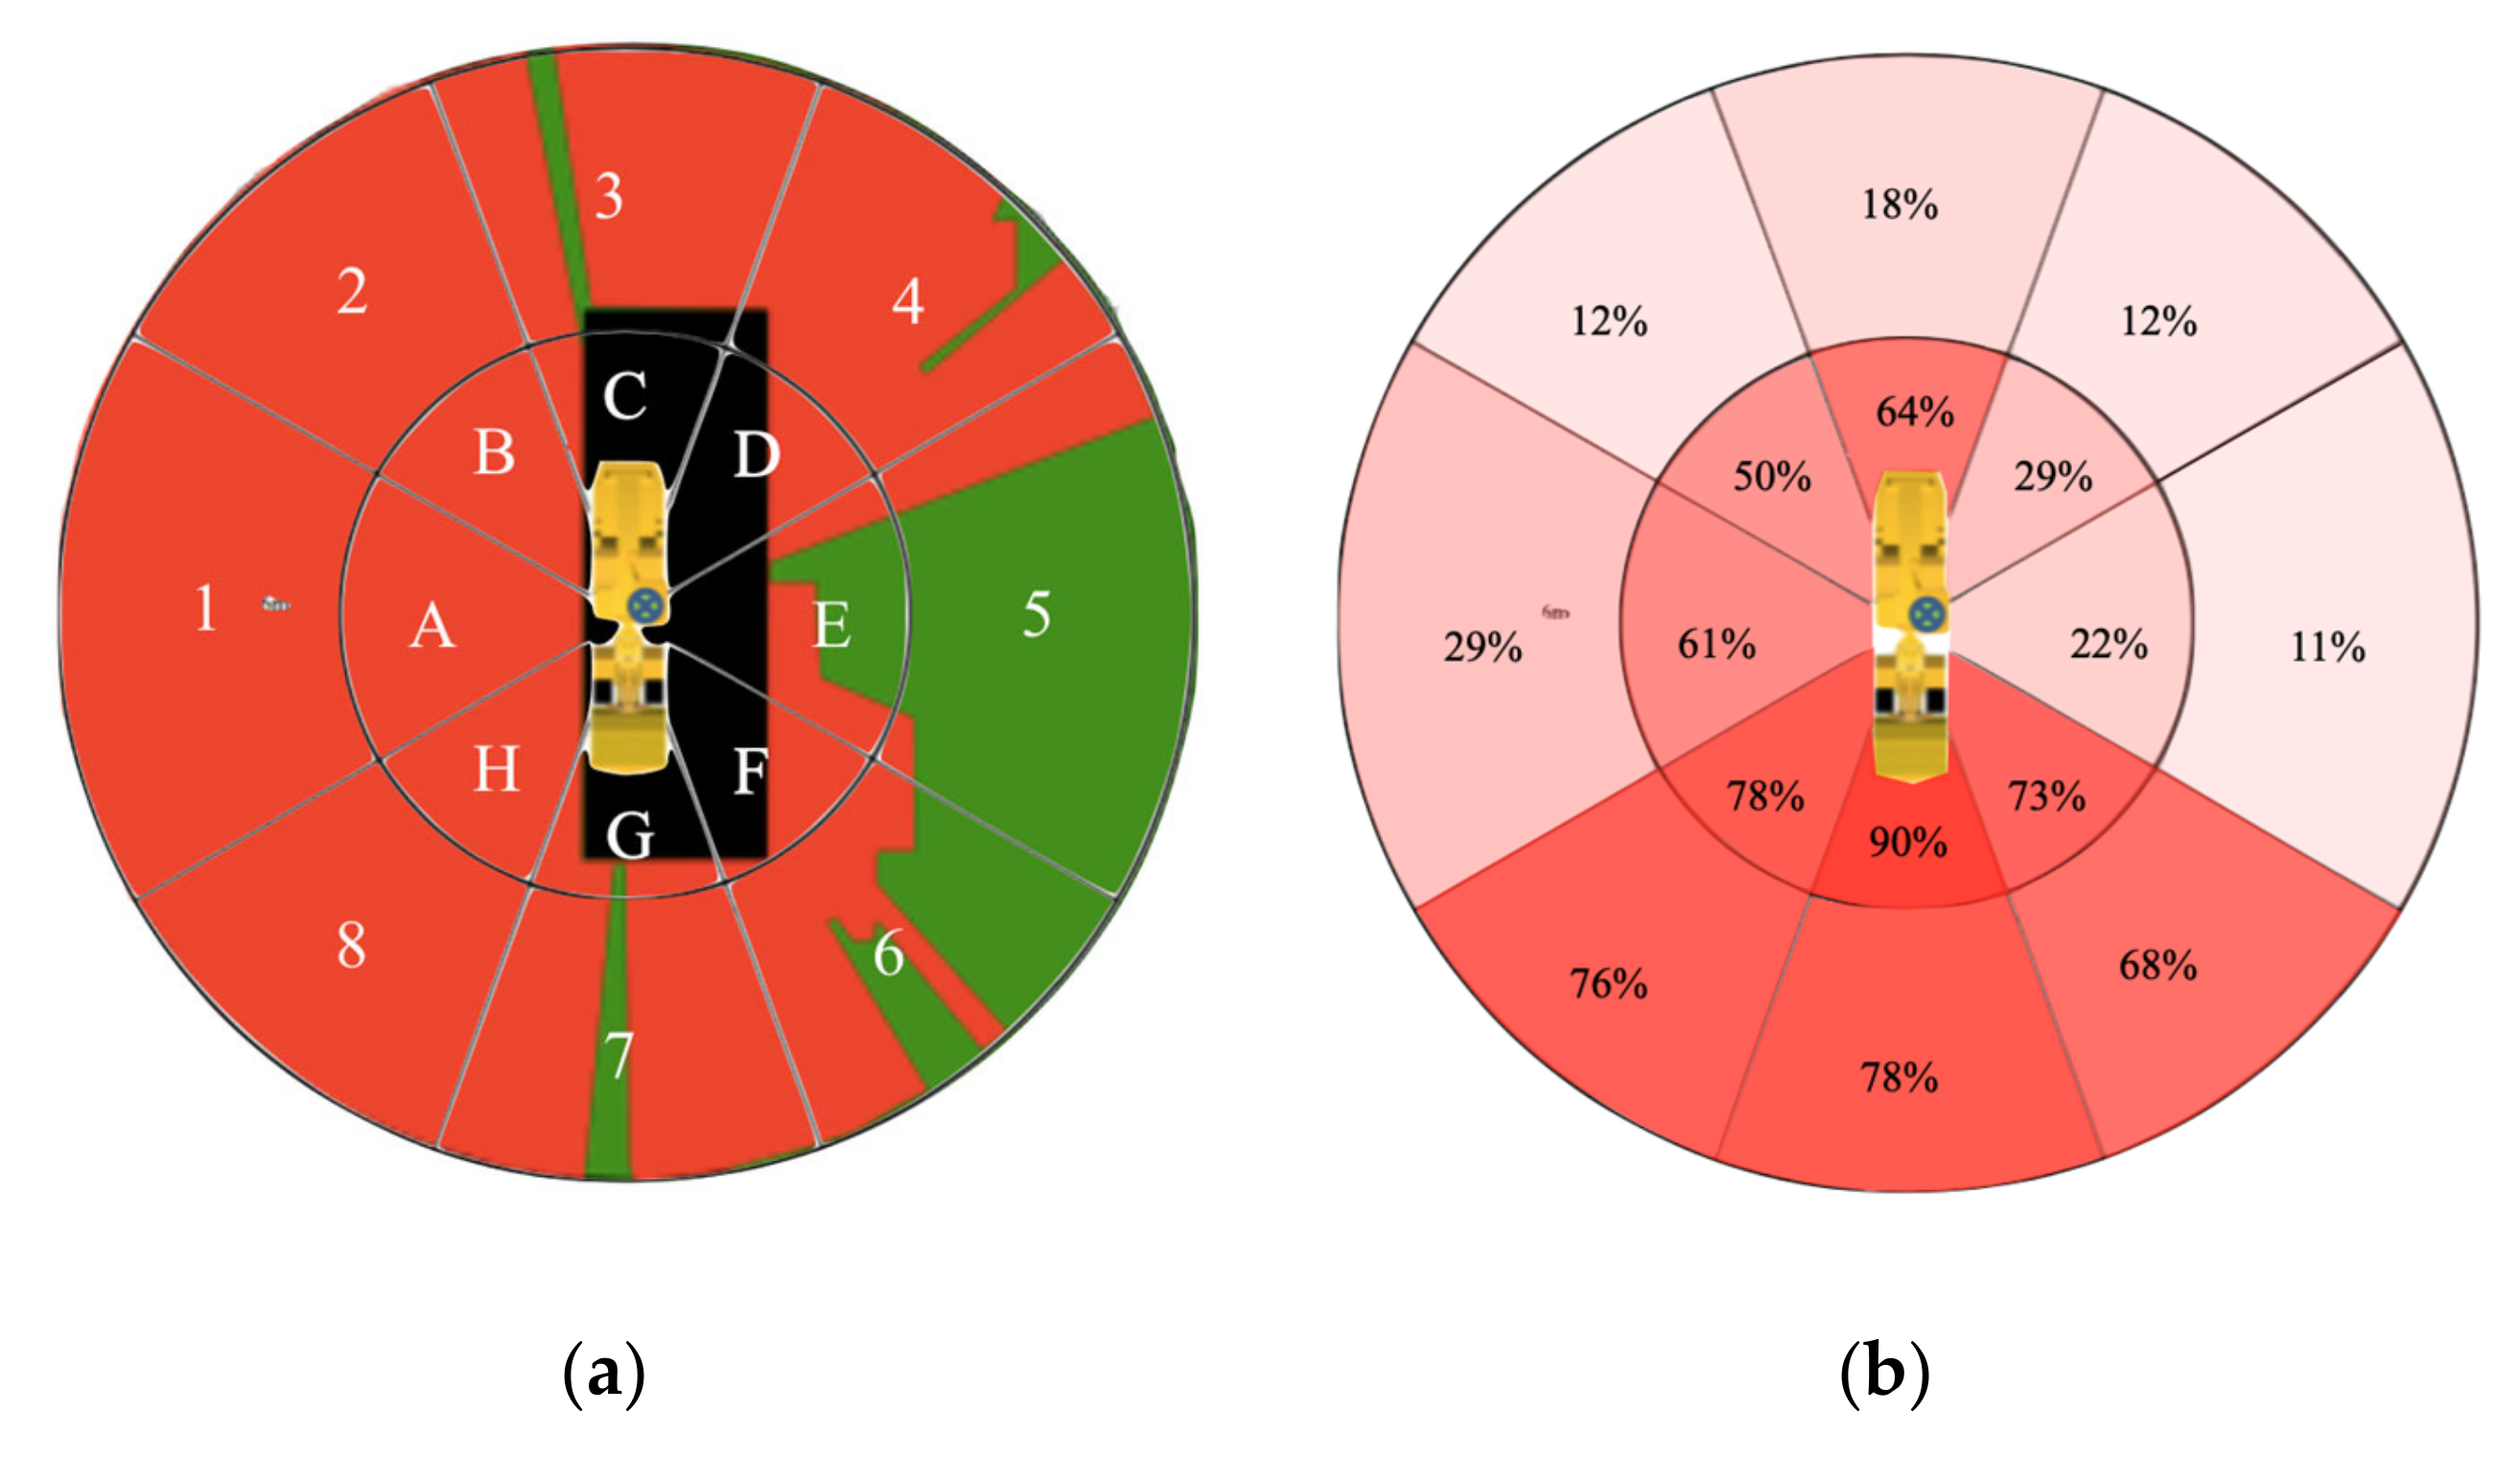
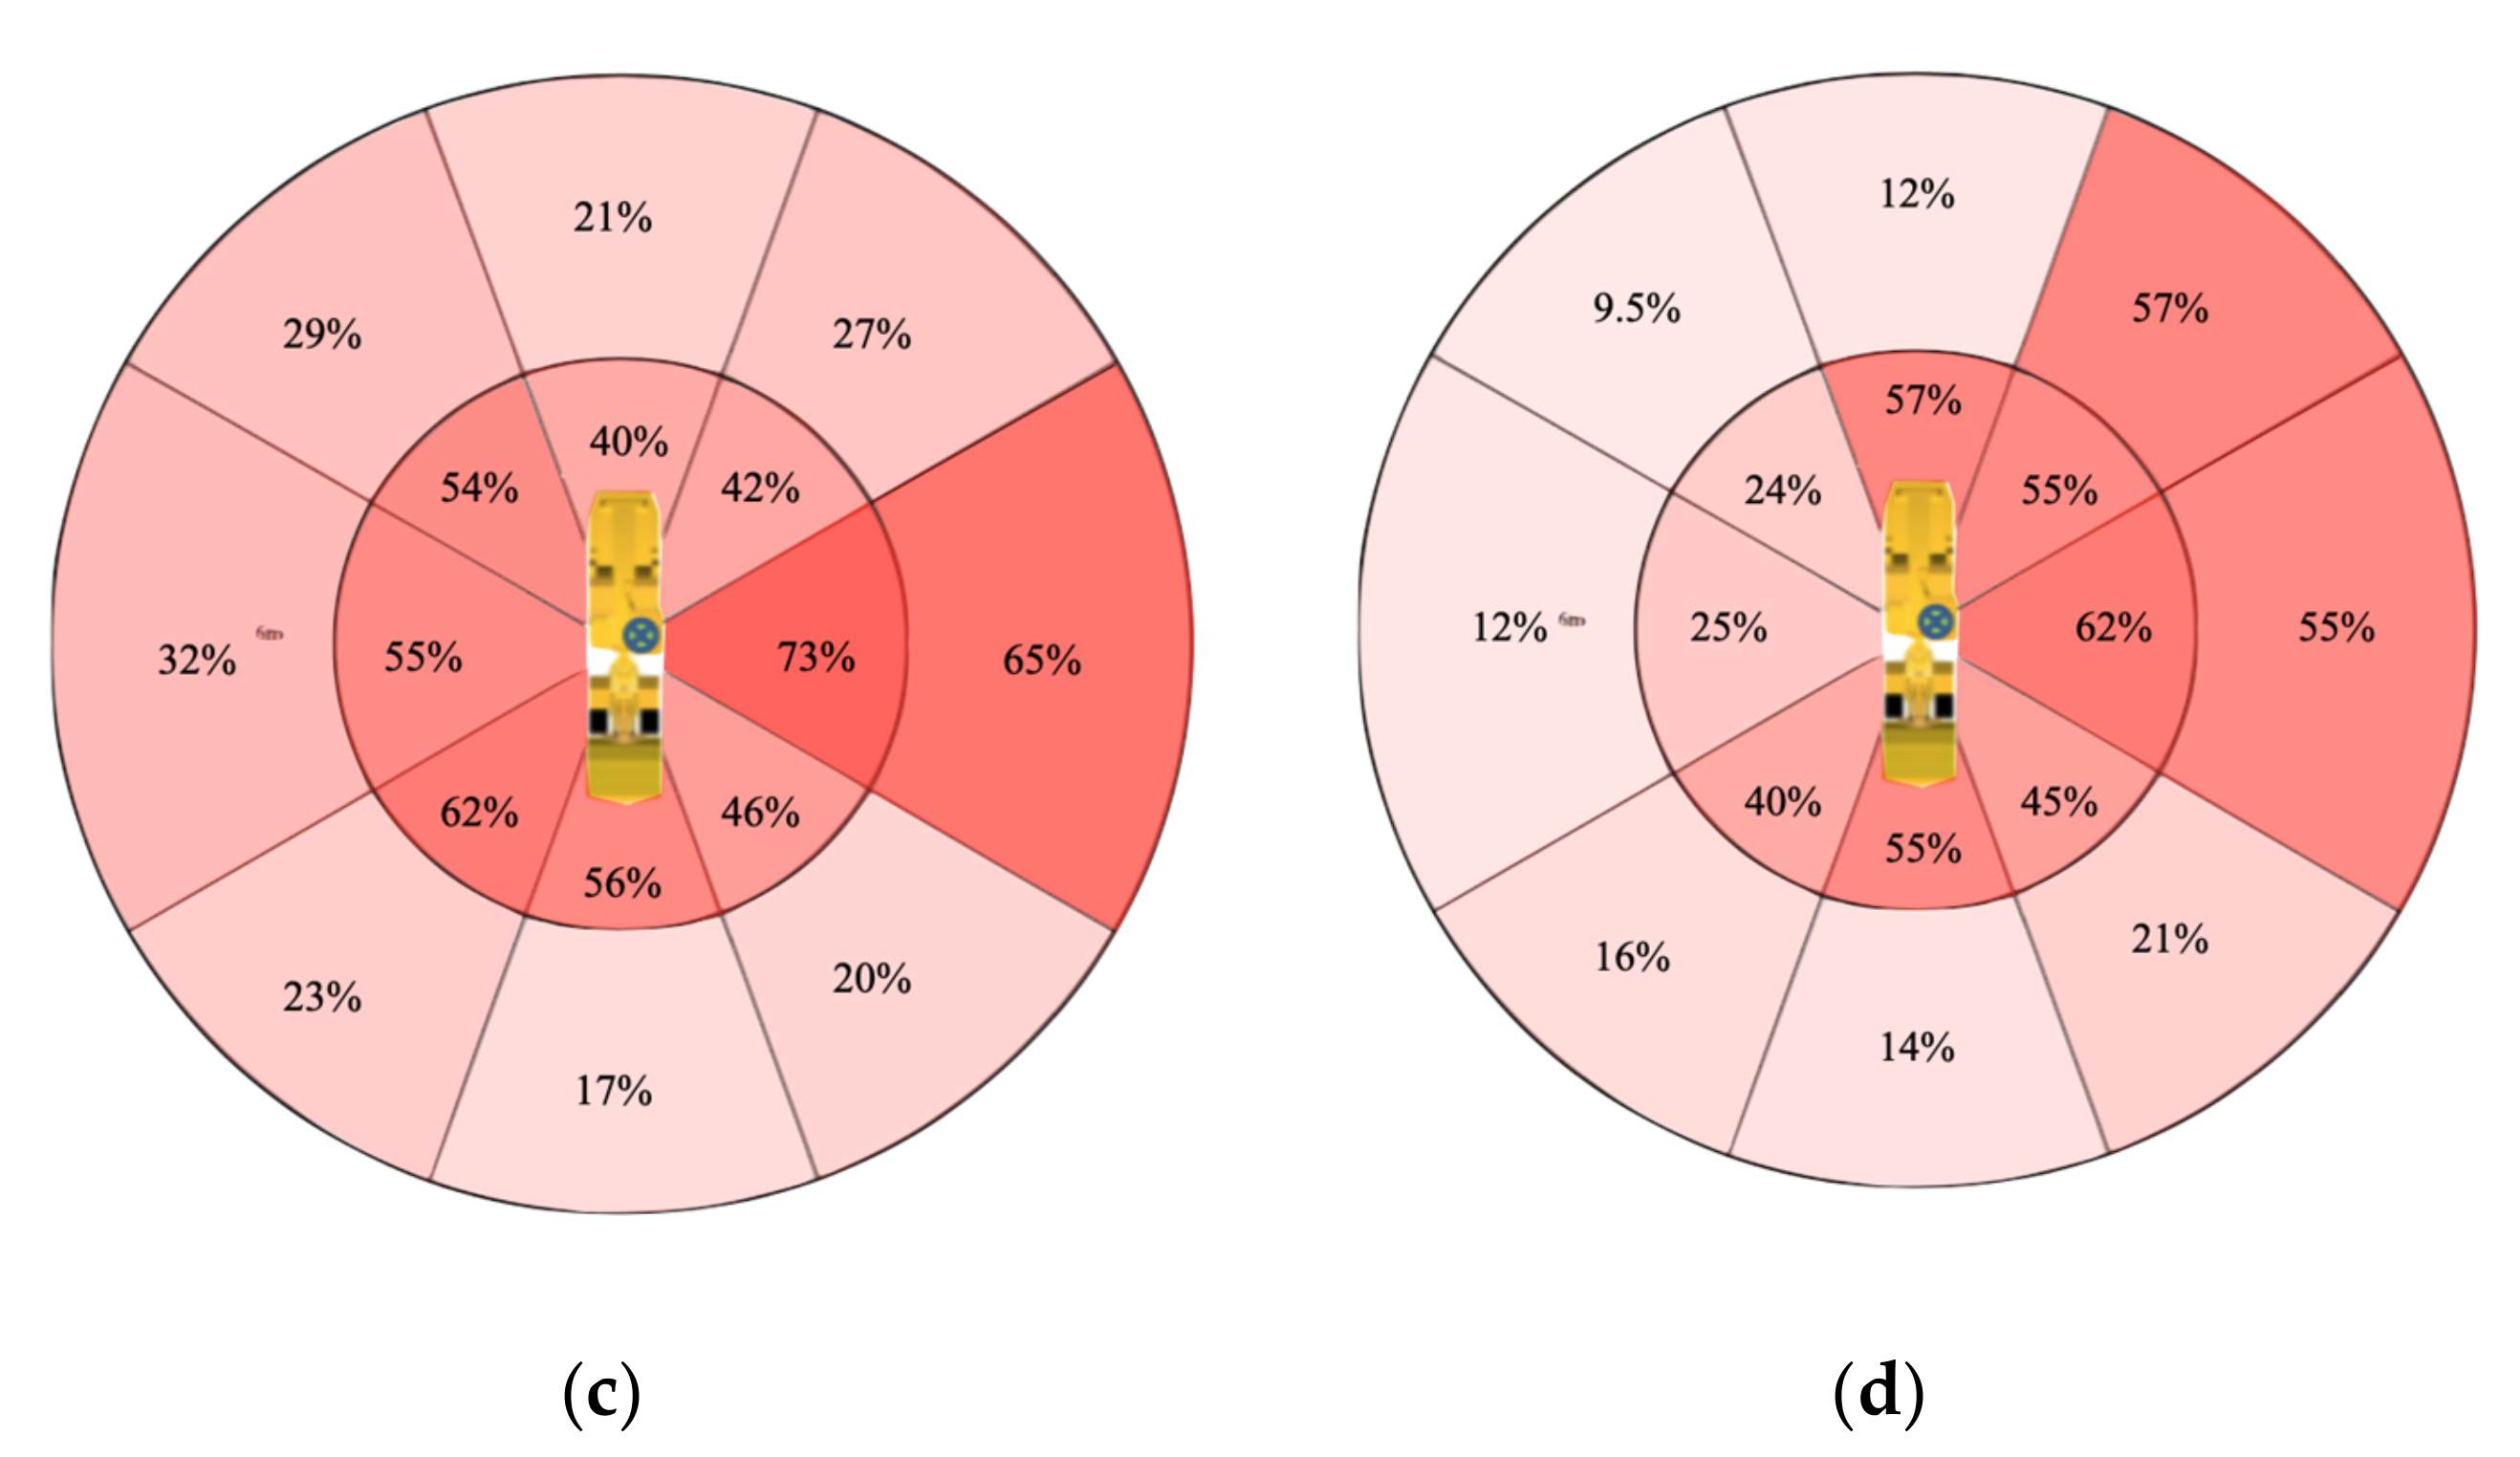
3.3. Visibility Plot

Participants were instructed to complete a free-hand shading task on an LHD visibility plot to indicate the locations of potential blind spots around a 12 m radius. The accuracy of the responses depicted were assessed in comparison to the actual visibility profile of an LHD vehicle produced by the researchers in a 3D modeling program (Figure 4). The 360° visibility profile was assessed in addition to groupings for front, side and rear sections around the LHD (Figure 4). All participants generally performed poorly in the visibility plot task, grossly overestimating the amount of visibility that is available to LHD operators. The results indicate that controls believed there were more blind spots to the rear of the LHD, with fewer blind spots toward the front and side regions, particularly in the sections further than 6 m away from the LHD. Conversely, the desktop and VR groups had similar interpretations of the visibility profile around the LHD, generally illustrating more blind spots to the right side of the LHD, with fewer blind spots to the rear, front and left sides, particularly in the sections further than 6 meters away from the LHD (Figure 4). Findings of the Kruskal–Wallis test indicate significant differences in accuracy of the LHD visibility plot between the intervention groups, H(2) = 7.729, p = 0.021 (Table 1). Control group participants demonstrated higher accuracy levels in the visibility plot drawing task than VR (U = 150.500, z = −2.627, p = 0.009, r = −0.310) and desktop training participants (U = 202.000, z = −2.080, p = 0.038, r = −0.245). The association between plot accuracy in desktop and control groups is presented because, despite not meeting the statistical significance level established with a Bonferroni correction, it has a p value of less than 0.05 and is approaching a medium effect size. Significant differences in visibility plot accuracy were not found between participants in the desktop and VR groups. The findings related to the overall accuracy of the visibility plot were further demonstrated when accuracy was grouped into front, rear and side sections around the LHD. Significant differences in visibility plot accuracy were found in the subgroups of rear and side sections around the LHD (H(2) = 19.447, p = 0.00006; H(2) = 12.494, p = 0.002). Accuracy of the front section of the visibility plot was not significantly different between groups. Controls demonstrated significantly higher accuracy on rear sections of the visibility plot compared to VR and desktop groups, respectively (U = 103.000, z = −3.743, p = 0.0002, r = 0.311; U = 137.500, z = −3.780, p = 0.0002, r = 0.286). Higher accuracy on side sections of the visibility plot was also achieved by control group participants relative to VR and desktop groups, respectively (U = 96.500, z = −3.158, p = 0.002, r = 0.243; U = 179.500, z = −2.755, p = 0.006, r = 0.155).

4. Discussion

4.1. Trainee Confidence

The research team hypothesized that participants in the VR group, relative to desktop and control groups, would experience higher confidence levels in their ability to remain in operator sight lines in the forward and reverse directions. Participants in the VR and desktop groups reported higher confidence remaining in operator LOS in forward (p = 0.052) and reverse (p = 0.005) directions, although the association was only significant in the reverse direction. The non-significant confidence increase in the forward direction may reflect an overestimation of visibility to the front of the LHD from all participants. This was evident in the findings of the visibility plot analysis, which indicated that a mere 17% of all participants illustrated a blind spot 6 m directly in front of the LHD, despite the fact that a large blind spot is present in this region (Figure 4). Moreover, male participants and those with experience working with mining equipment were more likely to report high confidence remaining in LOS in the forward (p = 0.031; p = 0.018) and reverse (p = 0.031; p = 0.008) directions. Seven out of eight participants who reported having some experience with mining equipment were male. Conversely, female participants were more likely to report low confidence remaining in LOS in both directions. The confidence gap noted between the sexes may reflect increased familiarity with industrial equipment among men or an inherent tendency for men to be more and women less confident, the latter of which has been suggested in the literature [36]. Although the former may represent an oversimplification, it is worth noting that men accounted for 90% of the Ontario mining workforce in 2016 [37].

4.2. Visibility Knowledge and Safe Pedestrian Behaviors

The second and third hypotheses stated that VR training would increase visibility knowledge and safe pedestrian behaviors compared to desktop training and control groups. Visibility-specific knowledge was assessed using the 11-item MPQ and the visibility plot task, whereas safe pedestrian behaviors were measured with the MPQ alone. Participants in all three intervention groups achieved what could be considered suboptimal total scores on the MPQ (VR 66%, desktop 59%, control 63%). This may speak to the differences that can be expected among the population of tested university students compared to new or experienced workers in the mining industry. The information transmitted to novice users in the intervention groups was insufficient to significantly increase LOS knowledge and safe pedestrian behaviors in this study. However, LOS knowledge is a complex phenomenon to convey to both experienced and novice users, especially on an unfamiliar piece of equipment. This outcome aligns with the findings of Joshi and colleagues (2021) who found that a VR-based training program using a similar head mounted device (HMD) produced non-significant increases in visibility knowledge in the construction industry in comparison to traditional desktop training [38]. However, the participants in the Joshi et al. (2021) study were also university students, further implicating the role of the participant demographic in the results of this study. A more robust analysis would evaluate knowledge and confidence perceptions prior to and following the intervention. Furthermore, the total rear-facing and front-facing scores obtained by participants in the VR group were marginally higher than those in the desktop group, although the differences were non-significant due to the high variability present in the data. The study further concluded that if the proposed non-performance benefits of VR (i.e., safety, cost, capacity for modifications, engagement, concentration and flow) are considered concomitantly with performance benefits, the net effects of VR training can be considered more favorable than conventional training methods.
Visibility-related knowledge was also assessed using the LHD visibility plot. The VR group failed to demonstrate greater accuracy on the visibility plot compared to controls; in fact, controls had significantly higher accuracy than the VR group in this task (p = 0.009). The strength of this association increased when subgroups of side and rear visibility were considered (p = 0.002; p = 0.00018). When considering rear visibility, 14% of the VR group versus 78% of controls illustrated a blind spot in the region 6–12 m behind the LHD vehicle. This suggests that VR group participants acknowledged that operators must use the rear windows of the LHD to navigate due to the bi-directional nature of the machine. However, they failed to recognize that clear sight lines at the rear of the LHD are achieved at approximately 25 m rather than 12 m [39]. The absence of a pedestrian perspective within the VR experience may account for this discrepancy. At the sides of the LHD, the VR group illustrated a blind spot 12% and 55% of the time in the far left and far right sides, respectively. This suggests that the VR group recognized the unique orientation of the LHD operator, with the visibility profile behind the operator being poorer. This finding is in accordance with previous literature, demonstrating that participants tend to understand the lack of visibility behind industrial machinery [14]. However, while the group recognized the unique orientation of LHD vehicles, reflected by the difference in estimated visibility between the left and right sides, the group misjudged the direction in which the operator was facing. This misunderstanding explains their poor performance on the sides of the visibility plot and on the multiple-choice question relating to the safest side approach to the LHD. In comparison to previous work, participants have a continued misunderstanding of visibility around industrial equipment, taking on an operator-centric bias and disregarding the implications of the machine design [14].
The VR group demonstrated significantly higher confidence remaining in operator LOS in the reverse direction (p = 0.004) and scored significantly higher than controls on question nine on the MPQ, a rear-facing LOS scenario (p = 0.0005). The VR group also scored 15% higher on the rear-facing subgroup on the MPQ compared to controls (non-significant). Collectively, these metrics suggest that the VR group possesses greater visibility knowledge and safe pedestrian behaviors. However, the VR group had significantly lower accuracy than controls on the rear-section of the visibility plot (p = 0.00018), with a mere 14% of the VR group illustrating a blind spot 6–12 m behind the LHD. The discrepancy identified between perceived and actual visibility knowledge and safe pedestrian behaviors is supported by the findings of a construction survey by Leduc and colleagues [14].
Hinze and Teizer identified that 72.6% of visibility-related fatalities in the construction industry occurred while the machine was in reverse [6]. With this in mind, our findings may indicate that rear LOS issues should be a topic of emphasis in future industry training materials. The differences in performance of the VR group between the MPQ and visibility plot suggest poor transfer of knowledge between the 3D VR experience and the 2D depiction of LOS provided by the visibility plot, a finding that was corroborated by West and colleagues [40]. Future research should explore whether the knowledge transfer from VR training environments to real-life workplace environments is greater compared to conventional training forms that utilize static, 2D depictions of visibility.

4.3. Limitations

This study contained several notable limitations. First, the study methodology lacked a baseline assessment of confidence levels, visibility knowledge and safe pedestrian behaviors. Future work should aim to conduct a repeated measures design to determine whether the performance differences between the intervention groups can be attributed to the training method utilized. Furthermore, the study sample consisted of a group of convenience of university students with a mean age of 22.5 years. It is reasonable to expect that this demographic has had minimal exposure to concepts of LOS and industrial equipment, which may limit the capacity for performance improvements following the training intervention, a finding that has been supported by other studies [38]. Additionally, the younger age demographic represented in this study may have more favorable attitudes toward and comfort with the technology required for VR interventions. Further, the participant groups consisted of a near symmetrical proportion of men and women. However, the mining industry is a male-dominated industry, with nearly 90% of employees identifying with the male gender [37], reducing the generalizability of these findings to populations employed in the mining industry. The VR experience created for this study also lacked the pedestrian perspective, which may have hindered the accuracy demonstrated using the visibility plot task, as previously noted. Future studies should aim to quantify differences in visibility knowledge, behaviors and confidence levels at the head, kneeling and ground levels between (1) new versus experienced workers and/or (2) equipment operators versus work-around employees in the mining industry.

5. Conclusions

To conclude, the virtual reality training intervention was successful in educating participants on the unique orientation and operation of LHD vehicles; however, participants misjudged the direction in which the operator was facing. The VR training significantly increased user confidence in remaining within operator LOS in the forwards in reverse directions relative to control groups but not to desktop training interventions. The VR intervention group demonstrated comparable or marginal, but insignificant, increases in visibility knowledge and safe pedestrian behaviors compared to those in the desktop training group. Finally, a mismatch was identified between the perceived and actual visibility knowledge and safe pedestrian behaviors at the rear of the LHD among VR group participants, demonstrating a need to emphasize rear-facing visibility deficits around LHD machines in future industry training.

Author Contributions

Conceptualization, A.G. and M.L.; methodology, A.G. and M.L.; validation, A.G. and S.G.; formal analysis, S.G.; investigation, S.G.; resources, A.G.; data curation, A.G.; writing—original draft preparation, S.G.; writing—review and editing, A.G. and S.J.P.; visualization, S.G.; supervision, A.G.; project administration, S.G.; funding acquisition, A.G. and M.L. All authors have read and agreed to the published version of the manuscript.

Funding

This research was funded by the Natural Sciences and Engineering Research Council of Canada, Discovery Grant number RGPIN-2017–06076.

Institutional Review Board Statement

The study was conducted according to the guidelines of the Declaration of Helsinki and approved by the Institutional Review Board of Laurentian University (protocol code 6006069).

Informed Consent Statement

Informed consent was obtained from all subjects involved in the study.

Data Availability Statement

Please contact corresponding author for original data.

Acknowledgments

The research team wishes to thank the Centre for Research in Occupational Safety and Health for the provision of virtual reality equipment.

Conflicts of Interest
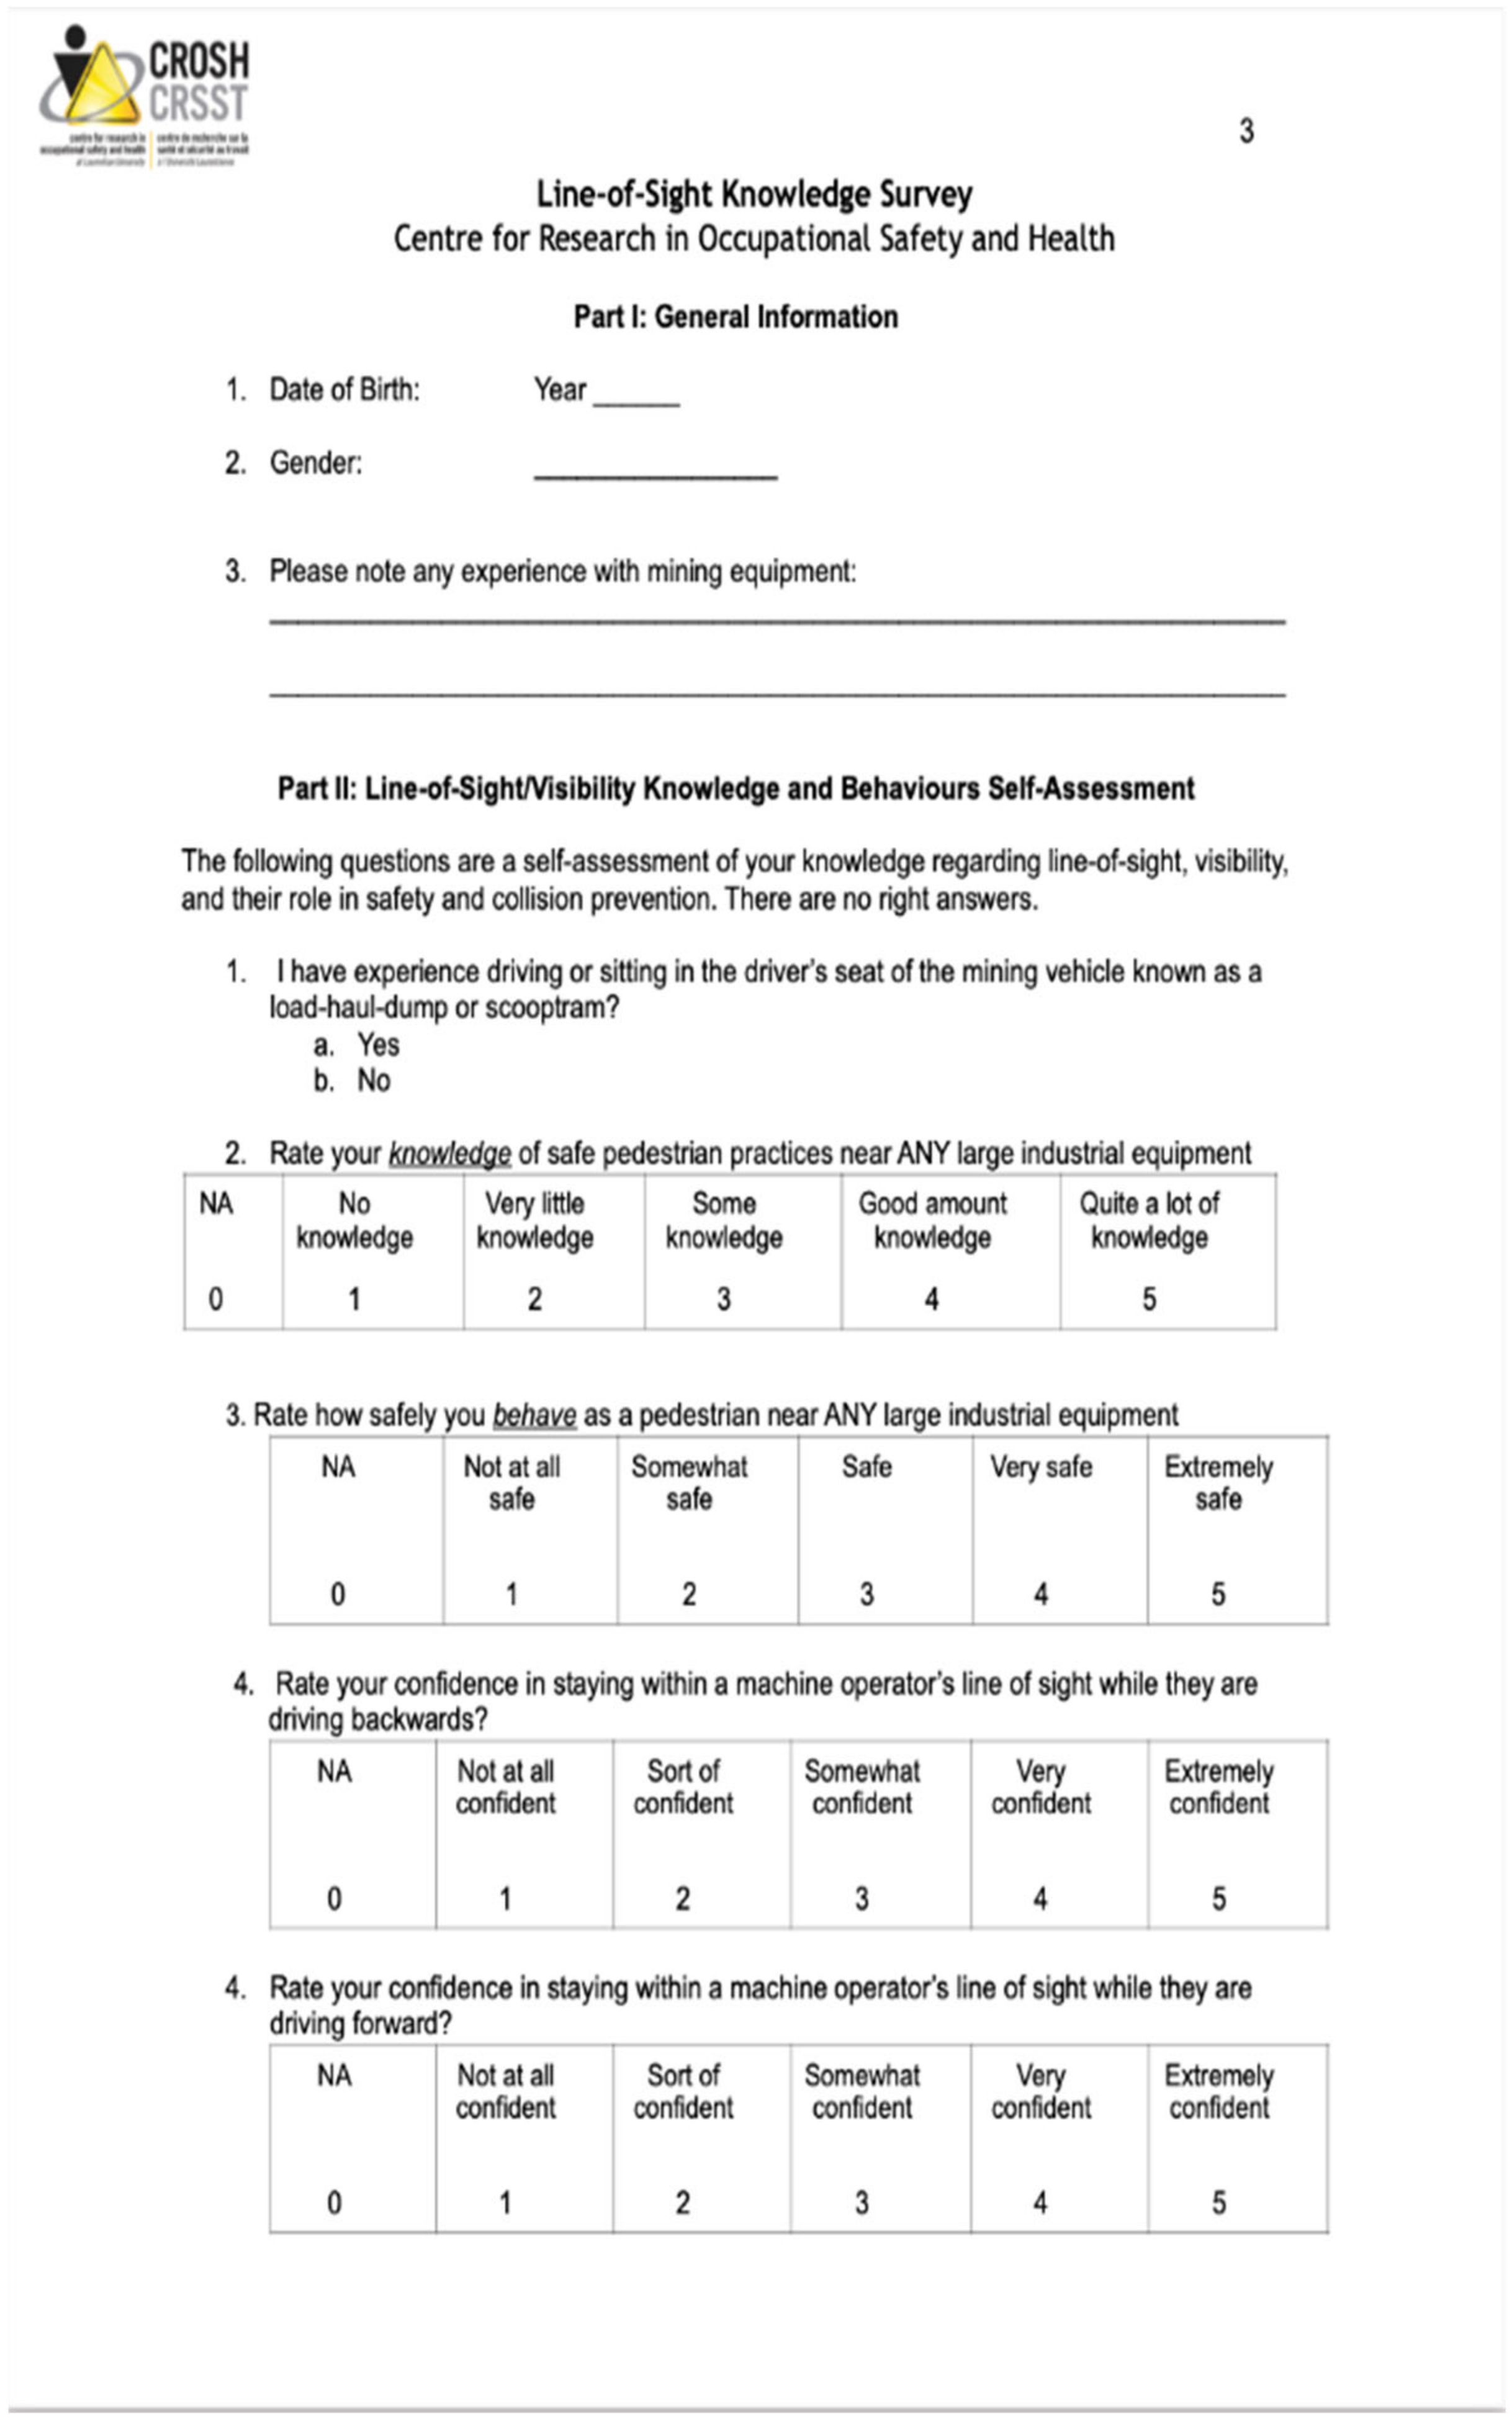
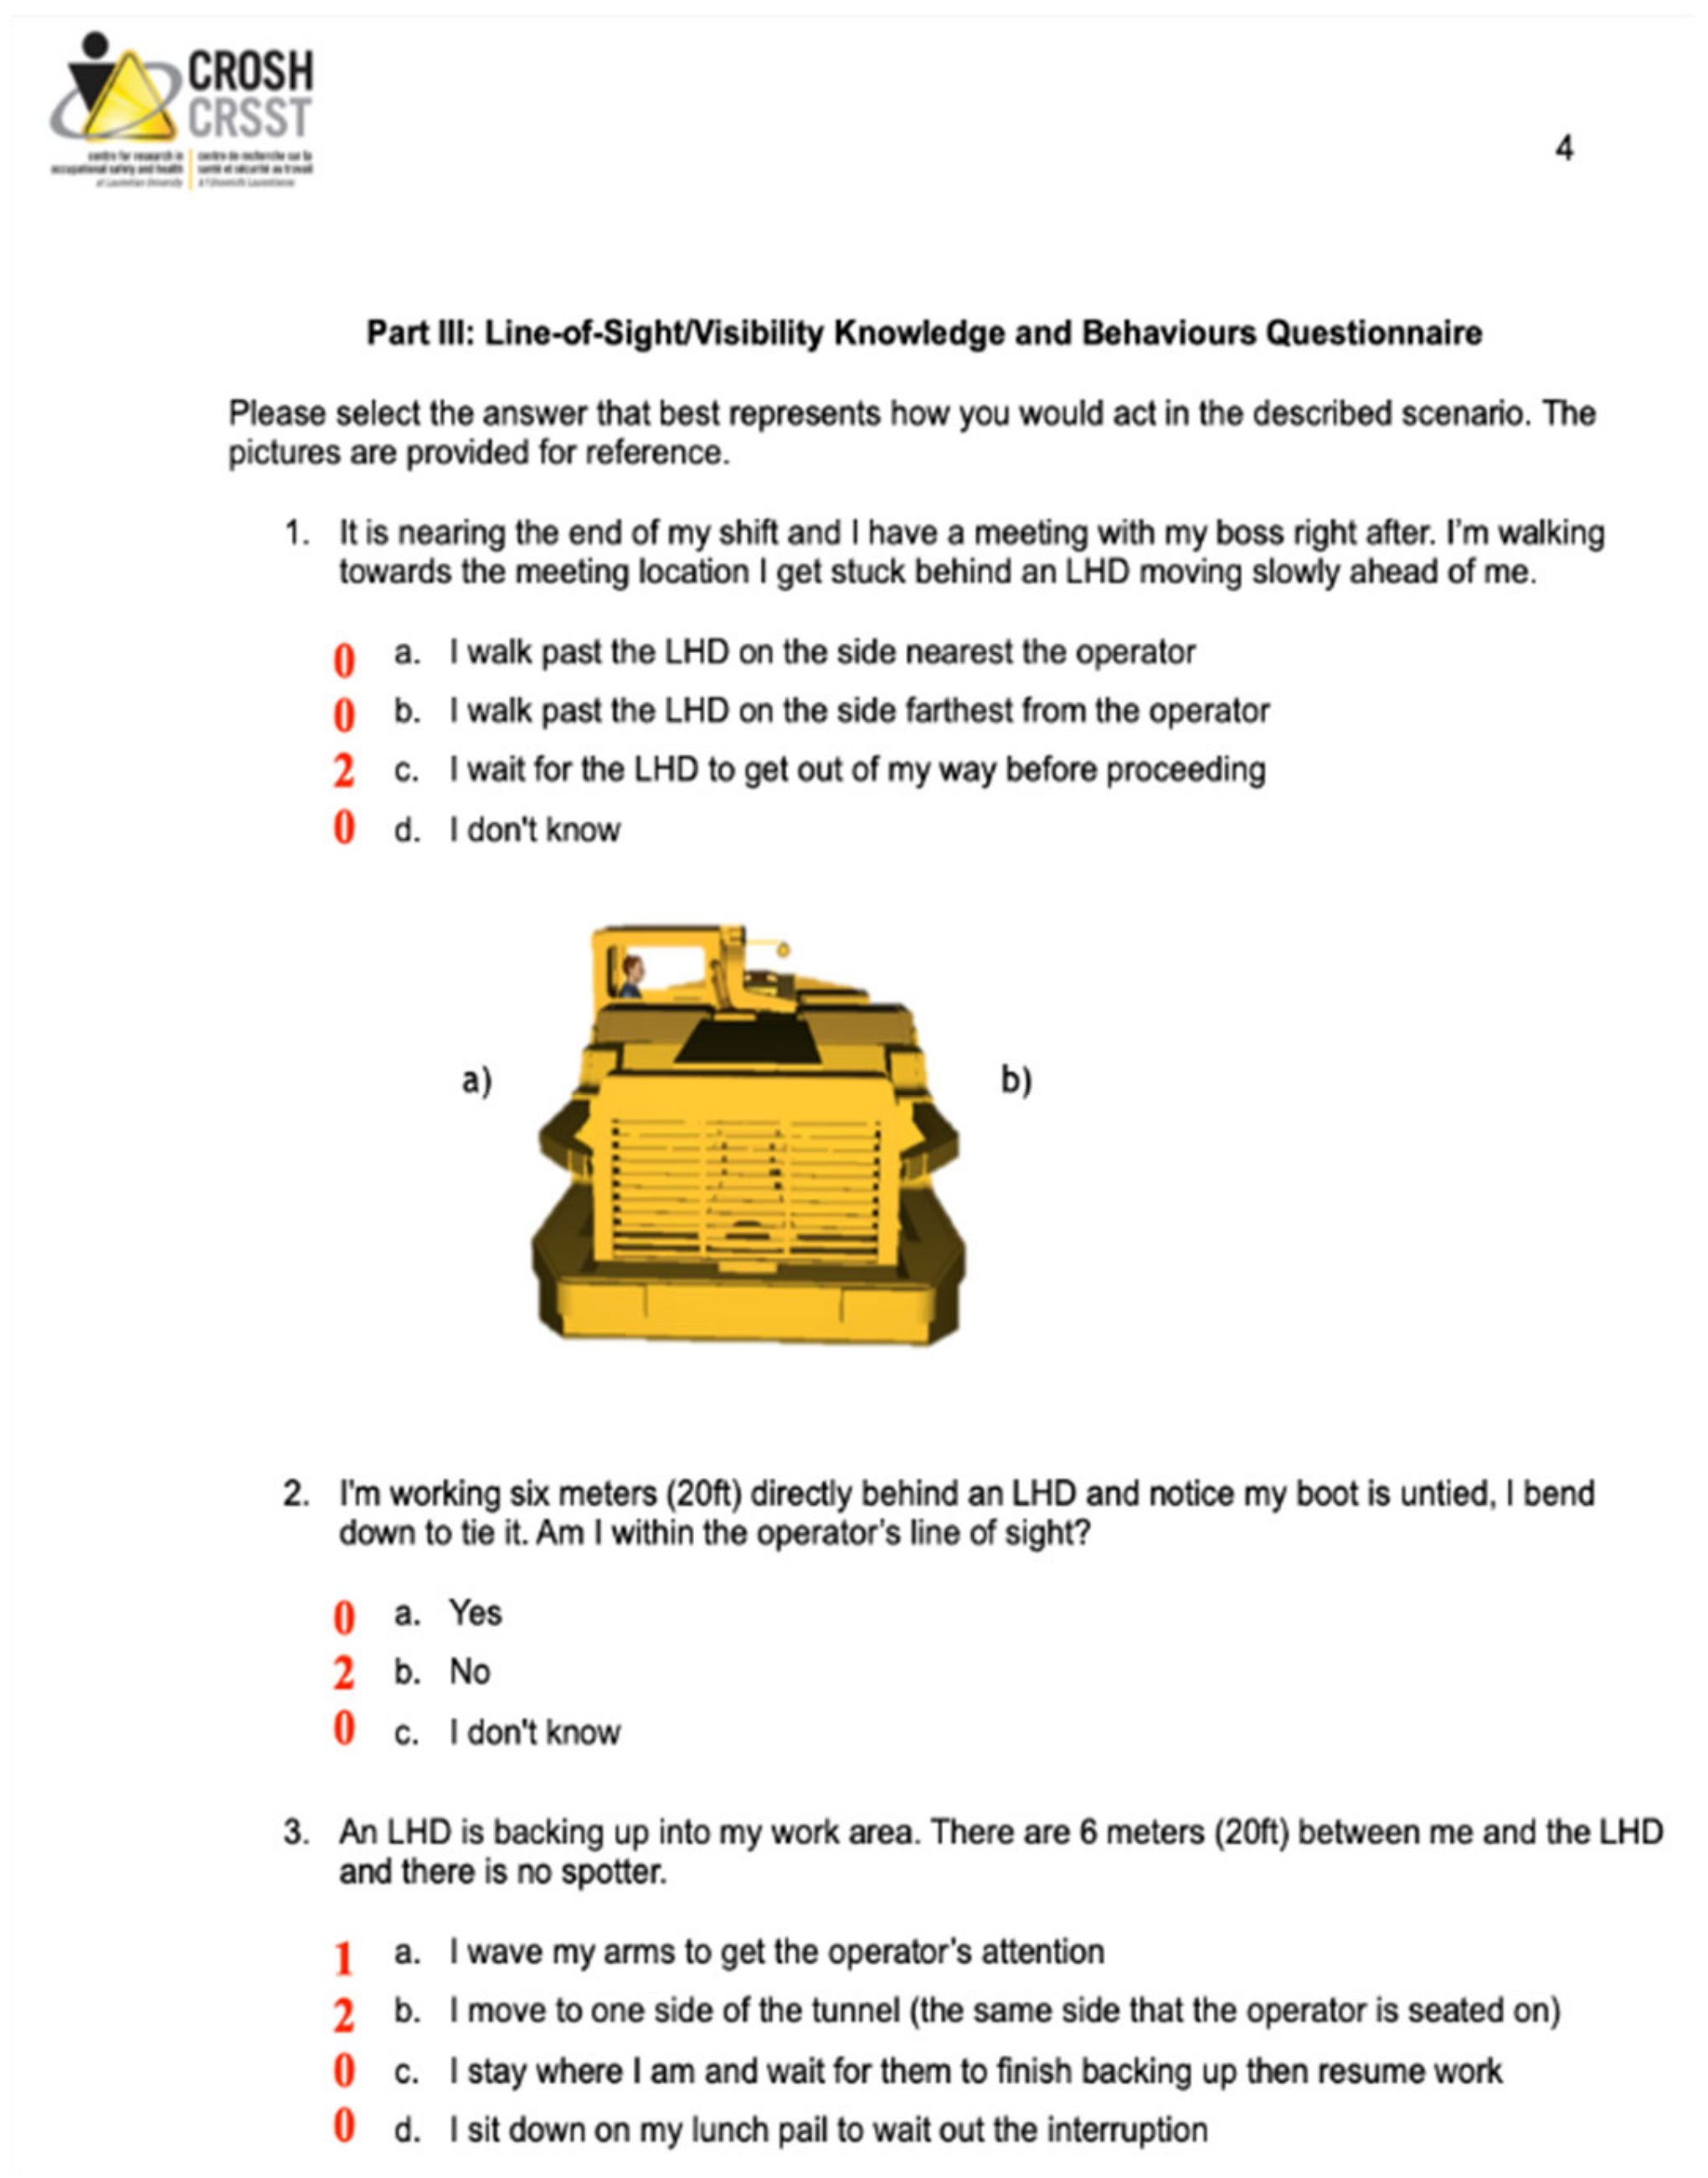
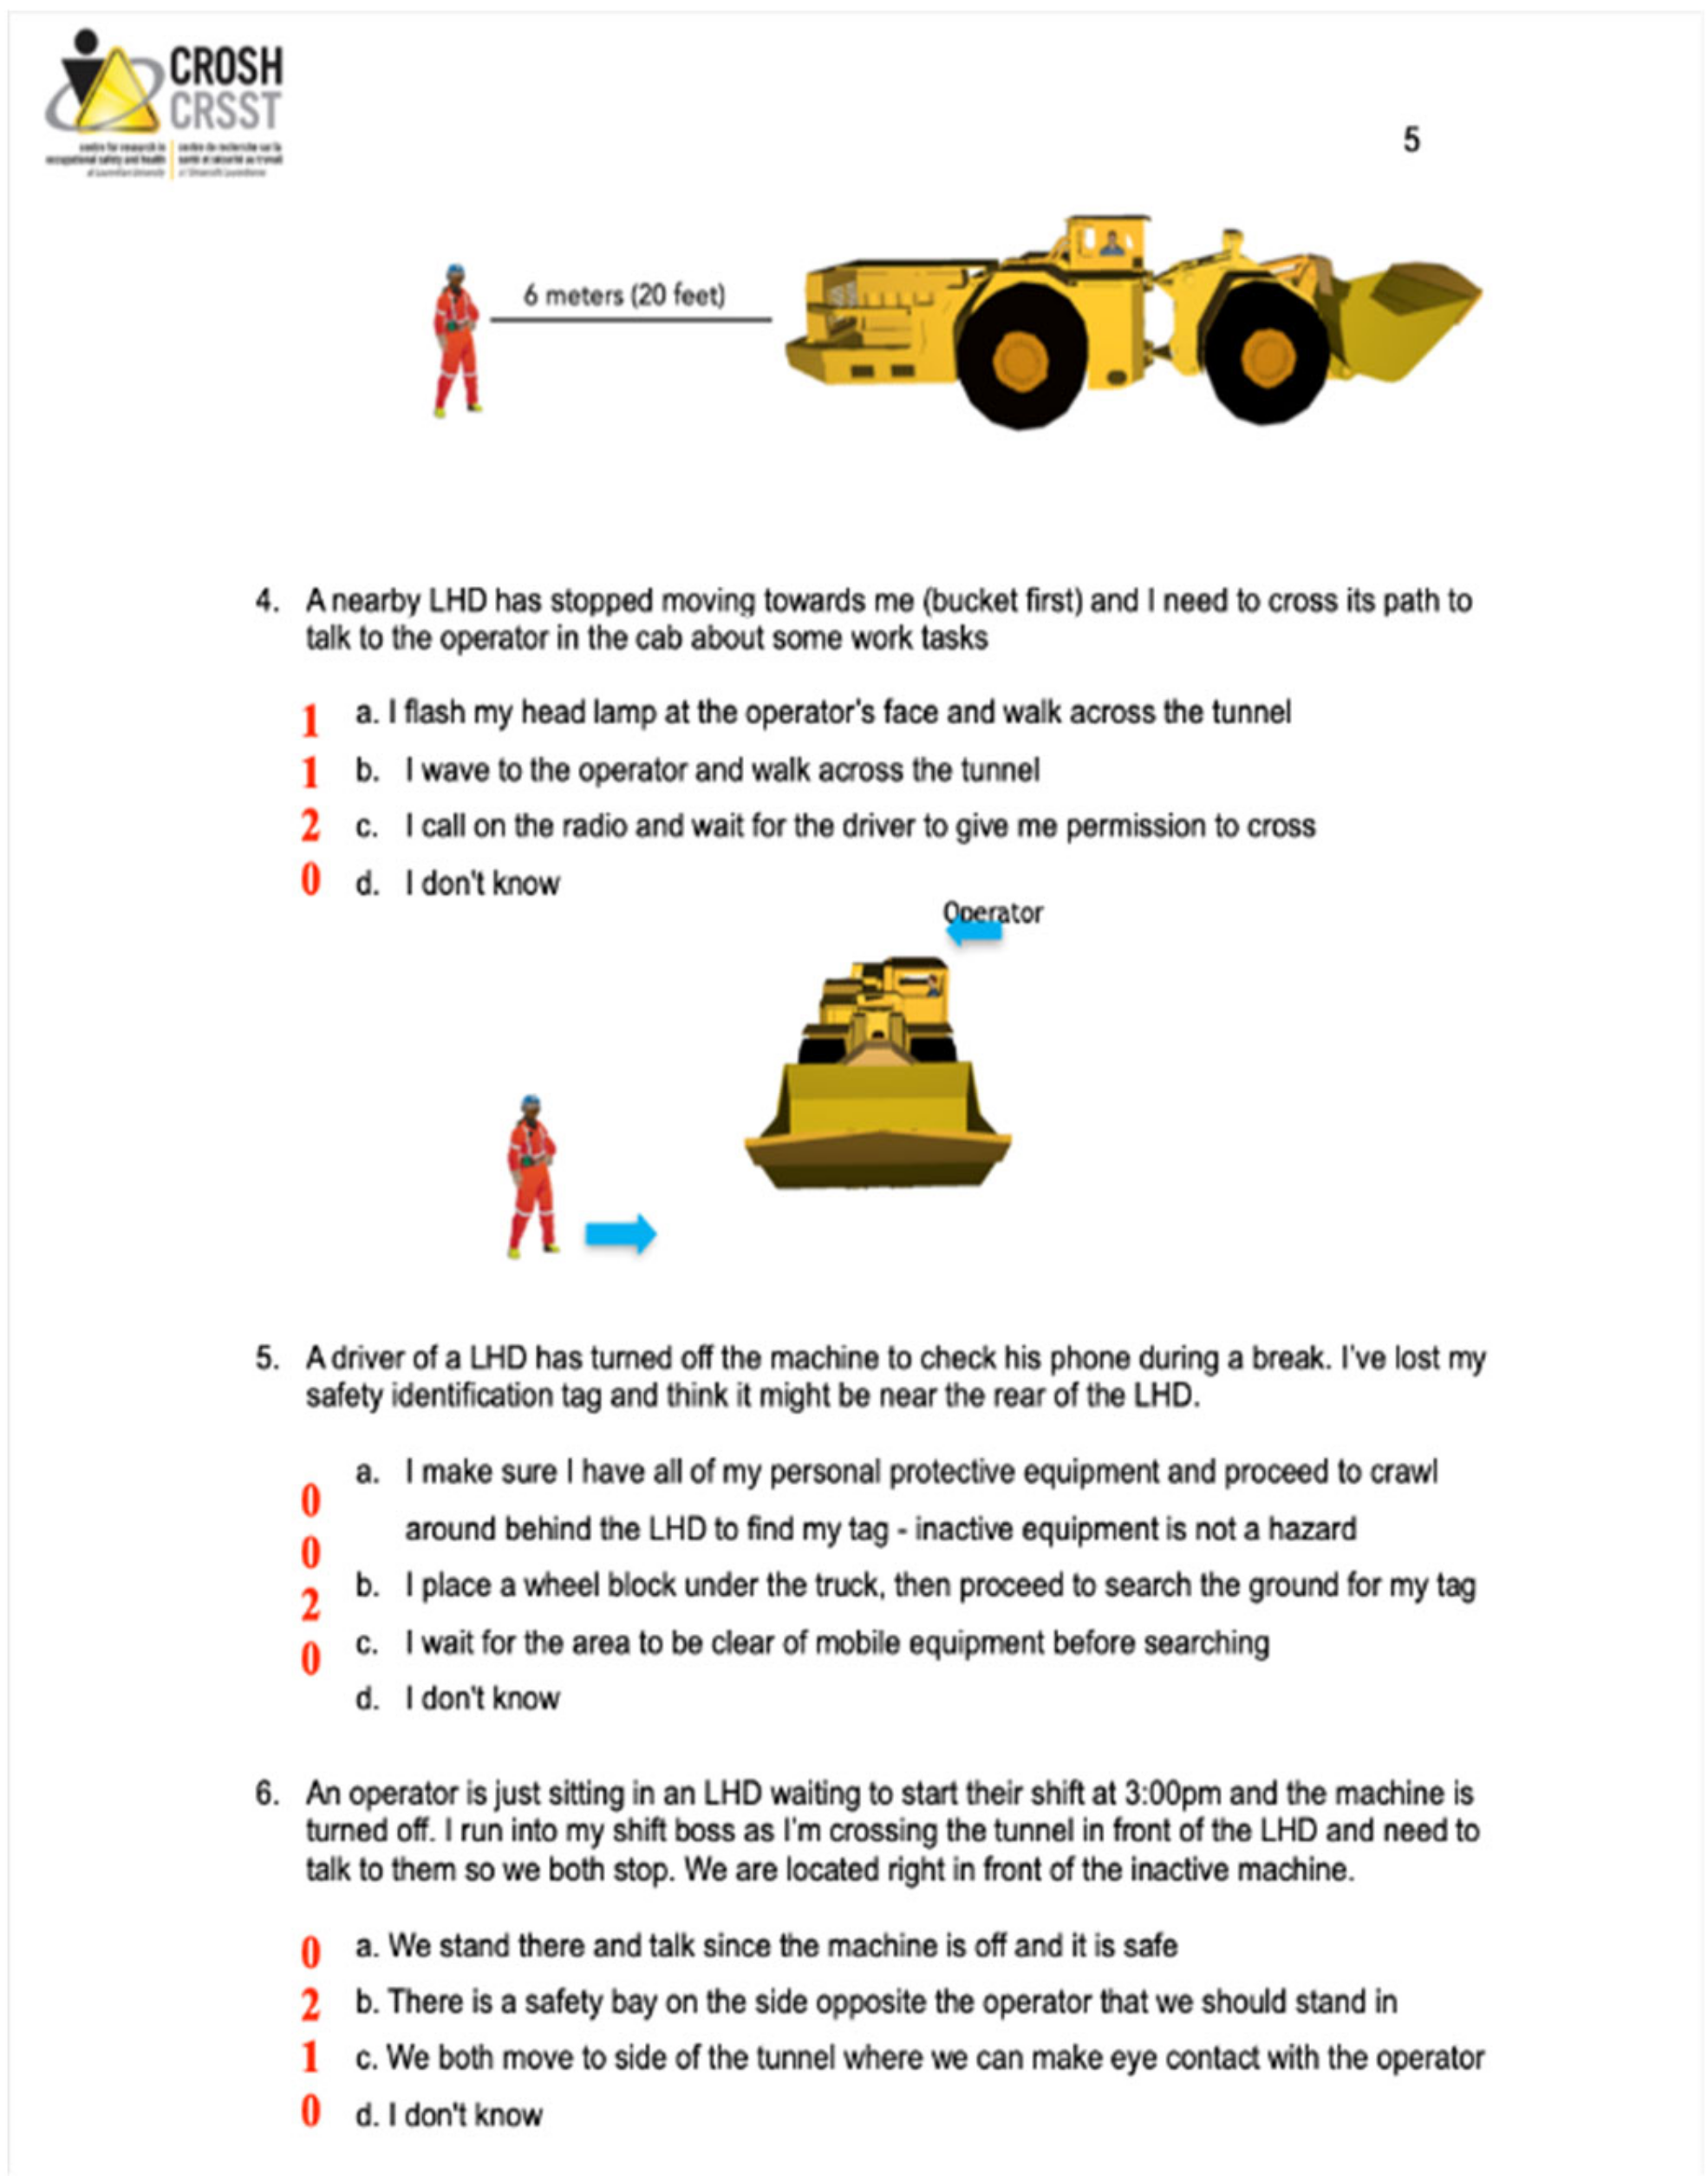
The authors declare no conflict of interest.

Appendix A

Figure A1. Custom visibility questionnaire, page 3.
Safety 08 00052 g0a1
Figure A2. Custom visibility questionnaire, page 4.
Safety 08 00052 g0a2
Figure A3. Custom visibility questionnaire, page 5.
Safety 08 00052 g0a3
Figure A4. Custom visibility questionnaire, page 6.
Safety 08 00052 g0a4
Figure A5. Custom visibility questionnaire, page 7.
Safety 08 00052 g0a5
Figure A6. Custom visibility questionnaire, page 8.
Safety 08 00052 g0a6

References

  1. Knight, C.E.J. The Mediating Role of Mindfulness, Attention and Situational Awareness on Driving Performance in a Virtual Reality Underground Mine; Laurentian University: Sudbury, ON, Canada, 2018. [Google Scholar]
  2. Eger, T.; Godwin, A.; Grenier, S. Using Visibility Tools in Classic JACK to Assess Line-of-Sight Issues Associated with the Operation of Mobile Equipment. Int. J. Hum. Factors Model. Simul. 2010, 1, 406–419. [Google Scholar] [CrossRef]
  3. Eger, T.; Salmoni, A.; Whissell, R. Factors Influencing Load-Haul-Dump Operator Line of Sight in Underground Mining. Appl. Ergon. 2004, 35, 93–103. [Google Scholar] [CrossRef] [PubMed]
  4. Godwin, A.; Eger, T.; Salmoni, A.; Grenier, S.; Dunn, P. Postural Implications of Obtaining Line–of–Sight for Seated Operators of Underground Mining Load-Haul-Dump Vehicles. Ergonomics 2007, 50, 192–207. [Google Scholar] [CrossRef]
  5. Bhattacherya, T.; Dunn; Eger, P. Development of a New Operator Visibility Assessment Technique for Mobile Equipment. J. South Afr. Inst. Min. Metall. 2006, 106, 87–92. [Google Scholar]
  6. Hinze, J.W.; Teizer, J. Visibility-Related Fatalities Related to Construction Equipment. Saf. Sci. 2011, 49, 709–718. [Google Scholar] [CrossRef]
  7. Godwin, A.; Eger, T.; Corrigan, L.; Grenier, S. Classic JACK Modelling of Driver Posture and Line-of-Sight for Operators of Lift-Trucks. Int. J. Hum. Factors Model. Simul. 2010, 1, 259. [Google Scholar] [CrossRef]
  8. Archived—Appendix A: Statistical Charts|Occupational Health and Safety in Ontario April 2017–March 2018. Available online: http://www.ontario.ca/document/occupational-health-and-safety-ontario-april-2017-march-2018/appendix-statistical-charts (accessed on 17 May 2022).
  9. Groves, W.A.; Kecojevic, V.J.; Komljenovic, D. Analysis of Fatalities and Injuries Involving Mining Equipment. J. Safety Res. 2007, 38, 461–470. [Google Scholar] [CrossRef] [PubMed]
  10. Workplace Health and Safety Snapshot for Ontario Mining Sector in 2019. Available online: http://www.ontario.ca/page/workplace-health-and-safety (accessed on 17 May 2022).
  11. Government of Canada, C.C. for O.H. and S. CCOHS: Health and Safety Report—Past Issues. Available online: https://www.ccohs.ca/newsletters/hsreport/issues/2014/10/ezine.html (accessed on 17 May 2022).
  12. Stemn, E.; Krampah, F. Injury Severity and Influence Factors in Surface Mines: A Correspondence Analysis. Saf. Sci. 2022, 145, 105495. [Google Scholar] [CrossRef]
  13. Stemn, E. Analysis of Injuries in the Ghanaian Mining Industry and Priority Areas for Research. Saf. Health Work 2019, 10, 151–165. [Google Scholar] [CrossRef]
  14. Leduc, M.; Vance, B.; Eger, T.; Godwin, A. Findings from a Visibility Survey in the Construction Industry. Transp. Res. Interdiscip. Perspect. 2019, 2, 100056. [Google Scholar] [CrossRef]
  15. Oliver, A.; Cheyne, A.; Tomás, J.M.; Cox, S. The Effects of Organizational and Individual Factors on Occupational Accidents. J. Occup. Organ. Psychol. 2002, 75, 473–488. [Google Scholar] [CrossRef]
  16. Olson, R.; Grosshuesch, A.; Schmidt, S.; Gray, M.; Wipfli, B. Observational Learning and Workplace Safety: The Effects of Viewing the Collective Behavior of Multiple Social Models on the Use of Personal Protective Equipment. J. Safety Res. 2009, 40, 383–387. [Google Scholar] [CrossRef] [PubMed]
  17. Reddy, R.K.; Welch, D.; Thorne, P.; Ameratunga, S. Hearing Protection Use in Manufacturing Workers: A Qualitative Study. Noise Health 2012, 14, 202. [Google Scholar] [CrossRef] [PubMed]
  18. Dingsdag, D.; Biggs, H.; Sheahan, V. Understanding and Defining OH&S Competency for Construction Site Positions: Worker Perceptions. Saf. Sci. 2008, 46, 619–633. [Google Scholar] [CrossRef] [Green Version]
  19. Dzeng, R.-J.; Hsueh, H.-H.; Chang, R.-N. 3D Game-Based Training System for Hazard Identification on Construction Site. In Proceedings of the 2015 12th International Conference on Fuzzy Systems and Knowledge Discovery (FSKD), Zhangjiajie, China, 15–17 August 2015; pp. 2453–2458. [Google Scholar]
  20. Burke, M.J.; Sarpy, S.A.; Smith-Crowe, K.; Chan-Serafin, S.; Salvador, R.O.; Islam, G. Relative Effectiveness of Worker Safety and Health Training Methods. Am. J. Public Health 2006, 96, 315–324. [Google Scholar] [CrossRef] [PubMed]
  21. Sacks, R.; Perlman, A.; Barak, R. Construction Safety Training Using Immersive Virtual Reality. Constr. Manag. Econ. 2013, 31, 1005–1017. [Google Scholar] [CrossRef]
  22. Schofield, D.; Hollands, R.; Denby, B. Mine Safety in the Twenty-First Century: The Application of Computer Graphics and Virtual Reality. In Mine Health and Safety Management; Society for Mining Metallurgy: Englewood, CO, USA, 2001; pp. 153–174. ISBN 978-0-87335-200-0. [Google Scholar]
  23. Van Wyk, E.; de Villiers, R. Virtual Reality Training Applications for the Mining Industry. In Proceedings of the 6th International Conference on Computer Graphics, Virtual Reality, Visualisation and Interaction in Africa, Pretoria, South Africa, 4–6 February 2009; Association for Computing Machinery: New York, NY, USA, 2009; pp. 53–63. [Google Scholar]
  24. Tichon, D.J.; Burgess-Limerick, D.R. A Review of Virtual Reality as a Medium for Safety Related Training in Mining. J. Health Saf. Res. Pract. 2011, 3, 33–40. [Google Scholar]
  25. Li, Q.; Tay, R. Improving Drivers’ Knowledge of Road Rules Using Digital Games. Accid. Anal. Prev. 2014, 65, 8–10. [Google Scholar] [CrossRef]
  26. Godwin, A.; Knight, C.; Schwabe, N.; Eger, T. Virtual Reality as a Useful Mode of Imparting Line of Sight Knowledge. In Proceedings of the Proceedings of the 47th Annual Conference of the Association of Canadian Ergonomists, Niagara Falls, ON, Canada, 18 October 2016. [Google Scholar]
  27. Zujovic, L.; Kecojevic, V.; Bogunovic, D. Interactive Mobile Equipment Safety Task-Training in Surface Mining. Int. J. Min. Sci. Technol. 2021, 31, 743–751. [Google Scholar] [CrossRef]
  28. Orr, T.; Filigenzi, M.T.; Ruff, T.M. Hazard Recognition—Computer Based Simulation. In Proceedings of the 30th Annual Institute on Mining Health, Safety and Research, Salt Lake City, UT, USA, 8 August 1999. [Google Scholar]
  29. Filigenzi, M.; Orr, T.; Ruff, T. Virtual Reality for Mine Safety Training. Appl. Occup. Environ. Hyg. 2000, 15, 465–469. [Google Scholar] [CrossRef]
  30. Squelch, A.P. Virtual Reality for Mine Safety Training in South Africa. J. South Afr. Inst. Min. Metall. 2001, 101, 209–216. [Google Scholar]
  31. Isleyen, E.; Duzgun, H.S. Use of Virtual Reality in Underground Roof Fall Hazard Assessment and Risk Mitigation. Int. J. Min. Sci. Technol. 2019, 29, 603–607. [Google Scholar] [CrossRef]
  32. Fisher, D.L.; Pollatsek, A.P.; Pradhan, A. Can Novice Drivers Be Trained to Scan for Information That Will Reduce Their Likelihood of a Crash? Inj. Prev. 2006, 12, i25–i29. [Google Scholar] [CrossRef] [PubMed]
  33. Pollatsek, A.; Narayanaan, V.; Pradhan, A.; Fisher, D.L. Using Eye Movements to Evaluate a PC-Based Risk Awareness and Perception Training Program on a Driving Simulator. Hum. Factors 2006, 48, 447–464. [Google Scholar] [CrossRef] [PubMed]
  34. Liu, C.C.; Hosking, S.G.; Lenné, M.G. Hazard Perception Abilities of Experienced and Novice Motorcyclists: An Interactive Simulator Experiment. Transp. Res. Part F Traffic Psychol. Behav. 2009, 12, 325–334. [Google Scholar] [CrossRef]
  35. Kowalski-Trakofler, K.M.; Barrett, E.A. The Concept of Degraded Images Applied to Hazard Recognition Training in Mining for Reduction of Lost-Time Injuries. J. Safety Res. 2003, 34, 515–525. [Google Scholar] [CrossRef]
  36. Lundeberg, M.A.; Fox, P.W.; Punćcohaŕ, J. Highly Confident but Wrong: Gender Differences and Similarities in Confidence Judgments. J. Educ. Psychol. 1994, 86, 114–121. [Google Scholar] [CrossRef]
  37. Mining in Ontario: The Latest Trends and Industry Outlook. Available online: https://www.oma.on.ca/en/resourcesGeneral/OMA-Economic-Report.pdf (accessed on 9 April 2021).
  38. Joshi, S.; Hamilton, M.; Warren, R.; Faucett, D.; Tian, W.; Wang, Y.; Ma, J. Implementing Virtual Reality Technology for Safety Training in the Precast/Prestressed Concrete Industry. Appl. Ergon. 2021, 90, 103286. [Google Scholar] [CrossRef]
  39. Visibility Project Fact Sheet: Line of Sight Assessment-1. Available online: https://www.workplacesafetynorth.ca/sites/default/files/Safe%20Operator%20-%20Line%20of%20Sight,%20Assessment%20-%20Resource%20Sheet.pdf (accessed on 8 April 2021).
  40. West, J.; Haywood, M.; Dunn, P.; Eger, T.; Grenier, S.; Whissel, C. Comparison of Operator Line-of-Sight (LOS) Assessment Techniques: Evaluation of an Underground Load-Haul-Dump (LHD) Mobile Mining Vehicle. J. South Afr. Inst. Min. Metall. 2007, 107, 315–321. [Google Scholar] [CrossRef]
Figure 1. Flow chart of participant group interventions.
Safety 08 00052 g001
Figure 2. Results of four-item self-assessment by intervention group.
Safety 08 00052 g002
Figure 3. Results of visibility multiple-choice questionnaire by intervention group.
Safety 08 00052 g003
Figure 4. (a) Corrected visibility plot in six-meter (inner circle) and twelve-meter (outer circle) radii around the LHD vehicle. The total plot consists of side (1,5,A,E), front (2,3,4,B,C,D) and rear (6,7,8,F,G,H) sections. Percentage of (b) control group, (c) desktop group and (d) VR group participants that indicated the presence of a blind spot in each visibility plot section.
Safety 08 00052 g004aSafety 08 00052 g004b
Table 1. Results of self-report questionnaire and visibility multiple-choice by variable.
VariableN% in High Category p
Self-reported safe pedestrian behaviors after intervention
Control2556
Desktop26880.006
VR2191
Self-reported confidence levels in remaining within operator LOS in reverse direction after intervention
Control2516
Desktop26580.005
VR2157
VariableNMean ± s.d.p
Multiple-choice questionnaire score (total, %)
Control2563 ± 18
Desktop2659 ± 160.291
VR2166 ± 13
Multiple-choice questionnaire score (front-facing, %)
Control2574 ± 23
Desktop2671 ± 150.161
VR2181 ± 17
Multiple-choice questionnaire score (rear-facing, %)
Control2563 ± 28
Desktop2671 ± 240.179
VR2178 ± 18
Overall visibility plot shading accuracy
Control251.28 ± 0.74
Desktop260.79 ± 0.830.021
VR210.67 ± 0.73
Publisher’s Note: MDPI stays neutral with regard to jurisdictional claims in published maps and institutional affiliations.

