1. Introduction
Energy is a resource in nature that supports human survival and social progress. The Special Report on Global Warming of 1.5 °C published by the Intergovernmental Panel on Climate Change pointed out that the carbon-neutral target is to reduce the global carbon dioxide emissions by about 45% in 2030, compared to 2010, and to reach net-zero carbon monoxide emissions and realize net-zero carbon dioxide emissions in 2050 [
1]. In addressing the issue of global climate change and optimizing the world’s energy structure, the development and utilization of new energy have become a strategic choice for global energy transformation [
2]. Hydrogen energy is a kind of typical clean energy, which could be used instead of fossil fuels in many fields, such as industry and transportation [
3]. Hydrogen could be produced by steam methane reforming (SMR) [
4], carbon monoxide reforming [
5], partial oxidation reforming [
6], or auto-thermal reforming [
7,
8], among which 80–85% of the world’s total hydrogen production is accomplished via the SMR of natural gas [
9]. In the steam methane reforming process, the SMR equipment is full of raw gas mixed with a large amount of flammable, explosive, toxic gases and liquids, such as carbon monoxide, hydrogen, methane, and hydrogen sulfide. Furthermore, the temperature and pressure in SMR equipment are very high. Once the hazardous gases are leaked into the atmosphere, they may cause serious personal poisoning or explosion accident in a large area, which will cause significant economic losses. In order to timely discovery and disposal of the leakage of hazardous gases from SMR equipment, gas detectors are usually installed in the areas where it is prone to leak. The leaked hazardous gases will defuse from the leak sites around. When the leaked gases diffuse to the gas detectors and reach the alarm limit, the detectors will alarm or provide a signal for automatic emergency shut-down. However, the diffusion process of the leaked hazardous gases is affected by many factors, such as the direction of leakage surrounding geometries and weather conditions, etc. [
10]. The analysis of the hazardous gas diffusion from the leakage site around will provide guides for the optimized layout of gas detectors effectively and economically.
Experiments for the leakage and diffusion scenarios are usually hard to be realized. Thus, Computational Fluid Dynamics (CFD) simulation methods are commonly utilized to analyze the leakage and diffusion of gases.
Fanxi Bu et al. [
11] used the numerical simulation method to analyze the leakage and diffusion characteristics of natural gas in utility tunnels under various working conditions, including pressures, leakage diameters, ventilation conditions, and leakage locations, to suggest daily maintenance and accident prevention. Xuemei, Wang et al. [
12] studied the mechanism of small-hole gas leakage and diffusion under natural and mechanical ventilation by Fluent software to simulate and analyze the influential factors. The result found the optimal arrangement of the leakage detectors and determined the emergency ventilation schemes. Aihua Liu et al. [
13] simulated natural gas leakage and diffusion in three layouts to determine the natural gas concentration and dangerous areas through comparative analysis by CFD for guiding building layout and gas pipeline construction. Juwari et al. [
14] studied the external parameters of natural gas that affect the dispersion and explosion by FLACS software, including the influence of wind direction, vented enclosure hole width, and the presence of an obstacle. Regis Bauwens et al. [
15] focused on the effect of ignition location, vent size, and obstacles conduct ventilated explosion tests on propane-air mixtures to study explosion development and pressure buildup. Vázquez-Román [
16] used Ansys-Fluent to simulate leakage scenarios in eight wind directions and suggested a potential release should be detected at 2 m from release points to prevent concentrations above 20% LEL. Legg, S. W. et al. [
10] simulated the influence of multi-factor variables such as leak location, weather, and process conditions on gas diffusion to determine the optimal placement of gas detectors in petrochemical facilities by FLACS. Then, they suggested the optimal layout of gas detectors by Mixed Integer Linear Programming (MILP) formulation. DeFriend, Stephen et al. [
17] suggested determining the optimum spacing of detectors based on the combined risk from a representative selection of leakage scenarios rather than a worst-case evaluation. KELSEY et al. [
18] simulated a network of gas detectors incorporating detector alarm levels and response times to improve the performance of a detection system with well-placed detectors. Cancan and Zhou [
19] proposed a multi-objective optimization method for detector placement based on the leakage scenario and the consequence modeling, achieving a balance between the detection efficiency improvement and the required investment. Amirhosein Rad [
20] optimized the layout of detectors about an objective function that is defined based on the risk of scenarios and the arrangement of detectors. Sávio S.V. Vianna [
21] proposed an approach to optimize the number and location of gas detectors based on the color pattern of the set coverage problem graph. Kyeongwoo Jeon [
22] used a deep-neural-network-based surrogate model and the MILP to solve the detector allocation optimization problems.
In addition, some scholars combined mathematical planning to suggest optimizing the detector layouts. Jung Kwan Seo [
23], Bo Zhang [
24,
25], Lin Sun [
26], Fangming, Cheng [
27], and AJ Benavides-Serrano [
28] et al. predicted the leakage and dispersion consequences of CFD simulation and employed the Stochastic Programming (SP) method to find the optimal layout scheme.
However, the reported studies have not effectively integrated how the leakage risk factors affect the area size, concentration distribution, and changing characters. In this paper, the concentration of the gases leaked from SMR equipment is investigated with FLACS software systematically and compared with the first-level (25%LEL) and second-level (50%LEL) alarm threshold. Typical accident scenarios with different leakage apertures, medium pressures, and ambient wind speeds are established. The sites of gas detectors for effectively the first-level and second-level alarm are discussed. The orthogonal design method is used to rank the importance of each influencing factor. Recommendations are listed for the optimization of the layout of gas detectors in related enterprises.
3. Results
3.1. Leak Aperture
The leakage aperture is related to the leakage source strength, which is an important factor affecting the leakage and diffusion. The gases’ composition in the simulation is that of the reformer in the hydrogen production equipment. The ambient wind speed is 1 m·s−1 (typical wind speed), and the equipment pressure is 2.25 MPa (actual working pressure). The corresponding mass flow is calculated to be 1.3104 Kg/s, 5.1433 Kg/s, and 20.5732 Kg/s in the case of small-hole leakage (5 mm), medium-hole leakage (25 mm), and big-hole leakage (100 mm). In the “Petrochemical Enterprises Combustible Gas and Toxic Gas Detection and Alarm Design Specifications” of China, the first-level alarm threshold of combustible gas should be no more than 25% Lower Explosive Limit (LEL), while the second-level alarm threshold should be less than or equal to 50% LEL.
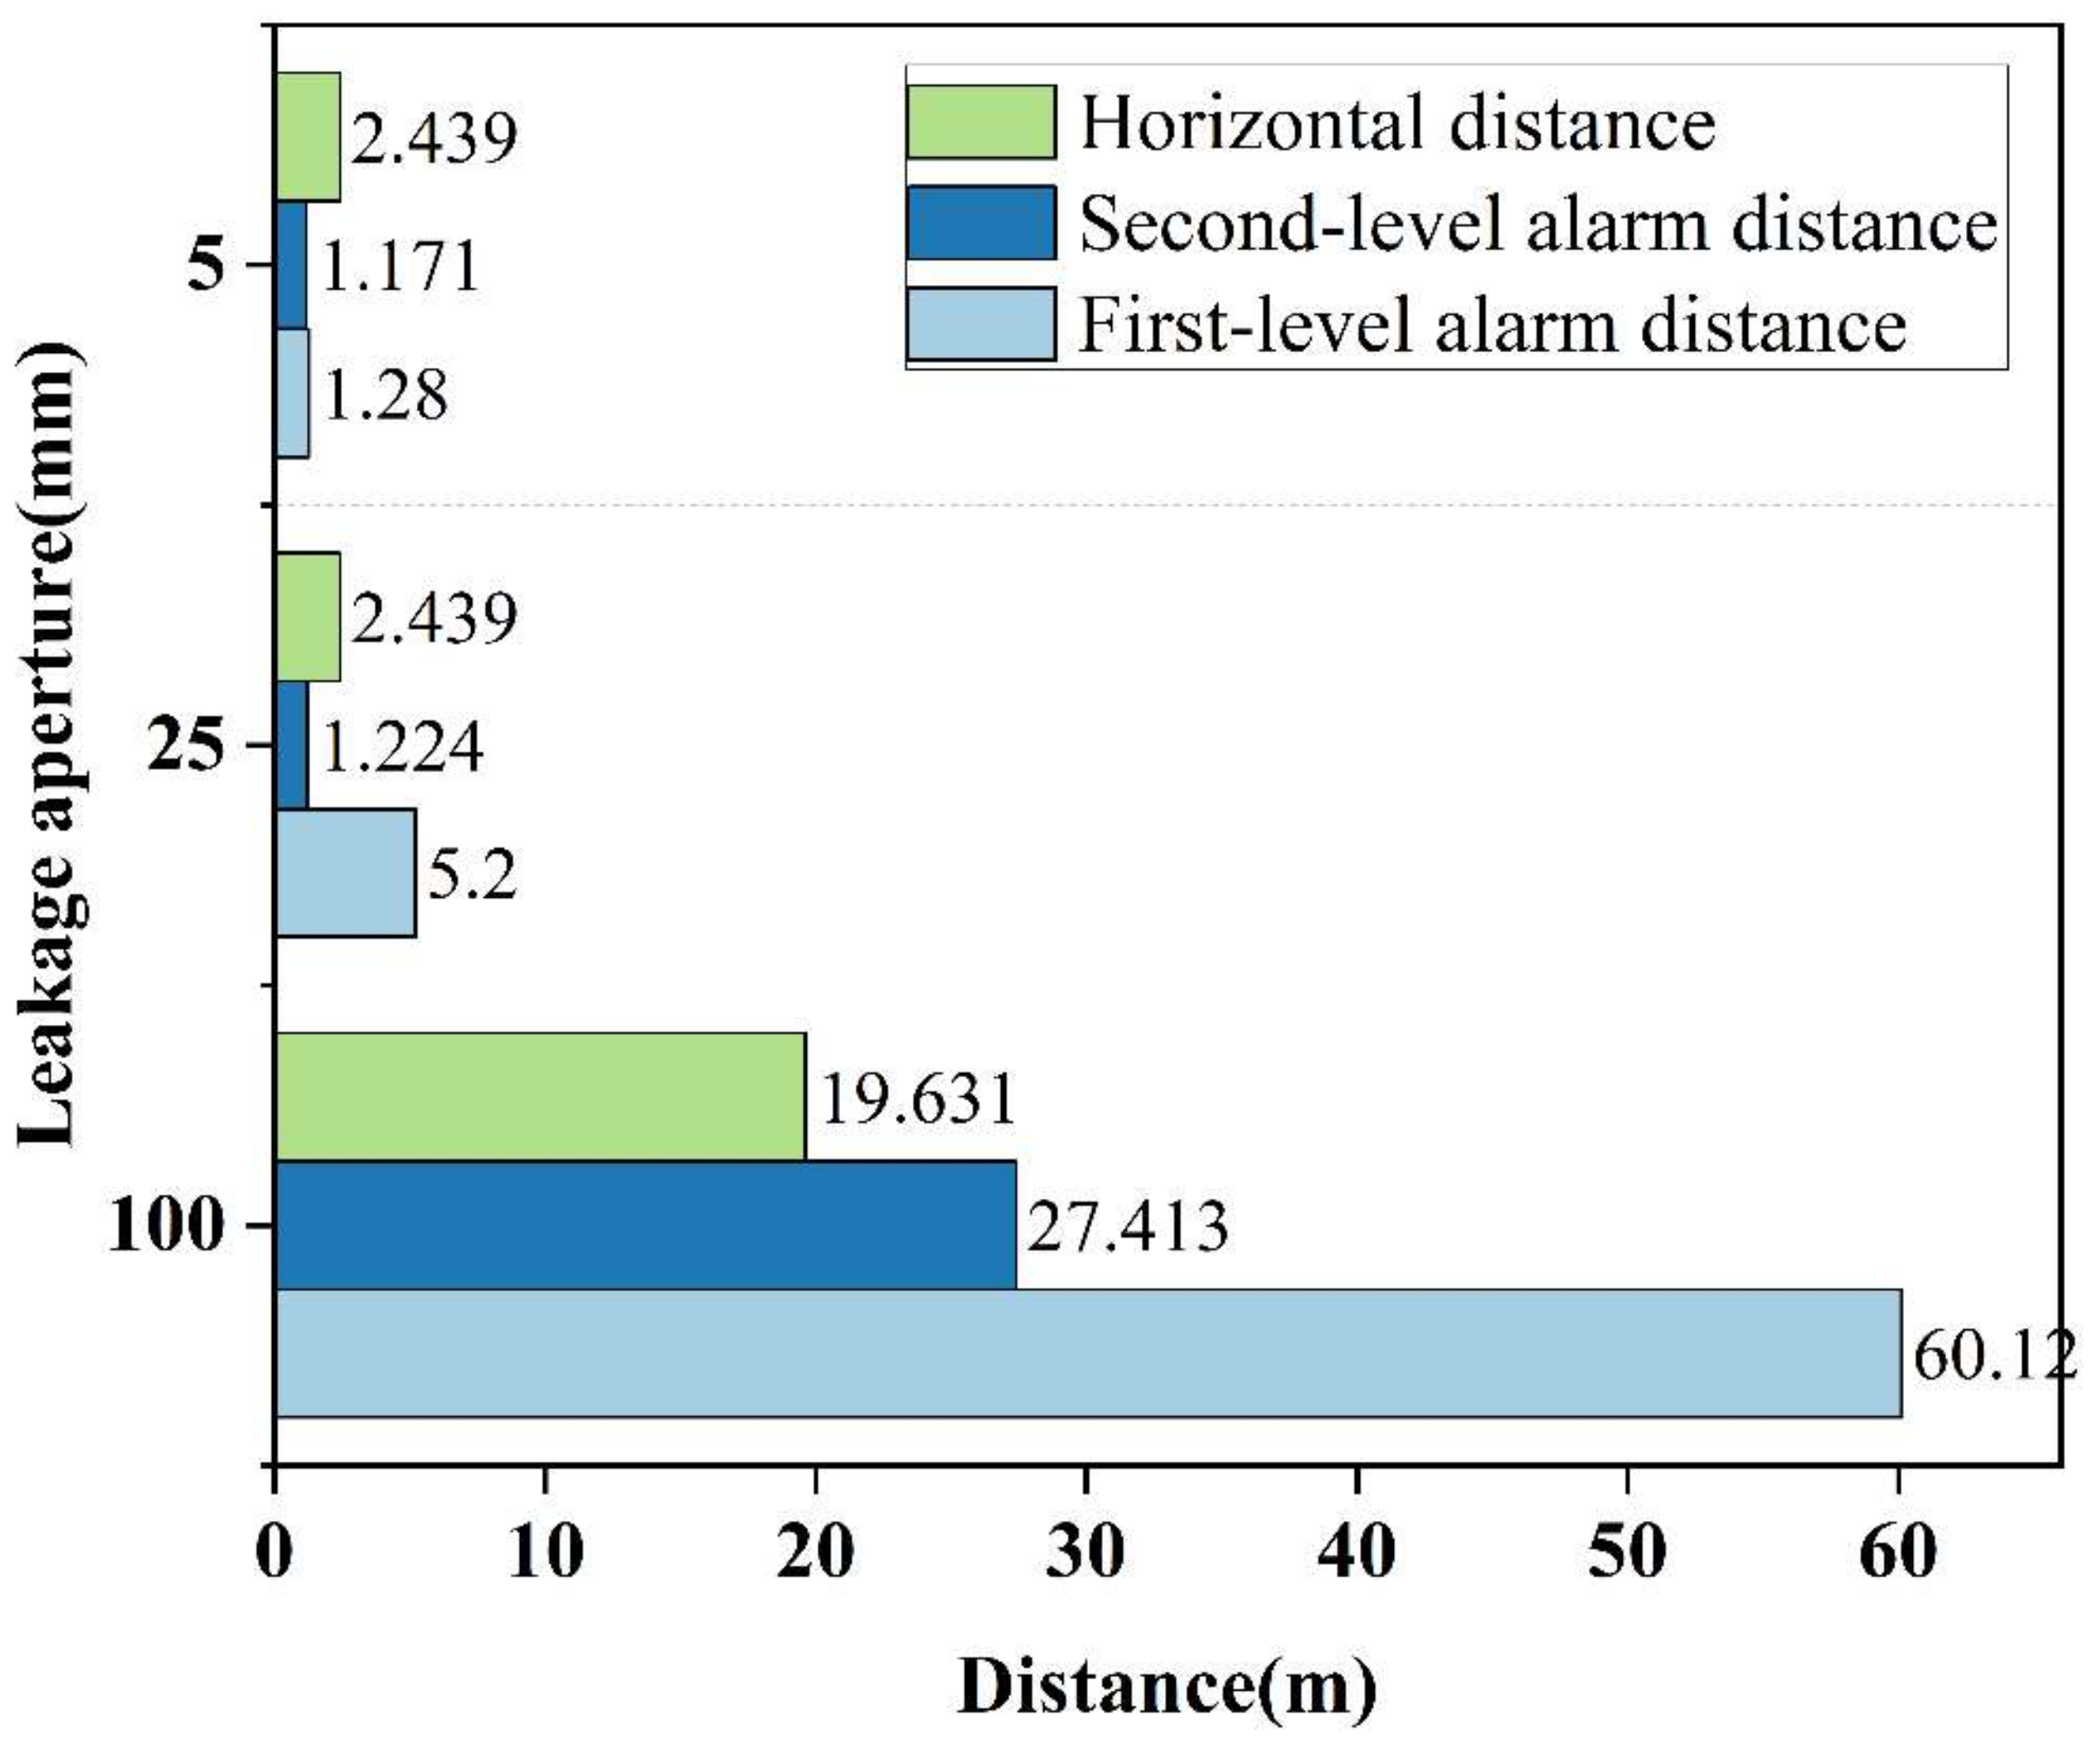
The farthest distance that the diffusion gas can reach the first-level and second-level alarm increases linearly with the growth of the leakage aperture, as shown in
Figure 3. The reason for this regularity is that the rise of the leakage aperture will increase the mass flow of the leaked gas per unit of time. Under the same wind speed, the gases can diffuse slightly farther. The alarm will be triggered when the gas detectors reach the alarm limit.
In
Figure 4, after leaking from the small hole, the gases are activated the fist-level alarm within 2.439 m, while the second-level alarm could be triggered when the detectors are located no more than 1.171 m. However, the concentration of combustible gas is 0.2% (
v/
v), which does not reach the LEL.
As for the middle-hole leakage scenario, the gas detector activatea with the first-level alarm at 5.200 m and the second-level alarm at 1.224 m. The high-concentration gas cloud concentrates near the leak point with 3.7% (v/v), which does not reach the explosion limit but can trigger the detectors for warning. After the big-hole leakage, the concentration of combustible gas within 10 m away from the leak point is too high to exceed the explosion range. The farthest distance where the gas cloud concentration reaches the second-level alarm is up to 27 m away from the leak point.
For pressure equipment, the installation position of the detector for small-hole leakage should be as close as possible to the leak point, such as within 5 m. As for middle-hole leakage need to fit the outdoor effective coverage of the horizontal plane radius of 10 m. In both cases, the detector’s position within 10 m is satisfied with the criterion. When the equipment with a higher risk of big-hole leakage, the diffusion gas can reach a broader range quickly. The installation distance can appropriately increase to 15 m for the economy. The traditional layout of the detectors is no longer suitable.
3.2. Wind Speed
The previous section shows that when the leak aperture is 5 mm or 25 mm, the leakage range is relatively small. Compared with the leak aperture of 100 mm, there is no apparent concentration dilution phenomenon in a short time affected by wind speed. Therefore, this section simulates the consequence of the flammable area and the gas concentration affected by different wind speeds with a leak aperture of 100 mm scenario. The pressure in the hydrogen production device reformer is 2.25 MPa (actual working pressure).
Meteorological conditions will intensify the heat and mass transfer between hazardous gas and air, which determines the mixed gases’ diffusion speed. In the southwestern region of China, the annual wind speed is at level-1 (from 0.3 to 1.5 m·s−1). This paper researches the diffusion characteristics of the gases at different wind speeds from 0.2 to 6 m·s−1.
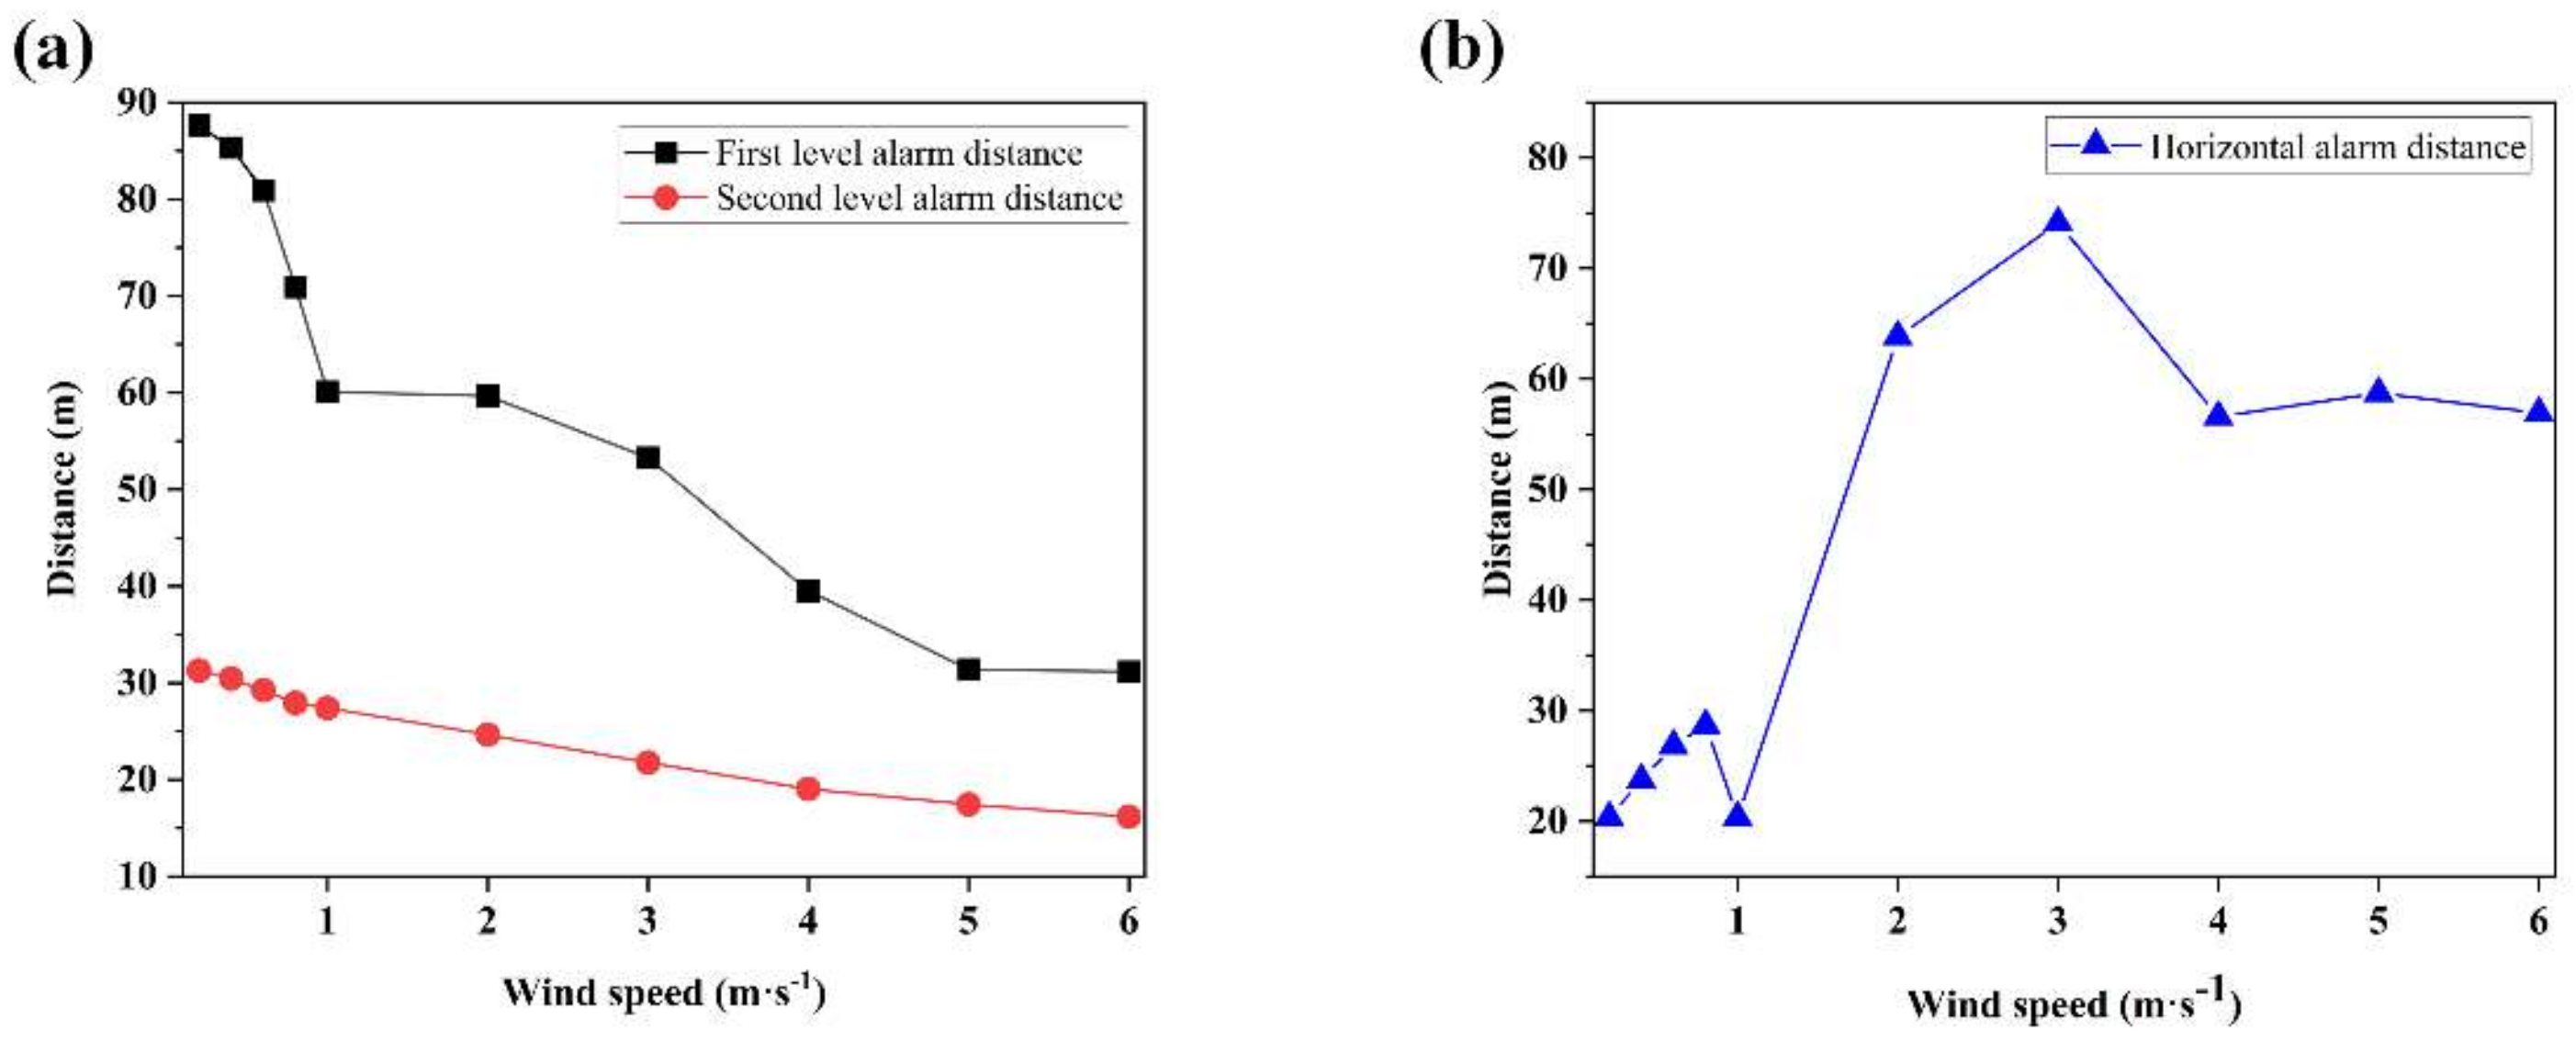
The farthest distances of the detector for the combustible gas leakage to reach the first-level and the second-level alarm gradually decreases with the increase of wind speed and finally tends to be stable, as shown in
Figure 5a. There is a turning point at the wind speed of 1 m·s
−1. The raw gases are lighter than air. The jet speed of the combustible gas leaked from the equipment is much faster than the wind speed after it leaks at 2.25 MPa from the reformer equipment.
When the wind speed increases gradually, the combustible gases’ flow speed is mainly affected by the wind speed. Horizontal diffusion distance is increased, and the farthest alarm distance is shortened. The decreasing trend of the combustible gas diffusion to the furthest alarm distance of the first-level and second-level becomes slower. Because the wind speed and the gas jet-speed are almost in equilibrium, the diffusion range does not change significantly. The turning point at 1 m·s−1 is that the wind speed affects the horizontal diffusion of the gas cloud. It indicates that the diffusion path shifts from the diffusion direction to the wind direction. The rising wind speed promotes the dilution of combustible gas. When the wind speed is at 3 m·s−1, the gas cloud is diluted and divided, which can reach the maximum horizontal distance. The continuously increasing wind speed directly dilutes the gas cloud without separation phenomenon.
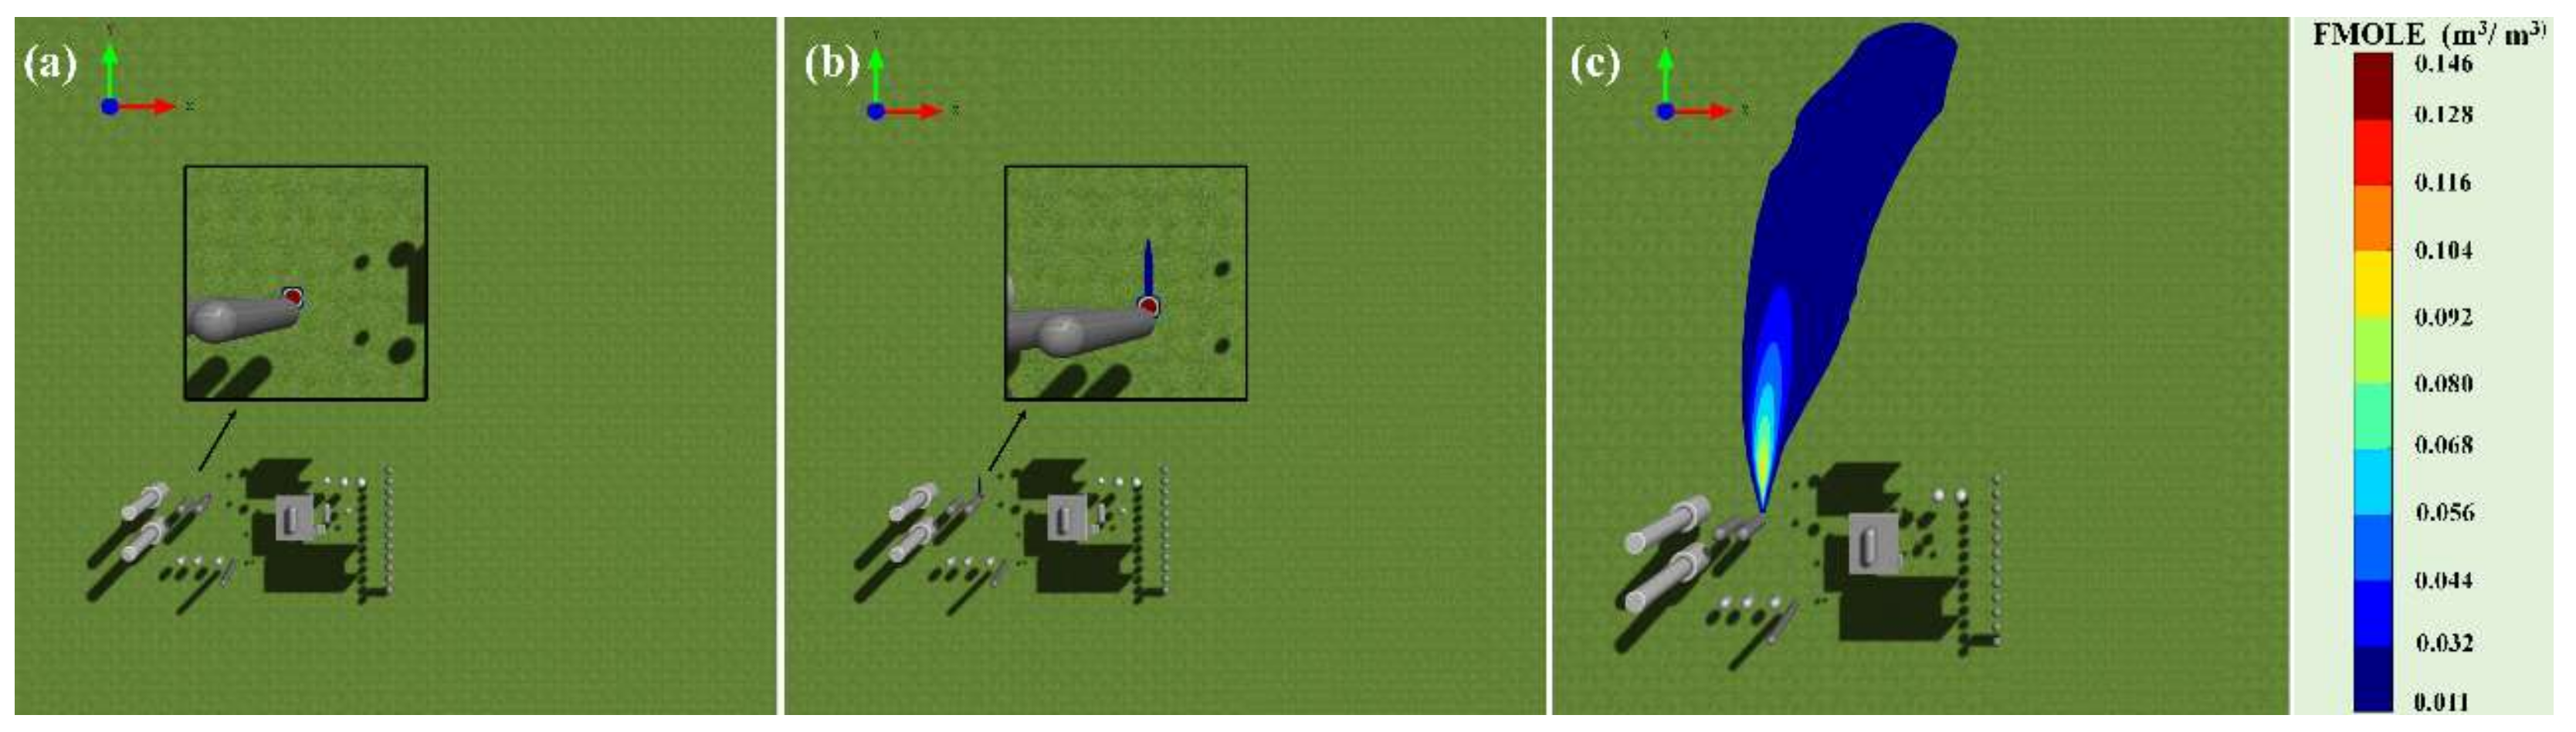
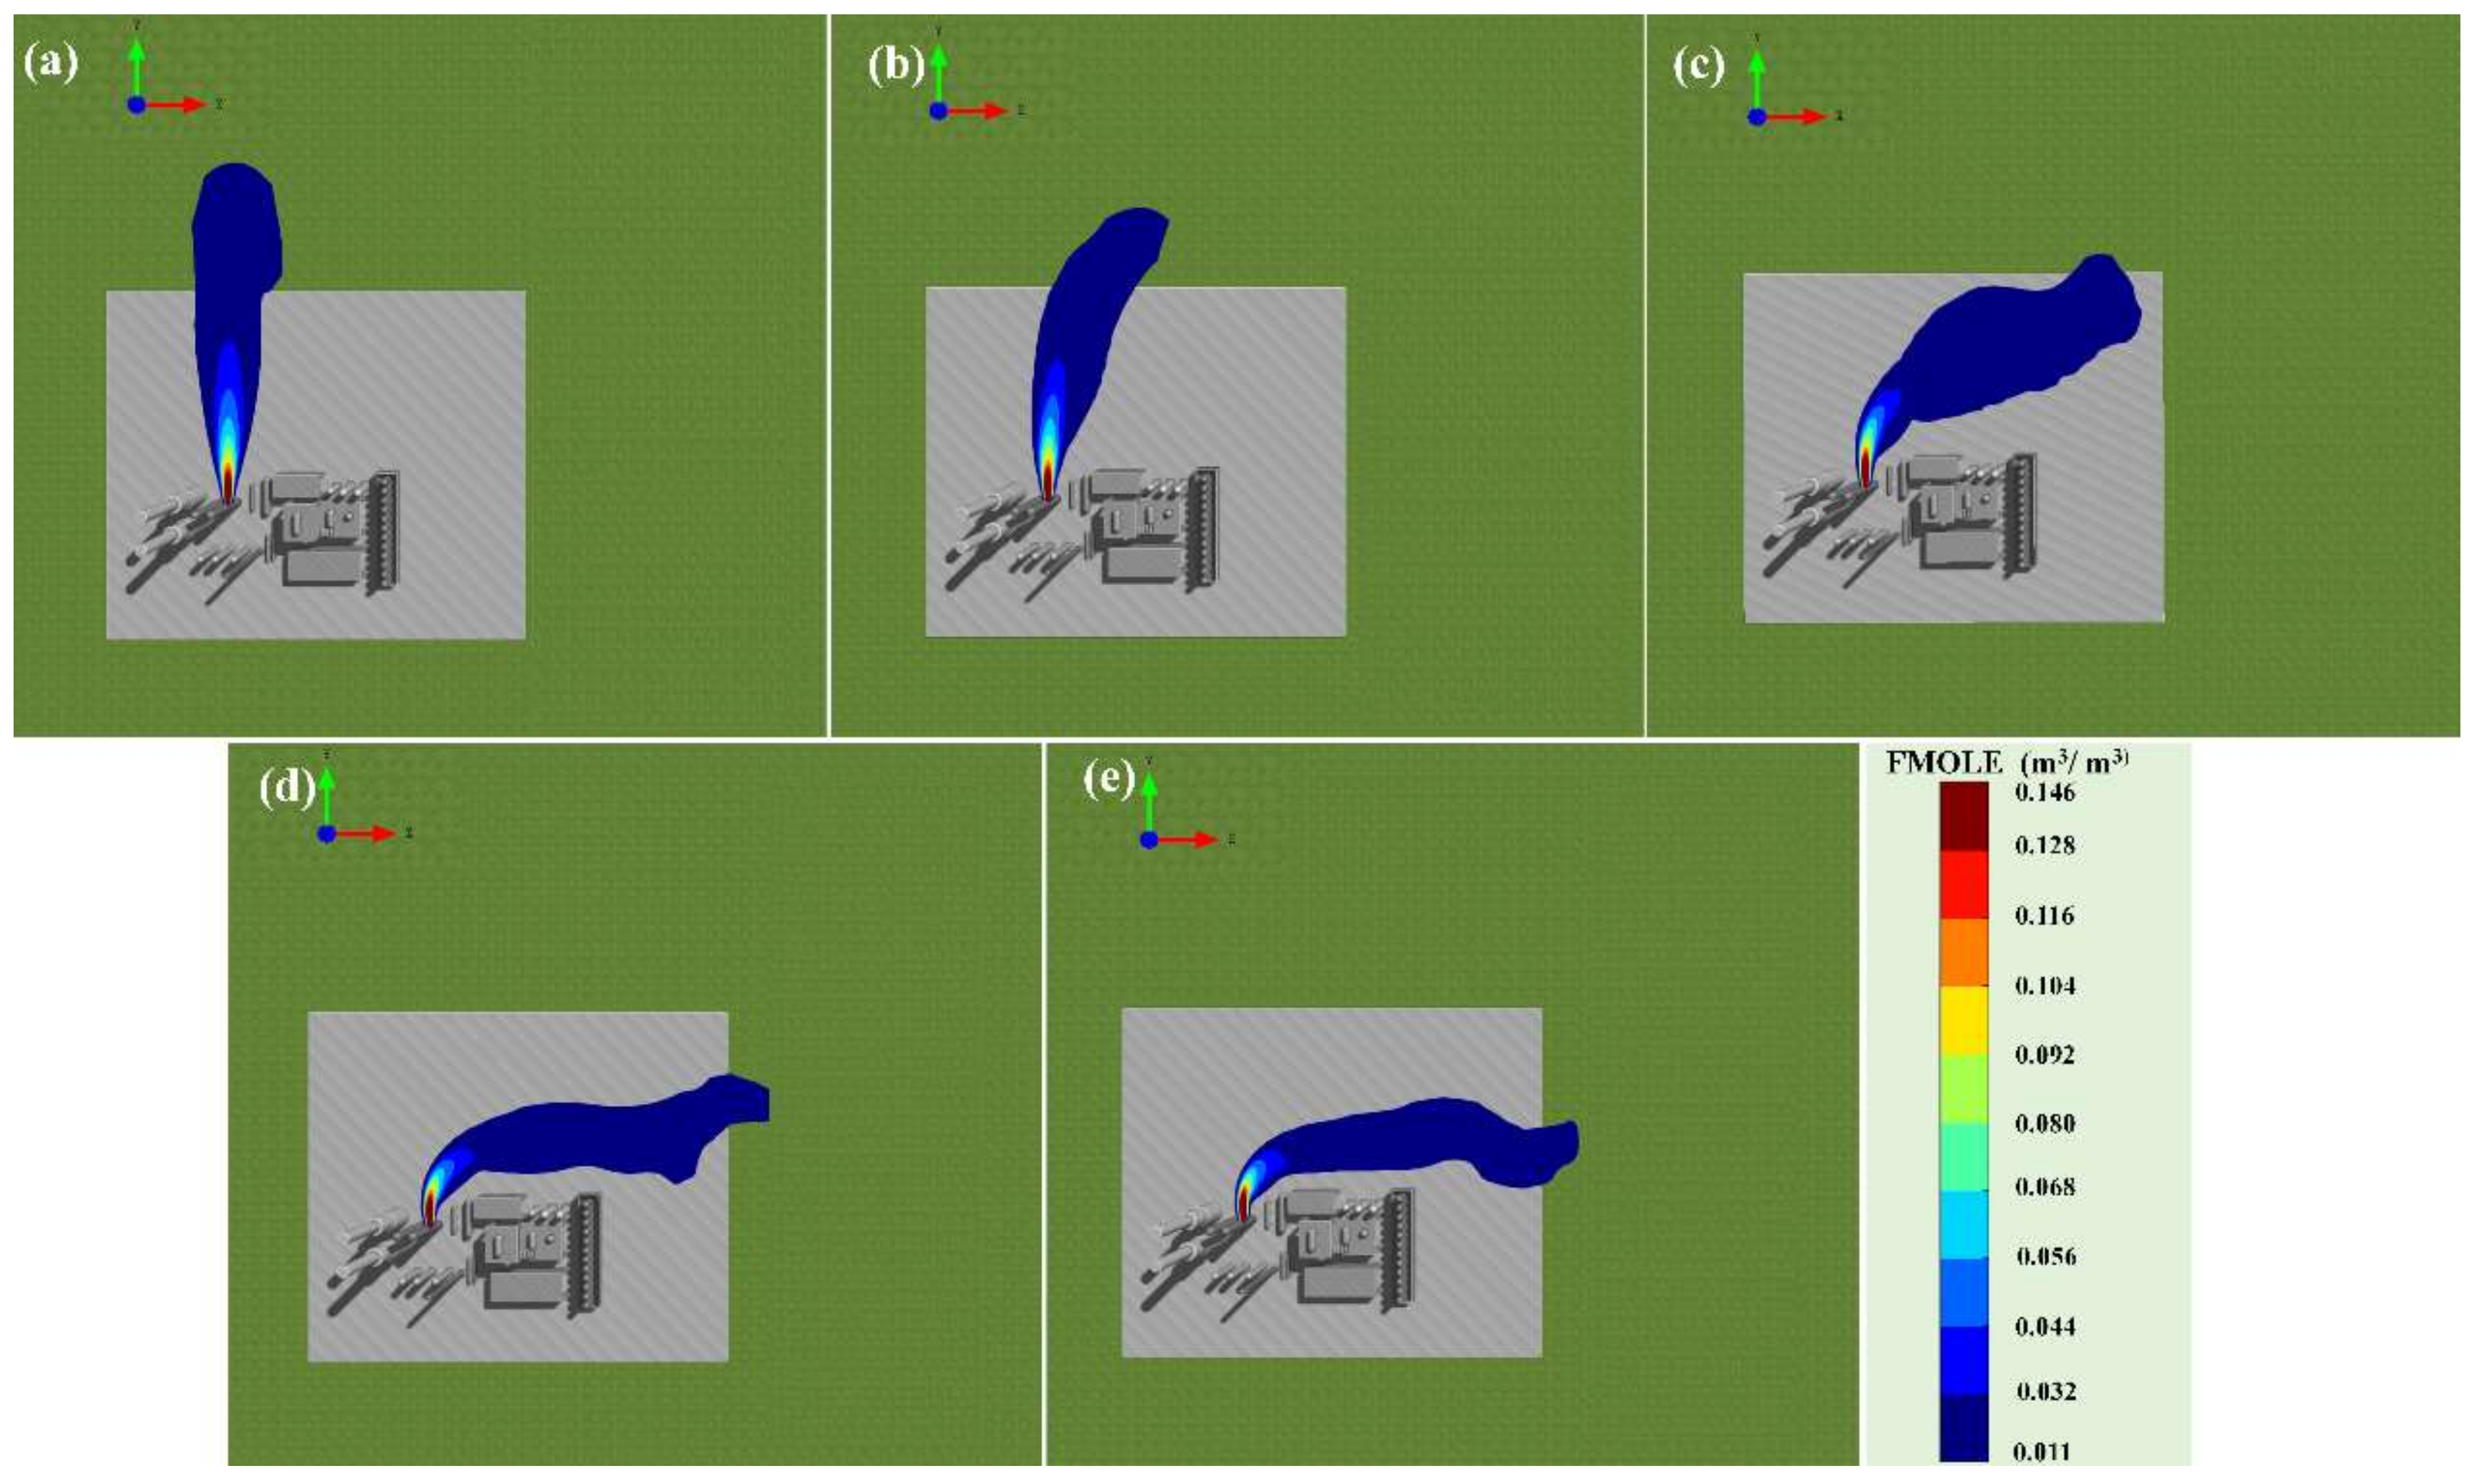
In
Figure 6, the diffusion path and concentration of the gas cloud are changed under the wind speed from level-0 to level-4. The smoke plume is slender in the static wind with a slight offset. The diffusion direction is mainly along the leak direction, and the gas cloud can reach a farther alarm distance. As the wind speed increases, the turbulence between the gas cloud and the air strengthens. The diffusion path is changed, and the concentration is decreased, which symbolizes the expansion in the horizontal diffusion range on the flat.
After the leakage accident, the gas concentration is higher at low wind speed, and the scope is broader with a higher risk. Appropriately increasing the combustible gas detector installation distance will be more economical in this case. As wind speeds increase, the cloud concentration dilutes, and the spread area gets smaller with less danger. In this case, the installation location should meet the reference standard. So even if the horizontal leak distance increases, the detector can monitor covering a radius of 10 m.
3.3. Medium Pressure
The medium pressure in the equipment is related to the injection speed of the leak point, which has a decisive influence on the flammable area. We calculated that the critical pressure of the mixed gas is 0.174 MPa by the flow state judgment formula. This section simulates the influence of medium pressure on gas diffusion and concentration. The leakage and diffusion process from equipment with a 100 mm leak aperture under 0.1 MPa (low pressure), 1 MPa (middle pressure), and 10 MPa (high pressure) are simulated and analyzed. Recommendations for flammable gas detector layout optimization will be given based on the results.
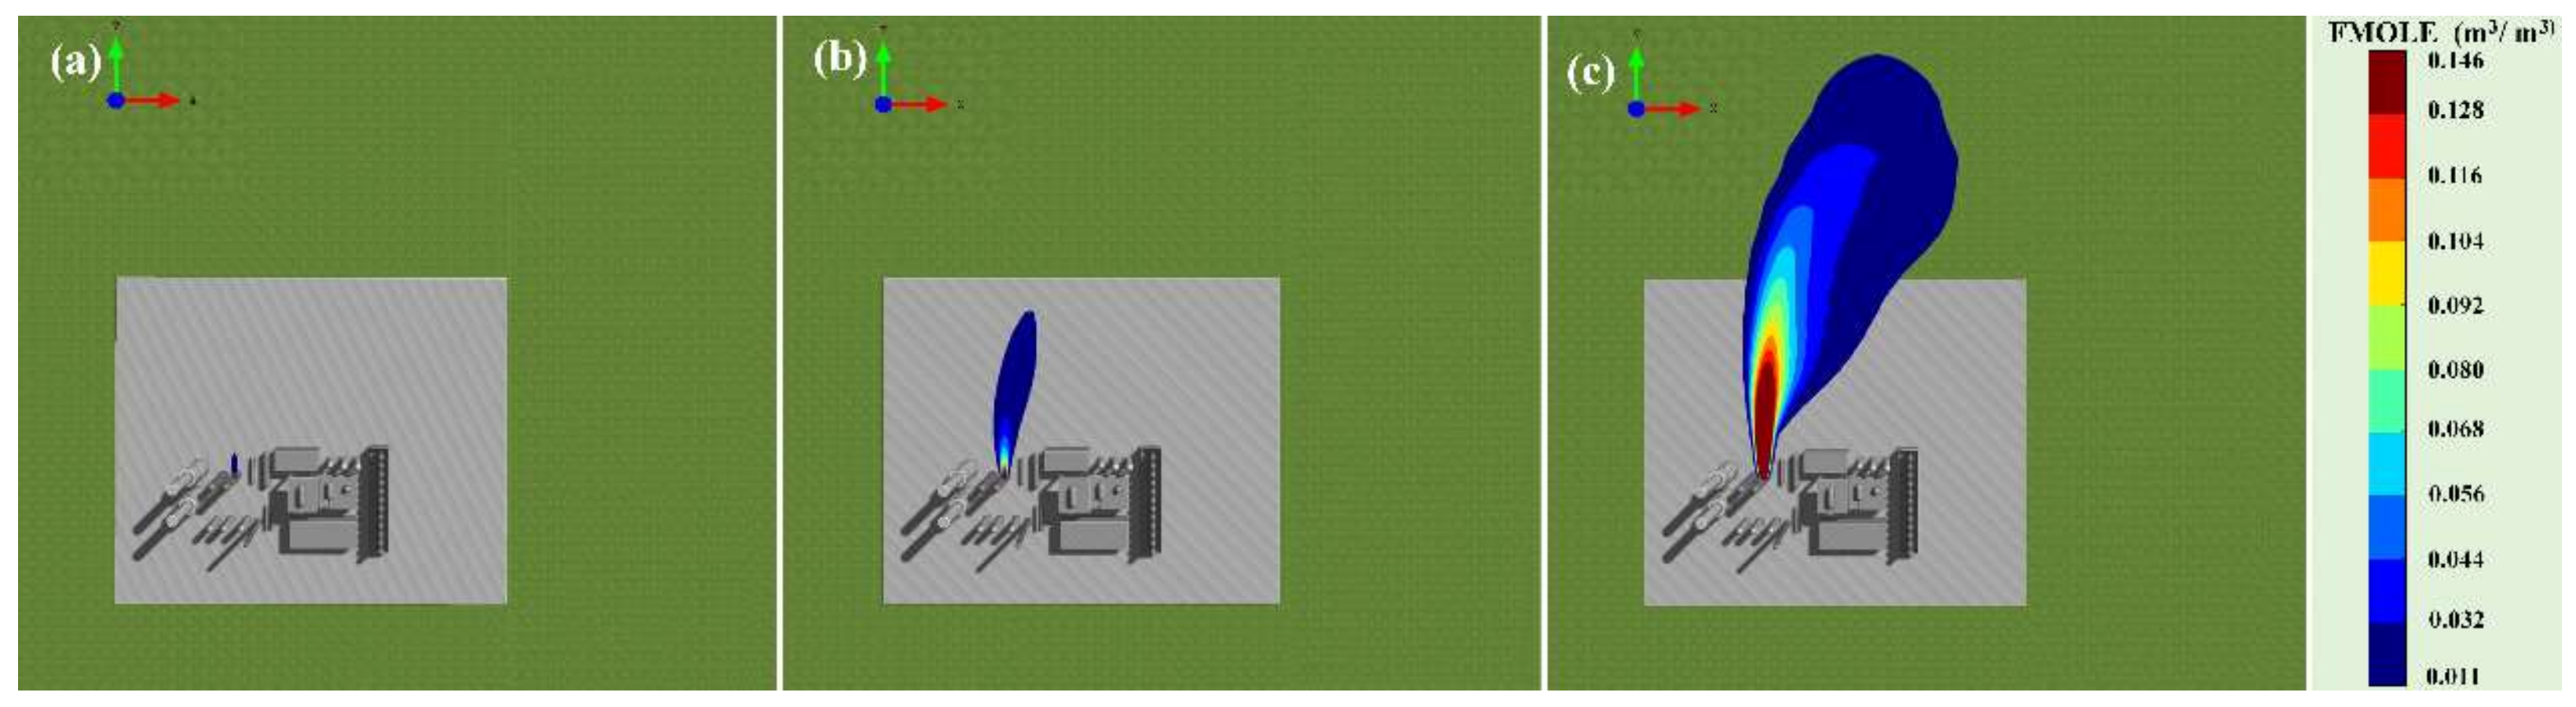
In
Figure 7, the farthest distances of diffusion gas that reach the first-level and second-level alarm gradually rise with the increasing pressure, and the horizontal diffusion distance also increases with the rise of pressure. There is a positive correlation between the medium pressure and the leakage mass flow under the steady leakage. Additionally, it impacts the horizontal scale of the flammable area.
Figure 8 shows that when a low-pressure leakage accident occurs, the combustible gas is mainly concentrated near the leak point. Due to the low initial medium pressure, the momentum carried by the leakage gas is downward, making the diffusion speed slow. The high concentration area is a small percentage of the overall diffusion range. The combustible gas from the leak point mixes with the surrounding air in diffusing. The diffusion gas concentration significantly drops to about 29% LEL, which is not within the alarm range. The continually increasing medium pressure increases the jet speed’s horizontal momentum at the leak point. The combustible gas reaching equilibrium with the atmosphere needs more time, raising the diffusion distance.
At the same time, the increase in the jet speed of the gas will intensify the entrainment of the air around it, so the gases dilute faster, and cloud concentration decreases more significantly than a lower pressure. From this, the speed declined, and the gas cloud could no longer maintain its original shape, fluctuated, and began to spread around.
When low-pressure leakage occurs, the equipment is less dangerous, and the diffusion distance that can spread to the detector is relatively short. In this case, the suitable installation of the detector should be less than 10 m. In case of medium pressure leakage, the detector can be installed according to the reference standard. For high-pressure leakage, the installation of the detectors can be adjusted appropriately according to the economy. Combined with the horizontal diffusion distance, we recommended installing a detector per 15 m near the equipment.
3.4. Analysis of Main Influencing Factors
The above three sections analyze the influence character of the effective detection range of leakage diffusion from different aspects. They conclude leak aperture, wind speed, and medium pressure. However, various factors intersect and comprehensively exist under actual working conditions, rather than a separate algebraic superposition and simple sorting. To determine the proportion of each influencing factor to the effective detection range, the variation characteristics of each factor were analyzed. In this section, the orthogonal experimental design is used to analyze the influence of the three factors of leakage aperture, wind speed, and medium pressure on the effective detection range.
This simulation selected the most typical parameters of each factor. Obviously, small-hole leak aperture (5 mm), middle-hole leak aperture (25 mm), big-hole leak aperture (100 mm), level-0 wind speed (0.2 m·s
−1), level-1 wind speed (1 m·s
−1), level-2 wind speed (2 m·s
−1), low-pressure (0.1 MPa), middle-pressure (1 MPa), and high-pressure (10 MPa). The orthogonal table used is L
9 (3
3). According to the orthogonal table and factor levels, the orthogonal results of the simulation calculation by FLACS are shown in
Table 1.
The results analysis via variance. The sum of the squared sum of the variance and random errors of the factors was equal to the squared sum of the total variance of the data by the F test comparing the values of each factor to judge whether the effect of the factor was significant. Because there is no blank column in this table, each factor’s smallest square of variance is regarded as a random error. The consequence of the variance of the simulation is in
Table 2.
The results show that under different factors comprehensively cross affected, the leak aperture has the most significant influence on the effective detection range of combustible gas in the SMR process, followed by the medium pressure, and finally the wind speed. When arranging combustible gas detectors near the high-pressure device in the hydrogen production plant, the risk probability of leakage aperture should be considered first. Then, the medium pressure and wind speed should be considered when a realistic scenario where various influencing factors exist comprehensively.
4. Conclusions
In order to optimize the layout of combustible gas detectors, the leakage and diffusion of hazardous gases from SMR equipment are investigated by FLACS software. Scenarios with varied medium pressure in equipment, leak aperture, and ambient wind speed are established and analyzed.
The orthogonal analysis shows that the most significant influence factor on the diffusion process of the combustible gas is the leakage aperture, followed by the medium pressure, and finally by the ambient wind speed. In the small-hole leakage, the gases trigger the farthest distance of the first level and the second level are 1.290 m and 1.178 m, respectively. The diffusion distance mainly depends on the leak aperture. The farthest first-level alarm and second-level alarm correspond, respectively, to 28.48 m and 5.98 m when the scenario occurs in medium pressure of 10 MPa and wind speed at 1 m·s−1 with the middle-hole leakage. Three factors cross-influence the gas leakage and diffusion in this case. The gas leaked from the big-hole leak aperture with the wind speed of 0.2 m·s−1 and the medium pressure of 10 MPa can reach the farthest first-level alarm distance at 83.98 m and the second-level alarm distance at 63.141 m. The diffusion speed is affected by the mass flow rather than the wind speed.
The farthest first-level and second-level alarm distances of gases will arrive at 1.280 m and 1.171 m by gases in a small-hole leakage scenario. It would be best if the place of the gas detectors is far from the potential leak point within 5 m. In the middle-hole leak accident, the distance of 5.200 m and 2.439 m reached the threshold of the first-level and second-level alarms. Installing gas detectors 5 m to 10 m from the leak point is recommended. The gases can reach a horizontal distance of 19.631 m to respond to the gas detector in a big-hole leak, so the position of the gas detector from the leak point can be increased from 10 to 15 m. The gas diffusion process is riskier in the static ambient wind state. However, the diffusion path and the drop of gas concentration occur at a wind speed of 1 m·s−1, and the farthest distance is shortened to 20.360 m in horizontal diffusion. Medium pressure affects the mass flow rate, which determines the initial leakage concentration of the gas cloud. Thus, it is related to the alarm level of the gas detectors. High-pressure gas leakages are often accompanied by high-concentration gas clouds. When this scenario occurrs, the equipment ought to be cut off in time to prevent significant accidents.


