Article

A Rider-Centered Critical Decision Method Study to Better Understand the Challenges to Further Uptake of Cycling

1
Institute for Future Transport and Cities, Coventry University, Puma Way, Coventry CV1 2TT, UK
2
SMI-MISHC, University of Queensland, Brisbane, QLD 4072, Australia
*
Author to whom correspondence should be addressed.
Submission received: 8 December 2021 / Revised: 25 January 2022 / Accepted: 26 January 2022 / Published: 30 January 2022

Abstract

:
Despite the many benefits of cycling, there is still a widespread perception that riding bicycles on public roads is unsafe. There has been a substantial increase in cycling research over the past decade, but little work has explored the challenges to greater uptake of cycling from a rider-centered perspective. To explore this, our research undertook a large international survey for experienced cyclists in which rider perspectives were explored using an in-depth process called the Critical Decision Method. The results revealed a wide range of self-reported cycling experiences, and most respondents classified themselves as either strong and fearless or enthused and confident. Few actual differences with respect to threatening incidents and rider countermeasures were present, illustrating how overall similarly experienced cyclists respond to threatening incidents. An overarching summary of all survey responses is presented with respect to each gender, then a more specific case study of two riders, one female and one male, is presented showing how many emotions and fear responses were similar for the different riders, but their coping strategies and reactions were somewhat different. It is concluded that further work to explore the issue from a rider-centered perspective is needed, and that the wide variety of cyclist types implies that there is no single recommendation for encouraging greater uptake of riding.

1. Introduction

1.1. Cycling Benefits and Disbenefits

There is a multitude of benefits to riding a bicycle. Typically, cycling-related research acknowledges the importance of cycling for a variety of reasons including the advantages of increasing the mode share to help improve congestion and air pollution, the health benefits of active transportation (Dill, 2009; Foley et al., 2016) [1,2], and the mental health benefits of commuting by bicycle (Humphreys, et al., 2013; Willis et al., 2013) [3,4].
Over the past several years, there has been increasing interest and research on bicycling, infrastructure, and road safety. There has been research examining the fear of cycling, its perceived and actual risk (Chen 2015; Chaurand and Delhomme, 2012) [5,6], and the perceived vs. actual rule-breaking which cyclists are accused of (Marshall 2018) [7]. In 2016, the UK Near Miss Project (Aldred) [8] recruited cyclists in the United Kingdom to keep a cycling diary and write about their ‘near misses’ and ‘close passes’. She asked respondents to describe what happened and how they think these events may have been prevented, thus giving additional insight into infrastructure and road users’ behaviour. Aldred (2018) [9] noted, “It was concerning that cyclists with under two years’ cycling experience reported substantially more incidents that more experienced cyclists—including twice the daily number of ‘very scary incidents’” (p. 168).
In Great Britain, the number of cycling fatalities generally decreased over the last 10 years from a high of 118 killed in 2012 to 100 in 2019 (Cycling UK, 2021) [10]. In the United States, the numbers vary depending on the source. According to the National Safety Council (NSC), the number of cycling fatalities has increased from 793 in 2010 to 1089 in 2019 (National Safety Council, 2021 [11]). However, according to the National Highway Traffic Safety Administration (NHTSA), the number of cycling fatalities decreased to 846 in 2019. In general, bicycling fatalities account for 2% of all traffic-related fatalities in the United States. These numbers indicate that cycling fatality rates are relatively more rare than those of other modes. Despite the relative rarity of fatal crashes, increasing cycling mode share still has multiple seemingly insurmountable challenges due to factors such as vulnerability of bicycle riders when sharing the road with motor vehicles.
Given the road safety concerns, there has been research on indicators of safety. For instance, the passing behaviour of drivers has been researched. Walker and Robinson (2007) [12] found that a bicycle rider wearing a helmet or not influenced passing distance while Ampe et al. (2020) [13] found that presence of a child in a trailer positively influenced passing distance. Miller et al. (2017) [14] looked at the use of “conspicuity aids” and cyclist crashes finding “… no evidence that cyclists using conspicuity aids were at reduced risk of a collision crash compared to non-users after adjustment for confounding, but there was some evidence of an increase in risk” (p. 64).
Multiple researchers have broken bicycle riders down into varying typologies to research differences and behaviours. The Cycling Typology/Four Types of Cyclists (Geller, 2006; Dill and McNeil, 2016) [15,16] is used as a self-classification system for cyclists about their comfort levels while bicycling on the road. The four-cyclist typology is: no way no how, interested but concerned, enthused and confident, and strong and fearless. Chaloux (2019) [17] generated another cyclist typology and used it to compare reactions to varying road scenarios and rule following by different cyclist types. They found that “[u]niquely defined by their motivations to cycle, fearfulness, confidence, and lawfulness, all six cyclist types were in agreement when breaking the rules. The similar approach to rule-breaking taken by all cyclist types reveals the impracticality of traffic laws that do not consider the unique mode of cycling in enforcing safety” (p. 42).
Other have researched so-called scofflaw cyclists and their adherence to rules. For instance, Niaki et al. (2019) [18] looked at time-to-collision rates and infrastructure types for cyclists in Canada. Marshall et al., (2017) [7] found in a survey of almost 18,000 respondents that cyclists behave in a rational manner responding to roadway conditions and the “overwhelming majority of bicyclists are not reckless, even when combining the high-risk factors” (p. 21), while Huemer et al. (2018) [19] used cyclist focus groups and travel diaries to develop a list of most common cyclist anger events finding that ‘anger events’ formed clusters around: Interaction with car drivers; Interaction with other cyclists; Interaction with pedestrians; Rules and Laws; Infrastructure; and Environment and cycling conditions.
Møller and Haustein (2017) [20] adapted the driving anger expression inventory (DAX-short) for cycling creating the cycling anger expression inventory (CAX) via an online survey of Danish cyclists. Møller and Haustein found that similar to driver anger, “male drivers and cyclists express more anger whereas women show more constructive behaviours” (p. 359). While anger did vary somewhat according to culture (Denmark vs. UK and Ireland), their CAX results showed “a complex relationship between gender and anger expression” and that as with drivers, as people age, they exhibit less verbal anger and instead more constructive behaviour (p. 359).

1.2. The Critical Decision Method

As the objective of this research was to obtain a deeper perspective on cyclists’ experience, behavior and emotions after on-road incidents, the Critical Decision Method (CDM) was chosen as the approach to obtain such cyclist-centered information. CDM is a structured interview process that is typically used to elicit information and knowledge from experienced personnel about their decision-making, understanding, and problem-solving processes during non-routine critical incidents (Crandall, Klein and Hoffman, 2006). The method often involves the use of ‘probe’ questions in an interview/survey format to uncover the kinds of knowledge on which decisions are based, and the technique allows such interviews to people’ thinking from operational and general accounts of an incident into more descriptive retelling of their problem-solving processes during the critical incident (Horberry and Cooke, 2010) [21].
The CDM process is often found to be effective in revealing expert’s knowledge, especially tacit knowledge, reasoning, sense-making and decision strategies (Crandall, Klein and Hoffman, 2006) [22]. Previous work has examined CDM in other fields such as mining, nuclear power, aviation, and medical error, especially to identify perceptual and cognitive needs for aiding decision making, and to investigate incidents by reconstructing and understanding how operators made sense of the situation they were faced with (Klein, 2008; Horberry and Cooke, 2010) [21,23]. Until now, the CDM process not been extensively used in cycling safety, but one recent study by Salmon, Dallat and Clacy (2017) [24] used the method to explore situation awareness and teamwork in elite women’s cycling. That focus on competitive cycling differs from the research presented here that examines everyday cycling on public roads.

1.3. Research Purpose

This paper contributes to the cycling literature on emotions, coping, and on-road experiences. It also broadens the scope of the Critical Decision Method (CDM) and adds to its experimental literature to better understand the challenges to further cycling uptake. More specifically, this research explored bicyclists and their thoughts, emotions, and experiences while experiencing threatening driver behavior using the responses from both genders of respondents. Given that females are less likely to cycle than males for a variety of reasons, this research aims to better understand possible emotional differences amongst experienced bicycle riders of both genders. This work gleans additional insight into the experiences of cyclists, the emotions they experience while under threatening situations, and delves into how and why experienced cyclists continue to ride in the face of stressful and/or dangerous road conditions. However, hurdles remain in increasing the bicycling mode share due to multiple societal shortcomings such as the lack of safer infrastructure or rider training. More broadly, this study also seeks to demonstrate the utility of the CDM framework in evaluating bicyclists’ perspectives on cycling.
This article does not question or measure the actual risk of cycling or examine the general public’s fear of road bicycling. Instead, there is a gap in the literature looking at the breadth and depth of emotions that cyclists experience when under threat from a motor vehicle. This research aims to begin to understand what cyclists feel and how they respond in the face of threatening road situations starting with a hypothetical incident presented via the CDM method.

2. Materials and Methods

2.1. Procedure: CDM-Cycling Process Description and Generic Incident Employed

The data were collected by means of an online survey that employed a CDM approach. The preliminary survey questions regarding cycling experience were adapted/taken from Women’s Cycling Survey 2016 [25]. The research adapted the ‘classic’ CDM method (as outlined by Crandall, Klein and Hoffman, 2006) [22]. As well as adapting it to the cycling/road environment context (e.g., in the terminology used), it also used a survey rather than an interview process to collect the data. More specifically, the CDM process was undertaken by means of an online survey in which a realistic cycling incident scenario was used elicit the information.
The intention was to use a commonly-experienced type of incident that would be broadly familiar to riders around the world. It was piloted with three experienced riders (both US and UK based) to validate it as representative. The scenario employed was:
You’re riding your bicycle home from work on a dry and sunny day. It is a route you are familiar with and have cycled on many times before. The stretch of road you’re currently cycling on has an on-road bicycle lane with a painted, white stripe. The bike lane is roughly 1-metre/yard wide, and the speed limit is 40-mph.
You’ve been riding along this road for about 10 min, already passing through a few traffic signals, and you can see another bicycle rider a hundred yards ahead of you. You see another traffic signal coming up and pass a red lorry [truck] on your way up to the light. The motor vehicle traffic this road has been slow and congested but your ride has been smooth due to the bicycle lane. You’ve passed this lorry a couple of times already along this stretch of road—the last time the driver shouted at you, saying “get off the road!” You’ve heard comments similar to this before, so you ignore it, and continue on to the stop line at the junction [intersection] where you wait for the traffic signal to change.
The signal turns green and you continue riding along. Shortly after cycling through the intersection, you hear a large vehicle coming up quickly behind you. You continue riding in the bike lane and the red lorry driver passes very closely by your elbow, the gust of the passing knocking you off balance a little. You stay upright and continue cycling toward home.
The CDM process used in this research occurred in four stages (also known as ‘sweeps’) within the survey, with a series of structured probes to re-construct and expand aspects of the generic incident. The multiple ‘sweeps’ were made to progressively deepen understanding of the challenges faced and strategies employed by cyclists to cope with the situational, environmental, and domain demands in the road environment. As the above-mentioned generic incident was used, sweeps 1 and 2 were shortened compared to when a new incident needed to be identified by the participant.
Sweep 1: Incident Identification and Selection. Using the previously-mentioned realistic generic scenario, this stage made sure the participants understood it and had previously experienced a similar event in the past. Likewise, in Sweep 2 (Timeline Construction), this sweep further expanded the generic scenario to personalize it to other cycling incidents the participant had experienced. Here, a timeline of the incident was constructed that allowed for the identification of critical junctures, or decision points.
Sweep 3: Deepening Understanding. In this Sweep, the survey attempted to understand the participants’ sensemaking of the situation. To gain this information, the researchers reviewed the critical junctures again, asking the participant a series of deepening probe questions. The probes were generally aimed at determining the information available in the incident, the meaning of this information as interpreted by the participant, and the thoughts and issues they provoked.
Sweep 4: “What if” Queries. The last Sweep involved the survey posing a number of hypothetical changes to the event in the form of ‘what if’ questions. The participant was asked how their responses would have altered and/or if the outcome might have changed. This was to gain a deeper understanding of the experience, skills, and knowledge of the participant. It was also useful in seeing if the information gained could be generalizable. An example here was how might the incident have been altered if the rider was an inexperienced cyclist.

2.2. Participants

In total, 138 participants (43 female, 95 male) completed the online survey. The study reported here took place during 2020 and early 2021, during the COVID-19 pandemic. The authors therefore chose this method to eliminate in-person meeting as well as reach the largest number of respondents. Ethical approval (number P109729) was granted by Coventry University in 2020. Given the parameters of the CDM framework, the authors sent out a Call for Participants directed specifically at experienced bicycle riders. The Call with project information and a link to the survey went out via various online channels including email, Facebook cycling groups, and Twitter. Three popular cycling Twitter accounts shared the call with Tweets which helped to substantially increase the number of respondents.
The survey respondents’ countries were divided up between the United Kingdom (29%), the United States (61%), and Other countries (10%). The respondent gender balance was predominantly male (69%) which is similar to the gender balance of cyclists in the UK as well as the US. 2019 data from a UK travel survey found that males made almost 2.5 times more trips by bicycle than women. This difference has narrowed, however, during the COVID-19 pandemic with more women in the UK cycling [26].
The respondents were largely in the middle-aged range with 37% of the respondents in the 50 to 59 years category (Figure 1). There were no respondents in the 80+ year range.
(Note, the gender balance of the respondents was more than 60% female until the online survey link was shared widely on Twitter. Once the link was shared on Twitter, the gender balance shifted to mostly male, perhaps reflecting a male bias for that network or at least of the followers of the Twitter accounts who shared the link.)

2.3. Coding Reliability and Data Analysis

Where the analysis required coding based on the free text written by participants (for example, their strategies and responses as seen below) two independent raters were employed. The final inter-rater agreement was 95%. The process used was that the two raters each independently scored a sub-set of the responses and the outcomes were compared: this found that agreement was found in 68% of cases. A ‘Delphi’ style process (as used by Marling et al., 2020) [27] was used in which the two raters discussed their ratings and a consensus was reached about coding. Using this refined coding, the two raters then rated a second sub-set: and their agreement was now 95%.
Survey analysis involved multiple stages, including cleaning and coding of the data, using Excel for content analysis. In total, 138 participants completed the survey thus creating a large dataset of short answers reflecting on the thoughts and experiences of a threatening road scenario ‘experienced’ by experienced cyclists.

3. Results

We asked respondents to classify themselves according to Geller’s (2006) [15] cycling confidence typology. This typology classification is not limited to those who are currently bicycle riders. It is recognized that these survey respondents were not fully representative of the general public as they were specifically recruited for their expertise; however, we chose this typology for its ease of use and understanding given the international reach of the survey.
The respondents (n = 138) classified themselves as follows (Figure 2):
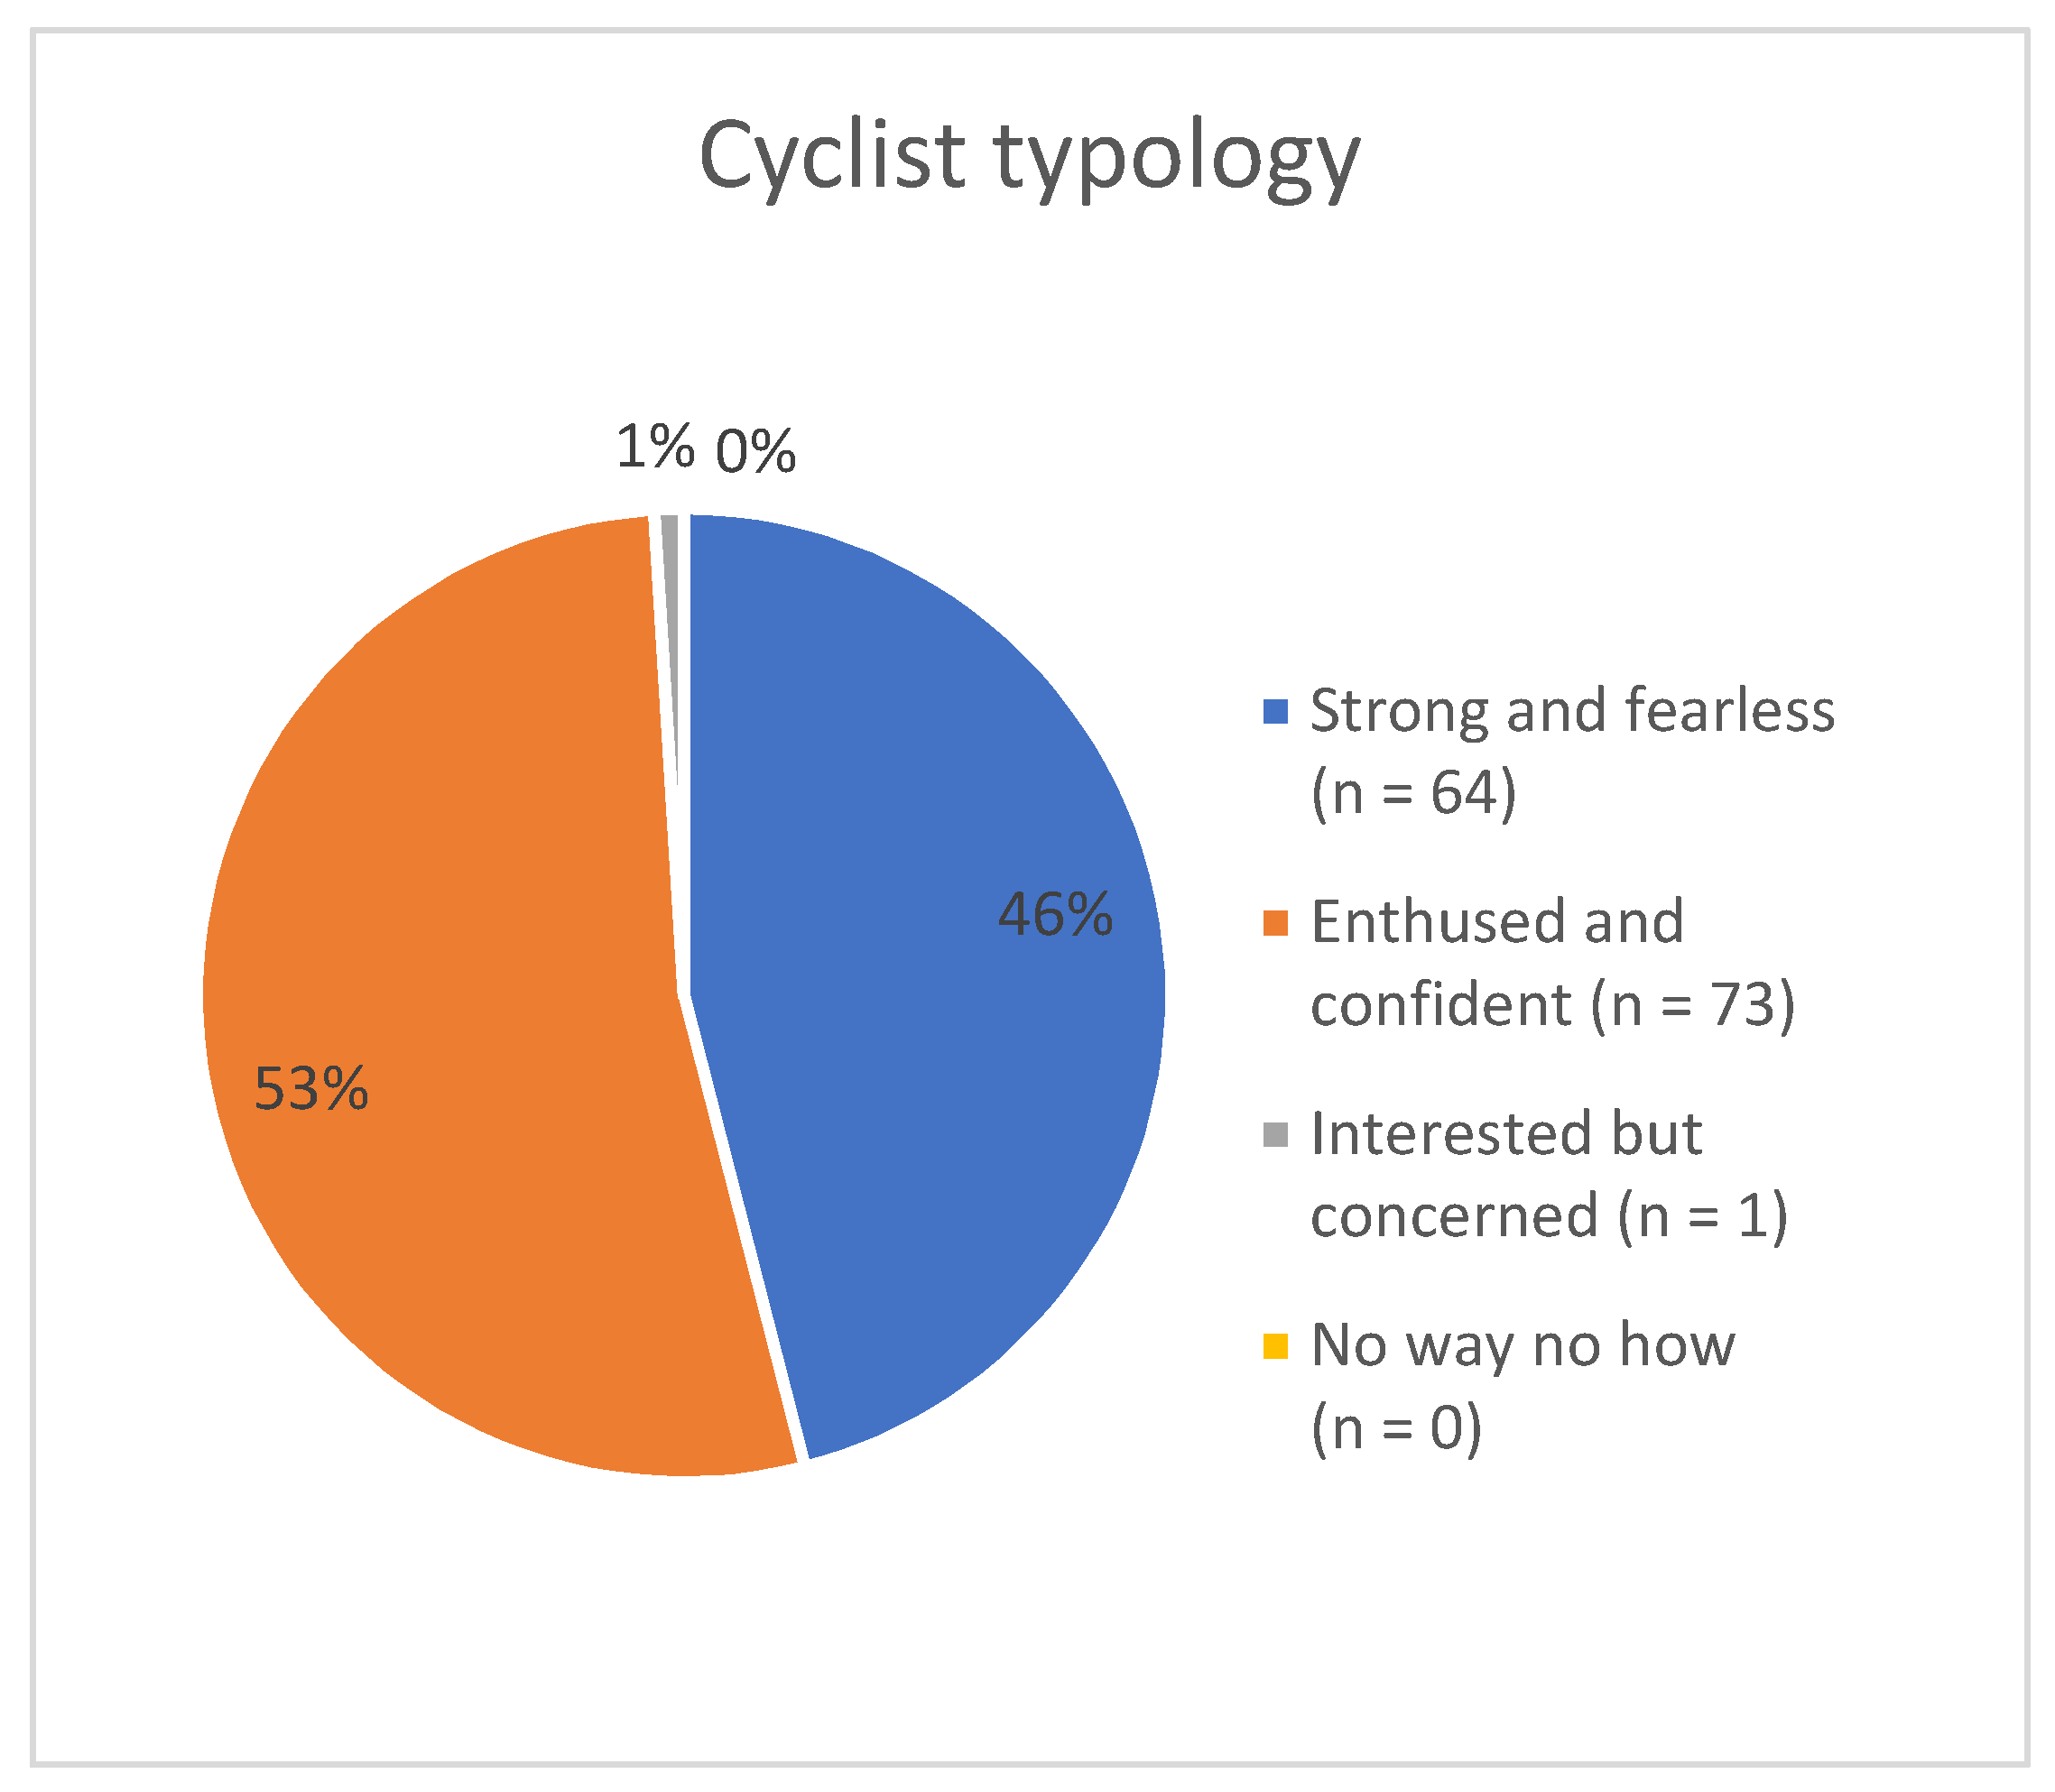
strong and fearless (n = 64) 46%
enthused and confident (n = 73) 53%
interested but concerned (n = 1) 1%
no way no how (n = 0)
When broken out by gender (Figure 2), 30% of our CDM female respondents selected strong and fearless while 67% chose enthused and confident. Only one female respondent selected interested but concerned. In total, 54% of male respondents selected strong and fearless and 46% were enthused and confident. No males selected interested but concerned.
Our results differ from the Dill and McNeil [16] findings due to surveying a different population. According to Dill and McNeil, their 2012 study population breakdown of self-reported cycling comfort levels for the general sample in Portland, Oregon was: strong and fearless (4%), enthused and confident (9%), interested but concerned (56%), and no way no how (31%). As mentioned previously, we chose this typology for its ease of understanding in an international survey. Our respondents’ typology results in Figure 2 illustrated the bicycling expertise and relative comfort of this survey’s respondents.

CDM Case Studies

After introductory questions in the survey, the hypothetical scenario was presented (see Section 2.1). The respondents (n = 138) were then questioned about the scenario’s realism to further validate the hypothetical incident and introduce the series of Sweeps to them. In total, 90% (n = 124) of respondents answered that the hypothetical incident was realistic in their opinion, 3% said it was not, and 7% were not sure. In total, 90% also responded that it was similar to incident(s) they have experienced themselves. In total, 93% of UK respondents, 88% of US respondents, and 93% of Other respondents found the scenario realistic. When broken out by gender, 93% of female respondents and 88% of male respondents indicated that the incident was realistic. This was an overwhelmingly positive acknowledgment of the realism of the presented scenario.
In Table 1, each question’s cell summarizes the key themes by gender that participants gave in response to the questions regarding the hypothetical incident. As discussed in Section 2.3, the authors independently identified the broad themes for each question and then discussed and consolidated them after, selecting the key answer themes. In most instances, the responses showed little difference between the two genders. The main differences between males and females have been highlighted in bold.
We can see the general similarity of responses in each question. All of Table 1’s responses were largely similar; in no question were the female and male responses completely different. For instance, in Question 6 (Close pass predictable?), the broad themes in response to this question were all similar falling under the broad themes of:
  • Say they can anticipate from the sound of the vehicle or previous experiences.
  • Experience probably plays a role in this.
  • Others say they cannot anticipate
In contrast, Question 4 (Close pass or not) showed some similar response themes for both genders:
  • The speed and size of the vehicle plays a large role
  • If it’s close enough to touch, it’s too close
  • If it’s so close that the wind makes them wobble
It should, however, be noted that the male respondents had two other thematic responses not mentioned by the female respondents:
  • Road conditions such as potholes and speed of other vehicles matter
  • Prior behavior of the driver influences this as well
Although the core responses of all questions were essentially the same, when there were differences between the genders, they generally consisted of answers in addition to the common themes already expressed. For instance, in Question 1 (Emotions experienced), there were some male responses that expressed more frustration with societal issues such as poor infrastructure or inadequate law enforcement. When more than one respondent expressed a theme such as this, it was included in the summary. We need to emphasize that these were short answers where participants could answer whatever they wanted; we did not give a list of specific answers for them to select from.
To further analyze and explore the data, Table 2 compares one male and one female from the self-reported strong and fearless (n = 64) category. We chose to further analyze these by gender as it is most commonly cited that females are less likely to cycle than males for a variety of reasons (such as gender differences in cycling uptake and increased mode share). By looking into differences between experienced and confident cyclists of both genders, we aim to develop a better understanding of which differences may influence why some females and males continue to cycle.
To get a more detailed understanding of the respondents and their individual answers, we now look at them individually by Sweep.
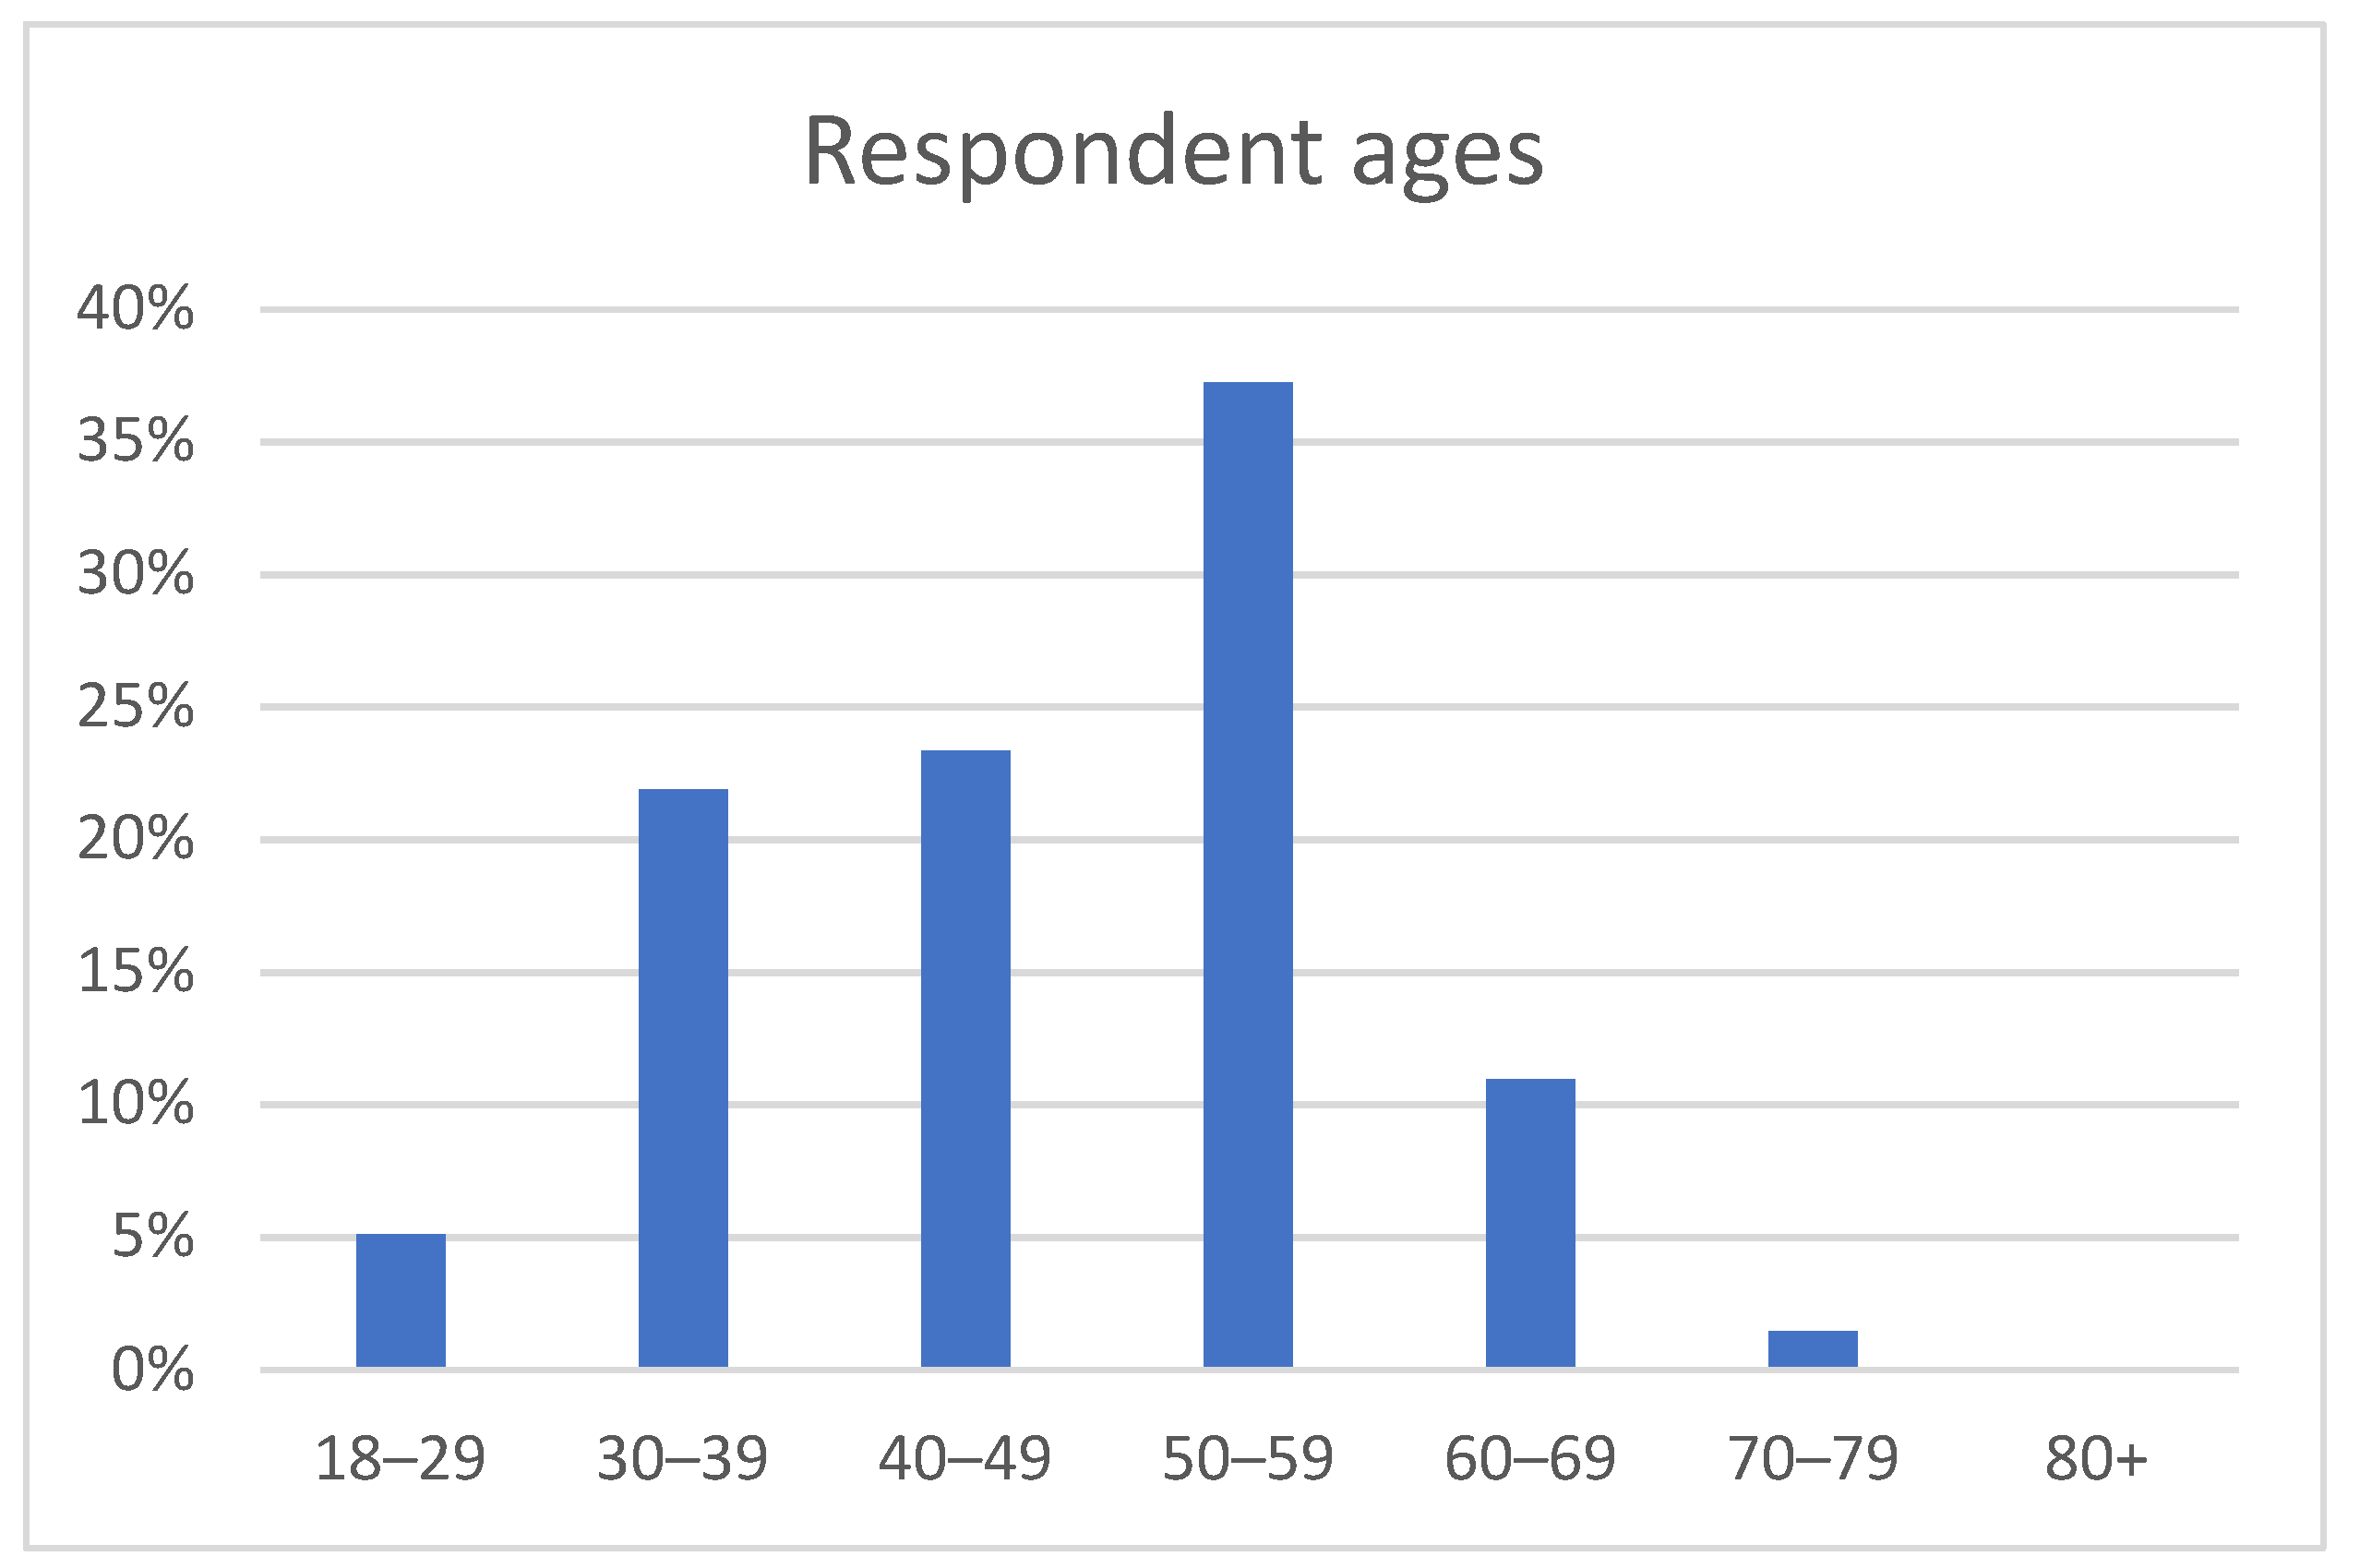
  • Pre-Sweeps: Respondent demographics
The Female respondent was born in 1963 in the United Kingdom. The Male respondent was born in 1978 in the United States. Both classified themselves as strong and fearless cyclists.
  • Sweep 1: Incident Identification and Selection
The respondents read the critical incident in the online survey and then, following the CDM format, were asked a series of questions to dig deeper into their experiences and understanding of the hypothetical incident as well as similar ones. First was validating that the incident was realistic and thus applicable. Even though the respondents were of two different genders as well as from two different countries, both felt the presented incident was realistic and similar to events they had personally experienced.
  • Sweep 2 and 3: Deepening Understanding
The respondents then were asked a series of questions about the emotions and physical sensations they would expect to feel, how they would mentally and emotionally respond, and how they would physically react in the face of such an incident while cycling.
Both respondents expressed the scariness of such a close and threatening pass. They described similar emotions including anger and fear as well as noting that their bodies experienced fear reactions such as surging adrenaline and pounding hearts. One respondent said she would feel “…palpitations, adrenaline rush, but not in a good way” (Question 3). The close pass of the large vehicle can be physically felt in the “blast of air as it passes” (Question 4), and that the riders can tell that a vehicle passes closely and at speed. In some cases, this type of incident can also be anticipated. Cyclists can put together all of the elements and combine these with their experience to be able to say, sometimes, that they know when something like this will happen. For instance, they can hear the revving of the vehicle engine and thus get an idea of how close it is. They may also have equipment that will facilitate this, one saying, “Yes, sound of engine behind indicates if they are accelerating, I have a rear view mirror so checking that I can anticipate. Also what’s ahead, e.g., a chicane or lights, with some drivers you know they want to get through before you as they don’t want to give way to anything” (Question 6).
Respondents somewhat differed when asked about reporting threatening behaviors like this to the police. The male from the US stated, “No; police here would not care” (Question 8) while the UK respondent noted that she might report the incident but only if she had clear video and legible images of the license plates. When asked how they cope after such an incident, both noted that they might take some time to recover, to calm down. The male respondent said, “If shaken up, pull over to calm down” (Question 9). Experiences such as these have changed how our respondents bicycle. When asked about their current mindset and how it has changed and/or gear added while cycling now (Question 11), the female respondent said she had added front and rear cameras to her bicycle while the male respondent had added a rear-view mirror.
  • Sweep 4: What if
The respondents speculated that novices might respond differently than these experienced cyclists under the presented incident. They both expected that fear and/or lack of experience might influence the novice rider to be less stable on the bicycle, perhaps by swerving or hitting the kerb/curb. It was noted, however, that as with experienced riders, reactions can vary: “It depends what’s going on in your head at the time, how you are feeling and how you react emotionally-e.g., if you get so angry that you think-‘I’ll show him’ or whether you just let it go” (Question 12).
When asked about varying conditions, such as weather or lighting, and how they might influence the respondents’ reactions, one response was consistent for both respondents in all presented conditions: take the lane. For instance, when referring to a lack of bicycle lane under the same threatening incident, the female respondent said, “I would take the lane but probably just line up behind him at the lights, or where the traffic is queued. Try to engage by making eye contact, a wave, so I know the driver can see me” (Question 15).

4. Discussion

We undertook this research to further understand how experienced bicycle riders react, emotionally, mentally, and even physically, to stressful interactions with motor vehicles. Our pool of disparate respondents from multiple countries turned out to be surprisingly similar. Table 1 has the broad response themes for all participants broken out by gender. Table 2 presents two strong and fearless participant responses—one female and one male.
The online survey successfully modified the CDM method. Sweeps were set up as structured probes to re-construct and expand aspects of a hypothetical road incident. Sweep 1, Incident Identification and Selection, discussed above, presented the incident to the participants. Participants overwhelmingly gave positive acknowledgment of the realism of the presented scenario which validated the usefulness of the hypothetical incident under the CDM process.
Sweeps 2 and 3: Deepening Understanding, asked respondents more probing questions about their sensemaking of the situation. We could see in Questions 1, 2, and 3 (Table 1) that all responses included anger and fear in varying forms. We also see that the experience of the close pass (Questions 3 and 4) was not just emotionally experienced but physically experienced with some responses noting the feelings of adrenaline, the gusts of wind, or even the growling of a revving engine. As Huemer et al. (2018) [19] found, “interaction with cars also led to the highest cycling anger intensity ratings” (p. 976). It is therefore unsurprising that a perceived threat by a motor vehicle would result in anger expressed by our respondents.
The final question of this Sweep (Question 11) asked about how the respondents have changed their cycling behavior in the face of incidents such as these. Our respondents were aware of the threats on the road and many mentioned a more defensive, vigilant mindset. Another common theme was the addition of gear to either improve visibility such as by lights or bright clothing but also cameras to record any threatening behavior to possibly be able to report to law enforcement.
Sweep 4: What if, asked the participants hypotheticals to gain a deeper understanding of the experience, skills, and knowledge of the participants. First, participants imagined novice cyclists faced with the same hypothetical incident. The overarching concerns for Questions 12 and 13 were that a novice bike rider would be too scared to continue cycling and/or may lose control of the bicycle and crash. When asked to recollect their own feelings and emotions back when they were novices (Question 14), it became clear how many years our participants had been cycling. Many answered they could not recall that far back, and others said that drivers were more polite ‘back then’.
The final questions 15, 16, and 17 asked how the participants would react to the hypothetical incident if the road conditions were different (no bike lane, rainy, dark). Despite the different conditions, the broad responses were generally the same. Respondents would either ‘take the lane’, not ride on the road or under those conditions, or add equipment to enhance their visibility. Various changed conditions did increase the level of fear for some participants as well.
Table 2 then highlighted two cyclists of the strong and fearless category. Similar to Dill and McNeil [16] who found in their review of Geller’s Typology [15], that female cyclists are more likely to classify themselves as enthused and confident than strong and fearless, our female participant pool was more likely to call themselves enthused and confident (67%) than strong and fearless (30%) compared to males. We selected cyclists in this category to try to match the two genders up as much as possible.
As Table 1 and Table 2 showed, the broad themes matched up between both genders. When there were differences in thematic responses between the participants, it was only in addition to the expressed themes already in common.
It is unclear whether cyclists develop these similar perspectives through their experiences of road cycling over time or whether only those who continue to bicycle on the road (despite stressful experiences) already have different personalities or coping mechanisms which enable them to endure these stressful situations. Exploring the development of these similarities would be an area for future research.
This research adds to the growing understanding of how stressful incidents while cycling may contribute to the low bicycling mode share despite the recognition that cycling is an important beneficial element in health, roadway congestion, pollution, and climate change. The consistency in responses illustrated that the reactions that competent bicycle riders experienced are similar across age, gender, typology, and country. This was despite the relatively different cycling conditions and cycling culture in the various countries.
It must be stated, however, that no respondents from countries with large bike mode percentages, such as the Netherlands or Denmark, responded to the survey. Instead, the majority of survey respondents were either from the US or UK. The cycling culture of these two countries is more similar to each other than to a more bicycle-friendly countries/cultures.
Social media extended the reach of the survey invitation and potential respondents very effectively self-selected themselves. We did not have an issue with unqualified/less experienced respondents taking the survey; instead, we managed to draw a much larger group of experienced cyclists than we expected.
Overall, this article shows two things. First, that the CDM method can be adapted to online use and thus reach a larger sample than the traditional in-person interview technique. The modification of the CDM method into an online survey was effective and produced qualitative data that can be used to draw a better understanding of hypothetical incidents. Second, the results indicate that experienced cyclists are more similar in their essentials than anticipated. When divided up by gender, the broad themes generated by the survey responses showed similar emotional and physical reactions in the face of threatening incidents. This research fills a gap looking at these responses and leaves room for substantial future research to better understand coping in the face of threatening behavior.

Author Contributions

Conceptualization, A.D., T.H.; methodology, A.D., T.H.; software, A.D.; validation, A.D., T.H.; formal analysis, A.D., T.H.; investigation, A.D.; resources, A.D., T.H.; data curation, A.D.; writing—original draft preparation, A.D., T.H.; writing—review and editing, A.D., T.H.; visualization, A.D.; supervision, A.D., T.H.; project administration, A.D., T.H. All authors have read and agreed to the published version of the manuscript.

Funding

This research received no external funding.

Institutional Review Board Statement

The study was conducted according to the guidelines of the Declaration of Helsinki, and approved by the Ethics Committee of Coventry University (number P109729, in 2020).

Informed Consent Statement

Informed consent was obtained from all subjects involved in the study.

Conflicts of Interest

The authors declare no conflict of interest.

References

  1. Dill, J. Bicycling for Transportation and Health: The Role of Infrastructure. J. Public Health Policy 2009, 30, S95–S110. [Google Scholar] [CrossRef] [PubMed]
  2. Foley, L.; Panter, J.; Heinen, E.; Prins, R.; Ogilvie, D. Changes in active commuting and changes in physical activity in adults: A cohort study. Int. J. Behav. Nutr. Phys. Act. 2015, 161–173. [Google Scholar] [CrossRef] [PubMed] [Green Version]
  3. Humphreys, D.K.; Goodman, A.; Ogilvie, D. Associations between active commuting and physical and mental wellbeing. Prev. Med. 2013, 57, 135–139. [Google Scholar] [CrossRef] [PubMed] [Green Version]
  4. Willis, D.P.; Manaugh, K.; El-Geneidy, A. Uniquely satisfied: Exploring cyclist satisfaction. Transp. Res. Part F Traffic Psychol. Behav. 2013, 18, 136–147. [Google Scholar] [CrossRef]
  5. Chen, P.; Shen, Q. Built environment factors in explaining the automobile-involved bicycle crash frequencies: A spatial statistic approach. Accid. Anal. Prev. 2015, 86, 239–246. [Google Scholar] [CrossRef]
  6. Chaurand, N.; Delhomme, P. Cyclists and drivers in road interactions: A comparison of perceived crash risk. Accid. Anal. Prev. 2013, 15, 1176–1184. [Google Scholar] [CrossRef]
  7. Marshall, W.; Piatkowski, D.; Johnson, A. Scofflaw bicycling: Illegal but rational. J. Transp. Land Use 2018, 11, 1–31. [Google Scholar] [CrossRef] [Green Version]
  8. Aldred, R. Cycling near misses: Their frequency, impact, and prevention. Transp. Res. Part A Policy Pr. 2016, 90, 69–83. [Google Scholar] [CrossRef]
  9. Aldred, R.; Goodman, A. Predictors of the frequency and subjective experience of cycling near misses: Findings from the first two years of the UK Near Miss Project. Accid. Anal. Prev. 2018, 110, 161–170. [Google Scholar] [CrossRef] [Green Version]
  10. Cycling UK. Cycling UK’s Cycling Statistics. Available online: Cyclinguk.org (accessed on 23 November 2021).
  11. National Safety Council. NSC Injury Facts: Bicycle Deaths. Available online: https://injuryfacts.nsc.org/home-and-community/safety-topics/bicycle-deaths/ (accessed on 1 November 2021).
  12. Walker, I.; Robinson, D. Bicycle helmet wearing is associated with closer overtaking by drivers: A response to Olivier and Walter 2013. Accid. Anal. Prev. 2019, 123, 107–113. [Google Scholar] [CrossRef]
  13. Ampe, T.; de Geus, B.; Walker, I.; Serrien, B.; Truyen, B.; Durlet, H.; Meeusen, R. The impact of a child bike seat and trailer on the objective overtaking behaviour of motorized vehicles passing cyclists. Transp. Res. Part F Traffic Psychol. Behav. 2020, 75, 55–65. [Google Scholar] [CrossRef]
  14. Miller, P.D.; Kendrick, D.; Coupland, C.; Coffey, F. Use of conspicuity aids by cyclists and risk of crashes involving other road users: Population based case-control study. J. Transp. Health 2017, 7, 64–74. [Google Scholar] [CrossRef]
  15. Geller, R. Four Types of Cyclists; Portland Bureau of Transportation: Portland, OR, USA, 2006. Available online: http://www.portlandoregon.gov/transportation/article/264746 (accessed on 6 December 2021).
  16. Dill, J.; McNeil, N. Four types of cyclists? Examination of typology for better understanding of bicycle behavior and potential. Trans. Res. Rec. 2013, 2387, 129–138. [Google Scholar] [CrossRef] [Green Version]
  17. Chaloux, N.; El-Geneidy, A. Rules of the Road: Compliance and Defiance among the Different Types of Cyclists. Trans. Res. Rec. 2019, 2673, 34–43. [Google Scholar] [CrossRef]
  18. Nabavi Niaki, M.S.; Saunier, N.; Miranda-Moreno, L.F. Is that move safe? Case study of cyclist movements at intersections with cycling discontinuities. Accid. Anal. Prev. 2019, 131, 239–247. [Google Scholar] [CrossRef] [PubMed]
  19. Huemer, A.K.; Oehl, M.; Brandenburg, S. Influences on anger in German urban cyclists. Transp. Res. Part F Traffic Psychol. Behav. 2018, 58, 969–979. [Google Scholar] [CrossRef]
  20. Møller, M.; Haustein, S. Anger expression among Danish cyclists and drivers: A comparison based on mode specific anger expression inventories. Accid. Anal. Prev. 2017, 108, 354–360. [Google Scholar] [CrossRef]
  21. Horberry, T.; Cooke, T. Using the Critical Decision Method for Incident Analysis in Mining. J. Health Saf. Res. Pract. 2010, 2, 8–20. [Google Scholar]
  22. Crandall, B.; Klein, G.A.; Hoffman, R.R. Working Minds: A Practitioner’s Guide to Cognitive Task Analysis; MIT Press: Cambridge, MA, USA, 2006. [Google Scholar]
  23. Klein, G. Naturalistic decision making. Hum. Factors 2008, 50, 456–460. [Google Scholar] [CrossRef] [Green Version]
  24. Salmon, P.; Dallat, C.; Clacy, A. It’s not all about the bike: Distributed situation awareness and teamwork in elite women’s cycling teams. Contemp. Ergon. Hum. Factor 2017, 2017, 240–248. [Google Scholar]
  25. Association of Pedestrian and Bicycle Professionals. Women’s Cycling Survey 2016. Available online: http://womencyclingsurvey.com/wp-content/uploads/2018/03/APBP_WomenCyclingSurvey_2016.pdf (accessed on 1 December 2021).
  26. MacMichael, S. Lockdown Sees Cycling Gender Gap Narrow, Government Statistics Reveal. 2021. Available online: https://road.cc/content/news/lockdown-sees-cycling-gender-gap-narrow-statistics-reveal-286555 (accessed on 7 December 2021).
  27. Marling, G.; Horberry, T.; Harris, J. Development and validation of plain English interpretations of the seven elements of the risk management process. Safety 2020, 5, 75. [Google Scholar] [CrossRef] [Green Version]
Figure 1. Respondent age ranges.
Safety 08 00008 g001
Figure 2. Cyclist typologies.
Safety 08 00008 g002
Table 1. Key themes for all respondents by gender.
Sweeps 2 and 3 QuestionsFemale Respondents (n = 43)Male Respondents (n = 95)
1Emotions experiencedThree main emotions—anger, fear, frustration.
Respondents’ anger expressed in multiple forms
Key mentions were adrenaline, driver entitlement.
Very little acceptance
Three main emotions—anger, fear, frustration.
Respondents’ anger expressed in multiple forms
Key mentions were adrenaline, driver entitlement.
Physical responses/sensations
Frustration with societal issues—poor infrastructure, apathetic police
2Sounds expectedThey hear the engine, feel the speed
The revving engine sounds like anger, impatience, intolerance
They hear themselves shouting
They hear the engine, the noise of wind and tires
They hear the anger of the driver, shouting from both parties
3Physical sensationsThey feel their heart race, they may feel shaky, maybe palpitations
They feel the adrenaline, the fear rush through the body
Terror
Feel sick and anxious, feel nauseous
They feel stress, anger, tension
They feel adrenaline, some sick to their stomach
Their heart rate increases
They feel the wind from the close pass
4Close pass or notThe speed and size of the vehicle plays a large role
If it’s close enough to touch, it’s too close
If it’s so close that the wind makes them wobble
If it’s close enough to touch, it’s too close
The speed and size of the passing vehicle
How close it sounds and appears in peripheral vision
Road conditions such as potholes and speed of other vehicles matter
Prior behavior of the driver influences this as well
5Emotions if close passQuite a few shout/scream, gesture
Try to stay upright and not wobble, hold the line
Anger/rage and fear are common reactions
Lots of shouting and gesturing
Anger and fear are common responses
Trying to stay upright
Considering whether to chase the driver or not, maybe slap the car or yell at driver
recognition that escalation does not ever help
6Close pass predictable?Say they can anticipate from the sound of the vehicle or previous experiences
Experience probably plays a role in this.
Others say they cannot anticipate
Say they can anticipate from the sound of the vehicle or previous experiences
Experience probably plays a role in this.
Others say they cannot anticipate
7Decision points (DP)Mention driver behavior was a red flag and they should’ve stayed back, slowed down
Different infrastructure would have helped
DP was only in hands of driver not cyclist
Altering route or staying back, away from already angry driver
DP was only in hands of driver not cyclist
Saw no possible DPs to change the outcome (except for Driver)
8Report to the police?Somewhat split but most respondents would not report to the police.
Police reporting only happens with supporting data such as video
Police reporting also only happens if police are seen to actually care
Somewhat split but most respondents would not report to the police.
Police reporting only happens with supporting data such as video
Police reporting also only happens if police are seen to actually care
9Reactions after the incident?Would try to collect themselves and then keep riding
If they had a camera, they might report to the police or truck’s company
Just accept and keep riding, some mention it’s important to get over it
Maybe change route to less stressful one for a while
Would try to collect themselves and then keep riding
If they had a camera, they might report to the police or truck’s company
Just accept and keep riding, some mention it’s important to get over it
Maybe change route to less stressful one for a while
10Features that would change feelingsDriver attitude/earlier behavior is important here
Better infra would have helped
For some respondents, nothing would have changed their feelings
The driver apologizing
Driver attitude/earlier behavior is important here
Better infra would have helped
For some respondents, nothing would have changed their feelings
The driver apologizing
11Changed gear and/or mindsets? Avoidance and/or changing of routes
Additional gear mainly camera and lights
A mindset of vigilance/defensive, managing anxiety
Taking the lane
Avoidance and/or changing of routes
Additional gear mainly camera and lights
A mindset of vigilance/defensive, managing anxiety
Trying to advocate for better conditions
Sweep 4 questions
12Would novice cyclists respond similarly?Feeling that novice riders would not respond similarly.
The common concern is that this experience would put a novice off riding
A novice might fall/crash
Were unsure how a novice would react
Feeling that novice riders would not respond similarly.
The common concern is that this experience would put a novice off riding
A novice might fall/crash
Were unsure how a novice would react
13What errors would novice cyclists commit?Concern that novices would wobble, lose balance, fall off
Or that they would clip the kerb/curb or swerve and fall under the vehicle
Concern about overcorrecting and losing balance
Concern that novices would wobble, lose balance, fall off
Or that they would clip the kerb/curb or swerve and fall under the vehicle
Being too submissive, riding too far to the side
14Feelings as a novice?Similar emotions as in earlier questions—fear and anger
They can’t remember that far back
Said drivers more polite ‘back then’
Similar emotions as in earlier questions—fear and anger
They can’t remember that far back
Said drivers more polite ‘back then’
Would stop riding for a while, take a break, change routes or switch to mtb from road
A few noted they were less sensitive and/or more combative then than now
15Different infrastructure?Would take the lane to be more visible
Others would never have ridden on this road at that speed limit
Would ride the same as they ride when there’s a bike lane noting paint doesn’t offer protection anyway
Would take the lane to be more visible
Would never have ridden on this road at that speed limit
They would ride it but would be more defensive
16Rainy weather?Scared in rain due to reduced viz and slippery lines, less control
Would ride exactly the same, no difference
Would add lights and hi viz (others already have on as always)
Aim for greater visibility
Might not ride in rain
Would not ride in the rain
Scared in rain due to reduced viz and slippery lines, less control
Would ride exactly the same, no difference
Would add lights and hi viz (others already have on as always)
Aim for greater visibility
Would hope for more care by drivers and prob get angry when not getting it
17Dark?Would not ride on this road in the dark
They would have lights and reflective gear
Would not change how they ride (and felt) but mention already have nighttime gear
They are more scared riding at night, feelings more intense
Some roads avoided in dark
They would have lights and reflective gear
Would not change how they ride (and felt) but mention already have nighttime gear
They are more scared riding at night, feelings more intense
They would be angrier if close pass happened at night
Bolded text indicates thematic differences between female and male responses.
Table 2. Detailed analysis of two cyclists’ responses.
Sweeps 2 and 3 QuestionsFemale RespondentMale Respondent
1Emotions experiencedAnxiety, fear, frustration, anger, impatienceAnger and fear.
2Sounds expectedBlood rushing through my head.The whoosh of the truck and thumping heartbeat echoing in my head.
3Physical sensationsPalpitations, adrenaline rush, but not in a good way.Rapid heartbeat.
4Close pass or notThe speed of the vehicle, it’s size and length, if I feel a wobble, blast of air as it passes, if I get a spray of road muck as it passes.Speed and distance.
5Emotions if close passAngry and fear at the same time. Enraged that the driver has so little empathy for more vulnerable road users.Angry. Usually raise a fist or otherwise wave in frustration.
6Close pass predictable?Yes, sound of engine behind indicates if they are accelerating, I have a rear view mirror so checking that I can anticipate. Also what’s ahead, e.g., a chicane or lights, with some drivers you know they want to get through before you as they don’t want to give way to anything.Sometimes; based on frequency of overpassing same driver or road conditions.
7Decision points Yes, I feel there is little point in racing with these types of road user, so I often just hang back and let them get on their way. Especially at lights, where they want to get through before you.Driver could have been more respectful.
8Report to the police?Yes, I would do if I have evidence of poor driving, number plate, etc. I now have front and rear cameras fitted. If I don’t have the information that identifies a road user, I do feel the police would not be interested.No; police here would not care.
9Reactions after the incident?Take time out. Stop and gather myself together. If possible note timing of incident, positioning on road, location, make of vehicle, company logo, and reg. Review footage on camera. If the evidence is good I would submit to police.If shaken up, pull over to calm down.
10Features that would change feelingsAfter the episode when the driver shouted get off the road, I would have ignored him but not have passed him to get to the intersection before him. I would have stayed back. I view the first aggression, as an indicator that more will follow.n/a
11Changed gear and/or mindsets?I now have front and rear cameras fitted to my bike. I also try to contain my emotions and ride defensively, signal clearly, wave and try to be friendly. Also I plan my routes carefully to avoid busy intersections at busy times of day.I usually ride with a mirror so I can see behind me and check for approaching traffic.
Sweep 4 questions
12Would novice cyclists respond similarly?Some might, some might not. It depends what’s going on in your head at the time, how you are feeling and how you react emotionally-e.g., if you get so angry that you think-“I’ll show him” or whether you just let it go.No.
13What errors would novice cyclists commit?Reacting/Shouting back, riding too close to the kerb so that the driver is tempted to do a close pass.Swerving
14Feelings as a novice?Frightened, angry, fearful of riding on that route again.Afraid to ride
15Different infrastructure?I would take the lane but probably just line up behind him at the lights, or where the traffic is queued. Try to engage by making eye contact, a wave, so I know the driver can see me.I would’ve been more centrally located in lane so close overpassing would not be possible.
16Rainy weather?Again I would slow down and fall in behind. Aware that visibility may be an issue for other road users, but also, white lines etc. can be slippery in the wet for me as a cyclist. I would also have front and rear lights on in poor visibility conditions.Same—take the lane.
17Dark?I tend not to cycle in the dark, but if I do, then high vis reflective and lights (flashers) are a must for me.Take the lane.
Publisher’s Note: MDPI stays neutral with regard to jurisdictional claims in published maps and institutional affiliations.

