Article

Roadside Fixed-Object Collisions, Barrier Performance, and Fatal Injuries in Single-Vehicle, Run-Off-Road Crashes

by
Francisco Daniel Benicio de Albuquerque
1,* and
Dina Mohammad Awadalla
2
1
Civil & Environmental Engineering Department, Faculty of Transportation Engineering, United Arab Emirates University, Al Ain PO Box 15551, UAE
2
Graduate Research Assistant, Civil & Environmental Engineering Department, United Arab Emirates University, Al Ain PO Box 15551, UAE
*
Author to whom correspondence should be addressed.
Safety 2020, 6(2), 27; https://doi.org/10.3390/safety6020027
Submission received: 8 April 2020 / Revised: 12 May 2020 / Accepted: 14 May 2020 / Published: 20 May 2020

Abstract

:
Objectives: To quantify the odds of fatal injuries associated with drivers involved in single-vehicle, run-off-road (SVROR), injury crashes. Methods: An in-service safety evaluation was carried out using multivariate logistic regression models. Results: The odds of motorist death was lower for w-beam guardrail crashes as compared to tree, pole, and concrete barrier crashes. On the other hand, there was no statistically significant difference between the odds of motorist death in concrete barrier crashes as compared to tree or pole crashes. The odds of motorist death were lower for curbs and collision-free crashes as compared to tree, pole, and barrier crashes. Thus, obstacles should be removed whenever possible and barriers installed only whenever absolutely necessary. The lack of vehicle containment (in barrier crashes) was found: (i) to tend to occur on higher-posted-speed-limit roads and result in a higher percentage of fatal crashes, (ii) to be more prevalent with the less rigid barrier type, and (iii) to result in a consistently higher percentage of fatal crashes under the concrete barrier category. Conclusions: Findings not only support state-of-the-art roadside design guidelines and crash-testing criteria, but they may also be useful in evaluating proposed roadside safety improvements.

1. Introduction

1.1. Background

Single-vehicle, run-off-road (SVROR) crashes have been found to account for a significant number of all road crash fatalities worldwide [1,2,3,4,5,6]. A SVROR event may or may not involve a collision. That is, an errant vehicle may either hit a fixed roadside object (e.g., tree, utility pole, traffic sign, embankment, ditch, culvert, or barrier) and/or rollover, or come to a safe stop. SVROR, fixed-object crashes account for a large portion of all SVROR-injury crashes [1,2,3,4,5,6]. Fixed objects such as poles, trees, and barriers have been found to be the most harmful object struck by errant vehicles [1,7].
State-of-the-art roadside design guidelines recommend the use of five design priorities to treat roadside areas. The fourth design priority (in order of preference) consists of shielding the obstacle (e.g., install a barrier) [1]. However, literature has long contained text suggesting that barriers, such as guardrails, are roadside hazards [8,9,10,11,12]. Furthermore, the literature also contains a number of studies that have assessed the negative impact of a number of fixed object hazards (including barriers) on road crash severity [13,14,15,16,17,18].
Lee et al. (2002) investigated the impact of roadside features on the severity of run-off-roadway crashes, using a nested logit model [13]. Severity was defined as the level of injury sustained by the most severely injured vehicle occupant. Therefore, seating position was not controlled for, even though it has been found to be a crash severity contributing factor in previous studies [19,20]. Lee found that guardrails tended to increase the chance of a crash being severe (i.e., resulting in a disabling and/or fatal injury). However, this study was based on accident data that is now outdated (i.e., from January 1994 to December 1996). Many factors have changed since the mid-1990s, such as vehicle technology and roadside design. In addition, the authors acknowledge that this study was based on a limited study area: a 96.6-km section of highway in Washington State, in the United States (US). This may make the study representative of only one highway class (state route), located in a specific state, in a particular country. Lastly, this study does not provide straightforward discussions on the pairwise comparison of injury risk among different sets of barrier types and other fixed objects.
Later on, Holdridge et al. (2005) expanded Lee’s study to include the entire urban State Route system in Washington State [14]. The use of a nested logit model, which focused on driver injury severity, revealed that trees and poles were associated with an increased probability of fatal injury, guardrail faces with a decreased probability of evident injury, and concrete barriers with an increased probability of lower-severity injuries. However, since this was an expansion of the previously conducted study, the same issue related to outdated data still holds true. Even though Holdridge’s research expanded the study area to cover the entire state route system in Washington, it still focused on urban roads only and provided limited highway class coverage. The study also combined multiple object types into single categories. For example, light/railway/utility/traffic/overhead pole, and sign box were all combined into the pole category, even though it could be argued that some of these objects have varying dimensions, possibly resulting in significantly different injury risk levels. Another example of this same problem was noted with the category described as “tree or stump”. One should note that not only are trees a very broad category (i.e., in terms of dimensions and rigidity), but the physical configurations of stumps and trees may also differ significantly.
More recently, Zou et al. (2014) used a binary logistic regression model to investigate the vehicle-occupant-injury-risk reduction effectiveness of different barrier types in Indiana, in the US [15]. More recent data (i.e., 2008 to 2012) were used, which may curb the problems associated with outdated data described previously. Zou’s study shows that hitting a barrier is associated with lower risk of injury than a high-hazard event. A high-hazard event was defined as hitting objects such as poles, trees, bridge piers, sign posts, light/luminaire supports, walls/buildings, and embankments. The odds of injury were lower when striking a guardrail as compared to a concrete barrier (independent of the lateral offset distance), and lower when striking a cable barrier as compared to a guardrail (also independent of the lateral offset distance). A valuable addition in this study was the fact that barrier lateral offset distance was controlled for. However, just as in Lee’s study, this study focused on vehicle occupant, not driver injury. Additionally, some very different obstacles (e.g., trees and poles) were grouped under the same category. This study also defines events such as rollovers to be in the same category as some obstacles, instead of controlling for a rollover event by setting rollover outcome as an independent predictor variable. Finally, it classifies injury into two levels: injury and no injury. The problem with this injury-level classification is that the “injury” category includes levels with extremely varying severities (e.g., minor and fatal) and associated crash costs, limiting the usefulness of the study’s output in terms of enabling injury-risk reduction to actually be attributable to differences in barrier safety performance. That is, for example, a minor injury may occur independently from the barrier type. It may occur simply due to one bouncing around inside the vehicle and hitting vehicle occupant compartments as the vehicle moves along during a sequence of crash events. In fact, in the closure section, the authors suggest, “Future research should consider using more precise measurements of injuries”. Finally, Zou’s study neither provides a good representation of different highway classifications, nor does it include data from urban areas, as most of the crashes analyzed occurred on interstate roads or high-speed rural roads.
In a similar study, Russo and Savolainen (2018) used an ordered logit model to compare crash severity and barrier strike outcome by barrier type on freeways in the state of Michigan, in the US [16]. Three barrier types were considered: high-tension cables, thrie-beam guardrails, and concrete barriers. Fatal and severe injuries were combined due to their limited number, resulting in crash severity being classified into four levels (i.e., no-injury, minor, moderate, and severe crashes). Concrete barrier crashes were found to be more severe than crashes involving the other barrier types, as well as more prone to result in vehicle redirection onto the roadway. Crashes involving rollovers were more likely to result in severe injuries. However, this study focused on median freeways only.
Molan et al. (2019) collected data on the geometrical features of barriers in the state of Wyoming, in the US, and matched them to barrier crash locations [17]. They found that the potential for vehicle override of shorter barriers was referenced as the possible cause for the lower safety levels of shorter barriers. They also found that rollovers and unbelted drivers negatively affected the severity in crashes involving traffic barriers. In 2020, these same authors pointed out that there was a lack of non-median, in-service-based, traffic barrier crash studies. As a result, they examined the relationship between traffic barrier crash severity and vehicle type [18]. Traffic barrier crashes were found to account for 38 percent of all fatal crashes in Wyoming. Vehicle type was found to have a significant impact on crash severity, as traffic barriers are more flexible; however, vehicle type would be an ineffective crash severity variable for crashes involving rigid barriers.
Thus, there are a number of studies that have assessed the impact of roadside fixed objects on SVROR crash severity. However, while these studies may have added knowledge to the safety research community, they also have their share of limitations. First, all of the studies described above are US-based. In fact, as far as the authors are aware, there has been no non-US study conducted to date on this topic. This is relevant, not only because differences in driving behavior/culture and vehicle fleet composition may exist between other countries and the US, but also because these differences may play a role in SVROR crash severity. Thus, there is a need to investigate these crashes outside the US. Second, the present study focuses on the odds of incurring fatal injury as a driver. By focusing on driver fatal injury alone, the seating position is controlled for, and the risk of incurring the most severe injury possible (i.e., fatal injury) is the focus. Focusing on fatal injuries only is relevant because fatal injury is the most costly (in terms of crash costs) injury type, being as much as 10 times more costly than the second most severe injury category [21]. In addition, due to its high crash cost, fatal injuries have the potential to significantly impact severity index values used in highway safety benefit-cost analysis procedures [22]. Therefore, the quantification of fatal injury risk associated with specific roadside features may be a relevant input in improving the accuracy of benefit-cost analyses. Third, previous studies have discussed the problems associated with crash injury data miscoding [23]. In some of those studies, injury data was coded into three or more categories. The problem with this approach is that it becomes subject to too much reliance on police officers’ distinction between injury levels (e.g., minor and moderate injury). It can be argued that care should be taken, even when relying on the disabling/severe injury category data, as severely injured occupants may die days, or even weeks, after the crash occurred. Thus, distinguishing fatal injuries from other injuries should be more straightforward and less subject to error. Lastly, another problem that needs to be recognized is that “no injury” data is more prone to the underreporting issue. Previous research has shown that as much as 90 percent of all crashes have been estimated to go underreported [24]. If most of the underreported barrier crashes involve light or no injuries, then the collected and analyzed data on no-injury barrier crashes is underrepresented, leading to estimated injury risk reduction associated with roadside barriers (as compared to other fixed-object hazards) to appear smaller than what it may actually be. This underestimation problem may be minimized by focusing on injury-only data.
In light of all of the past research limitations/issues previously described, there is a need for a non-US-based study that attempts to quantify the risk of fatal injuries associated with drivers involved in SVROR-injury crashes. Such a study should include data from both urban and rural areas, low- and high-speed highways, median- and right-side-located objects, as well as more uniform “fixed-object” classification. The present study intends to fill this gap.

1.2. Research Objectives

The objective of this research is to quantify the odds of fatal road injuries associated with drivers involved in SVROR-injury crashes, based on a multivariate modeling approach.

2. Methods

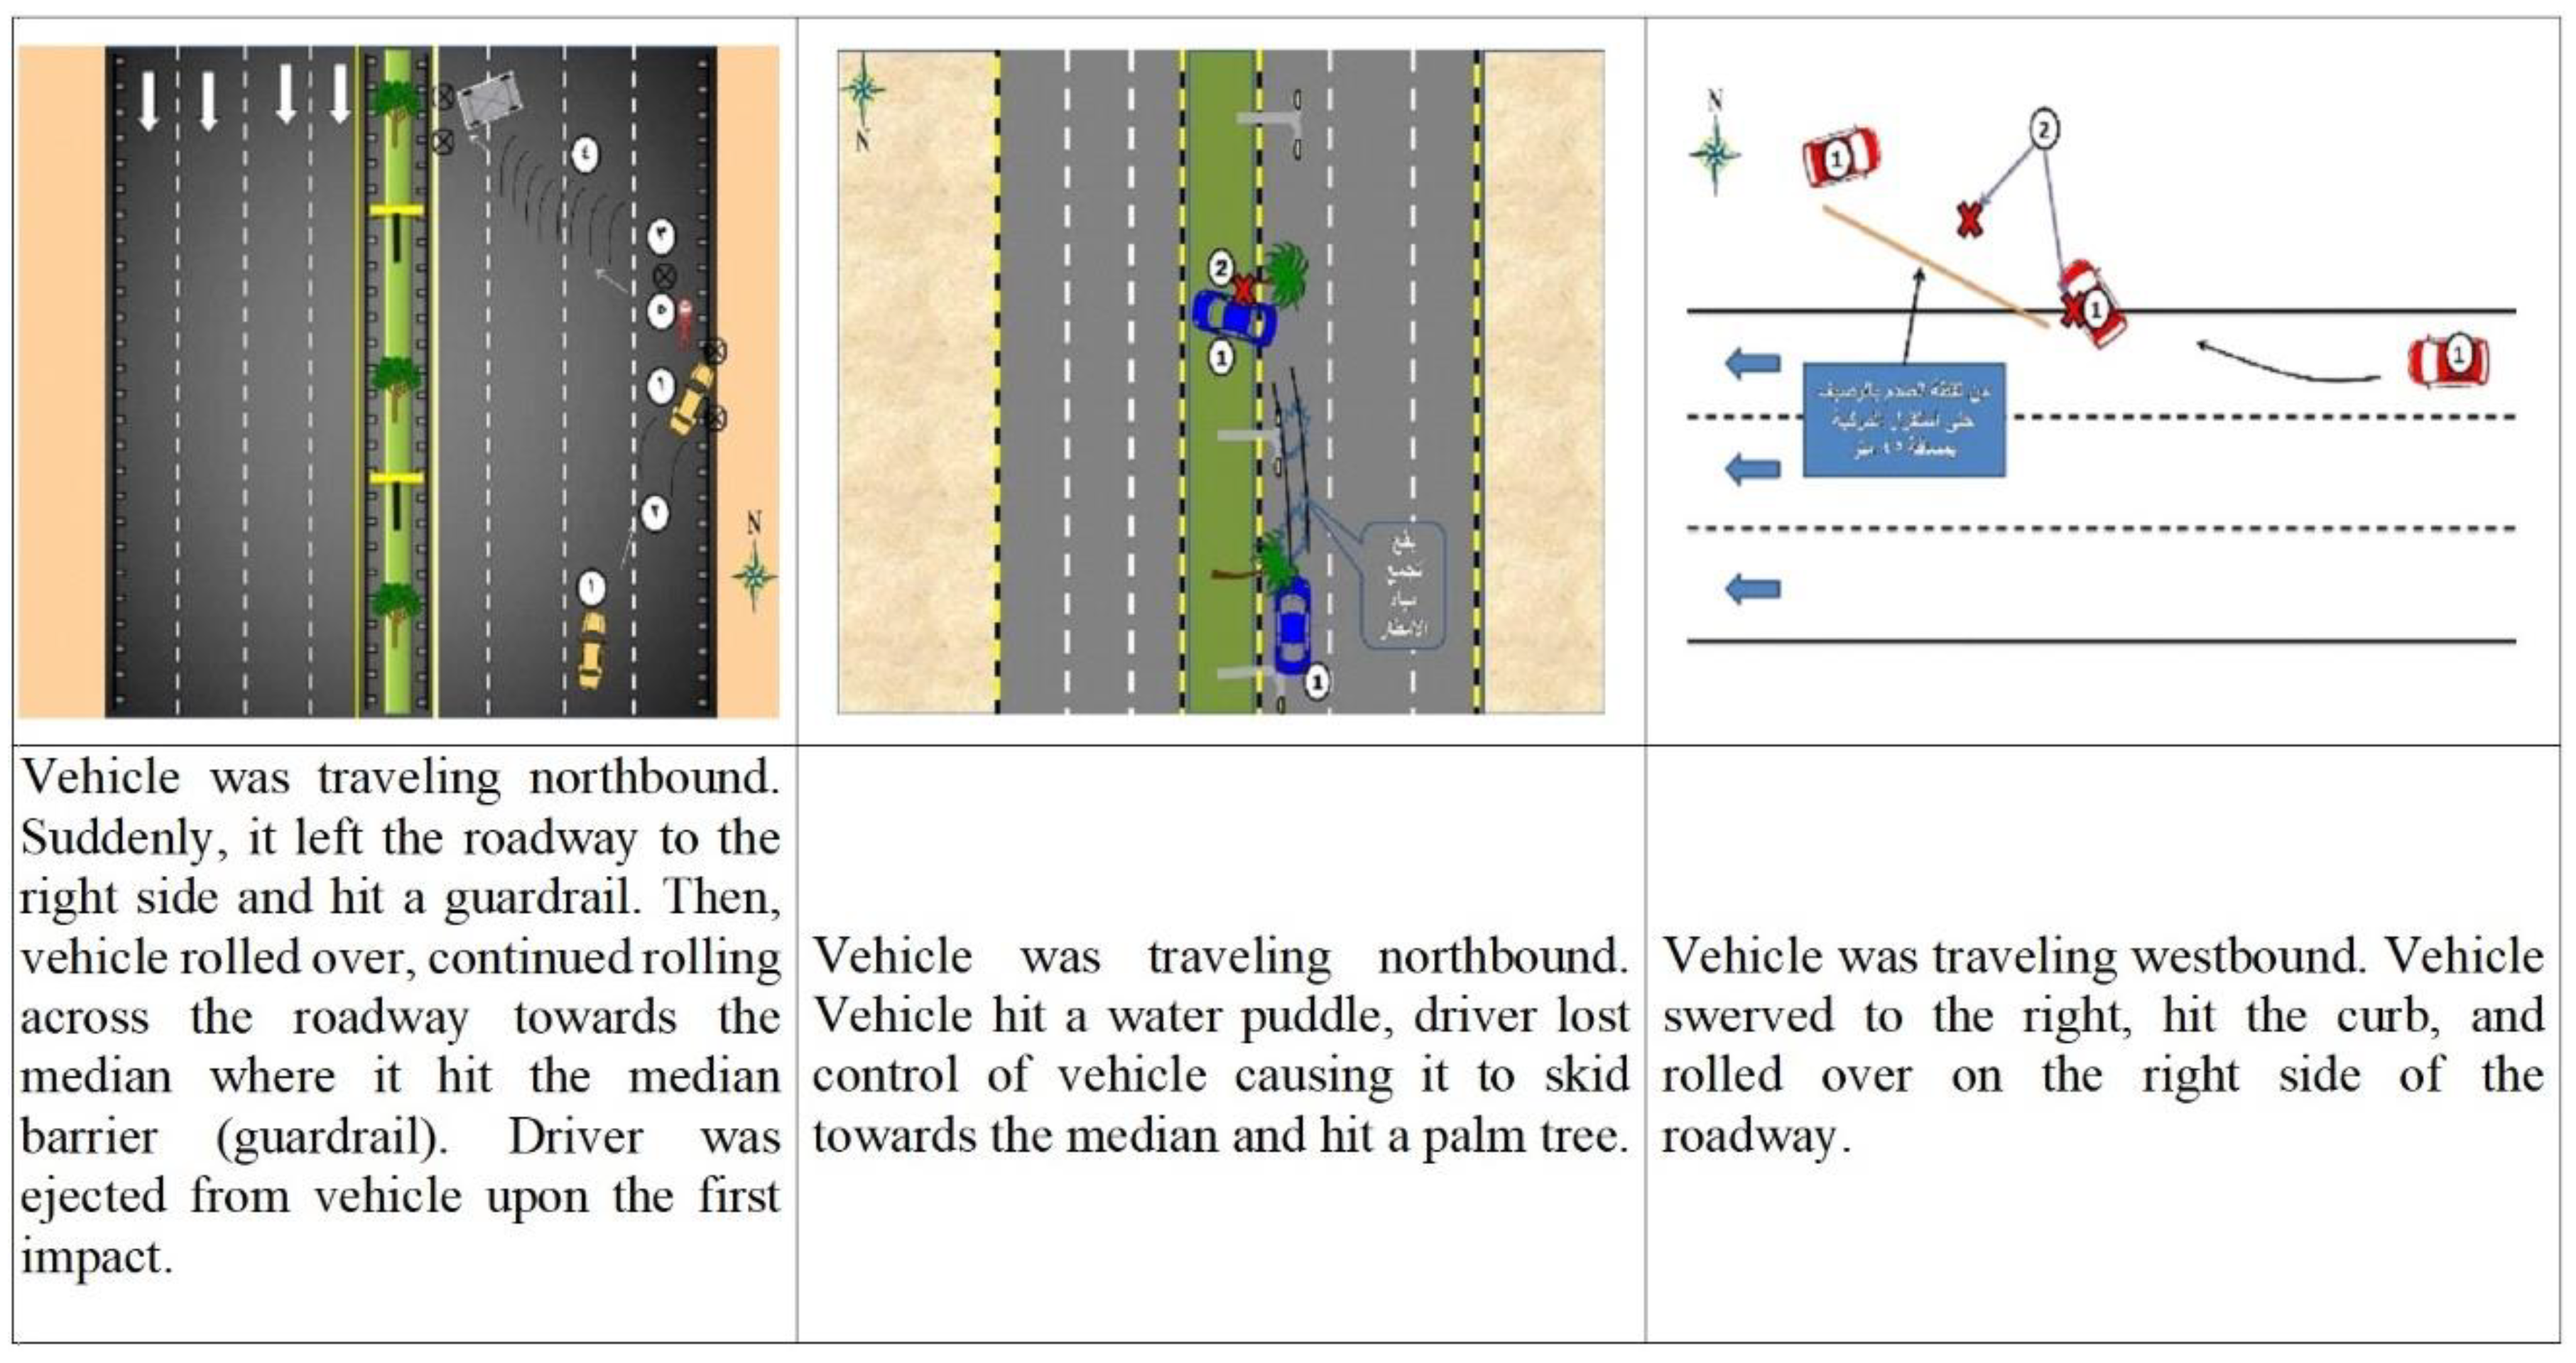
2.1. Data Collection and Description

A multi-year crash database was used to study SVROR-injury crashes that occurred between the years 2013 and 2016 in the Emirate of Abu Dhabi, part of the United Arab Emirates (UAE). The Emirate of Abu Dhabi is the largest of the UAE’s seven emirates, occupying about 85 percent of the country’s land mass.
Injury crash data was provided by the Abu Dhabi Traffic Police. Abu Dhabi Traffic Police classifies injury data as minor, moderate, severe, and fatal. Deaths occurring up to 30 days after road crashes are included in the fatal injury data. There was no field in the databases for information on sequence of events or rollover outcome. Thus, all crash descriptions and diagrams had to be manually reviewed to identify the sequence of crash events and rollover occurrence outcome. Figure 1 shows examples of crash descriptions and diagrams. All these crashes resulted in fatalities. Descriptions were originally written in Arabic. Thus, descriptions included in Figure 1 are translations. Arabic texts included in the middle case and in the right-most case can be translated to “rain water puddle” and “distance from the impact point to the final rest point is 45 m”, respectively.
The crash database used does not link seating position information to injury severity. However, it contains the number of vehicles and people involved in a crash, as well as the injury severity associated with all injured people. As such, injury crash data were retrieved based on the number of vehicles and people involved in a crash, as well as the crash type. That is, all injury crashes classified as “single-vehicle”, involving a single person only, and falling into the “off-road collision with fixed/moveable object” category were selected to be included in the study. In addition, a keyword (e.g., barrier, tree, pole, sign, fence, wall, and curb) search within the crash description field was also made, in order to avoid legitimate SVROR crashes being left out. There were 91 crashes involving errant vehicles entering roundabout islands. These cases were removed. At the end of the retrieving process, there were a total of 555 crashes.
The non-injury crash database was not used, since it contains neither accurate crash location information, nor detailed crash descriptions and diagrams. As such, information related to barrier type, sequence of events, and rollover outcome could not be collected from non-injury crashes.
Median crashes accounted for 41.98 percent (233 cases), while crashes that occurred on the right side of the roadway accounted for 58.02 percent (322 cases) of all crashes. Forty-nine percent (271 cases) of the crashes occurred in urban areas, while 51.17 percent (284 cases) occurred in rural areas. Almost 3 percent of the drivers were under 18 years old (the minimum legal age to obtain a driver’s license), 90 percent were between 18 and 50 years old, 6 percent were between 51 and 70 years old, and less than 1 percent was older than 70 years old. Eighty-four percent of the drivers were male and 16 percent were female. This large difference in the number of male drivers relative to their female counterparts may be explained by the fact that the number of males residing in the UAE is higher than the number of females, as well as that most professional drivers are males. Only 5 percent of the crashes were classified as having occurred during adverse weather conditions such as fog and rain.
None of the poles were equipped with breakaway devices. All steel barriers were w-beam (WB) guardrails. All concrete barriers had a sloped-face. This is noteworthy, since previous research has shown that different concrete barrier configurations have varying effects on vehicle rollover propensity which, in turn, tend to negatively impact crash severity [25]. Out of 185 barrier crashes, 8 involved end terminals. Four of these crashes involved a vehicle hitting a sloped end concrete terminal, while the other four cases involved a vehicle hitting a turned down guardrail end terminal. These end-terminals do not comply with state-of-the-art guidelines [1,26]. Out of the four concrete-barrier-end-terminal crashes, two of them were fatal, while none of the guardrail-end-terminal crashes resulted in fatalities.
As shown in Table 1, trees, poles, barriers, and curbs accounted for almost 80 percent of all of the most harmful objects struck. The other categories included objects such as traffic signs, fences, and building walls. Out of the 175 barrier crashes, 63.43 percent (111 cases) involved a WB guardrail and 29.14 percent (51 cases) involved a concrete barrier. There were 10 crashes involving plastic barriers and 3 involving cable barriers. Ninety percent of all barriers were located up to 5 m from the roadway edge. The maximum barrier-to-roadway lateral offset was about 7 m. Overall, the WB guardrail and concrete barrier lateral offset distributions were very similar.
Table 1 also shows that 42.88 percent of the crashes occurred on roads with design speed of 80 kph or lower, and 57.12 percent of the crashes occurred on roads with design speed of 100 kph or higher. Until mid-2018, drivers in the Emirate of Abu Dhabi were legally allowed to drive 20 kph above the posted speed limit before they were fined for speeding [27]. This meant that legally allowed speeds were the same as design speeds [26]. Finally, over 90 percent of the vehicles were classified as light vehicles. Thirty-six percent of all crashes involved rollovers. Sixty-six percent of all drivers were reported as belted.

2.2. Statistical Modeling

Multivariate logistic regression models were used to quantify the odds of incurring a fatal driver injury given a collision with different roadside hazards, while controlling for potential crash severity contributing factors. Thus, in order to investigate the impact of fixed object on crash severity, fixed object struck was defined as the independent variable, while crash severity was defined as the dependent or response variable. The logit model has not only been used in previous studies to address similar research problems [15,16], but its output may be easily interpreted in terms of odds ratios [28].

2.2.1. Logit Model

A univariate logit model may be mathematically expressed by Equation (1), where x is the predictor variable (e.g., most harmful object struck), π(x) is the success (defined as a fatal driver injury) probability at the value x, β0 is the intercept, and β represents the effect of the variable x on the response variable.
Logit [π(x)] = β0 + βx,
A multivariate logit model with n predictor variables may be expressed by Equation (2). In order to calculate the odds estimate, the exponential of the logit is determined by Equation (3). Since the response variable is binary (i.e., y = non-fatal or fatal injury), a binary logit model was used. The binary logit model calculates the probability that the response, coded as y equal to 0 or 1, is equal to 1 (e.g., π [y = fatal crash]), which would mean “success”. Therefore, logistic regression models can help quantify the odds associated with a fatal crash occurrence upon a collision with different fixed roadside hazards, while controlling for a number of relevant vehicle-, road-, and occupant-related variables (i.e., potential crash severity contributing factors).
Logit [π(x)] = β0 + β1 x1 + β2 x2n xn,
Odds = e 01 x12 x2n xn),
In order to fit the logistic regression model, the coefficient(s) beta(s) need to be determined. The statistical method used to determine the model’s parameters is the maximum likelihood estimation [29]. Hosmer and Lemeshow provide explanations on how the parameter values that maximize the likelihood function, in the case of a logistic regression model, are determined [30]. Iterative methods programmed into statistical software are used to solve likelihood equations using a generalized weighted least squares procedure [31]. The solution of these iterative methods find a value of β that is the maximum likelihood estimate. All statistical analyses presented in this study were conducted using software Minitab 19 [32].

2.2.2. Model Building and Goodness-of-Fit Test

Univariate analyses were first conducted to evaluate the effect of each individual predictor variable (i.e., most harmful object struck) on the response variable (i.e., crash severity). All five variables shown in Table 1 were considered. The p-value of 0.25 was chosen as the indicator in determining which variables were to be included in the multivariate analysis, and was based on recommendations made by Hosmer and Lemeshow (2000) [30]. The traditional p-value = 0.05 was not recommended, because: (i) it may fail to identify variables that may be relevant to the study, and (ii) the univariate analysis may ignore that an isolated variable which presents a p-value larger than 0.05 may become relevant (i.e., statistically significant) when it is considered alongside other variables.
The multivariate analysis consisted of evaluating the effect of multiple predictors (e.g., most harmful object struck, posted speed limit, and seatbelt use) simultaneously on the response variable. Thus, multivariate analysis provides a level of control that is not provided by its univariate counterpart, allowing the effect of different fixed object hazards on crash severity to be investigated on a fairer basis.
As multiple variables are taken together, some of them might become statistically insignificant, and each of these could then be removed from the model. This stage is called the model building stage. In this study, backward regression was used during this stage, to find a final model that was as parsimonious as possible and that contained only variables that were statistically significant predictors, keeping in mind that parsimony may be particularly relevant in avoiding data sparseness.
The likelihood ratio test was used to test variable significance in the backward regression process. The likelihood ratio test compares the fit of two models, by evaluating the statistical significance of the least significant variable to the model. If this variable is found to be insignificant, the simpler model is considered. The test is based on the ratio that expresses how many times more likely the data are under one model than the other. In other words, both models are fitted, and the ratio of their log-likelihood is calculated as shown in Equation (4) (i.e., deviance). The likelihood of the model is the probability that the model would be observed, given the coefficient estimates.
D = 2 ln ( likelihood   for   full   model likelihood   for   simpler   model ) ,
Lastly, after a model has been selected, it is important to assess how well this model fits the data. In this study, the Hosmer-Lemeshow test was used to assess the goodness-of-fit of the binary logit models developed [30].

3. Results

There was a total of 1071 SVROR-injury crashes in the area studied between 2013 and 2016. Out of these, 555 SVROR-injury crashes involved a driver only. Out of the crashes involving a driver only, 71 (12.79 percent) resulted in fatalities. Forty-nine percent (271 cases) of these crashes occurred in urban areas, while 51.17 percent (284 cases) occurred in rural areas. Twelve percent of all urban-, and 13.73 percent of all rural-area crashes resulted in fatal injuries. Table 2 shows the crash severity distribution by most harmful object struck. As can be seen, poles, trees, barriers, and curbs accounted for almost 80 percent (see cells in gray) of all most harmful objects struck. Barriers were found to be the most often most harmful object struck, accounting for 31.53 percent (see bold number) of all SVROR-injury crashes. This significant barrier involvement in SVROR crashes may stem from the fact that barriers are not only placed in front of other fixed roadside obstacles, but they also tend to be longer than the shielded hazards (i.e., trees and poles) [33,34]. Poles appeared to be the most severe object struck, as 16.22 percent (see underlined number) of the pole injury crashes resulted in fatalities. This compares to 15.58, 9.71, and 11.11 percent (see double-underlined numbers) for tree, barrier, and curb crashes, respectively. Sixty-one out of 188 (32.44 percent) tree/pole crashes involved side-impact collisions. Out of all side-impact collisions, 10 (16.39 percent) resulted in fatalities. Fifty-four out of the 77 tree crashes involved palm trees, which had a mean width of about 70 cm. Out of the barrier crashes, 111 involved WB guardrails, 51 involved concrete barriers, 10 involved plastic barriers, and 3 involved cable barriers. Due to the very small number of plastic and cable barrier crashes, these barriers were not considered in the statistical models developed in this study. Finally, 42 out of the 111 (37.84 percent) WB guardrail crashes, and 19 out of the 51 (37.25 percent) concrete barrier crashes resulted in rollovers. Six out of the 42 (14.28 percent) WB guardrail crashes and 5 out of 19 (26.31 percent) concrete barrier crashes involving rollover events resulted in fatalities.
Seventy percent of the curb crashes involved curbs higher than 15 cm, which is the curb height recommended by roadside design guidelines [1]. In fact, 67 percent of all curb locations on lower-design-speed roads (i.e., ≤80 kph) had curbs higher than 15 cm while 81 percent of all curb locations on higher-design-speed roads (i.e., ≥100 kph) had curbs higher than 15 cm. Fifty-two percent of all curb crashes produced rollovers, while 7 out of the 8 fatal curb crashes involved rollovers. Lastly, 65 percent of all higher-curb crashes that occurred on higher-design-speed roads resulted in rollovers, while only 41 percent of all higher-curb crashes that occurred on lower-design-speed roads resulted in rollovers. Thus, traveling speeds may have played a role in an increased rollover occurrence in curb collisions. These are striking numbers, showing not only that curb height in the studied area is mostly non-compliant to roadside design guidelines [1], but also that there may be a high rollover likelihood upon curb collisions.
Table 3 shows the results from the univariate analysis. As can be seen, driver fatality risk associated with crashes involving trees or poles is no different from that associated with crashes involving non-barrier objects such as curbs, fences, and walls (p-values = 0.50 and 0.37), as well as concrete barrier crashes (p-values = 0.77 and 0.68). On the other hand, the odds of a fatal injury occurring is 2.4 and 2.5 times higher for tree and pole crashes, as compared to WB guardrail crashes (p-values = 0.07 and 0.04). The odds of a fatal injury occurring is 2.0 times higher for concrete barrier crashes as compared to WB guardrail crashes, though this finding was statistically significant only at the 19 percent significance level. However, there are a number of factors (e.g., posted speed limit, seat belt use, and vehicle class) that may significantly affect the odds of fatal injuries besides the fixed-object type. These factors were not controlled for in this univariate analysis. Thus, a multivariate model represented by Equation (2), and estimated based on the procedures described in the model building section, is needed.
Table 4 shows the results from the multivariate logistic regression analysis. All five variables shown in Table 1 were initially inserted into the multivariate model, since all of them were found to be statistically significant to crash severity at the p-value threshold of 0.25 discussed in the model building section. However, as all of the variables were considered simultaneously, some of them became insignificant, qualifying them to be excluded (through backward elimination) from further consideration. The first model (from top to bottom) shown in Table 4 compares the odds of a driver fatality due to “Other hazards” (i.e., hazards other than barriers, trees and poles) crashes and the odds of a driver fatality due to tree/pole crashes. These hazards included fences, traffic signal poles, traffic signs, building walls, and curbs. In this case, the binary dependent variable is crash severity (i.e., fatal or not fatal), while the variables most harmful object struck, design speed, and seat belt usage were kept in the final, selected model. The variables vehicle class and rollover turned out to be insignificant, likely due to data sparseness. Because barrier cases were excluded, this particular model made use of 380 observations. Under the “# Non-Baseline Observations”, the number of tree and pole crashes, for example, were found to be 77 and 111, respectively. As a result, the total number of hazard crashes (i.e., excluding barrier, pole and tree crashes) was 192 (i.e., 380 minus 77, minus 111). Results from the first model shown in Table 4 indicate that the odds of a fatal injury occurring due to a tree collision are comparable (i.e., 1.04) to those due to other hazard collisions (i.e., excluding barriers and poles), as well as that the odds of a fatal injury occurring are 1.46 times higher for pole collisions compared to other collisions (i.e., excluding barriers and trees), while controlling for design speed and seatbelt use. However, none of these findings were found to be statistically significant (i.e., p-values = 0.92 and 0.28, respectively). In sum, there is no statistically significant difference in fatal injury risk among non-barrier roadside hazards. Looking at the same model, it can also be concluded that the odds of a fatal injury occurring are 1.93 times higher (p-value = 0.03) for crashes that occurred on roads with design speeds no higher than 80 km/h, as compared to crashes that occurred on roads with design speeds no lower than 100 km/h, and 2.21 times higher (p-value = 0.01) for crashes that involved unbelted occupants compared to crashes that involved belted occupants. Lastly, the Hosmer-Lemeshow, goodness-of-fit test indicated that this model presented an acceptable fit based on a p-value of 0.475, which is significantly higher than the critical value of 0.05.
The other three multivariate models were built to investigate the in-service safety performance of WB guardrail and concrete barriers. Based on the model building process, these models ended up containing only two independent variables (i.e., most harmful object struck and design speed). The second model included in Table 4 indicates that the odds of a fatal injury occurring are 3.1 and 4.7 times higher for tree and pole collisions, respectively, as compared to WB guardrail collisions (p-values = 0.02 and 0.00). The third model indicates that while the odds of a fatal injury occurring are 1.1 and 1.9 times higher for tree and pole collisions, respectively, as compared to concrete barrier collisions, these findings were not found to be statistically significant (i.e., p-values = 0.81 and 0.23). Therefore, concrete barrier collisions did not appear to be any safer than tree or pole collisions, while controlling for design speed.
The last model shown in Table 4 indicates that the odds of a fatal injury occurring are 2.5 times higher for concrete barrier collisions as compared to WB guardrail collisions, while controlling for design speed. This finding was found to be statistically significant at the 12 percent significance level only, likely due to sample size. That is, if seating position is not controlled for, such that crash severity relates to vehicle-occupant and not just driver injury, the total number of observations to be used in the last model shown in Table 4 would be 316, rather than only 162. In this case (though not shown in Table 4), the odds of a fatal injury occurring are 1.9 times higher for concrete barrier crashes as compared to WB guardrail crashes, while controlling for design speed. This finding was found to be statistically significant at the 8 percent significance level.
Another approach to assess the in-service safety performance of these roadside barriers (i.e., WB guardrails and concrete barriers) is to compare their vehicle containment performance. Roadside barriers should be designed to meet crash testing criteria [35]. Thus, roadside barriers should safely contain and redirect errant vehicles, which means vehicles should remain upright during the containment/redirection event. Table 5 shows the crash severity distribution by barrier type and vehicle containment outcome. Since controlling for seating position is irrelevant in assessing roadside barrier performance in terms of vehicle containment, Table 5 also shows data from crashes involving vehicles with more than one occupant (see numbers in the right corner of each cell). As such, barrier performance can be assessed based on a larger sample. As can be seen, crashes involving lack of vehicle containment were associated with higher percentages of fatal outcomes. That is, the overall percentage of fatal crashes involving vehicle containment was 6.73 and 8.08 for the driver-only and all data, respectively. On the other hand, the overall percentage of fatal crashes involving a non-containment outcome was 13.79 and 22.88 for the driver-only and all data, respectively (see numbers in bold). Thus, these numbers may suggest that roadside barrier crash severity may be sensitive to vehicle containment outcome. In addition, Table 5 also shows that 41.78 percent of all WB guardrail crashes and 26.37 percent of all concrete barriers involved non-containment outcomes (see underlined numbers). This may be due to the fact that concrete barriers are much more rigid than WB guardrails.
Data contained in Table 5 may also be used to study the impact of vehicle containment outcome on crash severity, while controlling for barrier type. In this case, since crash severity is of concern, one may opt to rely on the driver-only data (shown in the left corner of each cell). As can be seen, out of the WB guardrail and concrete barrier crashes involving vehicle containment, 7.46 and 5.41 percent, respectively, resulted in fatal injuries. On the other hand, out of the WB guardrail and concrete barrier crashes involving non-containment, 6.82 and 35.71 percent, respectively, resulted in fatal injuries (see bold, underlined numbers). If the impact of vehicle containment outcome on crash severity is analyzed using the entire data (i.e., not controlling for seating position) instead for the sake of relying on a larger sample size, results are also striking. That is, out of the WB guardrail and concrete barrier crashes involving vehicle containment, 7.63 and 18.09 percent, respectively, resulted in fatal injuries. On the other hand, out of the WB guardrail and concrete barrier crashes involving non-containment, 8.96 and 41.67 percent, respectively, resulted in fatal injuries (see double-underlined numbers). Finally, overall, almost 90 percent of all non-containment events occurred on higher-design-speed roads (i.e., ≥100 kph). In summary, these numbers suggest that: (i) lack of vehicle containment (upon a barrier crash) tended to occur on higher-design-speed roads and resulted in a higher percentage of fatal crashes, (ii) lack of vehicle containment was more prevalent with the less rigid barrier type, and (iii) given that a vehicle had not been contained, a consistently higher percentage of fatal crashes was observed under the concrete barrier category.
Table 6 shows the results of an analysis intended to investigate the driver fatality risk between: (i) tree/pole/barrier crashes and no-fixed-object-hazard (except curbs) crashes and ii) tree/pole/barrier crashes and no-fixed-object-hazard (not even curbs) crashes. As can be seen, the odds of driver fatality occurring are 1.95 times higher (p-value = 0.09) for tree/pole crashes as compared to curb-/collision-free crashes, while controlling for design speed and seatbelt use. If curb crashes are excluded, it can be seen that the odds of driver fatality occurring are 8.84 times higher (p-value = 0.04) for tree/pole crashes as compared to collision-free crashes, while controlling for design speed. Likewise, the odds of driver fatality occurring are 2.44 times higher (p-value = 0.08) for barrier crashes as compared to curb-/collision-free crashes, while controlling for design speed and rollover. If curb crashes are excluded, it can be seen that the odds of driver fatality occurring are 7.29 times higher (p-value = 0.06) for barrier crashes as compared to collision-free crashes, while controlling for rollover events. Thus, fatalities were significantly more likely to occur when errant vehicles hit trees, poles, or barriers, as compared to vehicles that either hit curbs only or were involved in collision-free events. These results reinforce the importance of being compliant with design priorities defined by state-of-the-art roadside design guidelines [1]. These guidelines recommend that fixed-object hazards should be (in order of preference): (i) removed, (ii) redesigned or relocated outside the minimum suggested clear zone distance, or (iii) made traversable. If, and only if, none of these design priorities can be implemented, shielding should be considered. Unfortunately, research has shown that roadside design compliance has been lacking [7].

4. Discussions and Conclusions

The present study analyzed 555 SVROR-injury crashes that occurred in the Emirate of Abu Dhabi between 2013 and 2016. All crashes involved vehicles occupied by a driver only. Twelve percent of all crashes resulted in driver fatality. About half of the crashes occurred in urban areas and half in rural areas. Eleven percent of all urban-, and 14 percent of all rural-area crashes resulted in fatal injuries. Trees, poles, barriers, and curbs accounted for almost 80 percent of the most harmful object struck. Seventy percent of all tree crashes involved palm trees, which were found to be very robust fixed-objects with a mean width of 70 cm. Roadside barriers (i.e., WB guardrails and concrete barriers combined) were found to be the most often most harmful object struck, accounting for 31 percent of all crashes. Almost 10 percent of all roadside barrier crashes resulted in fatal injuries, which was found to be lower than nearly 15 and 16 percent of all tree and pole crashes. None of the barrier crashes resulted in secondary collisions involving other vehicles. About one-third of all tree/pole crashes involved side-impact collisions, while 16 percent of these collisions resulted in fatalities. These numbers may confirm the potential for reduction of fatalities in vehicle-guardrail collisions, considering that tree and pole locations may be treated by guardrail installation [36].
Based on the multivariate logistic regression models developed, there was no statistically significant difference between the odds of driver fatality occurring among crashes involving roadside hazards (other than barriers), nor among those involving tree, pole, and concrete barrier crashes. Roadside fixed-objects considered included trees, poles, barriers, curbs, fences, building walls, traffic signal posts, and traffic signs. No traffic signs or poles were equipped with breakaway devices or any other form of energy-absorbing mechanism. On the other hand, the odds of driver fatality occurring were found to be 3.1, 4.7, and 2.5 times higher for tree, pole, and concrete barrier crashes, respectively, as compared to WB guardrail crashes. Therefore, these findings may suggest that road safety may be improved by having fixed roadside hazards shielded with WB guardrails instead of rigid barriers, wherever possible. When comparing the odds of driver fatality in pole and WB guardrail crashes to that of tree and WB guardrail crashes, differences in lateral offset distances between poles and trees may have contributed to the increased odds of driver fatality occurring among crashes involving poles, as compared to those involving trees. That is, about 50 percent of the trees were located farther than 5 m from the roadway edge, while only 30 percent of the poles were located farther than 5 m from the roadway edge. Furthermore, while only 6 percent of the trees were located within lateral offset distances shorter than 2 m from the roadway edge, one-quarter of the poles were located within that distance range. In addition, fatalities were significantly more likely to occur as errant vehicles hit trees, poles, or barriers, as compared to vehicles that either hit curbs only or were involved in collision-free events. These results reinforce the importance of being compliant with design priorities defined by state-of-the-art roadside design guidelines [1]. These priorities, in order of preference, are: (i) remove obstacle, (ii) redesign or relocate obstacle, or iii) make obstacle traversable. If, and only if, none of these design priorities can be implemented, shielding should be considered.
Roadside barriers presented a less-than-desirable performance in terms of vehicle containment. That is, 41 and 26 percent (considering all data, and not just driver-only data) of all WB guardrail and concrete barrier crashes, respectively, involved a non-contained vehicle. In addition, 95 and 71 percent of all non-containment events involving WB guardrail and concrete barrier crashes, respectively, occurred on higher-speed-limit roads (i.e., ≥100 kph). These findings not only suggest that vehicle speeds may play a role on barrier containment performance, but also that barrier installations may need to be inspected in order to determine whether their design may be credited for meeting crash-testing criteria [35], as well as whether they are installed and maintained in order to function as they were intended to. Barrier design, installation, and maintenance/repair may have an impact on barrier crash severity. Previous research showed that injury rates produced by guardrail installations may be lower if guardrail installations that may be obsolete, improperly installed, or inadequately maintained are accounted for. Previous research also indicated that injury rates produced by guardrail installations may be lower if guardrail installations submitted to crash conditions that may be outside the practical design range of modern guardrail systems are accounted for [37]. However, more recent research showed that impact angles adopted in crash-testing criteria [35] should be revised upwards if barrier installations are to properly accommodate real-world impacts [38].
It is also important to point out the difference between the most harmful object struck and the most harmful event. A previous study showed that many injury-producing events, such as rollovers, occur after barrier impacts [39]. Findings from the current study confirm findings from Viner’s study. That is, while barrier crashes accounted for 70, 87, and 93 percent of all first, second, and third crash events, respectively, rollovers accounted for 7, 36, and 39 percent of all first, second, and third crash events, respectively. However, while a crash may involve a sequence of events, the database used in the current research study does not identify the most harmful event. However, the most harmful object struck was identified by manually reviewing all crash descriptions and diagrams. For example, a crash may have involved a vehicle hitting a barrier and rolling over. In this case, the most harmful object struck was the barrier, but it was not obvious whether the rollover was the most harmful event. As a means to address this issue, the variable rollover was considered during the model building phase of the multivariate analysis, though rollover ended up being included in only two of the final models selected (see Table 6). Nevertheless, data were segregated based on collision type preceding a rollover, and it was found that 72 percent of all rollovers were preceded by no impact, as well as by barrier and curb impacts. This suggests that: (i) causes of rollovers preceded by barrier collisions (i.e., 25 percent of all rollover events) may need to be investigated further, as barriers are expected to contain/redirect errant vehicles while keeping them upright, (ii) curb design may also need to be reviewed/inspected, as a significant portion (i.e., 28 percent) of all rollovers were preceded by curb collisions, fifty-two percent of all curb crashes produced rollovers, and 7 out of the 8 fatal curb crashes involved rollovers, and (iii) causes of rollovers in collision-free events (i.e., 19 percent) may need to be investigated further, since roadside terrain should keep errant vehicles on a stable trajectory.
Finally, it is also important to discuss the potential impact underreporting may have on the results of this study. Previous research showed that there may be a significant amount of barrier crashes that are not reported [40,41]. Thus, since underreporting is more recurrent among lower-severity crashes, and WB guardrail crashes were found to be less severe than tree, pole, and concrete barrier crashes, it may be reasonable to assume that underreporting may be more prevalent among WB guardrail crashes. If this is the case, then the real odds of driver fatality occurring in tree, pole, or concrete barrier crashes, versus WB guardrail crashes, should actually be higher than the estimated odds shown in Table 4. Hence, the safety benefits of shielding, fixed, roadside obstacles with WB guardrails versus leaving these obstacles unprotected may be underestimated if the estimated odds presented in the current study are not adjusted for underreporting. Thus, the need for adjustment of underreporting is relevant, as the findings from this study may be helpful in the development of severity indices and in the evaluation of proposed roadside safety improvements [22].

Author Contributions

Conceptualization, F.D.B.d.A.; methodology, F.D.B.d.A. and D.M.A.; software, D.M.A.; formal analysis, F.D.B.d.A. and D.M.A.; investigation, D.M.A.; writing—original draft preparation, F.D.B.d.A.; writing—review and editing, F.D.B.d.A. and D.M.A.; visualization, D.M.A.; supervision, F.D.B.d.A.; project administration, F.D.B.d.A.; funding acquisition, F.D.B.d.A. All authors have read and agreed to the published version of the manuscript.

Funding

This research was funded by United Arab Emirates University, grant number 31N262.

Acknowledgments

The authors would like to thank the United Arab Emirates University for funding this research effort under grant number 31N262. The authors would also like to thank the staff at the Abu Dhabi Traffic Police for the provision of the crash data needed for this study, as well as for their assistance.

Conflicts of Interest

The authors declare no conflict of interest. The funders had no role in the design of the study; in the collection, analyses, or interpretation of data; in the writing of the manuscript, or in the decision to publish the results.

References

  1. AASHTO. Roadside Design Guide, 4th ed.; American Association of State Highway and Transportation Officials: Washington, DC, USA, 2011. [Google Scholar]
  2. Kloeden, C.; McLean, A.; Baldock, M.; Cockington, A. Severe and Fatal Car Crashes Due to Roadside Hazards; NHMRC Road Accident Research Unit, University of Adelaide: Adelaide, Australia, 1999. [Google Scholar]
  3. Liu, C.; Subramanian, R. Factors Related to Fatal Single-Vehicle Run-Off-Road Crashes; DOT HS 811 232; U.S. Department of Transportation and National Highway Traffic Safety Administration: Washington, DC, USA, 2009. [Google Scholar]
  4. Van Petegem, J.H.; Wegman, F. Analyzing road design risk factors for run-off-road crashes in The Netherlands with crash prediction models. J. Saf. Res. 2014, 49, 121–127. [Google Scholar] [CrossRef] [PubMed]
  5. Wu, Q.; Zhang, G.; Zhu, X.; Liu, X.C.; Tarefder, R. Analysis of driver injury severity in single-vehicle crashes on rural and urban roadways. Accid. Anal. Prev. 2016, 94, 35–45. [Google Scholar] [CrossRef] [PubMed]
  6. Roque, C.; Moura, F.; Cardoso, J. Detecting unforgiving roadside contributors through the severity analysis of ran-off-road crashes. Accid. Anal. Prev. 2015, 80, 262–273. [Google Scholar] [CrossRef] [PubMed]
  7. Albuquerque, F.D.B.; Awadalla, D.M. Roadside design assessment in an urban, low-density environment in the gulf cooperation council region. Traffic Inj. Prev. 2019, 20, 436–441. [Google Scholar] [CrossRef] [PubMed] [Green Version]
  8. National Research Council. Highway Guardrail Determination of Need and Geometric Requirements with Particular Reference to Beam-Type Guardrail; Special Report 81; Highway Research Board: Washington, DC, USA, 1964. [Google Scholar]
  9. Michie, J.D.; Calcote, L.R. Location, Selection, and Maintenance of Highway Guardrails and Median Barriers; NCHRP Report 54; Highway Research Board: Washington, DC, USA, 1968. [Google Scholar]
  10. Michie, J.D.; Bronstad, M.E. Location, Selection, and Maintenance of Highway Traffic Barriers; NCHRP Report 118; Highway Research Board: Washington, DC, USA, 1971. [Google Scholar]
  11. AASHTO. Guide for Selecting, Locating, and Designing Traffic Barriers; American Association of State Highway and Transportation Officials: Washington, DC, USA, 1977. [Google Scholar]
  12. Woods, D.L. In-service evaluation of roadside hardware. In The Role of the Civil Engineer in Highway Safety; ASCE: New York, NY, USA, 1983. [Google Scholar]
  13. Lee, J.; Mannering, F.L. Impact of roadside features on the frequency and severity of run-off-roadway accidents: An empirical analysis. Accid. Anal. Prev. 2002, 34, 149–161. [Google Scholar] [CrossRef]
  14. Holdridge, J.M.; Shankar, V.N.; Ulfarsson, G.F. The crash severity impacts of fixed roadside objects. J. Saf. Res. 2005, 36, 139–147. [Google Scholar] [CrossRef]
  15. Zou, Y.; Tarko, A.P.; Chen, E.; Romero, M.A. Effectiveness of cable barriers, guardrails, and concrete barrier walls in reducing the risk of injury. Accid. Anal. Prev. 2014, 72, 55–65. [Google Scholar] [CrossRef]
  16. Russo, B.J.; Savolainen, P.T. A comparison of freeway median crash frequency, severity, and barrier strike outcomes by median barrier type. Accid. Anal. Prev. 2018, 117, 216–224. [Google Scholar] [CrossRef]
  17. Molan, A.M.; Rezapour, M.; Ksaibati, K. Modeling traffic barriers crash severity by considering the effect of traffic barrier dimensions. J. Mod. Transp. 2019, 27, 141–151. [Google Scholar] [CrossRef] [Green Version]
  18. Molan, A.M.; Rezapour, M.; Ksaibati, K. Investigating the relationship between crash severity, traffic barrier type, and vehicle type in crashes involving traffic barrier. J. Traffic Transp. Eng. 2020, 7, 125–136. [Google Scholar] [CrossRef]
  19. Hutchinson, T.P. Statistical modelling of injury severity, with special reference to driver and front seat passenger in single-vehicle crashes. Accid. Anal. Prev. 1986, 18, 157–167. [Google Scholar] [CrossRef]
  20. Eluru, N.; Paleti, R.; Pendyala, R.M.; Bhat, C.R. Modeling injury severity of multiple occupants of vehicles: Copula-based multivariate approach. Transp. Res. Rec. 2010, 2165, 1–11. [Google Scholar] [CrossRef]
  21. Harmon, T.; Bahar, G.; Gross, F. Crash Costs for Highway Safety Analysis; FHWA-SA-17-071; Fedral Highway Administration (FHWA): Washington, DC, USA, 2018. [Google Scholar]
  22. Turner, D.S.; Hall, J.H. Severity Indices for Roadside Features; NCHRP Synthesis 202; Transportation Research Board, National Research Council: Washington, DC, USA, 1994. [Google Scholar]
  23. Tarko, A.P.; Azam, S. Pedestrian injury analysis with consideration of the selectivity bias in linked police-hospital data. Accid. Anal. Prev. 2011, 43, 1689–1695. [Google Scholar] [CrossRef] [PubMed]
  24. Michie, J.D.; Bronstad, M.E. Highway guardrails: Safety feature or roadside hazard? Transp. Res. Rec. 1994, 1468, 1–8. [Google Scholar]
  25. Albuquerque, F.D.B.; Sicking, D.L. In-service safety performance evaluation of roadside concrete barriers. J. Transp. Saf. Secur. 2013, 5, 148–164. [Google Scholar] [CrossRef]
  26. Abu Dhabi City Municipality. Roadway Design Manual, 2nd ed.; Abu Dhabi Department of Municipal Affairs: Abu Dhabi, UAE, 2014. [Google Scholar]
  27. Zacharias, A. Abu Dhabi 20kph Speed Limit Buffer to be Removed in August. Available online: https://www.thenational.ae/uae/abu-dhabi-20kph-speed-limit-buffer-to-be-removed-in-august-1.753875 (accessed on 30 November 2018).
  28. Agresti, A. An Introduction to Categorical Data Analysis, 3nd ed.; John Wiley and Sons, Inc.: Hoboken, NJ, USA, 2018. [Google Scholar]
  29. Eliason, S.R. Maximum Likelihood Estimation: Logic and Practice, 1st ed.; Quantitative Applications in the Social Sciences; SAGE Publications, Inc.: Newbury Park, CA, USA, 1993; Volume 96. [Google Scholar]
  30. Hosmer, D.; Lemeshow, S. Applied Logistic Regression, 2nd ed.; Wiley Interscience Publication: New York, NY, USA, 2000. [Google Scholar]
  31. McCullagh, P.; Nelder, J.A. Generalized Linear Models, 2nd ed.; Chapman & Hall/CRC Monographs on Statistics and Applied Probability; Chapman and Hall/CRC: London, UK, 1989. [Google Scholar]
  32. Ryan, B.F.; Ryan, T.A.; Joiner, B.L. Minitab 19; Minitab, LLC: State College, PA, USA, 2019. [Google Scholar]
  33. Albuquerque, F.D.B.; Sicking, D.L.; Faller, R.K.; Lechtenberg, K.A. Evaluating the cost-effectiveness of roadside culvert treatments. J. Transp. Eng. 2012, 137, 918–925. [Google Scholar] [CrossRef]
  34. Albuquerque, F.D.B.; Sicking, D.L.; Stolle, C. Optimal guardrail runout lengths for freeways. J. Transp. Saf. Secur. 2016, 9, 403–418. [Google Scholar] [CrossRef]
  35. AASHTO. Manual For Assessing Safety Hardware; American Association of State Highway and Transportation Officials: Washington, DC, USA, 2009. [Google Scholar]
  36. Gabler, H.C.; Gabauer, D.J. Opportunities for reduction of fatalities in vehicle-guardrail collisions. Annu. Proc. Assoc. Adv. Automot. Med. 2007, 51, 31–48. [Google Scholar]
  37. Bryden, J.E.; Fortuniewicz, J.S. Traffic barrier performance related to vehicle size and type. Transp. Res. Rec. 1986, 1065, 69–78. [Google Scholar]
  38. Albuquerque, F.D.B.; Sicking, D.L.; Stolle, S.C. Roadway departure and impact conditions. Transp. Res. Rec. 2010, 2195, 106–114. [Google Scholar] [CrossRef]
  39. Viner, J.G. Harmful events in crashes. Accid. Anal. Prev. 1993, 25, 139–145. [Google Scholar] [CrossRef]
  40. Galati, J.V. Median Barrier Photographic Study; Highway Research Record No. 170; National Research Council, Highway Research Record: Washington, DC, USA, 1967; pp. 70–81. [Google Scholar]
  41. Carlson, R.D.; Allison, J.R.; Bryden, J.E. Performance of Highway Safety Devices; Research Report No. 57; New York Department of Transportation: New York, NY, USA, 1977. [Google Scholar]
Figure 1. Crash Descriptions and Diagrams.
Safety 06 00027 g001
Table 1. Data summary.
VariableCategoryFrequency%
Most harmful object struckTree7713.87
Pole11120.00
Barrier17531.53
Curb7212.97
Others12021.62
Design speed (kph)≤8023842.88
≥10031757.12
Vehicle classLight vehicle50991.71
Heavy vehicle305.41
Motorcycle162.88
RolloverYes20536.94
No35063.06
Seatbelt useYes36966.49
No18633.51
Table 2. Crash Severity Distribution by Most Harmful Object Struck
Most Harmful Object Struck
TreePoleBarrierCurbOthersSub-Totals
#%
Crash SeverityNot Fatal#65931586410448487.21
%84.4283.7890.2988.8986.67
Fatal#1218178167112.79
%15.5816.229.7111.1113.33
Sub-Totals#7711117572120
%13.8720.0031.5312.9721.62
Table 3. Univariate Analysis Results.
Non-Baseline CategoryBaseline Category# Total Observation# Non-Baseline ObservationsOddsp-Value
TreeOthers (No barrier)380771.30.50
Pole1111.40.37
TreeConcrete Barrier239771.20.77
Pole1111.20.68
TreeW-beam Guardrail299772.40.07
Pole1112.50.04
Concrete BarrierW-beam Guardrail162512.00.19
Table 4. Multivariate Analysis Results.
VariableNon-Baseline CategoryBaseline CategoryTotal # Observations# Non-Baseline ObservationsOddsp-ValueGoodness of Fit (p-Value)
Most Harmful Object StruckTreeOther hazards380771.040.920.47
Pole1111.460.28
Design Speed≥100 kph≤80 kph1721.930.03
SeatbeltNoYes1452.210.01
Most Harmful Object StruckTreeW-beam Guardrail299773.10.020.07
Pole1114.70.00
Design Speed≥100 kph≤80 kph1893.30.01
Most Harmful Object StruckTreeConcrete Barrier239771.10.810.24
Pole1111.90.23
Design Speed≥100 kph≤80 kph1183.90.00
Most Harmful Object StruckConcrete BarrierW-beam Guardrail162512.50.120.52
Design Speed≥100 kph≤80 kph1352.00.40
Table 5. Crash Severity Distribution by Barrier Type and Vehicle Containment Outcome.
Barrier Type
W-Beam GuardrailConcrete BarrierSub-Totals
#%
Vehicle ContainmentYesCrash SeverityNot Fatal#62 / 12135 / 6197 / 18293.27 / 91.92
%92.54 / 92.3794.59 / 91.04
Fatal#5/102/67 / 166.73 / 8.08
%7.46 / 7.635.41 / 8.96
Sub-Totals#67 / 13137 / 67
%64.42 / 66.1635.58 / 33.84
NoNot Fatal#41 / 779 / 1450 / 9186.21 / 77.12
%93.18 / 81.9164.29 / 58.33
Fatal#3 / 175 / 108 / 2713.79 / 22.88
%6.82 / 18.0935.71 / 41.67
Sub-Totals#44 / 9414 / 24
%75.86 / 79.6624.14 / 20.34
Grand Totals#111 / 22551 / 91
%68.52 / 71.2031.48 / 28.80
Non-Containment Rate 39.64 / 41.7827.45 / 26.37
Table 6. Multivariate Analysis Results.
VariableNon-Baseline CategoryBaseline CategoryTotal # Observations# Non-Baseline ObservationsOddsp-ValueGoodness of Fit (p-Value)
Most Harmful Object StruckTree/PoleCurbs only, or no fixed object2971881.950.090.39
Design Speed≥100 kph≤80 kph1331.850.08
SeatbeltNoYes1111.760.11
Most Harmful Object StruckTree/PoleNo fixed object2251888.840.040.71
Design Speed≥100 kph≤80 kph1122.850.01
Most Harmful Object StruckBarrierCurbs only, or no fixed object2841752.440.080.53
Design Speed≥100 kph≤80 kph1920.450.11
RolloverYesNo 1444.810.00
Most Harmful Object StruckBarrierNo fixed object2121757.290.060.99
RolloverYesNo1064.150.01

