1. Introduction
One of the global goals of improving the transport system is to increase traffic safety. A particularly vulnerable group of road users in the urban transport network are children, who participate in traffic as pedestrians, cyclists, and passengers in vehicles. According to an investigation by the World Health Organization, the most common cause of death for children aged between 5 and 14 years in Europe is road traffic accidents [
1].
Interactions between pedestrians and vehicles and pedestrian crossing behaviors are influenced by various factors. In a potential pedestrian-vehicle conflict, the reaction times of drivers and pedestrians significantly influence the outcome of such traffic situations.
The reaction time of children is affected by age, gender [
2,
3], control of inhibitors, parental supervision [
4], the complexity of the situation, the distraction of attention [
4,
5], and developmental difficulties, such as hyperactivity [
6]. Numerous studies suggest that children’s development of different cognitive skills, such as attention to the relevant stimuli in traffic situations [
7], selective attention/attention switching [
8], and decision-making, are related to increased pedestrian safety, and those relevant skills improve as children get older [
9,
10,
11,
12]. It is important to emphasize that children of early school age are permanent and independent participants in traffic, and to design a safe traffic environment, it is important to know and consider their capabilities, as well as to understand their needs. One parameter that impacts children’s safety in traffic is the expectation that adults have of children, especially parents. According to the research results, parents have exceedingly high expectations of preschool and early school children (the research covered children under the age of 10) and less than 20% of surveyed parents knew that the cognitive abilities of children in this developmental stage are such that they cannot fully process complex traffic situations and assess the risks [
13,
14].
On the other hand, a large number of different factors influence the behavior of drivers in traffic [
15]. The reaction time of drivers is influenced by the predictability of the situation and of the reaction time necessary to avoid collision [
16], as well as the age, sex and cognitive abilities [
17], distractions, for example due to phone calls and conversations with passengers [
18], lack of sleep, travel distance and driving experience [
19].
The results of the studies shown that pedestrian behaviors are, maybe more than driver behaviors, culturally conditioned [
20,
21]. Modeling of pedestrian movement provides an opportunity to analyze influential parameters and select those parameters that are most influential in local conditions.
A study conducted in Israel [
22] observed child pedestrian behaviors at crosswalks of urban intersections, aiming to characterize their behavior patterns and identify risk factors that may lead to injury. Crossing behaviors of children and adolescents up to age 18, during leisure hours, were video-recorded at 29 crosswalks, on signalized and un-signalized intersections. Multivariate logistic regression models were adjusted to identify factors associated with risky behavior.
To identify the risky parameters of children’s behavior in local urban traffic areas virtual reality techniques are used. In [
23], the efficacy of using virtual reality as an instructional technology to identify and modify risky pedestrian behaviors among Chinese children was investigated.
More recent research has addressed the identification of distractors that influence the hazard perception of current traffic situation in different age groups of pedestrians. The authors of [
24] examined pedestrians’ hazard-perception skills in complex traffic scenes. The results show that simple and usual design of the conflict zone, and less additional environmental content, results in greater attention in the analysis of the current traffic situation. Findings suggested that children and teens may be highly influenced by distraction of attention.
The use of neural networks in traffic safety modeling is not new. The study [
21] proposed an artificial neural network (ANN) technique to develop a pedestrian fatal crash frequency model at the intersection level.
The best results are provided by multidisciplinary measures to increase pedestrian safety, in particular, the pedestrian movement of children, which combine educational measures with traffic regulation and conflict zone design. In the analysis of the effectiveness of the traffic regulation and conflict zone design measures, traffic simulations are applied, as they enable the analysis of a large number of traffic situations and what-if scenarios. A simulation traffic model that simulates vehicle movement and driver behavior at intersections was calibrated for local conditions using a neural network in [
25]. The reaction times of individual categories of pedestrians, as well as the speed of crossing the conflict zone, are input parameters of the model that affect the reality of the modeling results.
In this research, the reaction time of children was measured under controlled conditions, using computer software and in actual traffic conditions at a signalized intersection. The aim of this research was to increase the safety of specific segments of the urban traffic network in close vicinity of schools and kindergartens. The case study was made for a selected intersection with traffic lights in the city of Osijek. The results of current and earlier research point to the need for additional social efforts to improve the traffic environment, considering its most vulnerable participants. The model for predicting the reaction time of children in real traffic conditions was created using a neural network. The methodology of neural network in the formation of prediction models for this research was chosen because neural network provides good interpolation and extrapolation of prediction results when the database does not capture all potential combinations of variables. Another important neural network feature was exploited in this study, which is the ability to gain insight into the impact of each input parameter on the prediction result. This result was as significant for this research as the accuracy of the prediction results, because it allowed the most influential distractors to be identified.
The methodology followed to develop this study was based on two steps: first of all, a laboratory experiment was carried out with a computer test, where both a target (children) and a control (adult) group had to react to an external displayed stimulus; and the second step was the measurement of the reaction time of the same participants in real traffic conditions.
The first step allowed the identification of some parameters influencing the reaction time under controlled conditions, and put the basis for the analysis and selection of the most influential parameters to be set as inputs for the neural network model.
2. Reaction Time Measured in Controlled Conditions
A database of measurement results of the reaction time of the target (child pedestrians) and a control group (adult drivers) under controlled conditions was created.
2.1. Methodology
The target group consisted of kindergarten and elementary school children, and the control group consisted of drivers from the city of Osijek. The database contained measurement results of 448 target group respondents (four groups of 112 measurements each) and 112 control group examinees. The reaction time was measured in controlled conditions, using the online human benchmark reaction time test (
http://www.humanbenchmark.com/tests/reactiontime) on all participants, and additional data were gathered through a survey filled by the target and the control group. Data collection under laboratory conditions was made within the framework of the project of the Croatian Science Foundation Problems in the Behavior of School-aged Children: The Role of Executive Functions, Individual, Family and Genetic Factors-ECLAT, project leader Asoc.prof. Silvija Ručević, HRZZ-IP-2016-06-3917. The approval of the Ethics Committee of the Josip Juraj Strossmayer University of Osijek, Faculty of Humanities and Social Sciences, to collect data and measure different indicators of children’s executive behavior, dated 11-04-2017 (reference number: 1/4/2017i) is attached in the
Supplementary Materials within the Data File Children reaction time document. This research did not engage other project resources, except for the availability of the target group for the research.
The target group was divided into four subgroups—preschoolers (children from 6 to 7 years old), first class (children from 7 to 8 years old), second class (children from 8 to 9 years old), and third class (children from 9 to 10 years old) children. In this phase of the research, the working hypothesis was that the reaction times of each target group was longer than the reaction times of the control group, even in the conditions of expected stimuli. To each respondent, it was explained what would be measured, how they should respond (press the mouse button when a red color appears on the screen), and each of them had the opportunity to try the test first, without recording the results. The reaction time was measured in milliseconds and the mean reaction time of five consecutive measurements for each respondent was registered.
2.2. Results
Descriptive statistics of each group of measured data are presented in
Table 1 and
Figure 1.
The normality of the data measured for each group was tested by performing the Anderson-Darling test. The Null hypothesis of the test is that data follow a normal distribution and a significance level of 0.05 was set. The probability plot for each group of respondents is shown in
Figure 2.
According to the results of each group shown in
Figure 2 and
Table 2, the null hypothesis cannot be rejected (
p-value > 0.05) and it can be concluded that data follow normal distribution for each group of respondents.
The difference between the results obtained by measurement of the control group and by each one of the four children’s subgroups was analyzed using the test for two variances. The F-test was accurate for normally distributed data. The null hypothesis was σ(control group)/σ(subgroup of children) = 1, the alternative hypothesis was σ(control group)/σ(subgroup of children) ≠ 1 and a significance level of α = 0.05 was determined. The results are shown in
Table 3.
The null hypothesis states that the ratio of the reaction time’s standard deviations between the control group and subgroups of children (each of them) will be 1. Because all p-values were smaller than the significance level of 0.05, the null hypothesis can be rejected and it can be concluded that the standard deviations of the reaction times between the control group (drivers, adults) and each subgroup of children are different.
The same methodology was applied in analyzing the difference in reaction time among different subgroups of children (
Table 4). This analysis provides a basic insight into the impact of cognitive development on the reaction time of children in a situation of expected stimuli.
Since p-values were greater than the significance level of 0.05, the null hypothesis cannot be rejected and, consequently, it cannot be stated that the standard deviations of the reaction times between first class and second class, and second and third class, were different. On the contrary, the null hypothesis can be rejected in the case of preschoolers and first class children and the comparison between first and third class, highlighting that the standard deviations of these groups were different. The results suggest that the largest developmental jump occurs between preschool children and first-grade children. These are the only neighboring development groups in the whole target population which show a significant difference in standard deviations.
Any small deviation from normal distribution can cause the F-test to be inaccurate, even with large samples. For this reason, the data were also analyzed by applying Bonett’s test and Levene’s test, which confirmed the results provided by the F-test.
3. Reaction Time Measured in Real Traffic Conditions
In the framework of this research, the variables affecting the reaction time of children at the intersection have been specifically analyzed, and the parameters affecting the children’s crossing speed in the conflict zone were explored in particular. The initial choice of variables for this research was made based on the experience of previous research and modeling of pedestrian behavior in real traffic conditions.
Analysis of different models for pedestrian crossing behaviors was performed within the study [
26]. A summary overview of the influential variables is presented to the context of the stimuli and responses. The stimulus variables were divided into experimental and contextual ones, and the responses were considered in the context of microsimulation and macrosimulation indicators. Contextual variables include age, grouping behavior and gender of pedestrians. The authors of [
3] present findings of a simulator study that examined the differences of reaction time for children aged from 3 to 18 years. The results obtained have been statistically analyzed using analysis of variance (ANOVA). Post hoc tests showed differences or similarities between selected age groups.
In the study described in [
27], the researchers used observation data of 123 adult-child pairs as they crossed the road at pedestrian light-controlled crossings. Eight types of behavior were observed, including whether or not the pair stopped at the curb, waited for the light to change, and checked to ensure traffic flow had stopped, oral instructions from adult to child, holding hands during the crossing, and so on. As part of the study described in [
28] observations were made of 269 children between the ages of 7 and 11 at three crosswalks near an elementary school. 185 of these children crossed the crosswalk without an accompanying adult, and 74 were accompanied by an adult. The results of both studies show that parental supervision influences the behavior of children in traffic.
Some studies have reported use of pedestrian simulators to study behavior of subjects (especially young adults) crossing the street with potential distraction due to multimedia devices. In one study [
5] the participant group consisted of 138 college students were randomly assigned to three distinct groups with distraction: talking on phone, texting, and listening, with a fourth control group without any of these distractions. It was observed that the groups with distractions had a prolonged reaction time, as well as the time required to complete the crossing maneuver, slower detecting arrival of the next vehicle in the crosswalk, reduced left/right observation and looking away, and missed crossing opportunities.
Pedestrian behavior was influenced, and generally considerably riskier, when participants were simultaneously using mobile internet and crossing the street than when crossing the street with no distraction [
29].
In one study [
30], the impact of cognitive and perceptual development on pedestrian behavior of children was analyzed and discussed. The roles of distraction, temperament and personality, and social influences from parents and peers are presented.
The research results of the study described in [
31] show that children with a range of physical, mental, sensory, or self-care disabilities were more likely than children without disabilities to have experienced a pedestrian injury.
The primary objective of the in-situ research was to collect data about the behavior and reaction time of children in actual traffic conditions, when children are influenced by the usual distractors in a familiar environment. A database of the measured reaction times of children aged 5 to 16 years at a selected signalized intersection set on the urban arterial road was created. The intersection observed is located near two primary schools and one kindergarten. The signalized intersection is traditionally considered as a pedestrian-friendly traffic solution because it does not require a detailed assessment of the traffic situation and was selected for the first phase of the study of traffic behavior of children.
3.1. Methodology
The data were collected with a video camera over one week. Reaction time has been defined as the time needed for pedestrians to start the movement, after the appearance of the green light. Data are measured in the tenth of seconds rather than in milliseconds, because of the normal capabilities of the human operator looking at the footage, and this has an impact on data distribution, which has been considered in further analysis. A database of 192 measurements of children’s reaction times in actual traffic conditions was created.
Based on previous experience and technical judgment of the situation, seven independent variables (
Table 5) affecting the reaction time of children in traffic were selected. A basic statistical analysis was performed to identify which independent variables have no significant effect on the observed dependent variable (reaction time measured in situ). The age group input parameter was formed in such a way that each respondent with a measured reaction time was classified into one of the seven categories, as follows:
Considering that the measured data do not follow a normal distribution (data was tested by performing the Anderson-Darling test), the input parameters selected (
Table 5) were statistically analyzed by applying the nonparametric Kruskal–Wallis test. The Kruskal–Wallis test is based on the verification of the null hypothesis. All means were equal based on the Kruskal–Wallis test and a significance level α = 0.05 was set. The results of the analysis are shown in
Table 5.
According to the results in
Table 5, the input parameters which show the greatest influence on the measured reaction time were distraction caused by movement in the group and by the use of mobile phones occupying visual attention. Adult supervision was not recognized as an important input parameter. It has to be taken into account that only six instances of this situation were recorded in the entire database. It is known from experience and the literature [
27,
28] that the influence of this parameter is not insignificant, and it will be addressed in further research. All of the parameters listed in
Table 5 were used as input parameters in creating the prediction model of the reaction time for children using a neural network.
3.2. Reaction Time Prediction Model
Neural networks are a frequently used tool in different areas of scientific and professional activity. The abilities to receive stimuli, process it through an activation function, and transmit (or transfer) the output signal to other neurons, makes a complex communication network in many ways similar to a biological nervous system. The connection between an input and output layer with no hidden layers makes a linear mapping model. Complex, nonlinear mapping between an input and output layer, such as in the problem under consideration, requires a certain number of hidden layers. Neural network architecture determines the connection between neurons in layers and between layers and fundamentally affects network behavior in the learning and generalization process. The activation function (transformation function) defines the relationship between the input and output signal of each network neuron. Processing of an input neuron signal through the activation function gives an output result for each neuron. However, each neural output in the network communication system between neurons has its own weight coefficient (that is, ranking of information importance). Network training is a nonlinear minimization problem which iteratively changes weight coefficients of neurons in order to reduce discrepancies between desired and obtained values in output network results.
The database of 192 measured reaction times in actual traffic conditions was used to define and train the neural network. The total database was divided into two sets, 80% of the data was used for training and 20% of the data was utilized for testing. More than 12 neural network types were tested in NeuroShell2 software, with a different number of hidden layers and a different number of neurons in hidden layers, and the best results that each network gave when applied to the test dataset were memorized.
Within the neural networks analyzed (Ward nets, Standard nets, Jump connection nets) the best response was given by the back propagation–Ward net with three hidden layers, and the features are shown in
Figure 3 and
Table 6.
The learning process for the back-propagation network type is described in this section. In each iteration, the weight coefficient of each neuron was modified according to desired values of the final prediction result from the training dataset. Each neuron’s error was calculated by use of weight coefficients from the total network error (discrepancy between achieved and expected prediction results). Modification of weight coefficients was based on derivatives of the activation function, and a detailed explanation of these mathematical procedures is given in [
32]. The coefficient of network learning speed, or step iteration (η) is introduced into the process of weight coefficient correction. Empirically, [
32] when the selected value of a learning speed coefficient is too big, it can destabilize the network learning process, and when it is small, the learning process slowly converges.
3.3. Results
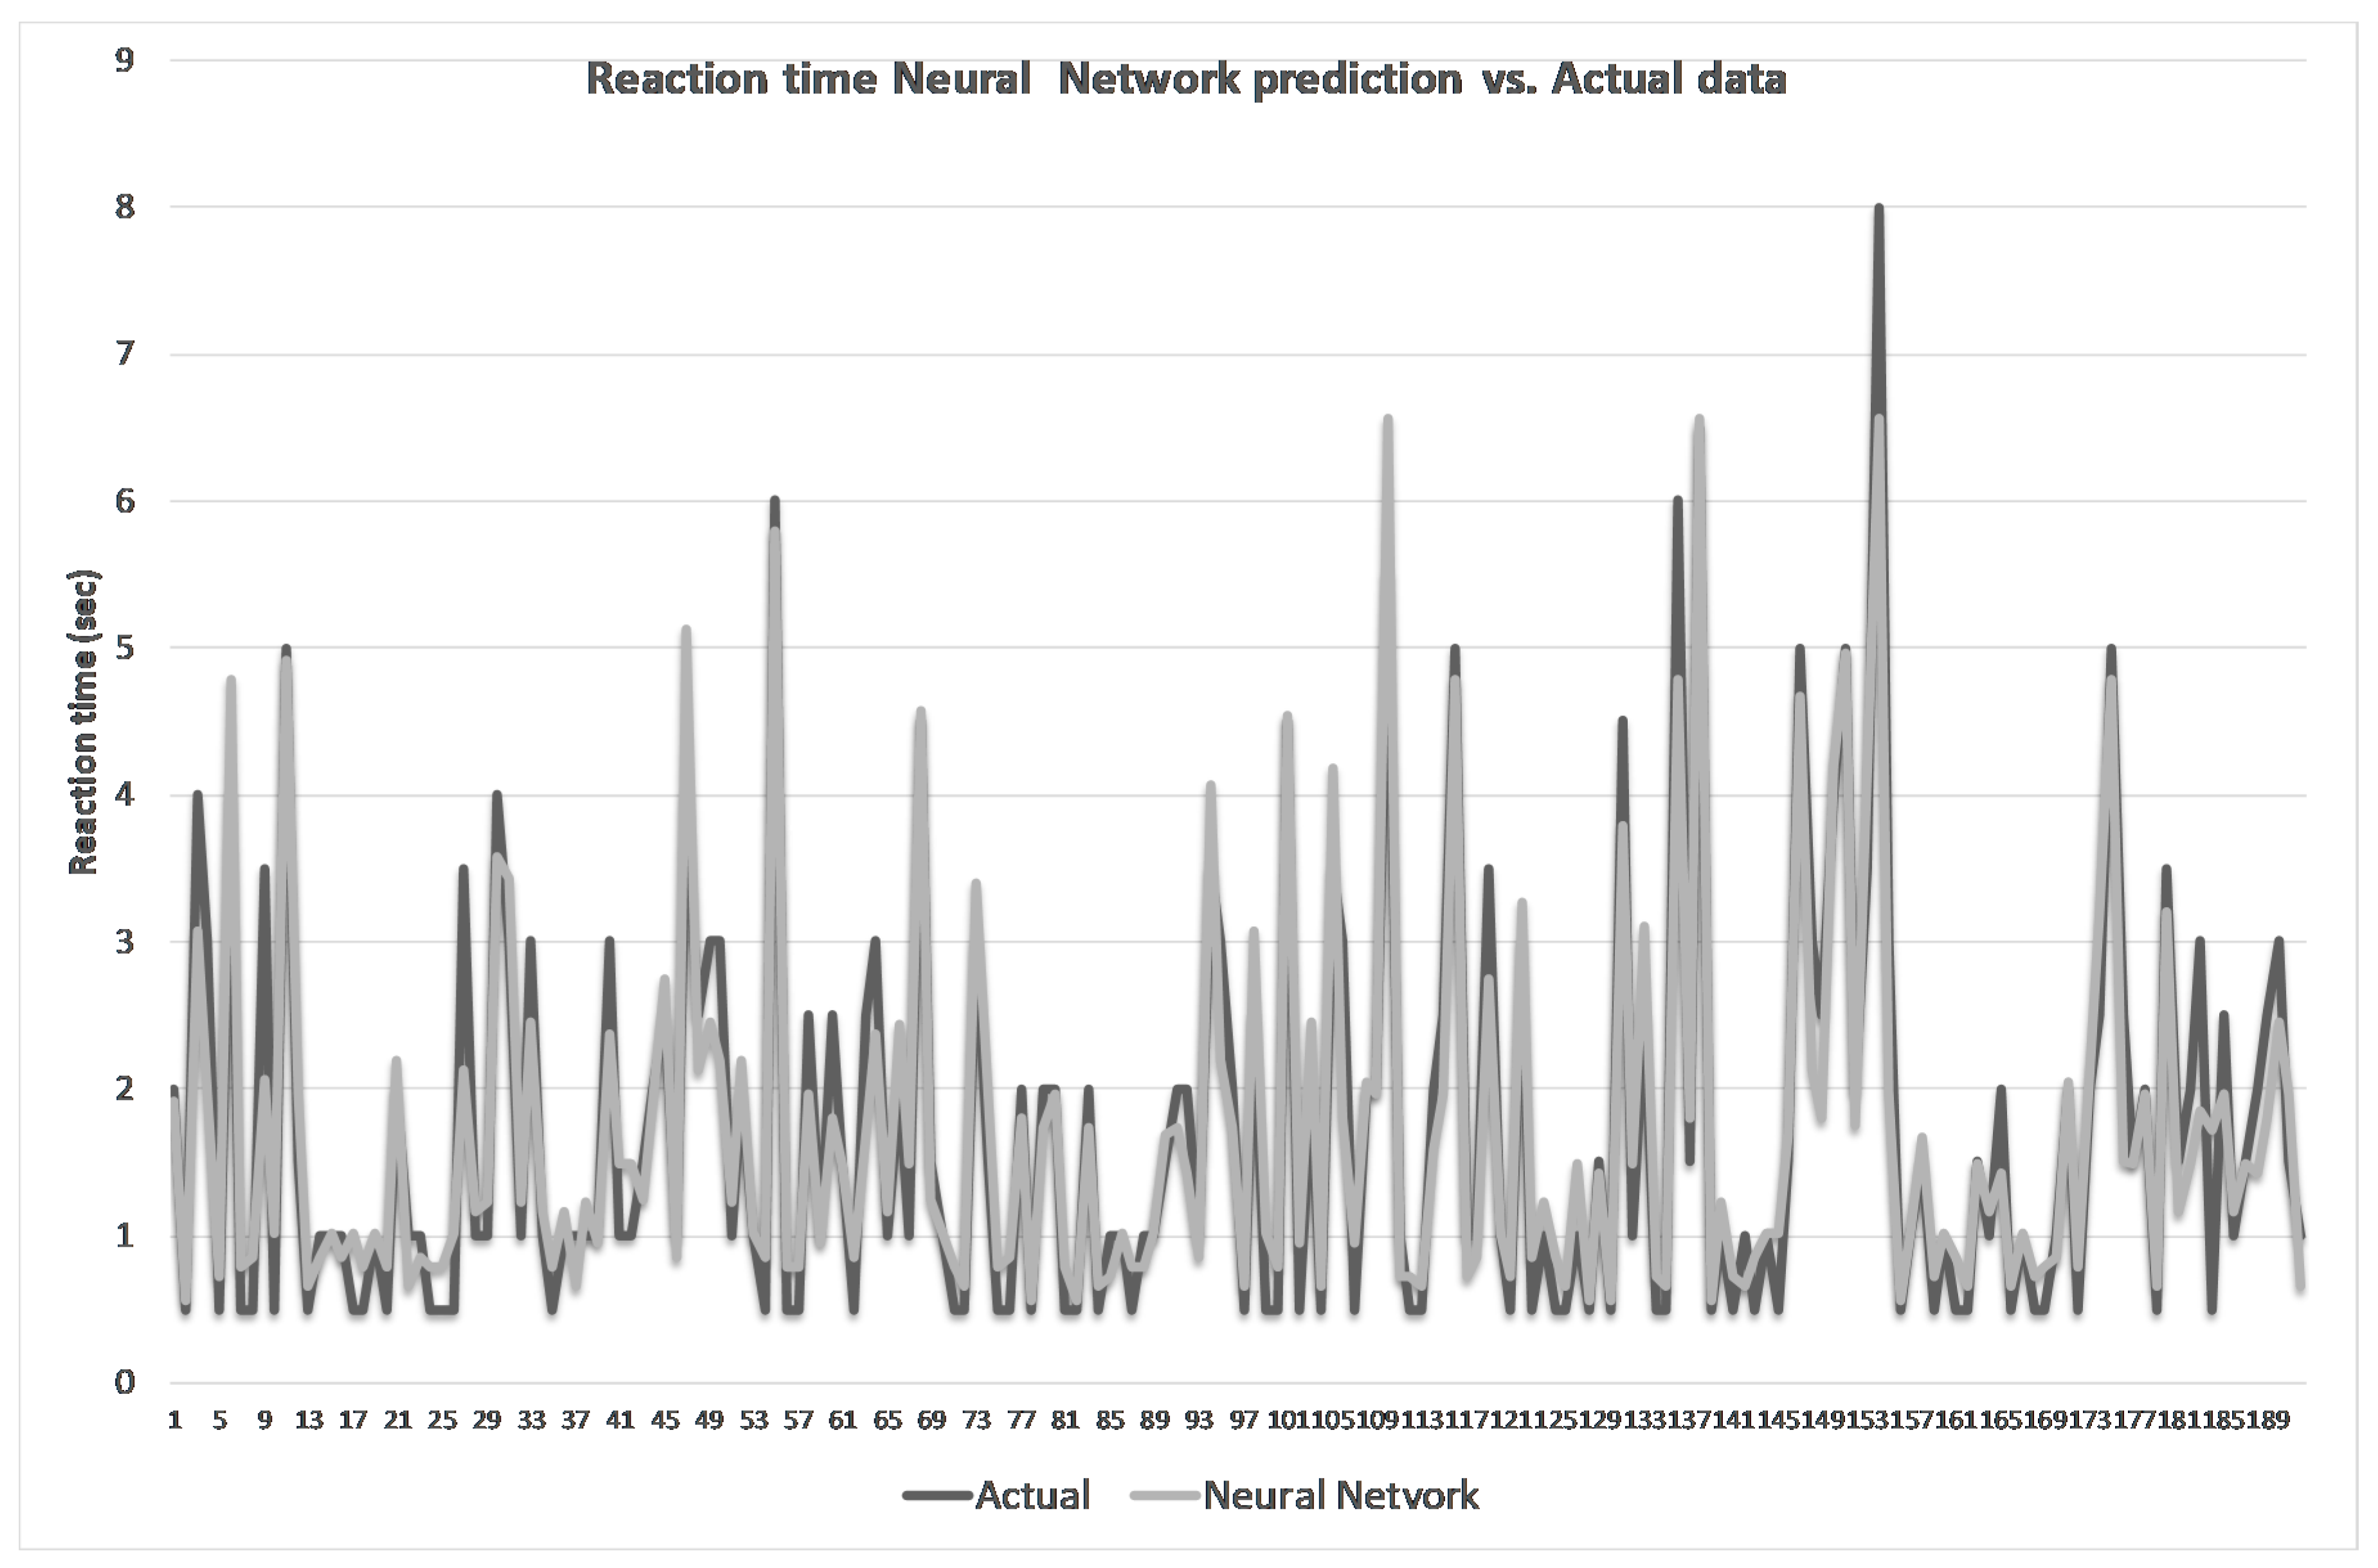
The prediction model provided by the back propagation–Ward net neural network gave the following prediction results: the correlation coefficient is 94.56%; the mean absolute error of prediction is 0.348 s; the minimum absolute error of prediction is 0.013 s; and the maximum absolute error of prediction is 1.441 s. A comparison of the measured reaction time of children and the prediction given by the model is shown in
Figure 4.
The successful prediction of the reaction times of children provided by the model is a good basis to have an insight into the impact of each input parameter on the prediction results. The influence of each input parameter on the prediction results, as recognized by the neural network, is shown in percentages in
Figure 5.
The biggest distractors, according to model results, are the movement of children in the group, followed by the impact of mobile phones and motion disabilities. Children with motion disabilities, visible on the videos, did not have a delayed reaction time, but needed extra time to start moving. According to the prediction model results, the gender of the respondents had the lowest influence. It is worth noticing that the results presented in
Figure 5 are comparable to those obtained by the statistical Kruskal–Wallis test (see
Table 5), in particular in the identification of the most influential parameters.
3.4. Model Validation
A prerequisite to use prediction models on new input data is the generalization ability of the neural network. In the neural network learning process, network overtraining can occur, which is when the model produces good results on the training dataset but poor prediction results for new data. The best insight into the generalization ability is obtained by independent validation of the model on new input data.
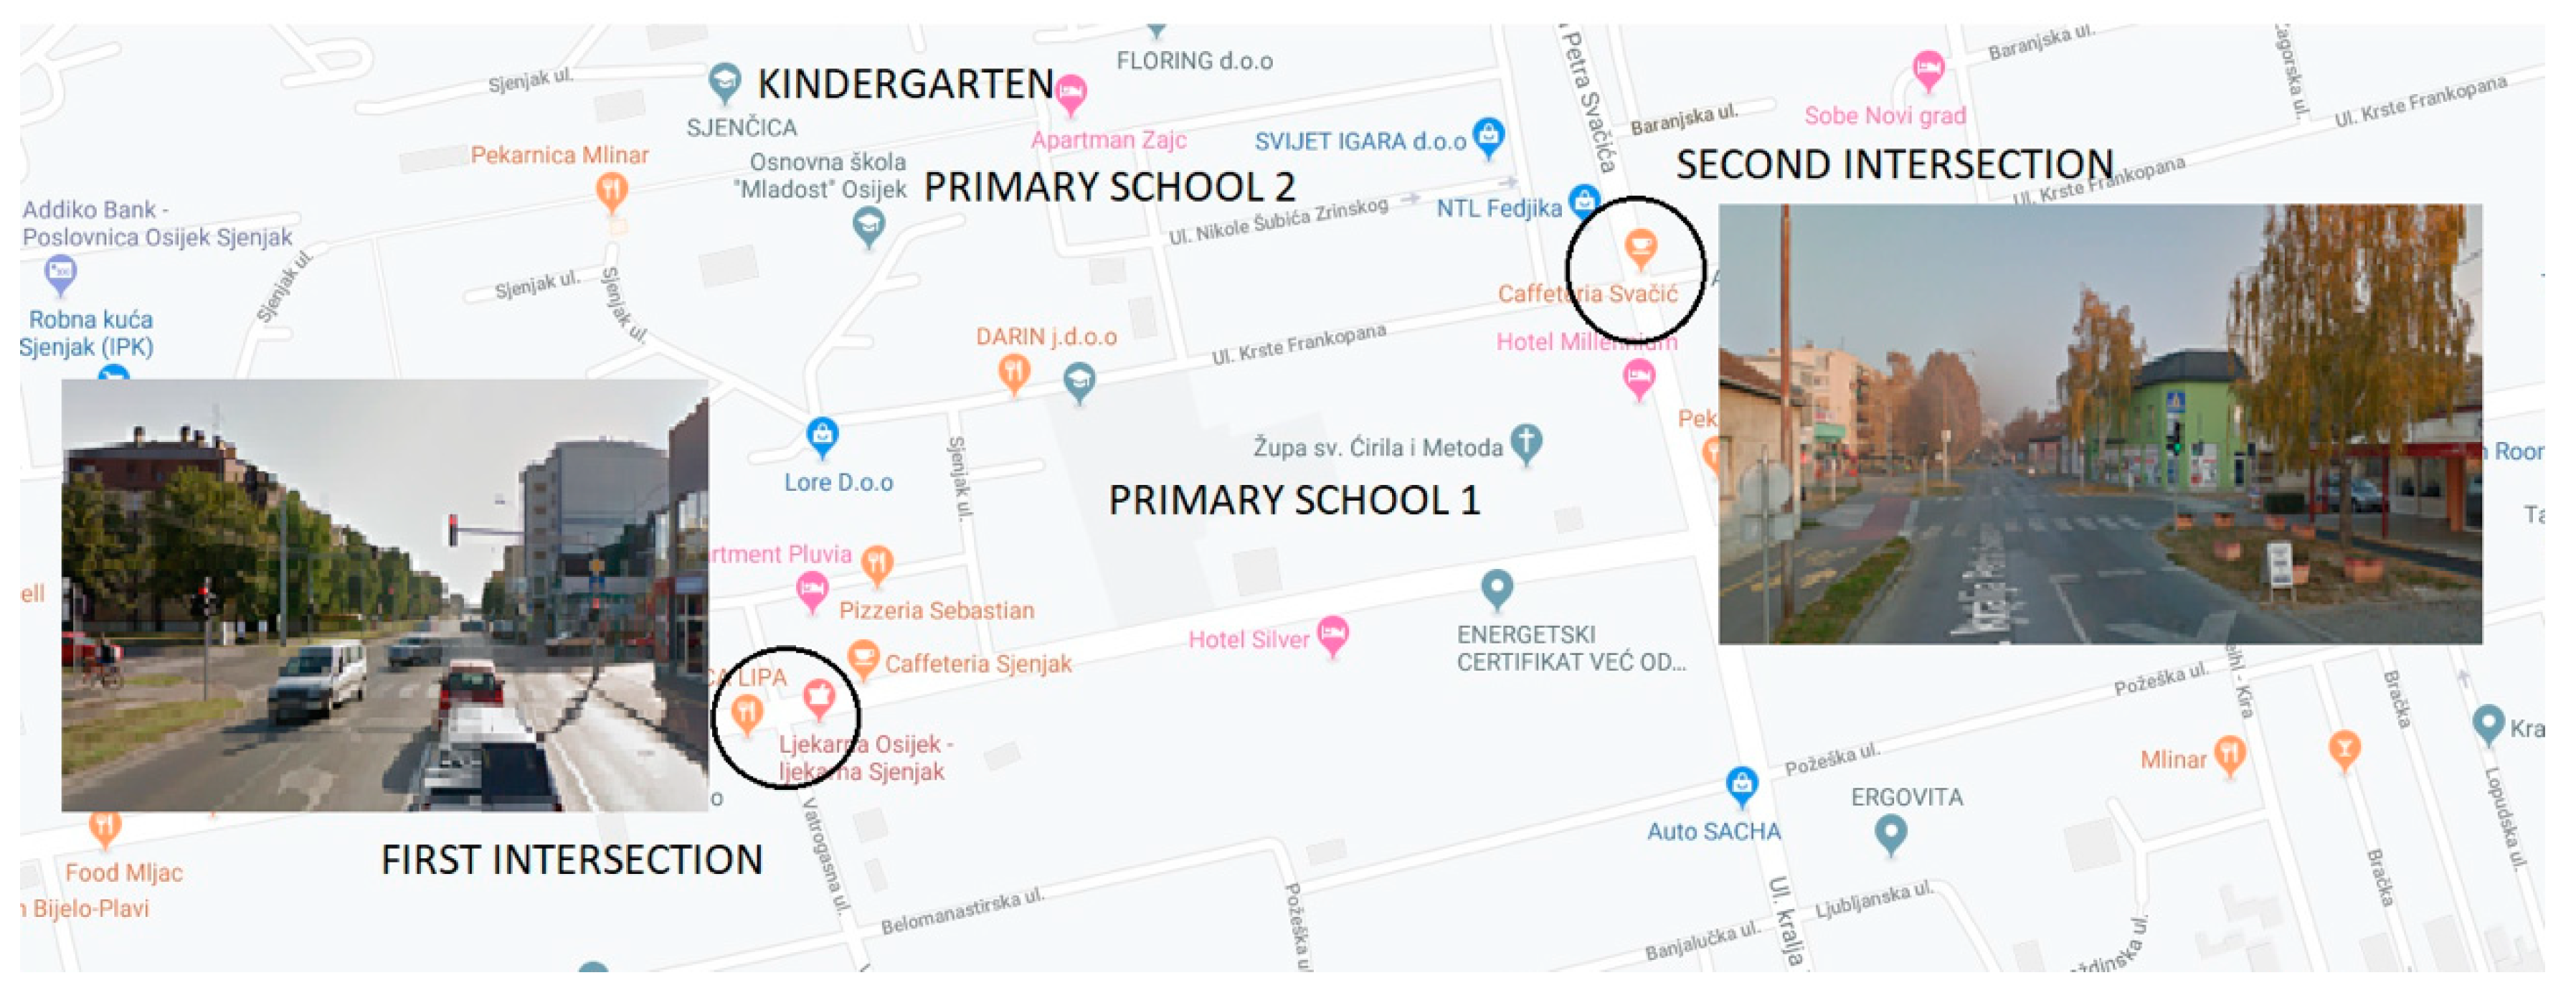
Independent validation of the model was performed on a new database (which had not been previously presented to the Neural Network neither in the training set nor in the test set) consisting of 45 points of measured data (15 measurements at the first intersection, 30 measurements at a second location) of the reaction time of children at two different signalized intersections. The prediction model was developed for the first signalized intersection. The second one was selected on the east side of the observed network segment, on the way to a school (
Figure 6). The prediction of the reaction time of children for the second signalized intersection gives a basic insight into the applicability of the model to the same type of intersection.
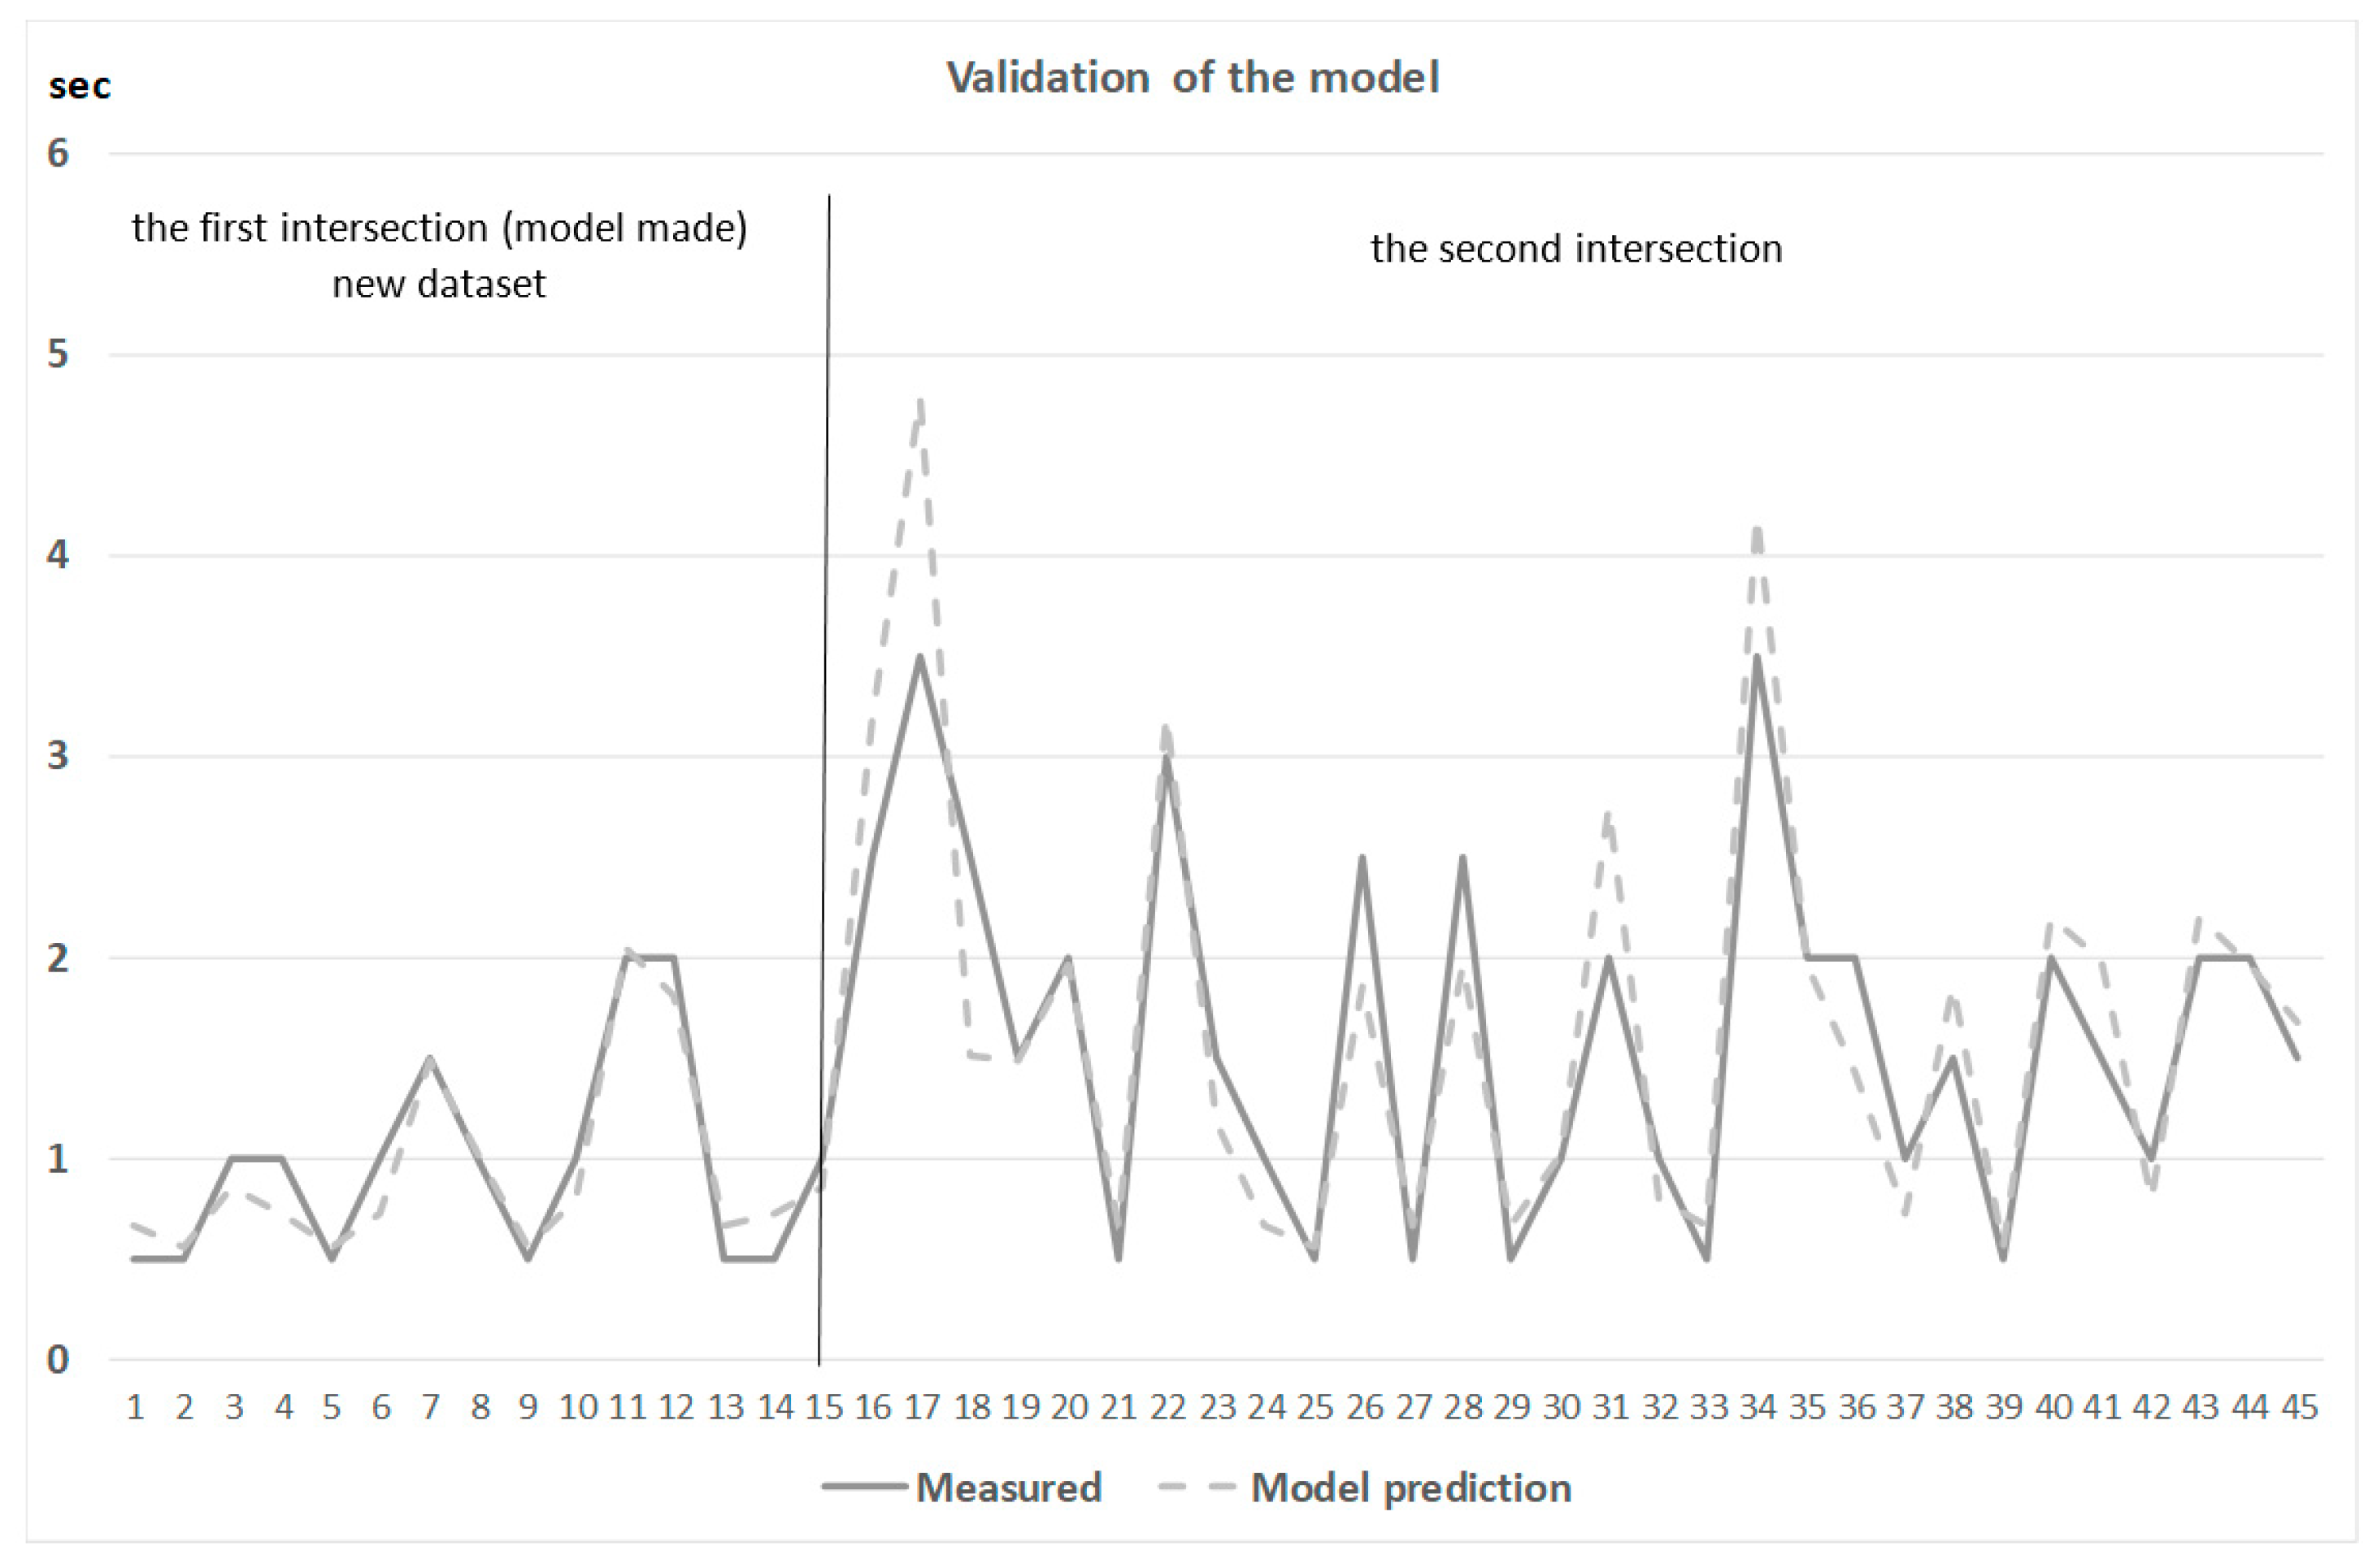
The results of model validation on a new database measured in situ are shown in
Figure 7.
The results of the independent validation of the model were: the correlation coefficient was 92.29%; the mean absolute error of prediction was 0.268 s; the minimum absolute error of prediction was 0.013 s; and the maximum absolute error of prediction is 1.279 sec.
The results clearly show that the prediction model also performs well on an independent database with new measured data at two different intersections.
4. Discussion
Increasing traffic safety, as a general goal of every urban environment, has different aspects, and one of them is to increase the safety of children, who are, according to the statistics of road accident victims, vulnerable road users. Early-school-age children are permanent and mostly independent pedestrians in Croatia, while kindergarten children are most often accompanied by an adult, or are driven by a car. Understanding the cognitive capabilities and needs of children in traffic are a prerequisite for creating a traffic environment that will be designed to serve the needs of this particular group of traffic participants, in the areas of schools and kindergartens. This case study of children’s behavior was made in two phases for the selected segment of the urban transport network of the City of Osijek.
The first phase was to measure the reaction time of children and adults on a computer using an online test to measure the reaction time to expected stimuli. The measured reaction time of the target group of children aged 6 to 10 years was divided by age into four subgroups (database of 448 measurements) and adults (database of 112 measurements). The conclusions of this phase of research and statistical analysis (F-test for two variances) were:
standard deviations of the reaction times between the control group (drivers, adults) and each subgroup of children were significantly different
the difference between standard deviations of the reaction times of first class and second class and second class and third class did not prove significant
the standard deviations of the reaction times between preschoolers and first class and first class and third class, were significantly different.
Reaction times of each target group of children were longer than the reaction times of the control group, which confirms the hypothesis of the first phase of the research. The longer reaction time in the conditions of the expected stimulus confirms the impact of cognitive development on the processing of the traffic situation, as numerous studies have shown [
9,
10,
11,
12,
17,
22,
34]. The study described in [
22] pointed out that child pedestrians up to 9 years of age cannot make quick and efficient decisions in traffic situations, because their cognitive capabilities are not yet developed enough. The results of reaction time measurements clearly show that the effective increase of pedestrian safety of children cannot be achieved by educational measures only, but it is necessary to improve the traffic environment to meet the needs of vulnerable users.
Research shows that the reaction time of children is affected by age, gender [
2,
3], control of inhibitors, parental supervision [
4], complexity of the situation, and distraction of attention [
4,
5]. The second phase of the study measured the reaction time of children in actual traffic conditions, where children are influenced by the common distractors of attention in the environment that they move around on a daily basis. A database of 192 measurements of the reaction time of children aged 5 to 16 years at the intersection with traffic lights was made. Seven independent variables were selected that influence the reaction time of children in actual traffic conditions, and a model of the prediction of the reaction time was made using a neural network. Comparison of the results of the prediction model with the measured data gives:
Independent model validation was performed on a new set of measured data at the same intersection (15 measurements) and at a new intersection with traffic lights (30 measurements). The validation was made to test the generalization of the neural network and to give some basic insights into the applicability of the model, not only at the intersection observed, but at a particular type of intersection. The results obtained by model validation were:
The model of predicting the reaction time of children has two practical applications—it gives an insight into the reaction time of a dominant group of pedestrians in school areas, which is an important input parameter for traffic regulation (duration of green light, beeps, additional light warnings etc.). Another practical application is the identification of key distractors and the influential parameters that need to be analyzed in the prevention of traffic risk and in the education of the target group. The neural network and statistical analysis identified the same key distractors:
The aim of this research was to obtain relevant inputs to design the conflict zone between vulnerable (children) and motorized road users, which will provide a safer environment for children as traffic participants, respecting their physical characteristics, cognitive abilities, and behavioral habits. Identifying attention distractors, such as using a cell phone, provides a good basis for analyzing the installation of attention switching devices, such as sound signals, installation of led lights in the curb and conflict zone that will be green while the green signal for pedestrians’ lasts, as well as the use of other intelligent transport technologies, e.g., holograms on intersections.
The first step that will be taken in the near future to improve the results of this research is the one-to-one connection of laboratory experiments to the on-field measurements, where the linkage of the laboratory reaction time of a single participant with the one measured in the field and belonging to the same individual is intended. In further research, the study will focus on the analysis of parameters affecting children’s crossing speed and, consequently on the time they spend within the conflict zone. This additional study will permit an overall view of the whole critical process of children’s road crossing action. Parallel analyses will be carried out in several different urban areas to identify parameters which are significant and applicable not only at a local level, but also at a wider level. Further steps of this research will be the collection of data about children’s behavior at other intersection typologies. The analysis and evaluation of the various measures to increase the pedestrian safety of children, at specific locations, will be performed using microsimulation tools.


