Article

Visual Flight into Instrument Meteorological Condition: A Post Accident Analysis

1
School of Engineering, RMIT University, Melbourne 3000, Australia
2
School of Engineering, Edith Cowan University, Joondalup 6027, Australia
3
School of Engineering and Information Technology, University of New South Wales Canberra, Canberra 2612, Australia
*
Author to whom correspondence should be addressed.
Safety 2020, 6(2), 19; https://doi.org/10.3390/safety6020019
Submission received: 7 February 2020 / Revised: 6 April 2020 / Accepted: 7 April 2020 / Published: 9 April 2020

Abstract

:
The phenomenon of encountering instrument meteorological conditions (IMCs) while operating an aircraft under visual flight rules (VFRs) remains a primary area of concern. Studies have established that pilots operating under VFRs that continue to operate under IMCs remains a significant cause of accidents in general aviation (GA), resulting in hundreds of fatalities. This research used the Australian Transport Safety Bureau (ATSB) database, which contained a total of 196 VFR to IMC occurrences, from 2003 to 2019, with 26 having formal reports. An explanatory design was adopted, commencing with a qualitative study of the 26 occurrences with reports followed by a quantitative study of all 196 occurrences. Factors investigated included the locations and date of the occurrences, involved aircraft (manufacturer, model, type), pilot details (licenses, ratings, h, and medical), number of fatalities, and causal factors. Fisher’s exact tests were used to highlight significant relationships. Results showed occurrences were more likely to end fatally if (1) they involved private operations, (2) pilots only had a night VFR rating, (3) the pilot chose to push on into IMCs, (4) the pilot did not undertake proper preflight planning consulting aviation weather services, and (5) the pilot had more than 500 h of flight experience. Further results showed occurrences were less likely to end fatally if the meteorological condition was clouds without precipitation, if the pilot held a full instrument rating, or the pilot was assisted via radio. Analysis of the data using the Human Factors Analysis and Classification System (HFACS) framework revealed that errors and violations occur with slightly greater frequency for fatal occurrences than non-fatal occurrences. Quantitative analyses demonstrated that the number of VFR to IMC occurrences have not decreased even though initiatives have been implemented in an attempt to address the issue.

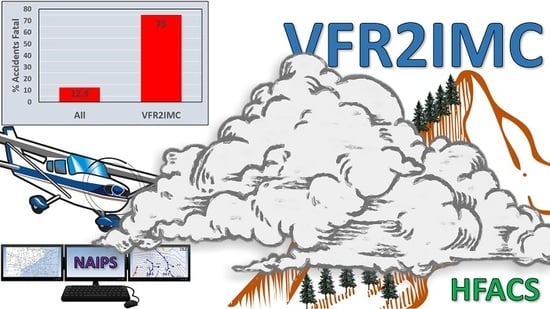
Graphical Abstract

1. Introduction

Meteorological conditions that are hazardous for GA include phenomena such as turbulence, lightening, wind shear, and icing. Clouds reduce visibility and make navigational awareness difficult. This can lead to misinterpretation of aircraft positions [1] and possible controlled flight into terrain (CFIT) accidents as well as disorientation and possible departure from controlled flight. Pilots perform numerous weather-related tasks both before and during flight so as to avoid weather hazards. Flight planning involves interpreting weather forecasts and weather information and integrating them into flight decisions [2]. However, despite the fundamental nature of these activities, weather-related GA accidents remain significant, with high fatality rates.
GA pilots flying into instrument meteorological conditions (IMCs) whilst operating under visual flight rules (VFRs) and being restrained to visual meteorological conditions (VMCs) remains a leading and continuing cause of accidents [3]. According to the Aircraft Owners and Pilots Association [4], this is “one of the most consistently lethal mistakes in all of aviation” with 86% of occurrences resulting in fatalities. The United States National Transportation Safety Board (NTSB) estimates that of the GA accidents that occur in IMCs, two-thirds will be fatal. This is far higher than the overall rate for GA accidents [5], including fatalities from mid-air collisions, wire strikes, or pilot incapacitation [4].
When pilots continue with a VFR flight into IMCs (VFR2IMC), they can experience spatial disorientation and may lose control of the aircraft, which can lead to an unrecoverable flight attitude or in-flight structural failures [6]. Although there are varying estimations in the literature, most researchers have established that 60–80% of GA accidents are attributable, in some part, to human errors [7]. From NASA’s voluntary reporting system (ASRS) 70% of reported incidents are said to have been caused by “human error” and “pilot error” [8]. The role human factors play in safety occurrences can be analyzed using the Human Factors Analysis and Classification System (HFACS). HFACS was adopted by the Federal Aviation Authority (FAA) in 1998 as a human error taxonomy for identifying accident and incident causal factors attributed to humans in aviation and other high-risk industries [9]. HFACS, originally developed for military aviation, has 19 causal categories; however, most GA accidents are analyzed only using the lower two tiers of HFACS (unsafe acts of Operations and Preconditions for Unsafe Acts) which includes ten causal categories. These are skill-based errors, decision errors, perceptual errors, violations, adverse mental states, physical/mental limitations, crew resource management, personal readiness, and technological environment. Of these, the unsafe acts include skill-based errors (clearance, altitude/clearance, aircraft control), decision errors (VFR2IMC, in-flight planning, weather decision), perceptual error (aircraft control, altitude, descent), and violations (VFR2IMC) are the most relevant to VFR2IMC safety occurrences [9].
This research utilized a total of 196 safety occurrences for the quantitative study, with 26 of these having official reports for use in the qualitative study. The safety occurrences covered a period from 2003 to 2019 from the Australian Transport Safety Bureau (ATSB) to examine the factors associated with VFR2IMC occurrences. The reports were subjected to qualitative and ex post facto quantitative analysis to demonstrate the causal factors behind occurrences in addition to the application of the HFACS framework to isolate the human factors. For the quantitative study, the features of the 196 occurrences were analyzed to find statistically significant features in the dataset. The primary research question for this work is, “how do weather, aircraft, pilot, and operational factors contribute to Australian VFR2IMC occurrences?”. The secondary research question for this work is, “how do the distributions of contributing factors in Australian VFR2IMC occurrences differ to those expected?”. The key hypotheses posed initially are (1) that pilot experience should reduce the likelihood of experiencing VFR2IMC, (2) student pilots involved in solo training exercises are more likely to encounter VFR2IMC, and (3) the type of GA aircraft should have no influence on the likelihood of experiencing VFR2IMC.

2. Literature Review

2.1. Weather and Transport Accidents

Weather is a safety consideration across all transportation. Most people will have experience weather while driving and are inherently aware that it influences their performance and decision making, which has been studied objectively [10]. The sensitivity to weather effects is amplified in trucks because of their larger size and higher center of gravity [11]. When looking at train accidents in the United States, it was found that 1% of derailments from 2001 to 2010, 43, were the result of weather alone [12]. There are a number of weather factors that affect railway safety (temperature, ice, fog, wind, and precipitation) across a number of operational aspects (equipment, maintenance, train movements, and management) [13]. Similarly, for shipping accidents, “4.33% of accidents occurred under adverse weather conditions” [14]. Other work on maritime accidents in adverse weather conditions has investigated the influence on the type of shipping operation, the type of accident, and the location of the accidents [15]. In aviation, weather is responsible for accidents and incidents across the industry, which result from turbulence, downdrafts, wind shear, precipitation, icing, reduced visibility, and low ceiling, amongst others [16].

2.2. VFRs into IMCs

An analysis of the NTSB aviation accidents database over the 1990–1997 period showed that 2.5% of the reviewed 14,000 accidents involved VFR2IMC. These contributed to 11% of fatalities in that period. Other accidents from GA not involving VFR2IMC accounted for 18% of the fatality rate as compared to 75% of all the VFR2IMC accidents being fatal, indicating higher levels of fatalities in VFR2IMC accidents compared to other accident types [17]. The 24th Nall Report analyzed 50 weather-related accidents and found that 46% involved VFR2IMC, and 95% of these VFR2IMC accidents resulted in fatalities [18]. Studies performed in Canada, from 1975 to 1985, showed that VFR2IMC accidents accounted for 6% of all accidents [19] but 26% of all fatalities, while an analysis of 491 accidents from the ATSB database between 1976 and 2003 showed that 75.6% of VFR2IMC accidents were fatal [20].
In 2001, Goh and Wiegman observed that the pilots who continued with flight into IMCs had higher ratings of skill and judgment, indicating a self-perception of higher confidence in their aptitude to fly the aircraft even in adverse weather conditions [17]. Despite the high level of confidence, these pilots made errors early in the decision-making process, particularly inaccurate assessments of visibility. The researchers classified the factors contributing to VFR2IMC as situation assessment, risk perception, and decision framing.
Accidents caused by pilots who continue a VFR flight into adverse weather conditions have been linked to errors in assessing the situation, as such, the continued flight into IMCs is due to the inaccurate assessment of the hazard [3]. Of the accidents analyzed, 22% were caused by human errors due to diagnostic errors, and these accidents were more serious than those caused by aircraft-handling errors. Inaccurate situational assessment can be associated with a lack of experience in the interpretation of changing weather conditions, the pilot being unable to recognize the gradual transitions of deteriorating weather conditions from minimum VFRs to marginal VFRs and then worsening to IMCs. This inexperience makes it difficult to discriminate weather conditions and also contributes to poor hazard awareness [21]. These can be exacerbated by tiredness, fatigue, and workload. On the other hand, a pilot’s risk perception may predispose them to continue a VFR2IMC. This occurs when pilots make an accurate assessment of the hazard situation but continues flight into adverse weather conditions due to overconfidence in their ability and unrealistic optimism about being able to control the aircraft and avoid personal harm [17]. Studies have shown that pilots who have gone through advanced training may exhibit excessive optimism, reluctance to admit limited capability, and poor appreciation of hazards [22].
Goh and Wiegman also identified motivational factors [17], where even though pilots had diagnosed the situation and the level of risk accurately, they continued VFR2IMC, driven by motivational factors. Finally, with regard to decision framing and based on prospect theory [23], a pilot may choose between a high-risk and low-risk course of action depending on their framing of whether the decision will lead to gain or loss. Therefore, continuing into deteriorating weather conditions may be based on the framing that diverting the flight may lead to a loss in time, money, or effort. If the decision to divert is framed as safe, the pilot may discontinue the VFR2IMC.
Noting the lack of qualitative studies and the dominance of quantitative and mixed-method approaches in examining the causal factors behind general aviation accidents, Gallo et al. used a phenomenological approach to describe the experiences of 11 male pilots who had previously flown VFR2IMC during their career and then used grounded theory in developing conjectures from the participants’ responses [21]. The findings showed that even though the pilots had received weather briefing, none of them expected nor anticipated IMCs. The pilots also indicated that they had recognized weather changes en route, and reacted either by avoiding or escaping these. Some pilots submitted post-flight reports of IMCs while others did not, but the experienced heightened their sense of situational awareness and led to a greater appreciation of the weather as well as the need for alternative planning [21].
Major et al. [3], used a mixed-method approach to identify causal factors that led to VFR2IMC aircraft accidents using data from the NTSB and the Aircraft Owners and Pilots Association Air Safety Institute databases. The findings showed that over the ten-year period, there were 1100 weather-related accidents and that the number of accidents classified as VFR2IMC averaged 31.9 per year. A comparison of the accidents involving instrument-rated and non-instrument-rated pilots indicated that 67.4% of the total number of accidents were caused by pilots without an instrument rating. Further, the total number of flight h was associated with continuing VFR2IMC, with 23.4% of the pilots involved having less than 250 h total flight time, 17.7% (250–500 h), 20.3% (500–1000 h), 13.3% (1000–2000 h), 11.7% (2000–5000 h), 6.3% (5000–10,000 h), and 7% having more than 10,000 h of total flight time [3]. These results suggest that pilots with less than 1000 total flight hours are more likely to continue VFR2IMC in deteriorating weather conditions. Studies conducted at Illinois University demonstrated that pilots with inadequate instrument flight training lose control of aircraft in IMC situations or hit the ground in 178 s [6].

2.3. Contributing Factors

2.3.1. Overconfidence

The decision making of pilots flying into IMCs could be borne from an unsupported overconfidence in their own abilities leading to “premature cessation of problem-solving efforts, insufficient checking of memory retrieval resulting in poorer performance than might otherwise be achieved” [24]. This overconfidence has come to be known as the Dunning–Kruger effect after the study into how incompetent people in the bottom quartile of abilities overrate their own abilities to accomplish the requisite task and overate their abilities relative to their peers [25]. Not only do the more incompetent people lack the requisite skills and knowledge, they also lack the “savvy necessary to recognise competence, be it their own or anyone else’s” (p. 1126). As Shakespeare commented in As You Like It: “The fool doth think he is wise, but the wise man knows himself to be a fool”. Overconfidence has been found to be evidenced in occupational groups outside the student subjects of Kruger and Dunning, e.g., anesthesiologists [26] and senior management [27]. By contrast, the more competent students had a tendency to underrate their abilities.
Pavel, Robertson, and Harrison [28] replicated Kruger and Dunning’s 1999 Study 3—test of knowledge of grammar conventions of the English language—using aviation students enrolled in a university aviation program and obtained similar results. The bottom quartile of aviation students predicted their score to be on the 68th percentile but achieved an average score on the 10th percentile. The researchers found this overconfidence amongst the aviation students carried across to sitting the regulators examinations as well as estimating their piloting skills. For the latter, students ranked themselves on a scale of 1–10, with an average score of over 7, with the bottom quartile of students ranking themselves higher than the other three higher quartiles.

2.3.2. Categorization

According to Endsley’s three-step model of situational awareness [29], the first step requires the pilot to perceive elements in the environment, to detect the cues that indicate there is a change in the status of the environment in which the aircraft is operating. It would seem a simple task to perceive the meteorological elements in the flying environment that reduce them to IMCs—that is, the object up ahead is cloud and it should be avoided so as to avoid spatial disorientation and remain in visual contact with navigational cues to maintain situational awareness and a safe flight.
Perception will rely on recognition and pattern matching. This can be built through experience and training. There have been various frames of reference describing this need. In trying to understand why people do not perceive and recognize items, Clewley and Nixon [30] use categorization theory to explain why these are missed or misunderstood. Categorization theory, “proposes that recognizing entities in the real-world requires a similarity overlap between either a prototypical, ideal case or a stored exemplar derived from experience” (p. 2). When a person is confronted with a happening, they are able to place it within an existing category. Previous experience provides the database or existing structures against which the subject may recognize the elements confronting them in the environment. These authors summarize two different approaches to categorization, the classical view where all members are of equal status with similar features. However, the strength of the category is not always uniform. There can be gradients where one category is much stronger than another. The strength can develop through how typical it is for the activity and how familiar it is for the person. This probabilistic approach has less well-defined membership with graduations between them and the a less well-defined world with fuzzy boundaries, p. 4.
The perception of the elements is most easily made when the element is an exemplar built up from occurring in normal flight activities which allows for adequate recognition. These exemplars need not be personally experienced to become readily recognizable. O’Hare and Wiggins [31], surveyed pilots from Australia, New Zealand, and the United States to determine if they used cues from previous experiences (either the subjects’ own experience or experiences of others) to help overcome critical flight events. Over half (52.5%) of respondents said they recalled a previous case when experiencing a critical flight event (CFE) with the most common CFE being weather (46.1%). Nearly 90% said they found the recalling of a previous case to have been moderately or very useful and close to 85% of respondents considered the recalled previous case as having been influential in the decision they took at the time. Recognition of the previous experiences and the relationship to the newly experienced CFE underpins the categorization process [30].
However, events that are not as often encountered may only be partially recognized or there may be a delay in recognition. These events known to the pilot, may even have been experienced previously, but are not as strongly recognized. Finally, the pilot may encounter an event for which there is no previous experience with a corresponding weak to non-existent recognition leading to a mismanaging of the flight.

2.3.3. Personal Standards

Not only do incompetent people overrate their own abilities but Kruger and Dunning believe they lack the cognitive skills and knowledge to be able to assess their own performance [25]. They are unable to work out that they are not as good as they think they are. Within the aviation system, individual pilots are often not surrounded by organizational structures [32]. These structures help the pilots assess their abilities relevant to the flying conditions of the day. This assistance can take the form of SOPs, including the promulgation of meteorological minima that are required to prevail before members of the organization go flying. These minima will often be higher than the legal minima set by the regulator. There can be experienced staff within the organization who oversee and check the pilot’s flight planning and preflight decision making which, in effect, are helping raise the pilot’s level of expertise. Hunter et al. describe owner pilots who often do not have a surrounding organizational structure supporting them as being a predisposing factor for VFR2IMC [33].

3. Methodology

3.1. Research Design

The research utilized an explanatory design. This is a mixed-method approach that commences with a qualitative study and is followed by a quantitative study [34]. In this type of research design, the findings from the qualitative study are “explained” with the quantitative data and analysis. The qualitative study was a collective case study, with 26 cases. The quantitative study was an ex post facto study, with a sample size of 196.

3.2. Qualitative Study

The qualitative study examined aviation accident databases and reports to understand the human factors involved in VFR2IMC aircraft accidents in general aviation. The Australian Transport Safety Bureau (ATSB) database was used to identify reports associated with VFR2IMC. The period spanned from January 2003 to December 2019, with an initial screening of the ATSB database for all accidents occurring with the Occurrence Type “Operational-Flight preparation/Navigation-VFR into IMC”. The screening yielded 196 occurrences. The scope of the qualitative study was limited to those cases with accident reports from the ATSB. The review isolated 26 occurrences, 23 which had final reports and 3 with preliminary reports. Each of the occurrences was coded with “demographic” details in terms of the date of accident, location (address, latitude, longitude, state), involved aircraft (manufacturer, model, type), pilot details (licenses, ratings, hours, and medical), number of fatalities, and coded causal factors.
To generate a deeper understanding of the safety occurrences, additional coding was undertaken using the HFACS framework. This analysis was performed to identify and evaluate the human factors associated with all the occurrences [7]. HFACS was chosen as an almost ubiquitous accident investigation tool used across the aviation industry [35], and thus facilitates industry-wide understanding of any results and comparisons to other investigations [36]. The coding was undertaken by the second author, an aviation human factors academic for 14 years, and a former commercial pilot including single-pilot IFR (instrument flight rules) operations as well as flight instruction. The HFACS framework has four levels of failure, with categories and subcategories, as shown in Figure 1.
All of the categorized qualitative data were analyzed using Fisher’s exact test. This involved testing the distribution of categories for fatal occurrences against the distribution of categories for non-fatal occurrences. The details to calculate the p-value for Fisher’s exact test are complex [37]. However, software packages are capable of providing the resultant value; in this work, MATLAB was utilized to calculate the p-values of each Fisher’s exact test.

3.3. Quantitative Study

In the quantitative ex post facto study, each of the 196 safety occurrences were categorized based on occurrence type, fatalness, type of operation, aircraft manufacturer, airspace classification, year, and month of occurrence. The occurrence types used were accident, serious incident, and incident. Fatalness refers to the fact that the occurrence either resulted in fatalities or not. The types of operations included:
  • Private;
  • Flying Training;
  • Air Transport Low Capacity/Charter;
  • Aerial Work; and
  • RA.
The aircraft manufactures included:
  • Cessna;
  • Piper;
  • Beech;
  • Amateur;
  • Cirrus;
  • Bell;
  • Mooney;
  • Robinson;
  • Eurocopter;
  • Air Tractor; and
  • Other.
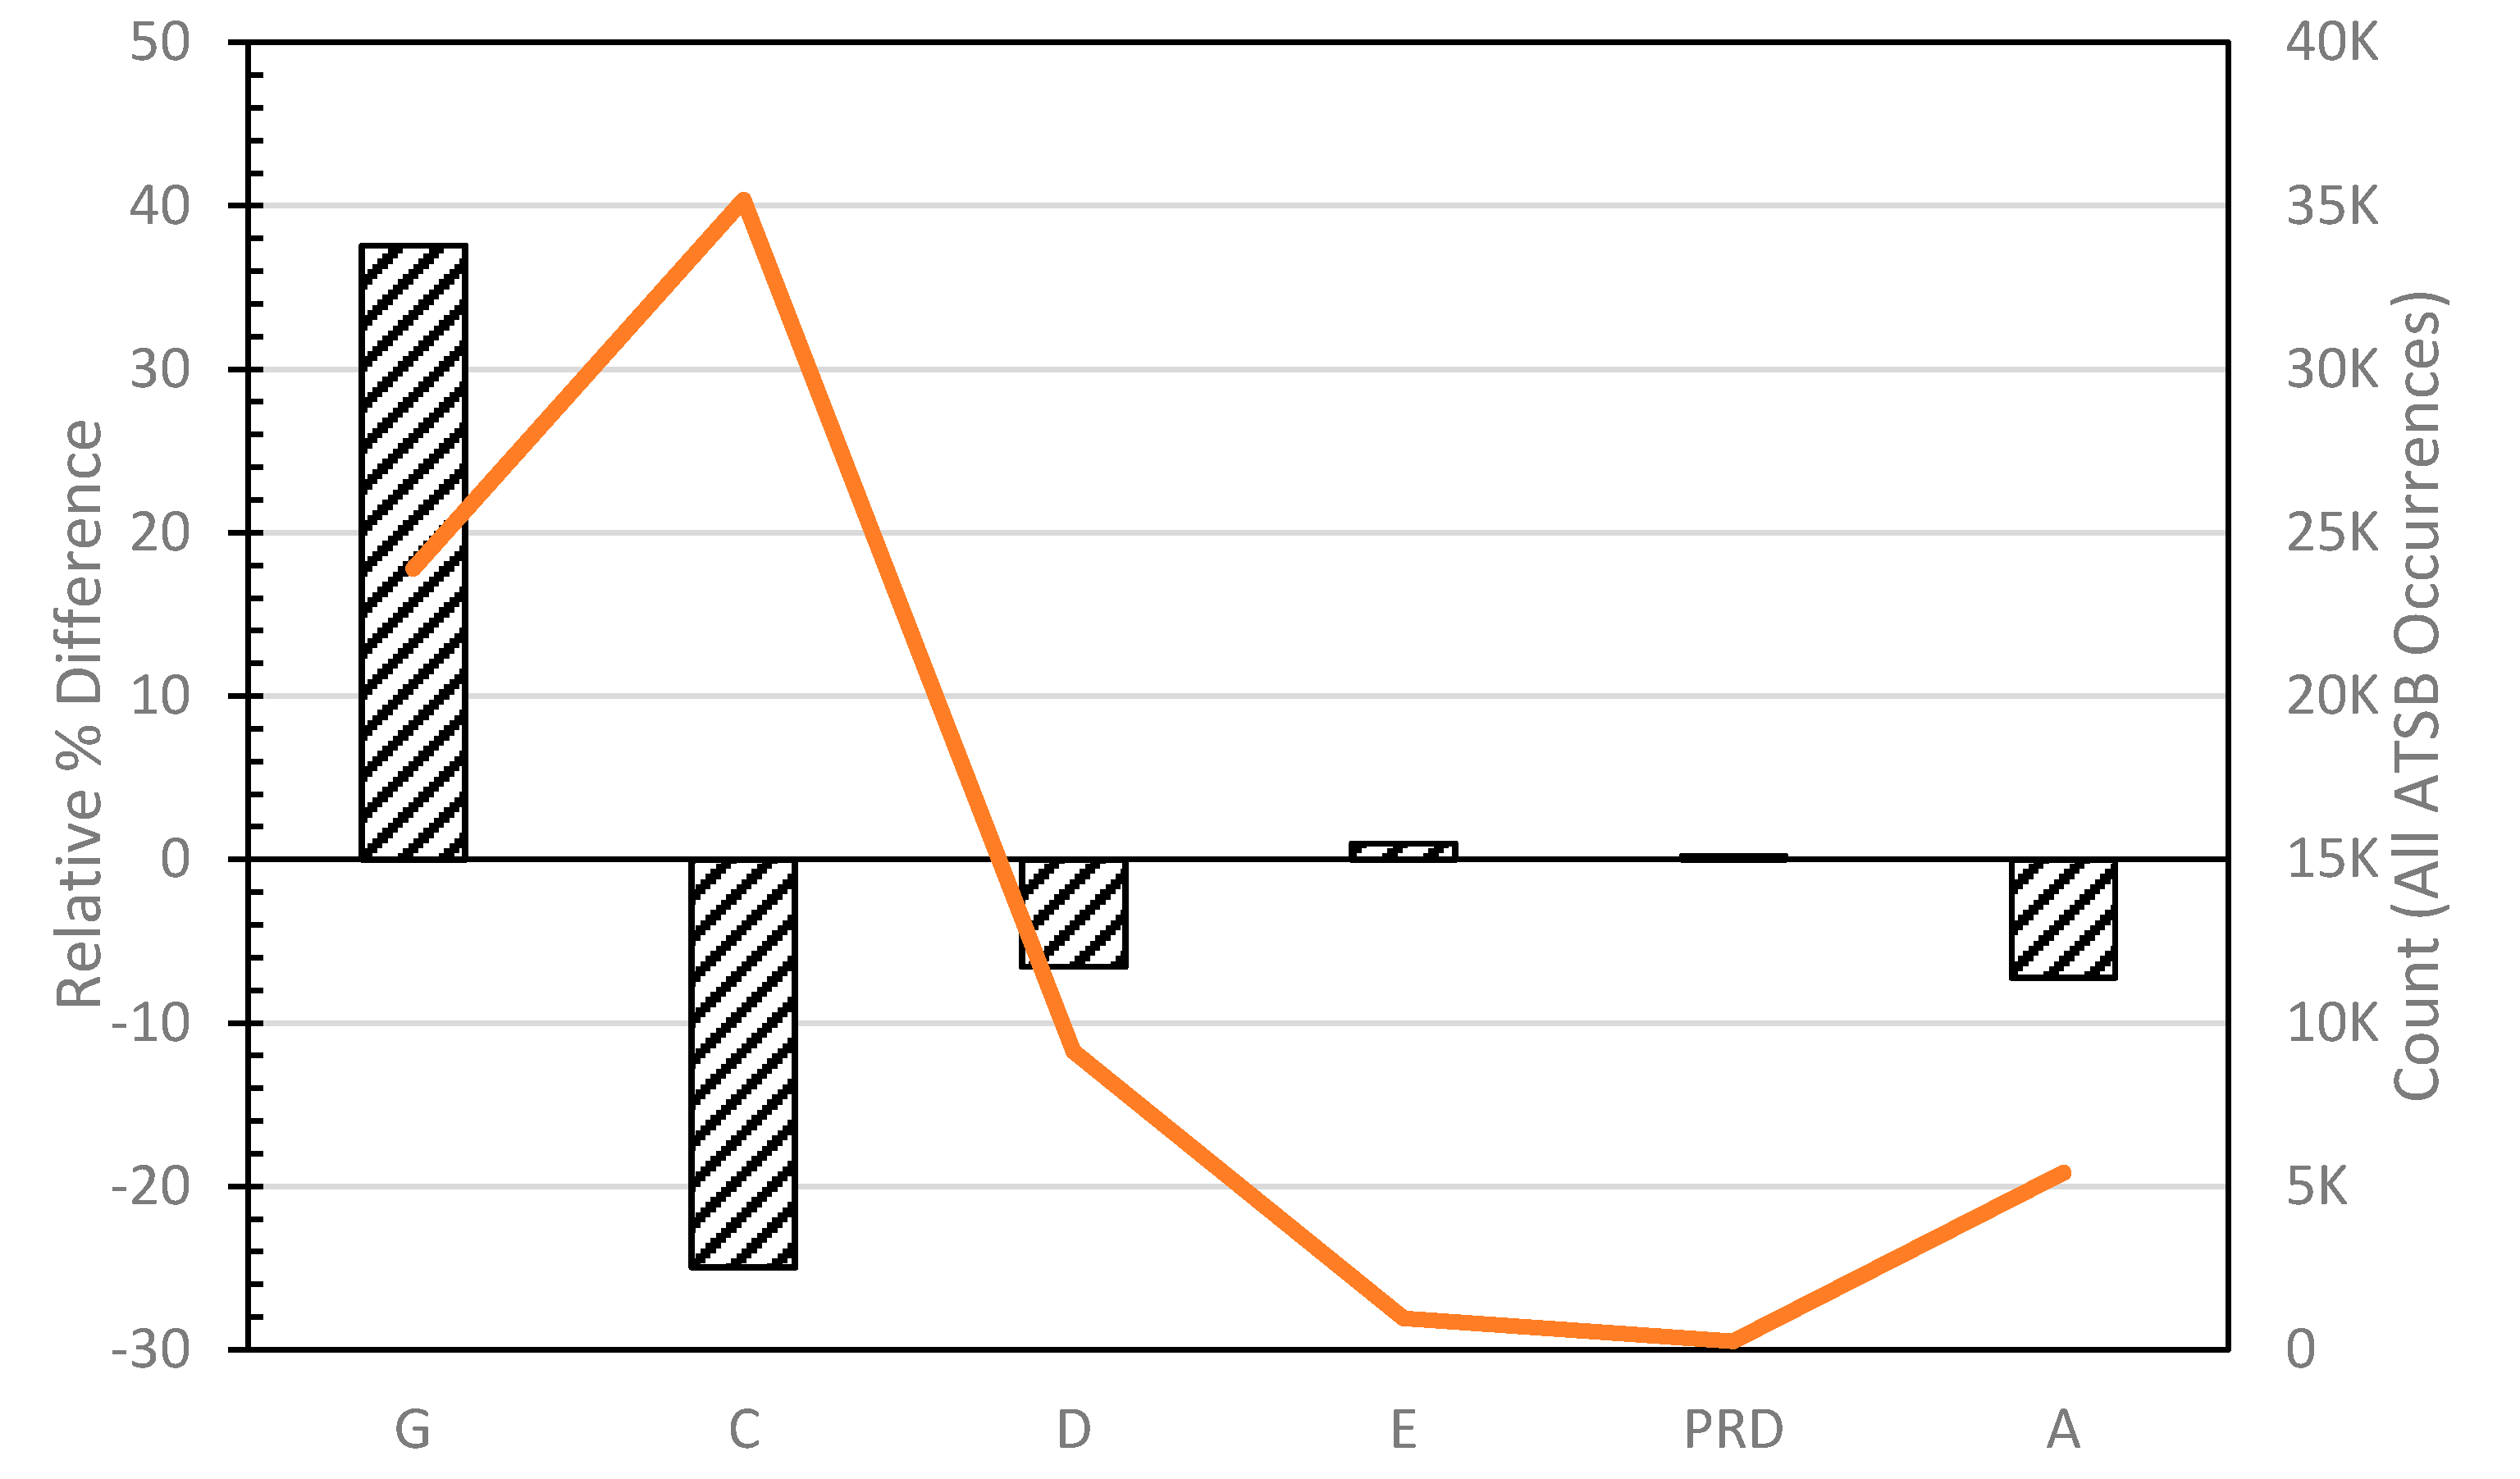
The other category includes 31 other manufactures, with a single manufacturer having at most 4 safety occurrences and an average of 2 occurrences per manufacture in this category. These were not included individually as the BITRE (Bureau of Infrastructure, Transport, and Regional Economics) annual report did not specify the hours associated with these manufacturers, and their associated hours were grouped in an “other” category. The airspace classifications used in Australia include A, C, D, E, and G. An additional airspace classification of PRD includes prohibited, restricted, and danger areas.
The quantitative data analysis followed that of previous work, investigating safety occurrences involving remotely piloted aircraft [38]. The data analysis involved Pearson’s chi-squared tests for goodness of fit, calculated in Excel. The VFR2IMC data, represented by the observed data (O) and the expected data (E), came from various sources. Specifically:
  • Occurrence type—ATSB population (all safety occurrences), over the same time period;
  • Fatalness—ATSB population, over the same time period;
  • Operation type—hours reported for each operation type by BITRE;
  • Aircraft Manufacturer—hours reported for each manufacture by BITRE;
  • Airspace Classification—ATSB population, over the same time period; and
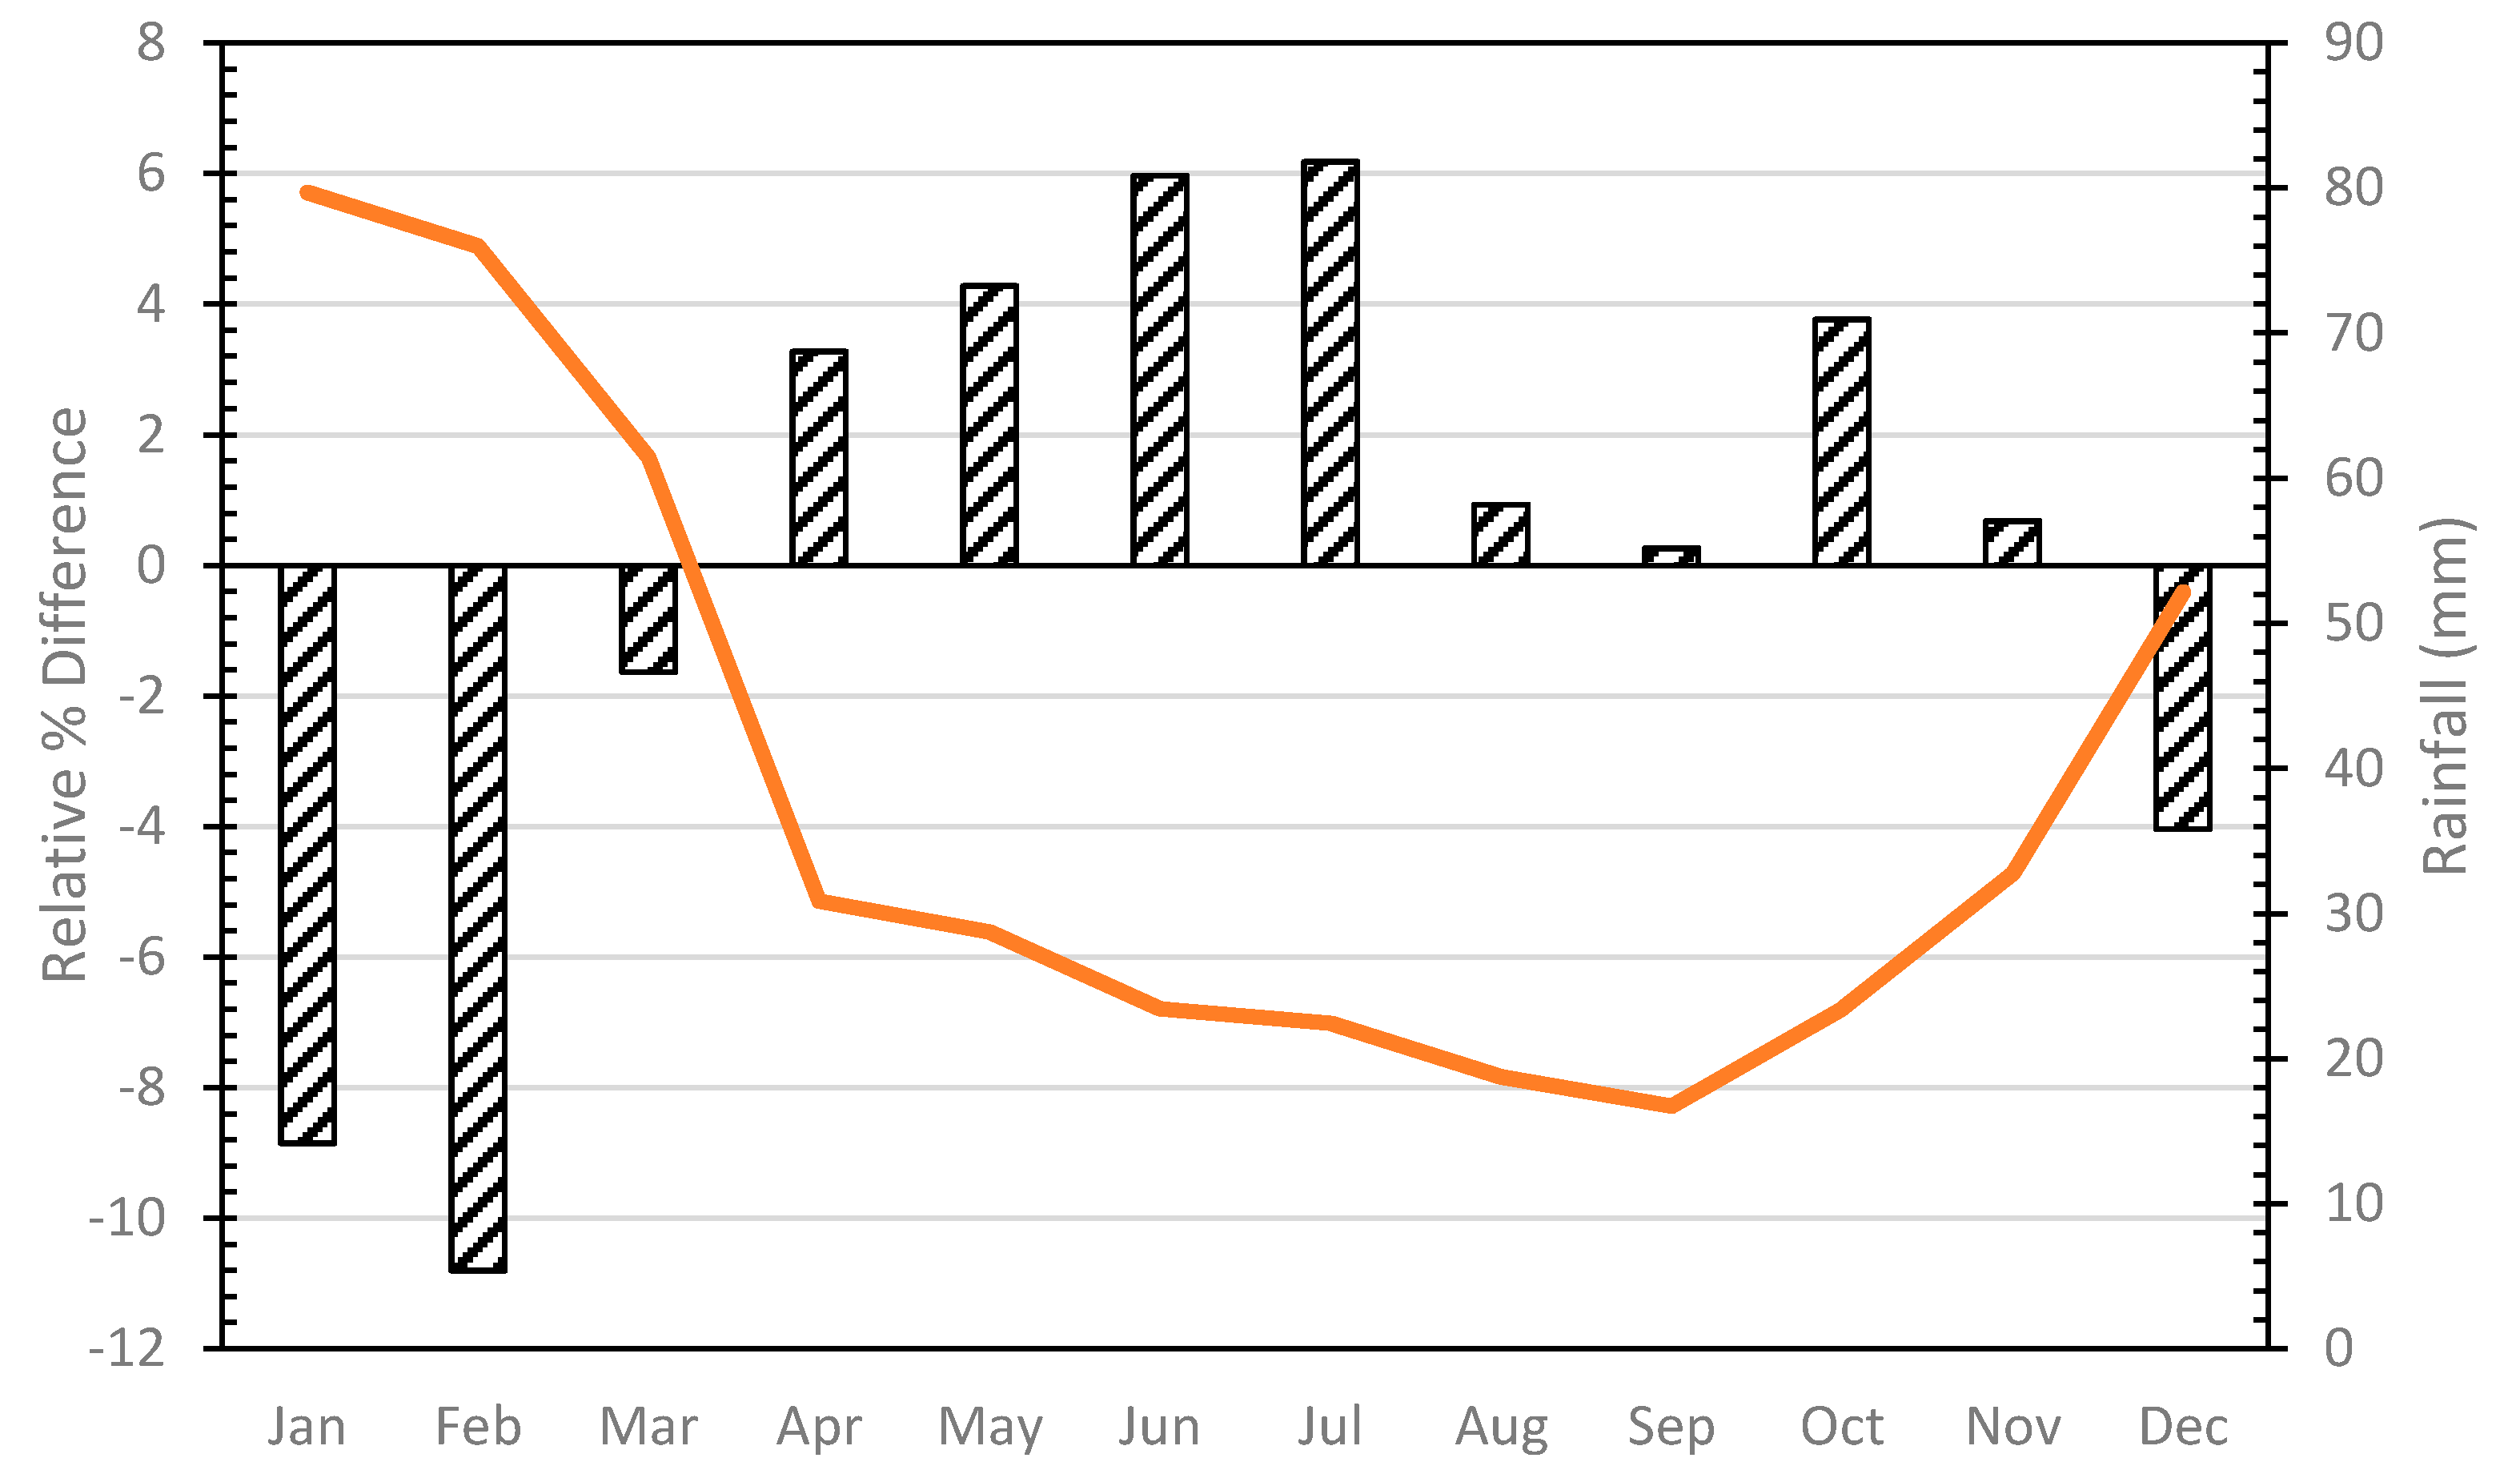
  • Month—average monthly rainfall reported by the Bureau of Meteorology.
All data are freely available from the corresponding government database. The statistical hypotheses are given as
H0: PVFR2IMC,n = PE,n,
HA: PVFR2IMC,n ≠ PE,n,
where P is in reference to the proportions of the n-th category for VFR2IMC and the expected (E) distribution. The null hypothesis (H0) can therefore be expressed as “the proportions of VFR2IMC safety occurrences are equal to the proportions expected, for the different categories”. Conversely, the alternative hypothesis (HA) is that “the proportions are not equal”.
For each of the factors of interest, an ideal way to show the difference between the observed data and expected data is to calculate the relative percentage differences, deltas (Δ), using [38]
Δ i = ( O i E i ) i = 1 n O i × 100 % .
Using the delta values facilitates a direct comparison between what is observed for VFR2IMC for each of the categories and what would be expected if the data was a random sample of the expected data. Specifically, a positive delta infers that a VFR2IMC occurrence is more likely than expected, while a negative delta infers that a VFR2IMC occurrence is less likely than expected.
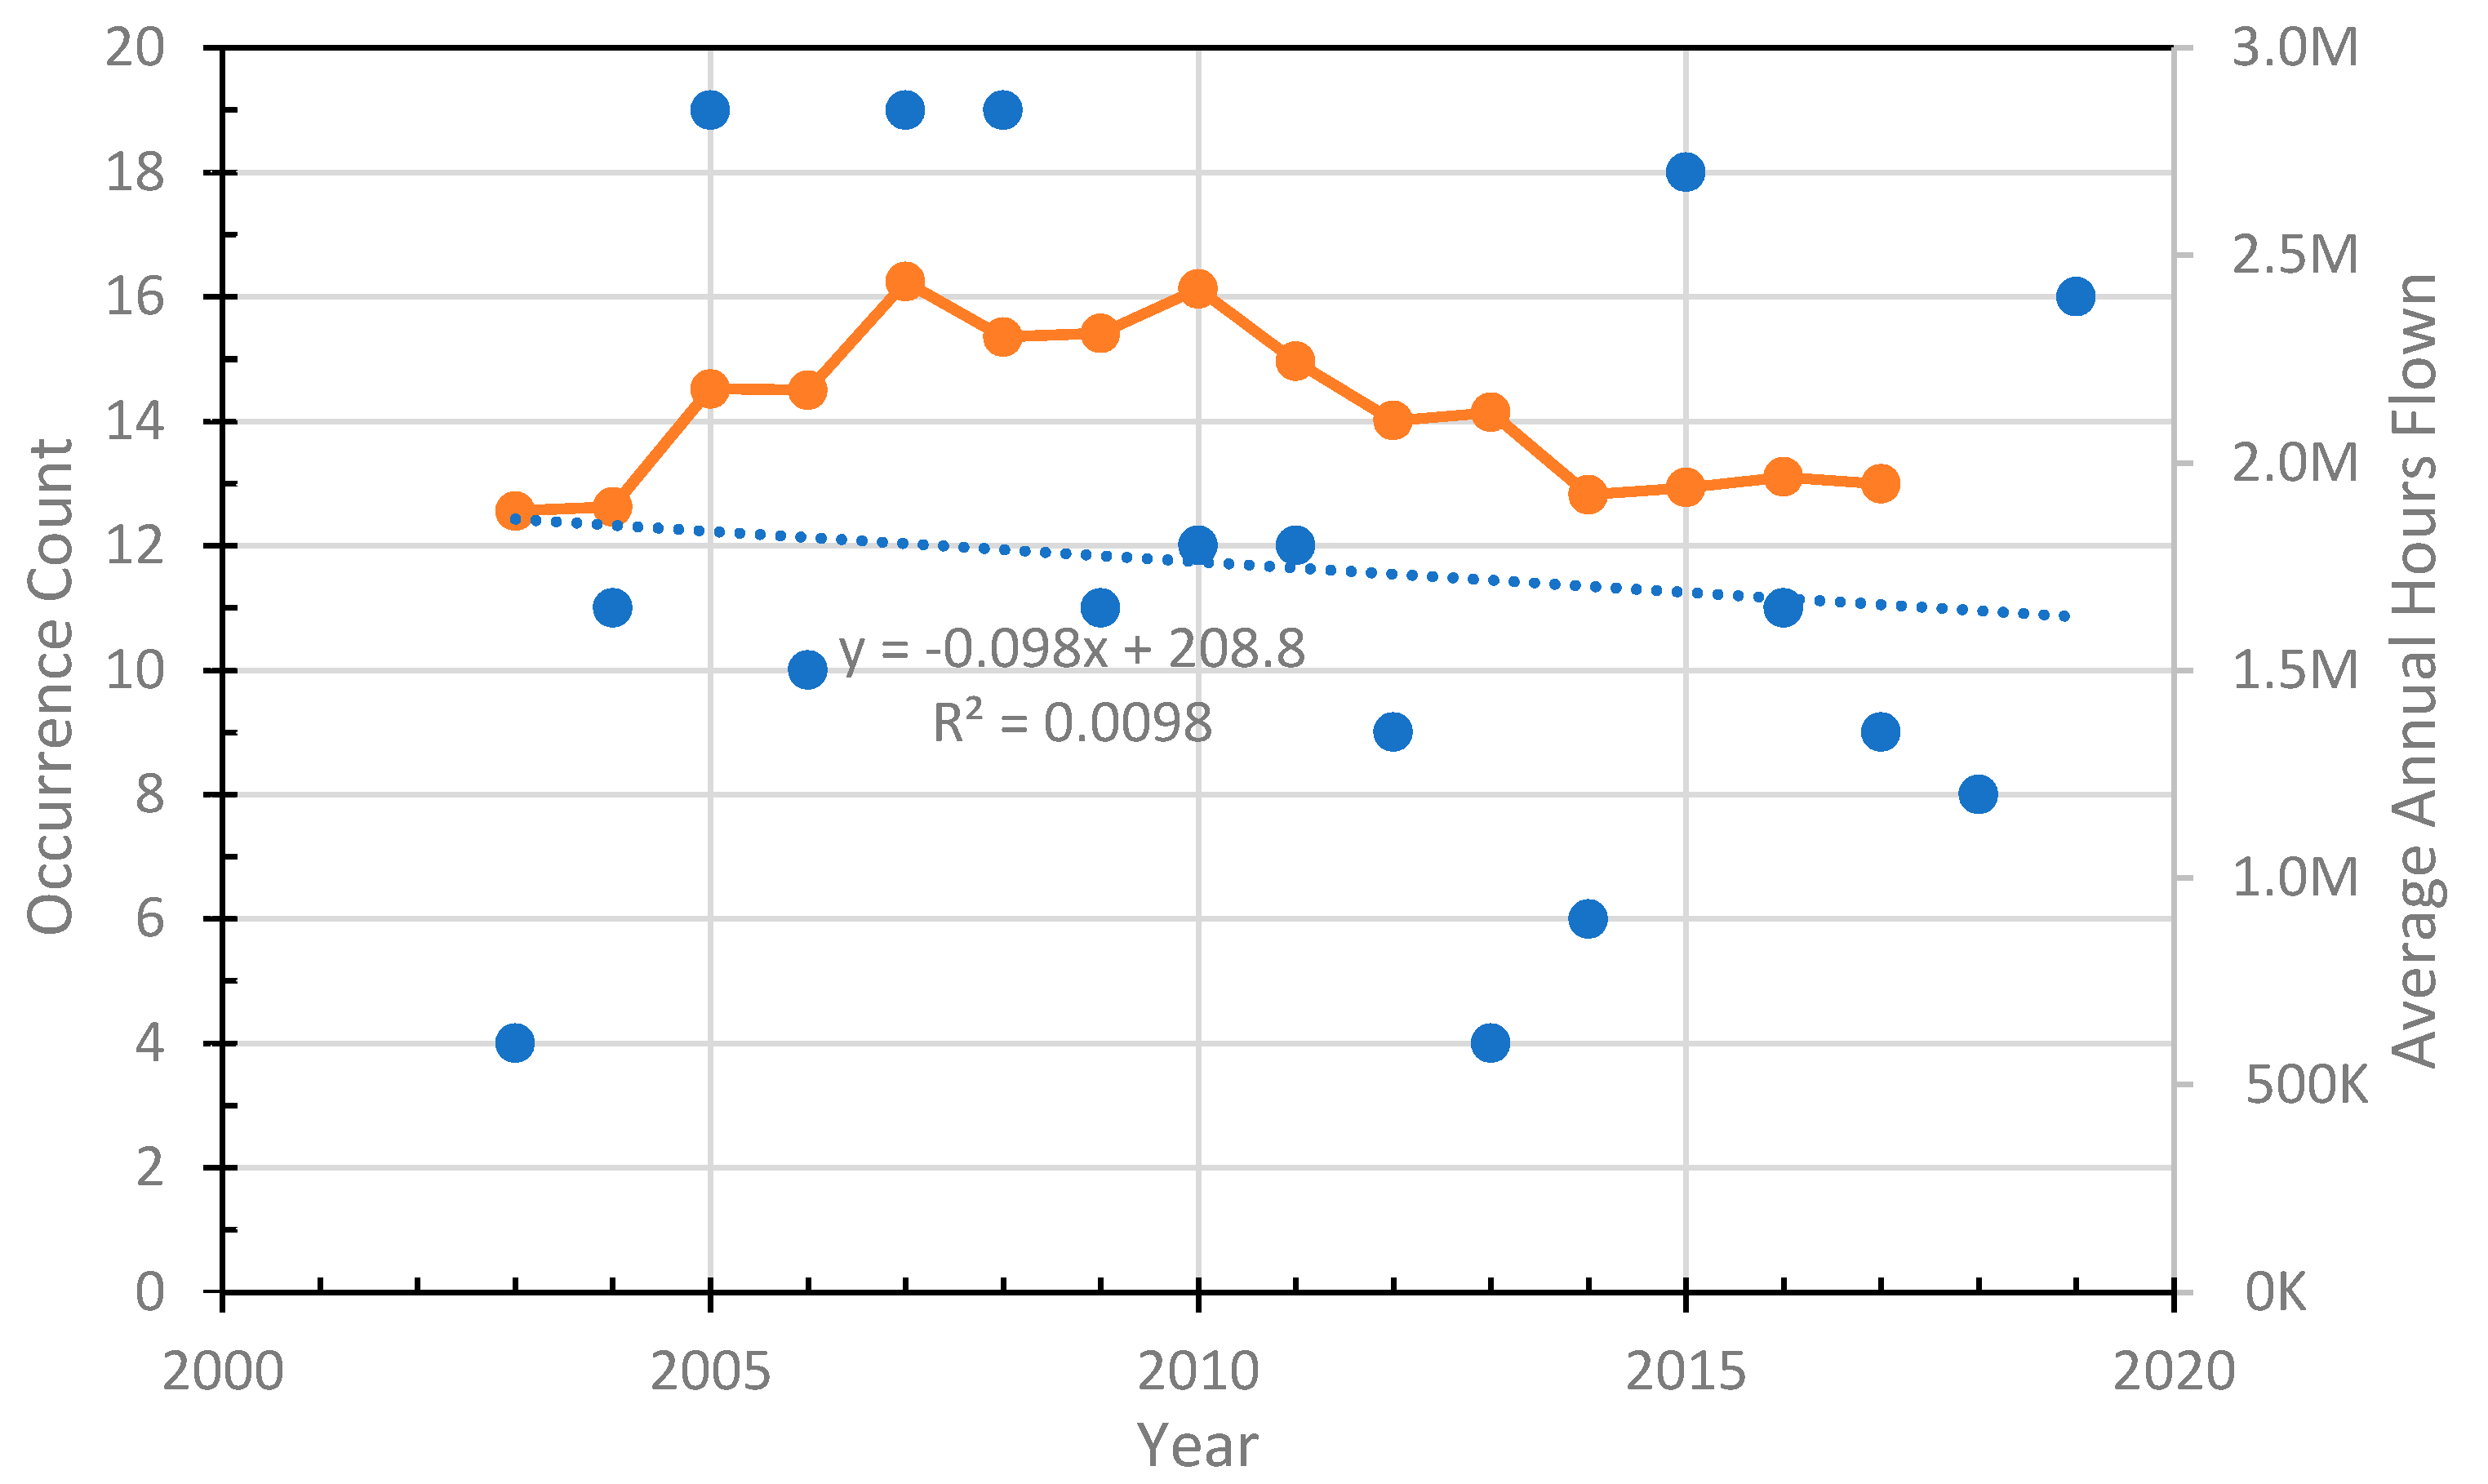
Since year is an interval variable, a suitable parametric test was needed to assess the trend and statistical significance. Specifically, correlation was used to measure if the number of VFR2IMC occurrences have reduced over the 17-year span of the study.

4. Qualitative Study

4.1. Aircraft and Operation Types

The study identified 26 ATSB reports with complete information on aircraft information, weather hazards, fatalities, human factors, and pilot characteristics (flight hours and instrument rating—although some required data was requests from the ATSB). The aircraft models involved in the accident are identified in Table 1.
While it appears that the Cessna aircraft have more occurrences associated with them, this is clearly a confounding effect given the fact that these are the most common aircraft flying in the GA industry in Australia. Hence, the reason a follow-up quantitative investigation is necessary.
Most of the aircrafts were involved in private operations (17), comprising mainly of pleasure/travel and test and carry, while five were chartered flights, with two aerial works and two involving flying training. Table 2 shows the breakdown of the types of operations for the VFR2IMC occurrences. The total for each is broken down further, showing the number of operations for those occurrences and whether they were fatal. Those occurrences that were not fatal are further broken down into those with serious, minor, or no injuries. Fisher’s exact test for the 4 × 2 (operation vs. fatal/not) is statistically significant (p = 0.001). That is, private operations are more likely to end fatally, while charter and training flights are less likely to end fatally. The degree to which this conclusion can be extrapolated to the population is based on the “randomness” of the investigated sample. That is, has the ATSB systematically chosen more fatal private operations to investigate, or is the choice to investigate a given VFR2IMC occurrence independent of the type of operation, or are there any mediating or confounding variables related to the type of operation. This will be discussed further in the quantitative analysis.

4.2. Pilot Characteristics

The licenses held by the pilots involved in the VFR2IMC occurrences are indicated in Table 3. Note that the preliminary report for the most recent fatal accident does not include any information about the pilot and, hence, is excluded in this section. The data is broken down to show the number of licenses held for either fatal occurrences or occurrences that were not fatal. Those occurrences that were not fatal can be further broken down into those with serious, minor, or no injuries. Fisher’s exact test for the 5 × 2 (license vs. fatal/not) is not significant (p = 0.562). No significant conclusion can be drawn from this as the investigated sample is not random and the limited resources of the ATSB means they investigate occurrences that are significant to them; unfortunately, for the entire population of 196 occurrences, license information is not provided.
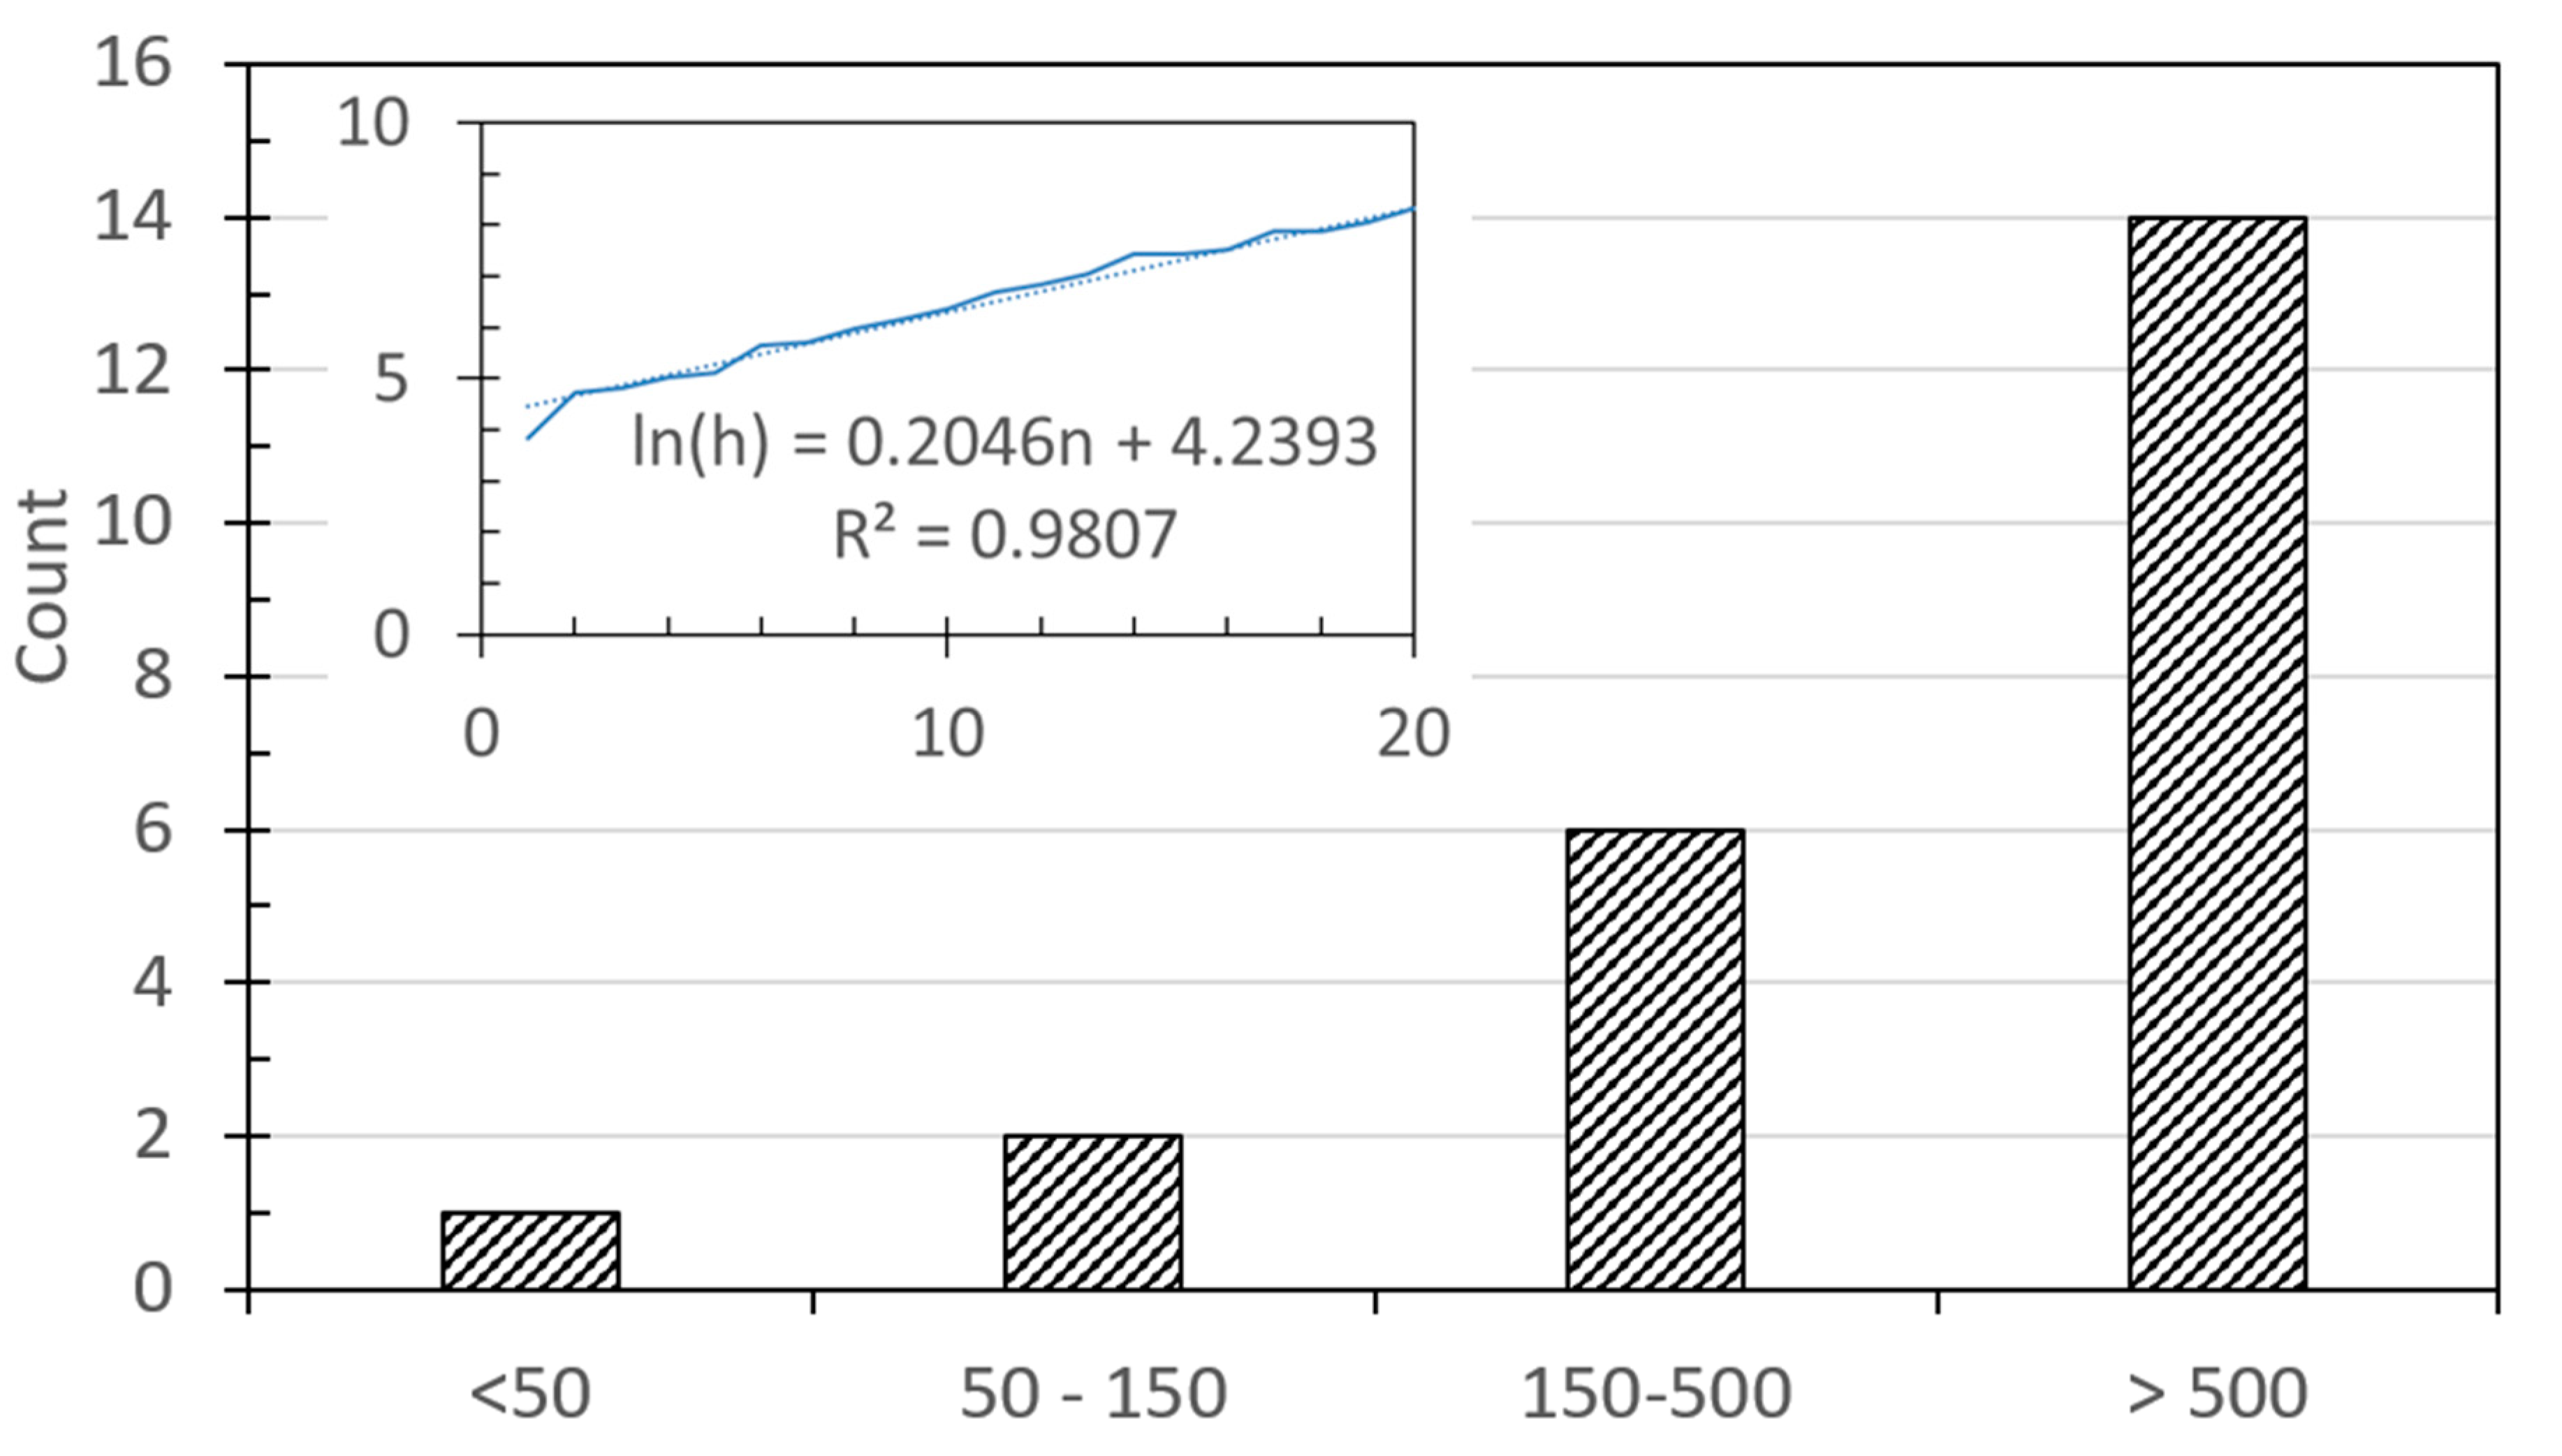
The next considered pilot characteristic was pilot flight experience, represented by total logged flying hours. Of the 26 investigated VFR2IMC occurrences, only 19 included the total h logged by the pilot (4 more were provided through email communication with the ATSB). The distribution of flight hours is illustrated in Figure 2. The hour groups were chosen to correspond to “flight experience” needed for a private pilot’s license (50 h), a commercial pilot’s license (150 h), and an air transport pilot’s license (500 h). These categories do not correspond to those licenses and they correspond only to the equivalent flight hour experience needed for those licenses. The most significant feature here is that the mode (most common) is clearly for pilots with more than 500 h of flight experience. In fact, if ranked and plotted, there is a clear exponential trend in the flight hours (r = 0.968, p < 0.01). This then suggests that not only does flying more hours influence the chance of an occurrence (this influence alone would be a linear relationship, flying twice as many hours would make it twice as likely to randomly encounter IMCs from VFRs), it is compounded by experience; that is, overconfidence is likely to play a significant role in VFR2IMC occurrences. To further investigate the effect of flight experience, the occurrences were ranked in order of flight hours, and the two groups of fatalness were then tested using a Mann–Whitney U Test. The result of the test was z = −0.08, p = 0.47. That is, there was no difference between occurrences grouped by fatalness and ranked by flight h. Therefore, having more flight experience does not influence the fatalness of a VFR2IMC occurrence. It is worth combining these two findings; the statement is, that the more experience you have, the more likely it is you will experience VFR2IMC, but it is not more likely that you will have a fatal occurrence.
The final pilot characteristic of interest was additional ratings. Table 4 shows the breakdown in ratings held by the pilots involved in the VFR2IMC occurrences. The total for each is further broken down, showing the highest rating held for those occurrences that were either fatal or not. Those occurrences that were not fatal are further broken down into those with serious, minor, or no injuries. For the 26 VFR2IMC occurrences, two are excluded (final reports to be released), and any of the others that did not include a statement of the ratings held were assumed to be no rating; that is, the relevance of the rating to the outcome of the occurrence is significant, and should be included, and if not, then the assumption that no rating was held by the pilot can be made with confidence. The result in Table 4 show 17 of the 24 occurrences with no additional rating. This is even though CASA, in its training guidelines, recommends competency standards for private and commercial airplane licenses that are related to the management of VFR2IMC risk. Fisher’s exact test for the 3 × 2 (rating vs. fatal/not) gives p = 0.031, which is statistically significant. Therefore, it can be concluded that an instrument rating will result in a VFR2IMC occurrence not being fatal, while a night VFR rating will increase the likelihood of a fatal outcome, again, likely due to overconfidence.

4.3. Causal Factors

The first causal factor investigated are the environmental hazards associated with the occurrences. These hazards were coded as shown in Table 5; note, multiple codes were applicable to individual occurrences and, hence, the reason the total sums to more than 26. The three key hazards were clouds (not associated with precipitation), terrain (mountains, etc.), and cloud with rain. Other significant hazards included night, trees, fog, and turbulence. Fisher’s exact test for the 9 × 2 (hazard vs. fatal/not) was statistically significant (p = 0.036). When looking at the delta values, four primary hazards can be identified, clouds, terrain, rain and clouds, and turbulence. Clouds alone has a negative delta, which means occurrences with clouds without precipitation are less likely to result in fatalities than expected, while the other three key hazards are more likely to result in fatalities than expected.
The next causal factor was the choice of action taken by the pilot once in IMCs from VFRs. The choices were coded as “continuing on”, “turned back”, “diverted”, and “fly around”. Those occurrences that were initially “continued on” and then became “turned back”, were only coded as “continued on”; that is, to be coded as “turned back”, this had to be the pilot’s first choice. Fisher’s exact test for the 4 × 2 (action vs. fatal/not) is significant (p < 0.001). The data shown in Table 6 clearly indicate that all 14 fatal occurrences are associated with an attempt to “continue on” and no other action; or if alternative action was taken, it was done so after initially choosing to continue into IMCs.
The final causal factor considered was flight planning, specifically, the level of understanding of the relevant forecast and appropriate use of the systems to seek updated weather information. Table 7 shows the codes used to classify the weather information sources and the resultant occurrence counts. The ideal source of weather data, the National Aeronautical Information Processing System (NAIPS), was used in only 9 of the 26 occurrences. Seven occurrences are believed to have occurred without the pilot using any aeronautical service to obtain weather information, all of which ended fatally. There were two occurrences that used verbal means to obtain weather information (via phone or a direct conversation about weather), with one being fatal and the other not. There was also one flight that involved a preflight weather briefing, and it is reasonable to assume the instructor in this situation would have sourced the weather information from NAIPS; this was not fatal. Finally, there were two attempts to obtain weather information in-flight (and not preflight): one via AWIS (Aerodrome Weather Information Service) and one via ATIS (Automatic Terminal Information Service), with the latter being a fatal occurrence. Fisher’s exact test for the 6 × 2 (weather information vs. fatal/not) is significant (p = 0.009). The relevant delta values show that the use of NAIPS for aviation weather data in the preflight planning stage reduced the probability of a VFR2IMC occurrence. Clearly, not seeking weather data is only associated with fatal occurrences and, hence, if no weather information is used, the likelihood of a fatal occurrence is increased.

4.4. Human Factors Analysis

HFACS was used to gain an in-depth understanding of the human factors involved in the occurrences. Analysis covered the four levels of failure (unsafe acts, preconditions for unsafe acts, unsafe supervision, and organizational influences) in addition to the subcategories. Table 8 shows the total count for each of the HFACS elements for the 26 VFR2IMC occurrences; the total is made up of fatal and not fatal occurrences. Fisher’s exact test for the complete set of elements was not conducted (due to computational limitations of the test). However, individual elements were tested.
Table 9 shows the results for the 10 Fisher’s exact tests conducted for the different groupings of the HFACS elements. Of these, only the difference between the levels (1, 2, 3, and 4) is statistically significantly different. Specifically, it can be noted that, together, errors and violations occur with a slightly greater frequency for fatal occurrences than non-fatal occurrences. When looking at just the different types of errors or the different types of violations, no statistically significant difference was observed.

5. Quantitative Study

5.1. Analysis Summary

Table 10 shows the results from the chi-squared tests for goodness of fit for each of the six categorical factors investigated (occurrence type, fatalness, aircraft manufacturer, aircraft operation, airspace classification, and month of occurrence). All six of the tests were positive, that is, the null hypothesis was rejected for each, and the proportions observed for each of the factors were different to the proportions expected.

5.2. Occurrence Type

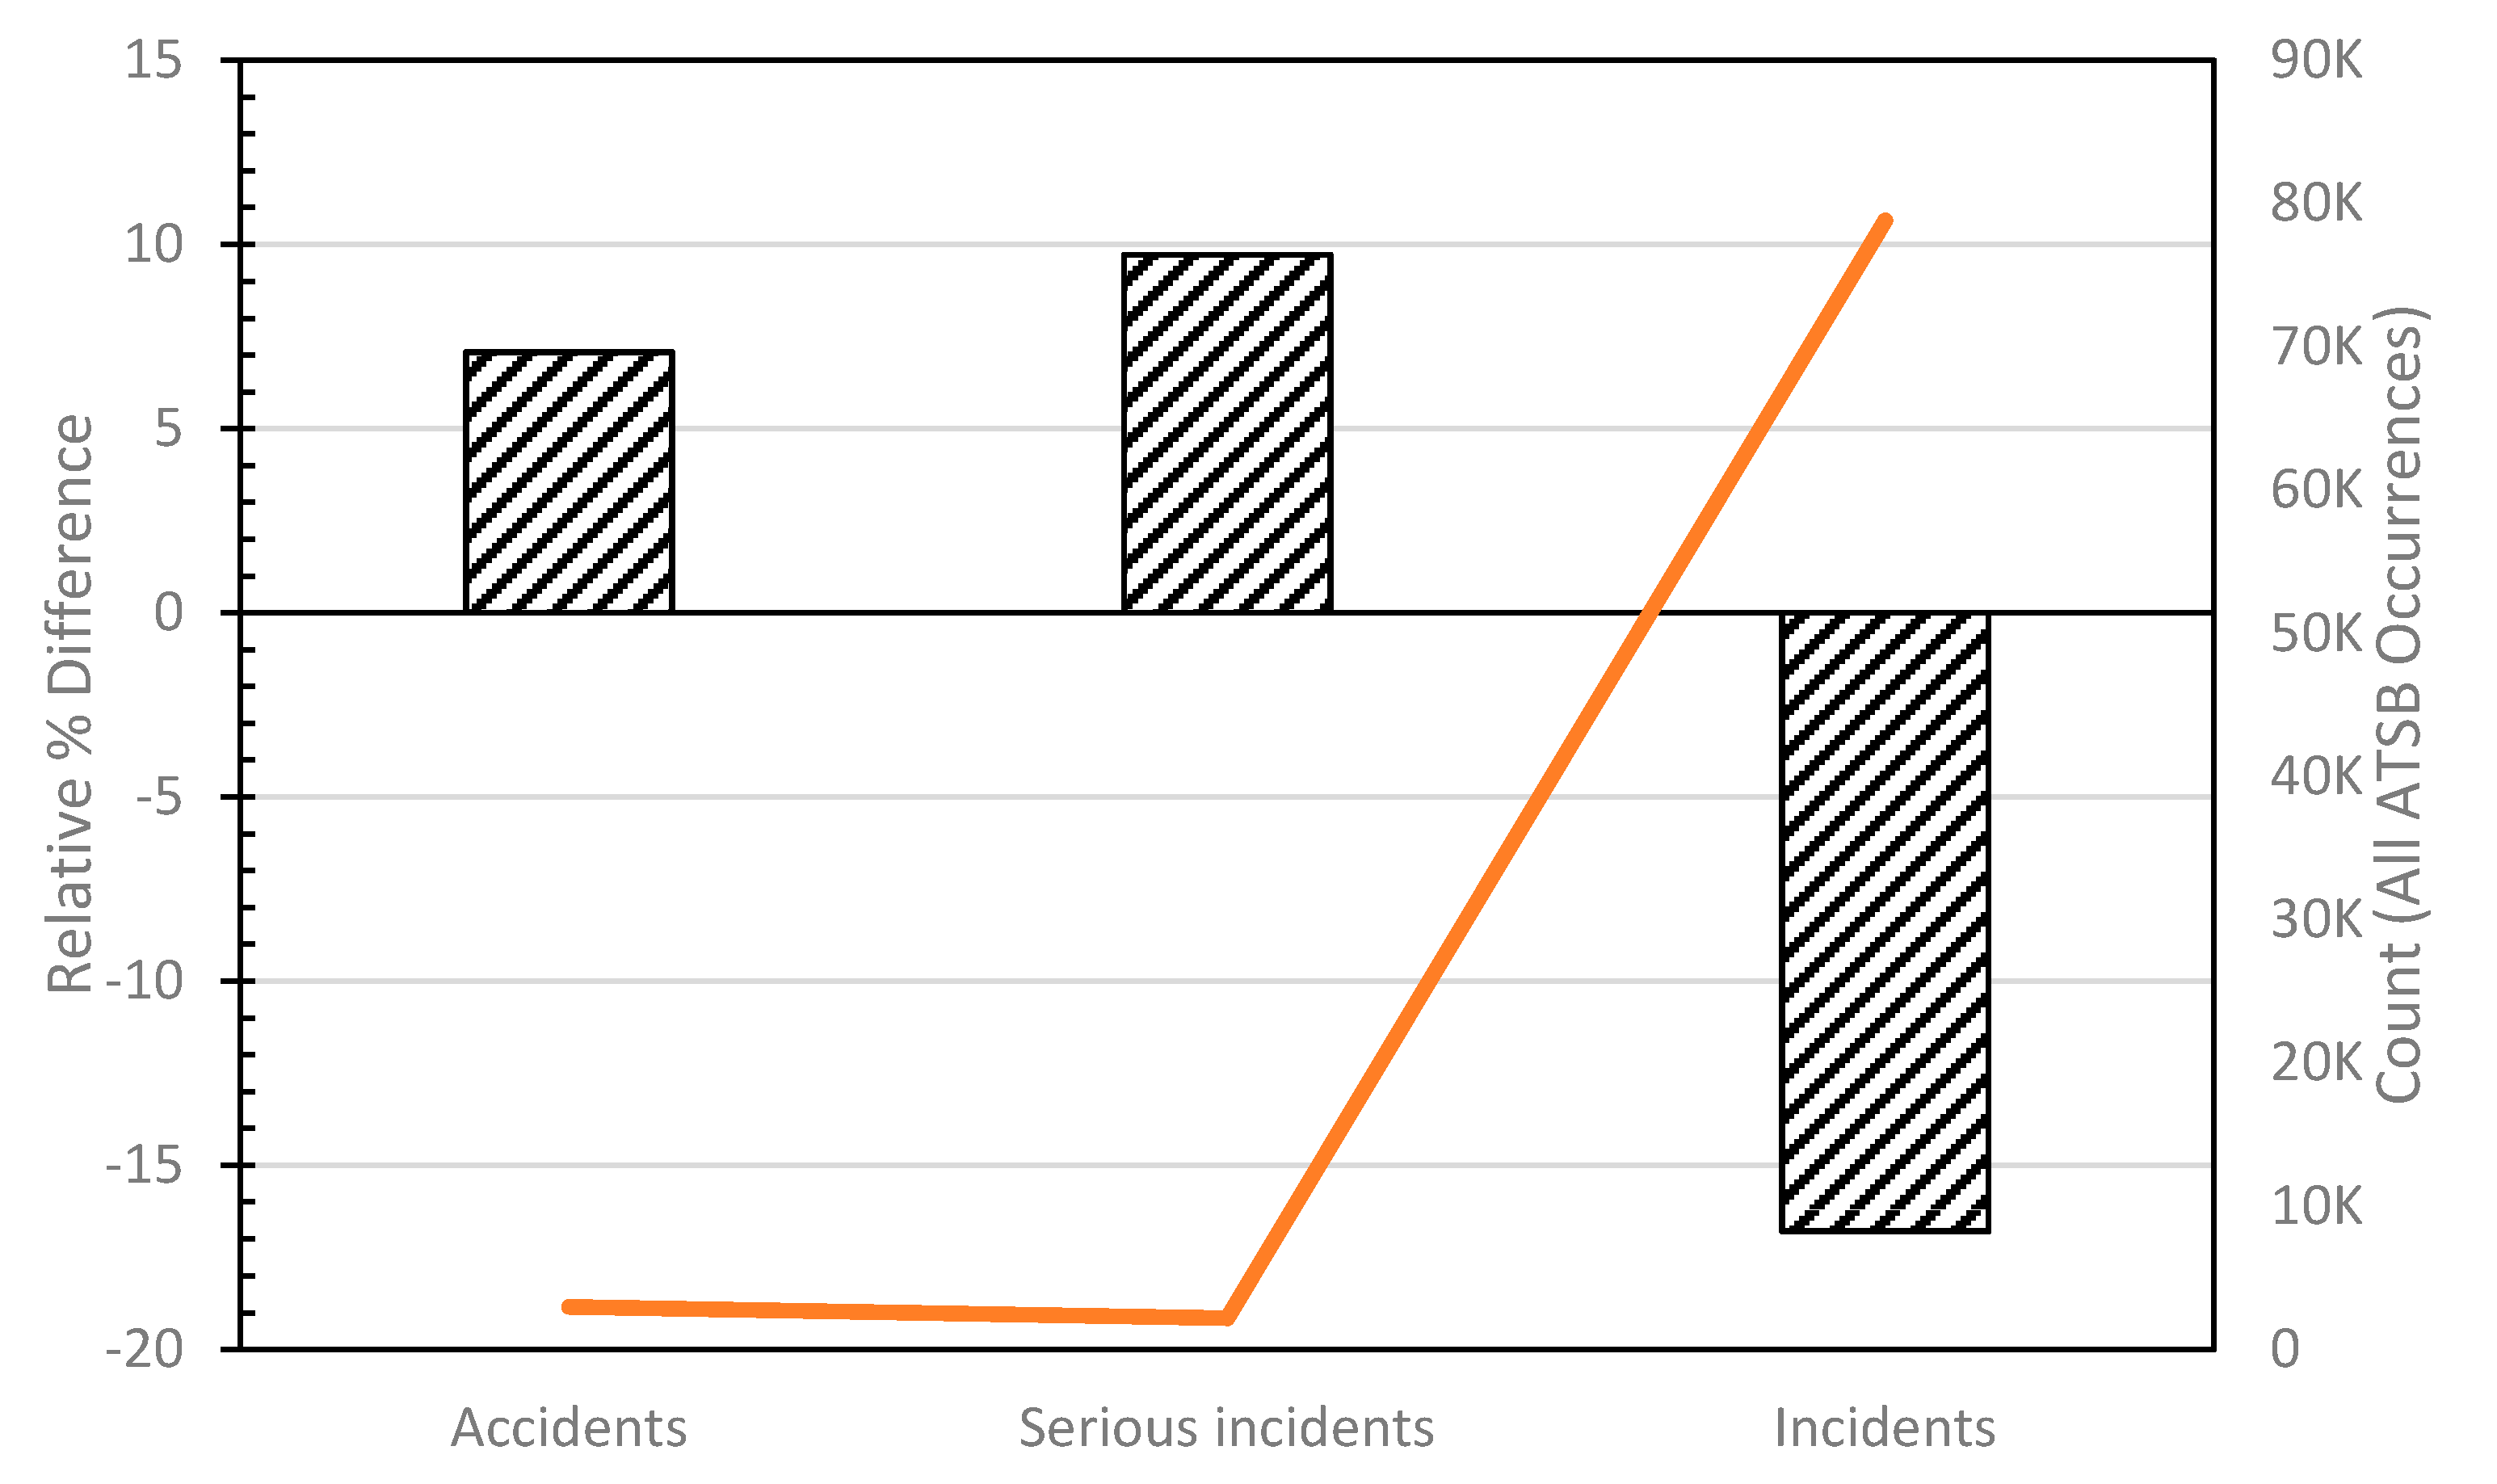
Figure 3 shows the relative percentage difference for the occurrence type comparing the VFR2IMC category to all occurrences reported by the ATSB. The positive differences for accidents and serious incidents indicate that VFR2IMC occurrences result in more of these than expected, which indicates that VFR2IMC occurrences are more serious. That is, they result in more accidents than other occurrences together, specifically, three times the expected value. This is also the same for serious incidents, which occurred at three times the expected value. This means that efforts to reduce VFR2IMC occurrences are essential.

5.3. Fatalness

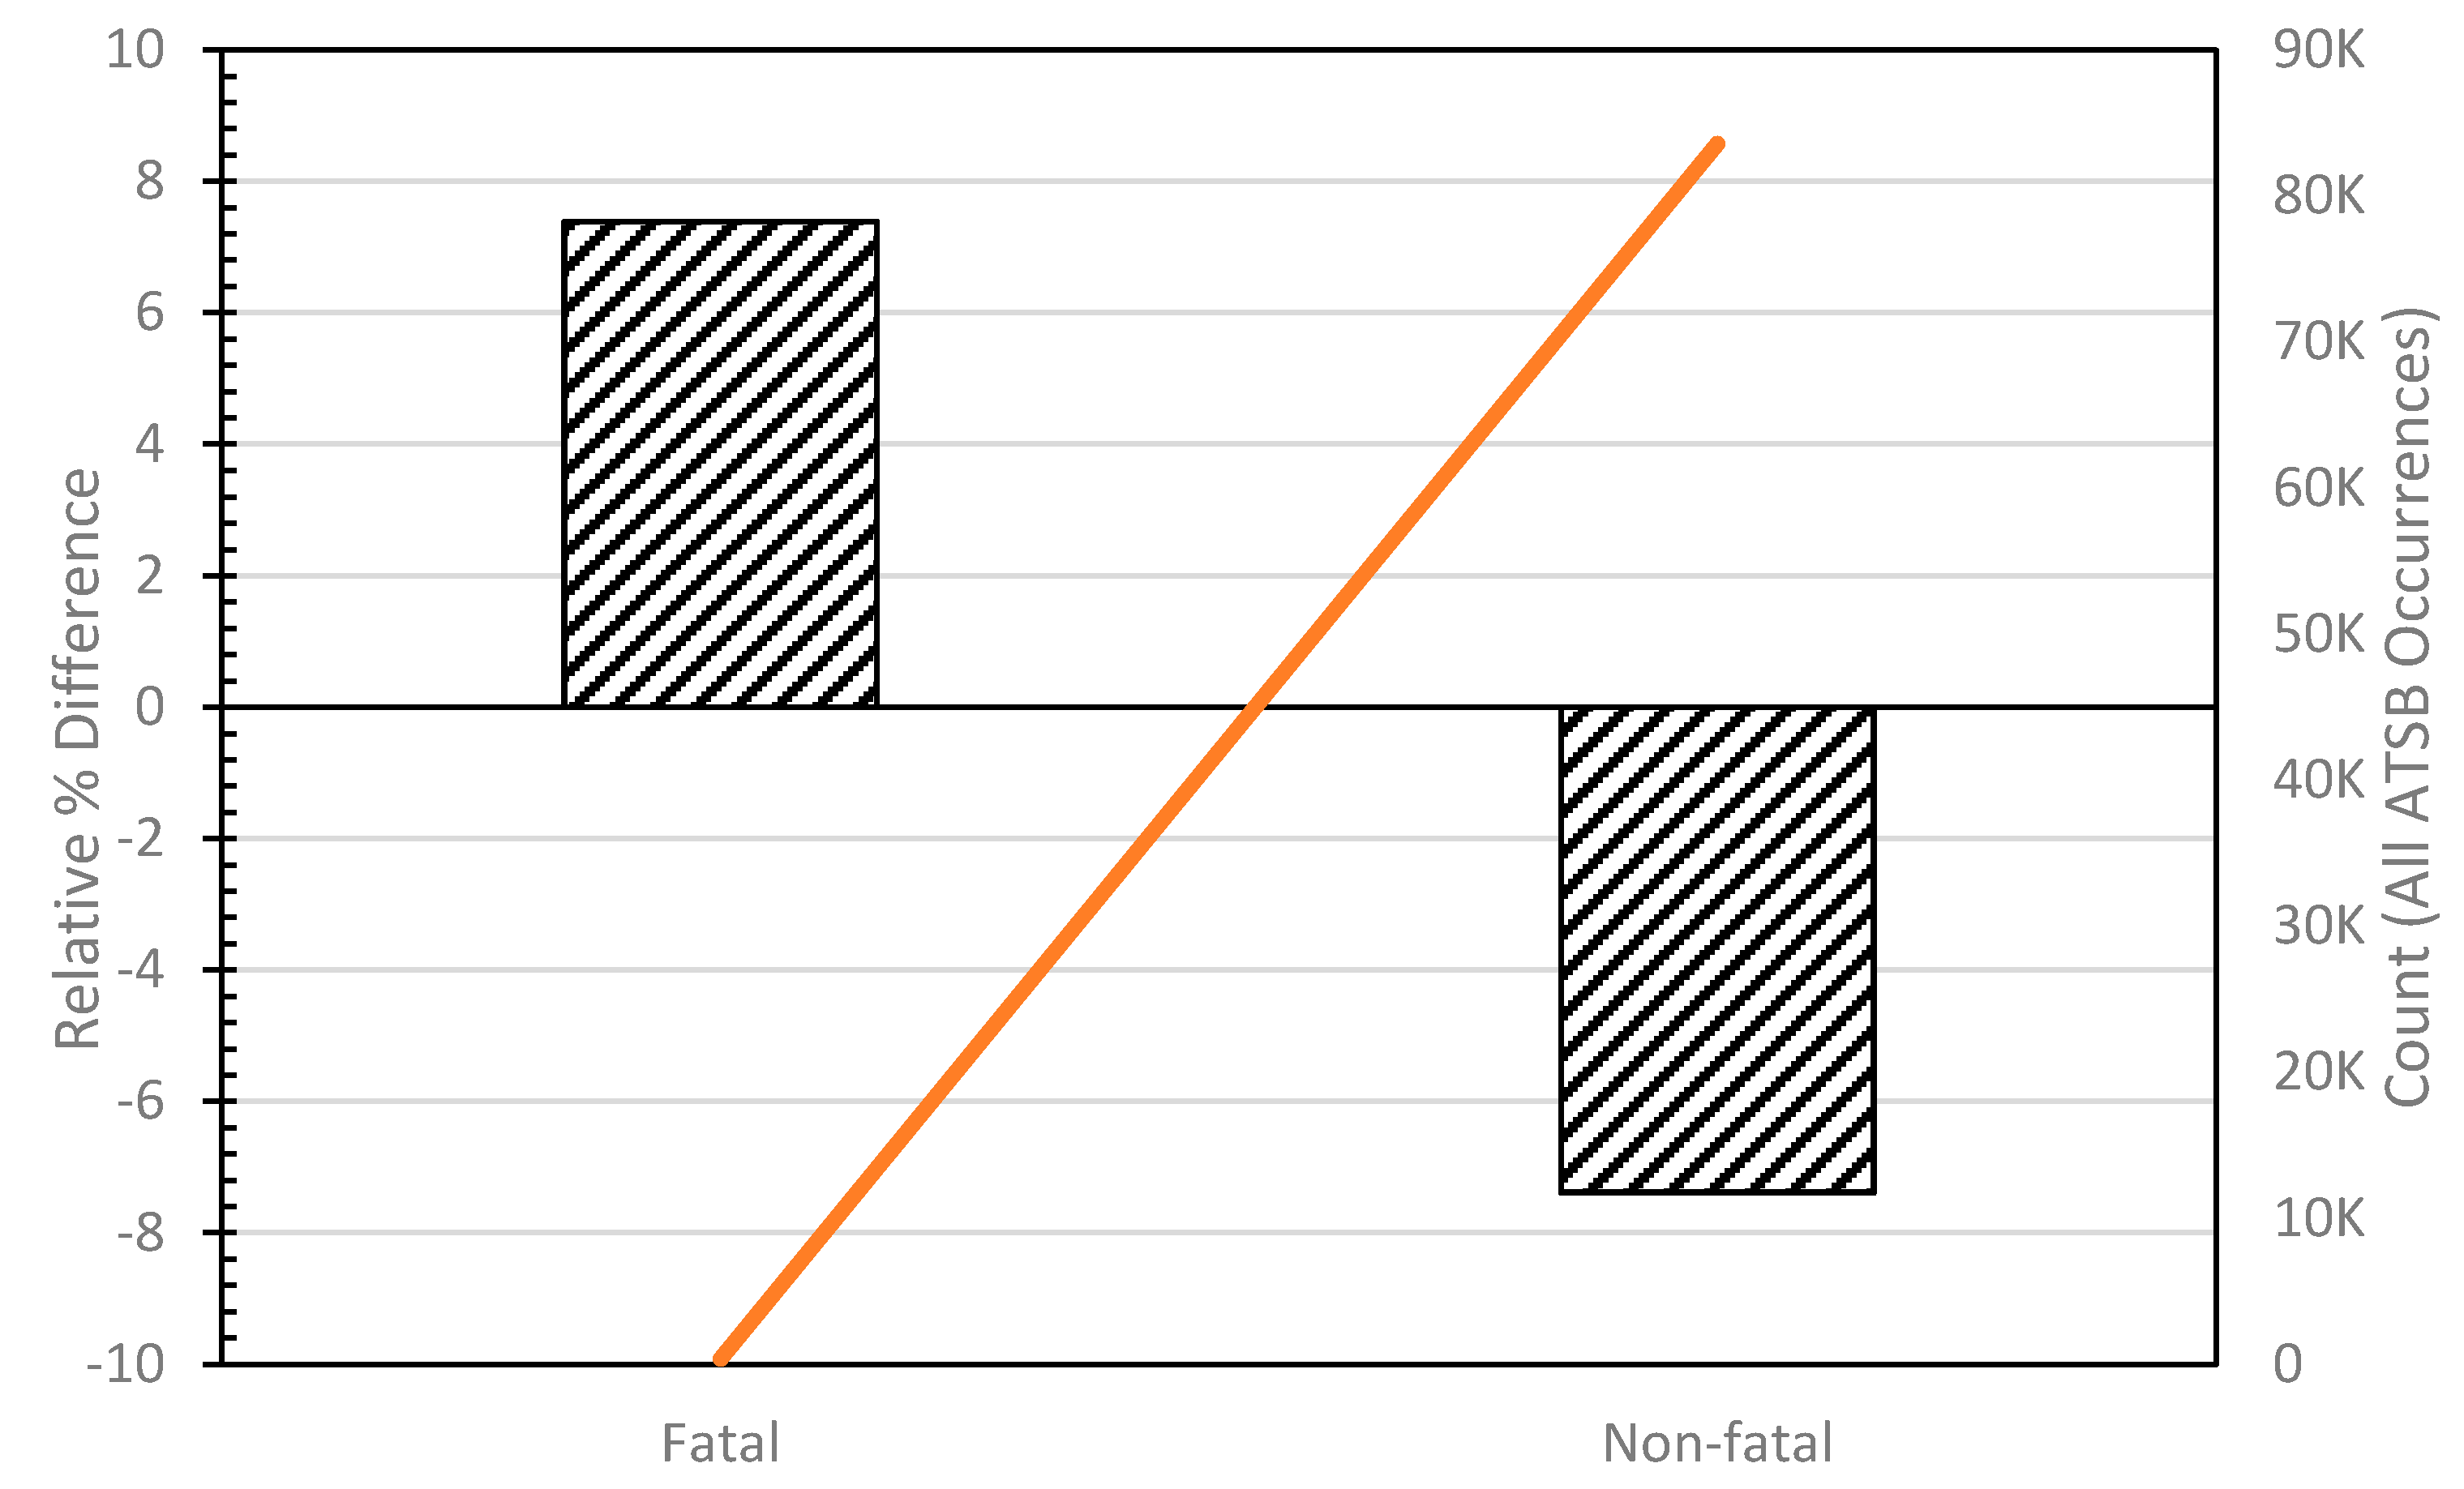
Figure 4 shows the relative percentage difference for proportion of occurrences that were fatal, and those that were not in comparing VFR2IMC occurrences to all ATSB-reported occurrences. For a random sample of 200 safety occurrences from the ATSB database, the expected number of fatal accidents in that sample would be slightly less than 1. For the VFR2IMC occurrences, there are 14 fatal accidents. The exact ratio of observed to expected occurrences is 17.5. That is, compared to all other types of occurrences together, a VFR2IMC occurrence is almost 18 times more likely to be fatal. This re-emphasizes the point in Section 5.2, that it is essential that additional efforts are taken to try and reduce VFR2IMC occurrences.

5.4. Aircraft Manufacturer

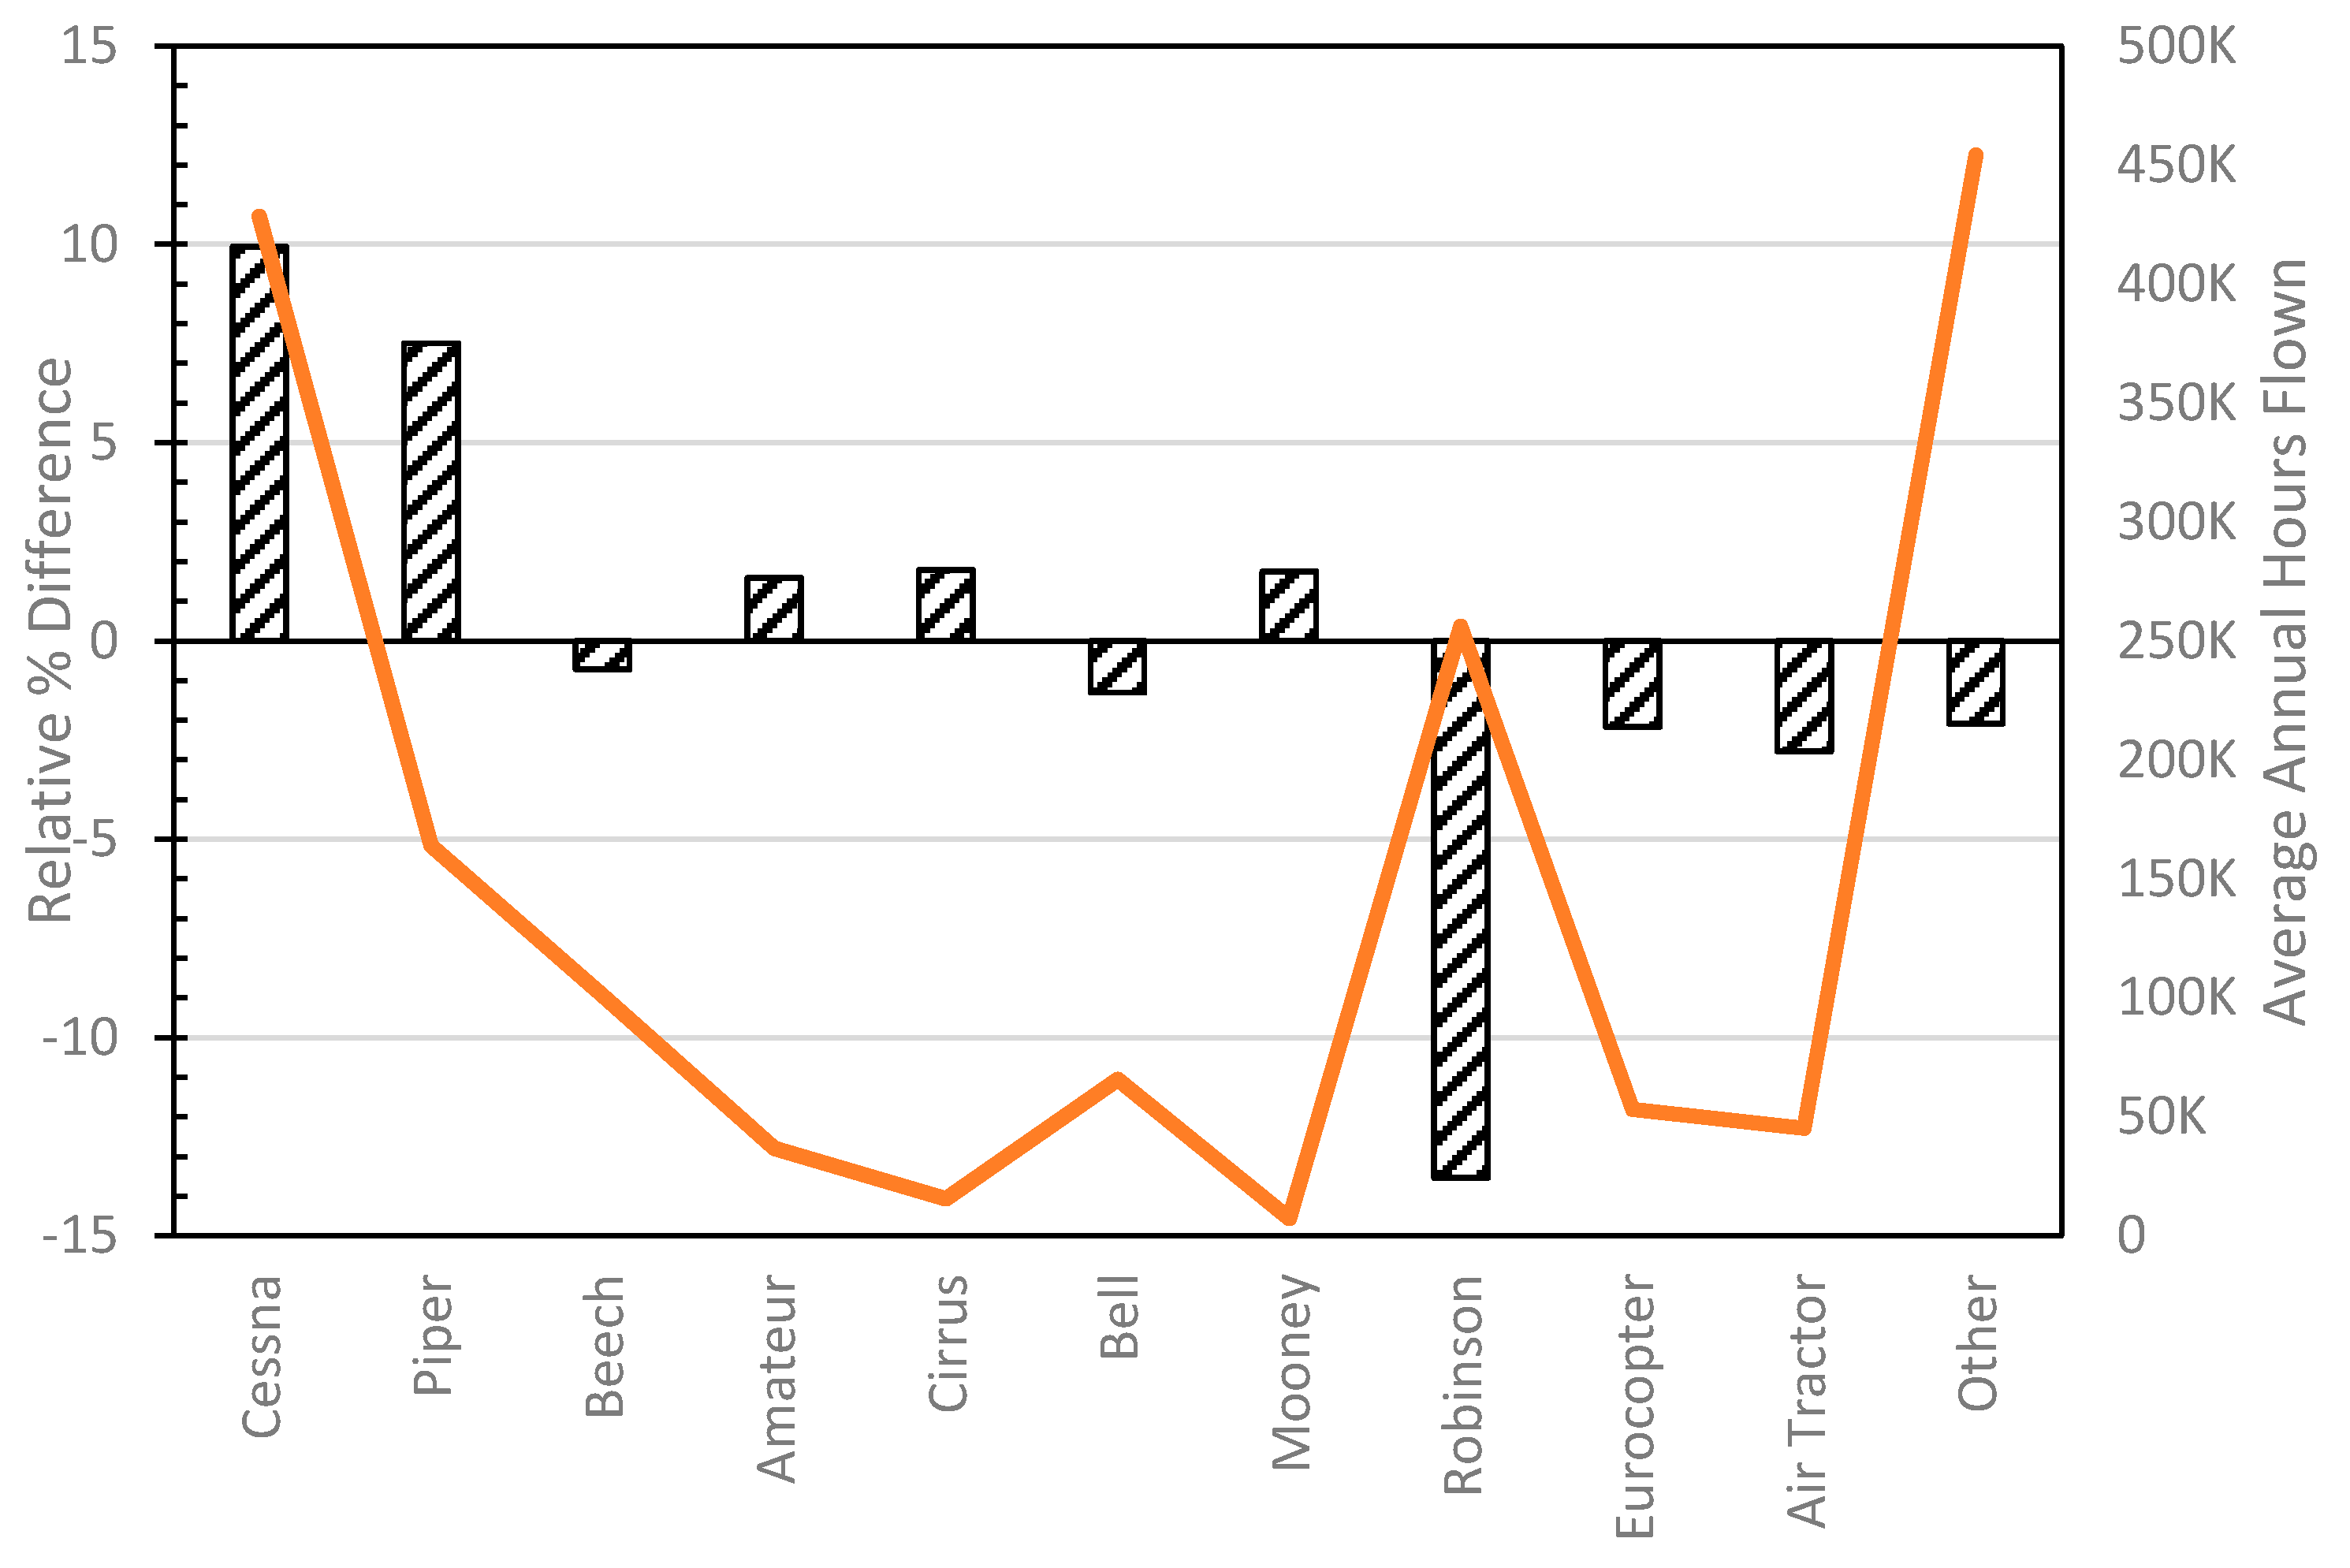
Figure 5 shows the relative percentage differences for the different aircraft manufacturers. As suspected by the qualitative results, there is a significant positive delta value associated with Cessna aircraft as well as Piper. Helicopter operations are also significant in Australia (in terms of the number of hours flown); however, the number of helicopters involved in VFR2IMC occurrences is significantly less than expected and, in particular, for Robinson helicopters, a workhorse in Australian aviation. Interestingly, while, there appeared to be an excess of investigated occurrences with Cessna and Piper aircraft in the qualitative section, when comparing all VFR2IMC occurrences to the number of hours each aircraft flies, there is still a peak for these two aircraft. This is likely due to the fact that these models are also popular with private owners.

5.5. Aircraft Operation

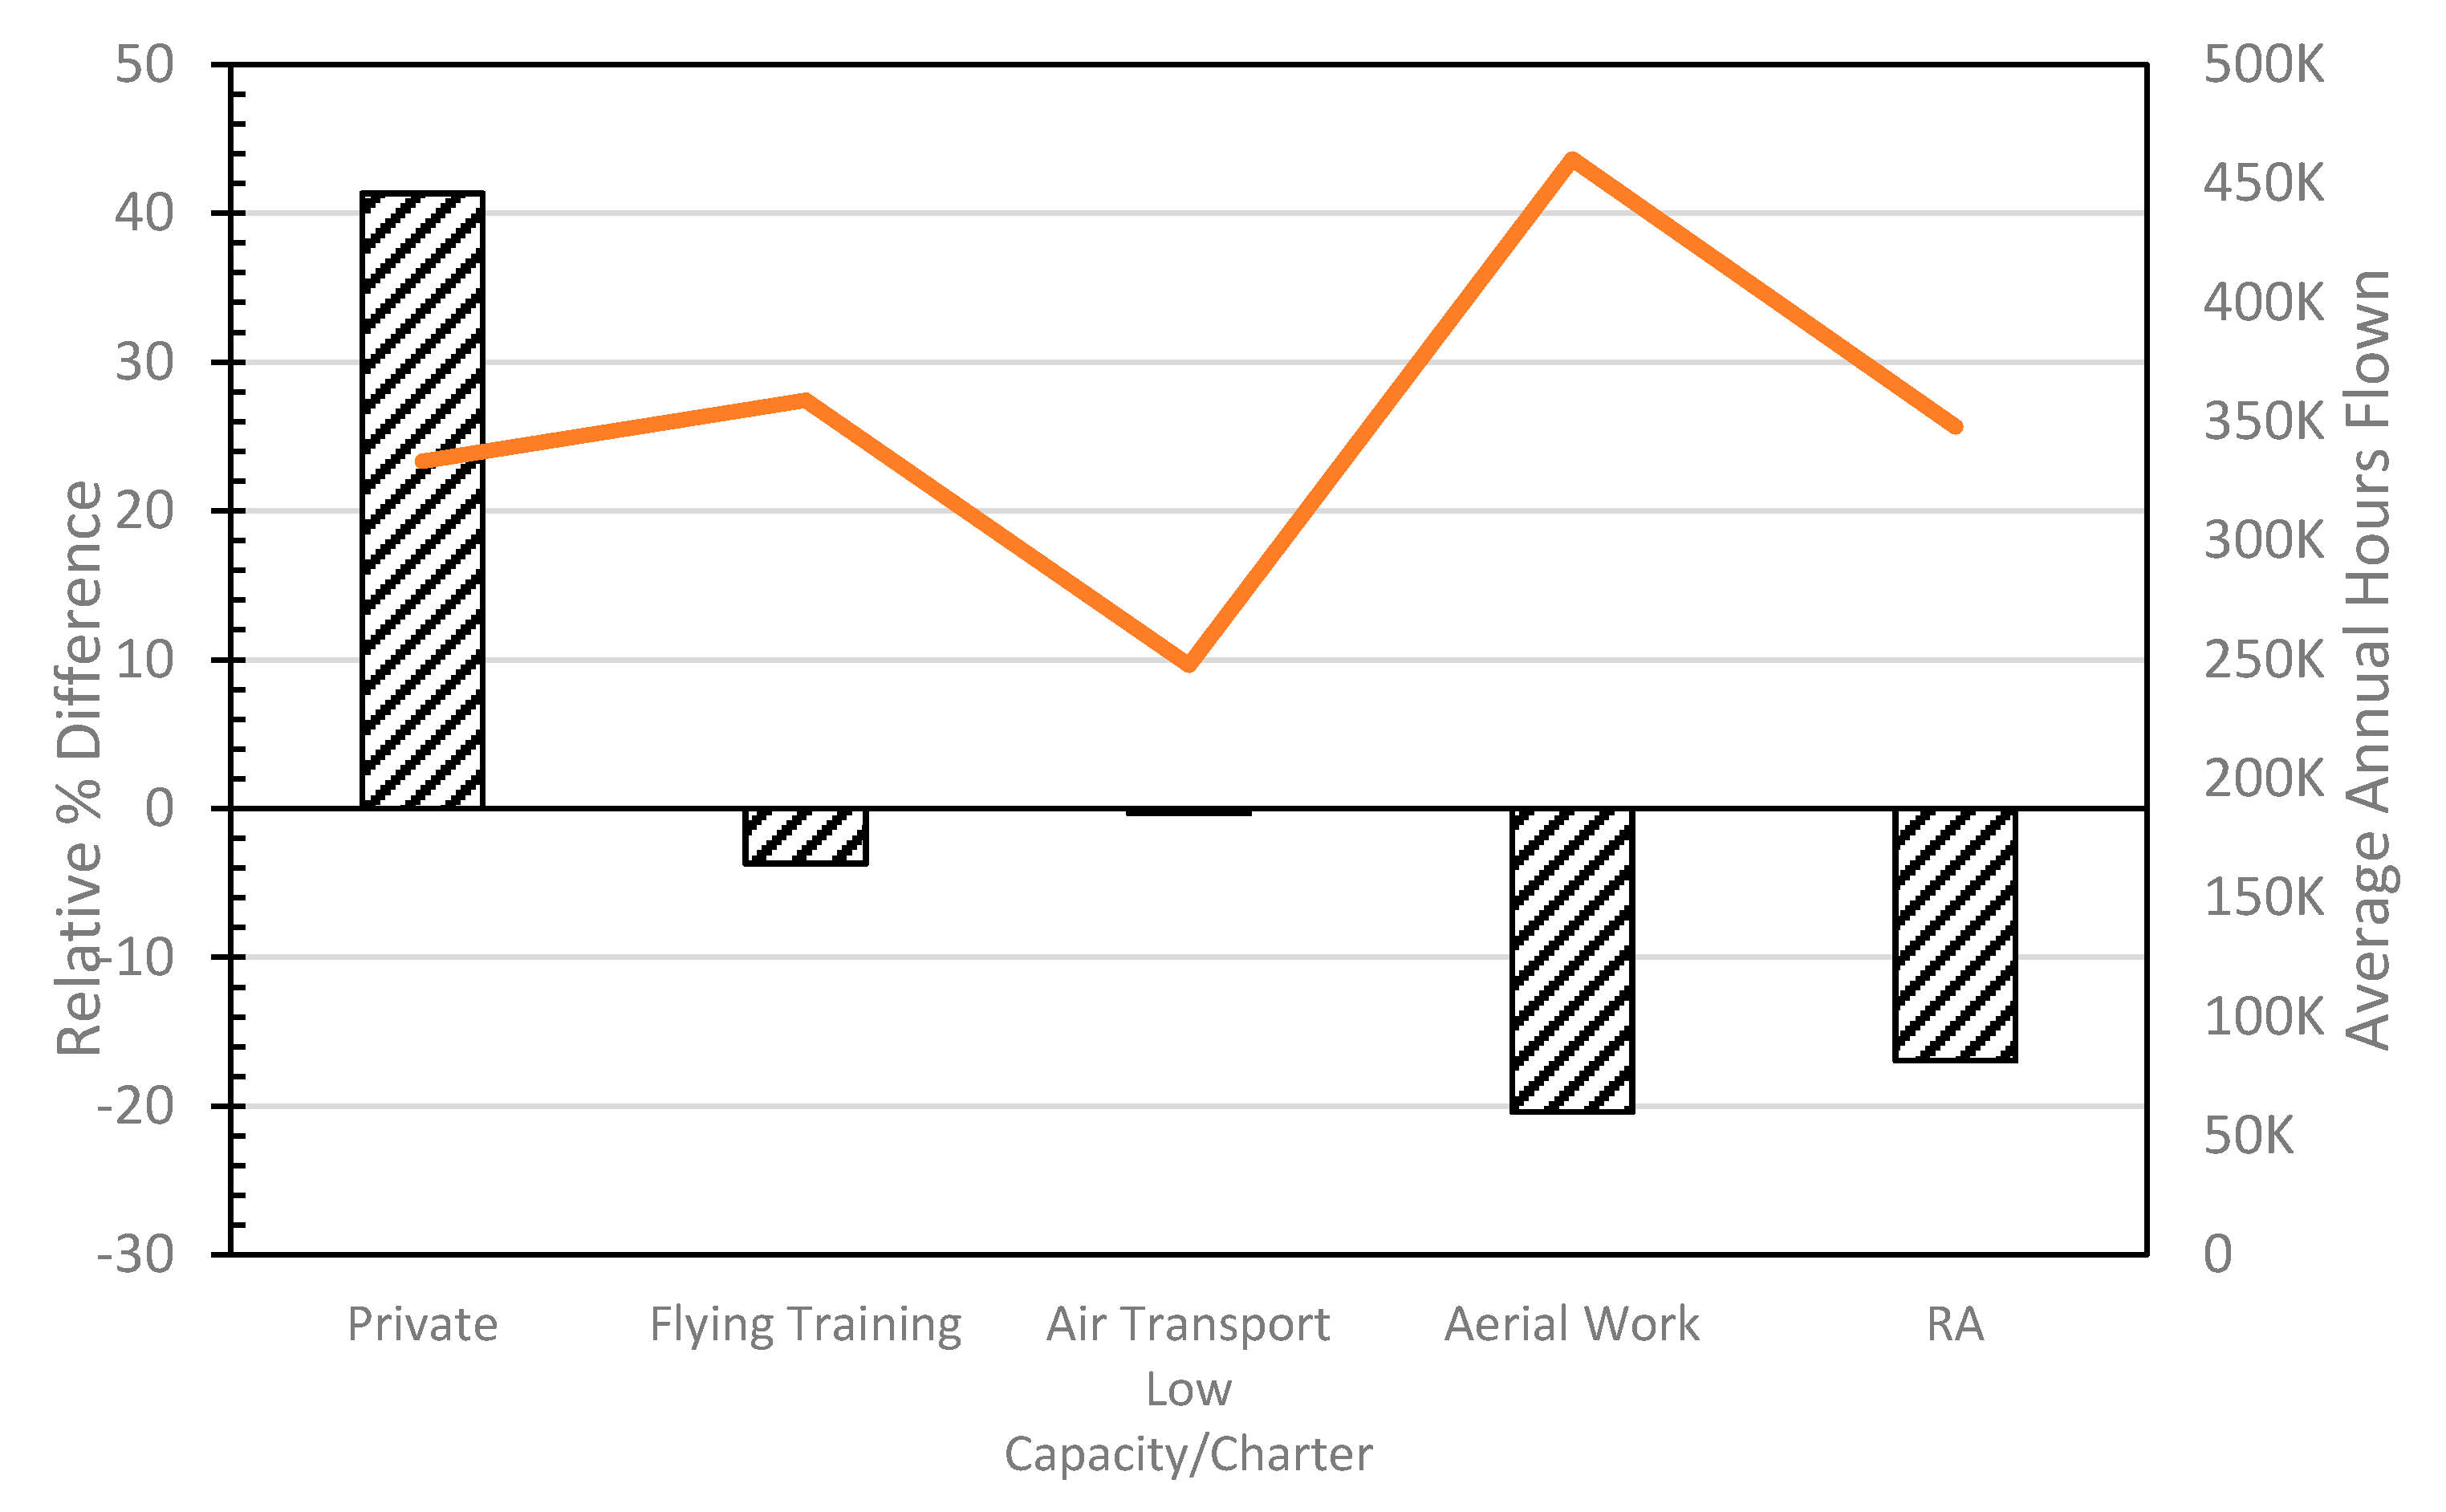
Figure 6 shows the relative percentage differences for the different types of aircraft operations. The only positive delta is given for private operations. That is, based on the relatively low number of hours in GA spent on private flying, the number of VFR2IMC occurrences is substantially higher than expected. For a sample of 200 random occurrences involving GA, only 23 should be associated with private flying, while for VFR2IMC, a third of the 196 occurrences (69) were for private flying.
Continuing from Section 4.1, it is possible to use the entire VFR2IMC population to compare the relationship between fatalness to the type of operation. Table 11 shows the observed data, and the expected data is in parentheses. Fisher’s exact test gives a p-value of 0.03, which is statistically significant at the 95% confidence level (note: Fisher’s exact test was require due to the requirements for a chi-squared test). Interestingly, the conclusion is the same: private operations are more likely to be fatal than expected, while charter and flying training are less likely to be fatal than expected.

5.6. Airspace

Figure 7 shows the relative percentage differences for the different airspace categories. It is not surprising that there is a positive delta for class G airspace, given this is where a significant proportion of GA activities occur. In addition, in controlled airspace around an aerodrome, it is easier to avoid VFR2IMC, with the added option to land.

5.7. Month

Figure 8 shows the relative percentage difference for VFR2IMC in each month. Figure 8 also shows the average total rainfall for Australia, used as the expected distribution. Significant negative delta values are seen for the summer months (associated with the wet season in Australia). Significant positive delta values correspond to winter months (associated with the dry season in Australia. Clearly Australia is a large country, with a diverse array of climates. However, the majority of aviation activities occur in subtropical and tropical areas (the exception being Perth, which is classic Mediterranean, however, for Western Australia, there is a spike in VFR2IMC occurrences in Jan, Feb, and Mar, corresponding to the local dry season in Perth). There are also oceanic climates which have a flat rain distribution across the months of the year, and the corresponding rates of VFR2IMC are also flat.
The other variable to consider is the volume of traffic in a given month. BITRE does not account for GA traffic on a monthly basis, only annually. Hence, to determine the monthly GA traffic, the total monthly movements reported by Airservices Australia was used as the total, and from this, the total regular passenger transport (RPT) traffic (which is reported monthly by BITRE) was subtracted; the difference between total traffic and RPT is GA). This was done for 2015 to 2018 (the data available from Airservices and BITRE) and averaged across the 4 years. This data is in essence flat across the year from month to month (not plotted), with a 4.5% average variation. If the traffic does not vary across the year, then the variations in VFR2IMC occurrences observed are not related to traffic. This flat traffic distribution suggested another variable was of interest and, hence, the reason rainfall as a dummy variable for weather has been used.

5.8. Trend over Time

Figure 9 shows the number of VFR2IMC occurrences each year from 2003 to 2019. It should be noted that over this same period of time, the total number of h flown in GA has remained constant (2.1 ± 0.1) million h each year. In Figure 9, the high degree of scatter in the data is clear, and the low value of the correlation coefficient indicates that there is no trend. The result of the t-test for the correlation coefficient is a p-value of 0.21 and, as such, there is no correlation between the number of occurrences and the year. That means, the number of VFR2IMC occurrences have not decreased even though initiatives have been implemented in an attempt to address the issue.

6. Contributing Factors

6.1. Overconfidence

While private pilots have been deemed competent to fly by the regulators through training, ground examinations, and a flight test, they typically do not advance to the stage of obtaining an IFR rating. The over representation of these pilots flying into IMCs when on a VFR flight may be due to the Dunning–Kruger effect, whereby they overestimate their flying skills and decision making when faced with deteriorating weather conditions during their flight. The pilot’s overconfidence leads them to flying through cloud or poor visibility in the expectation they will “pop-out” on the other side of the cloud into better weather and that their flying abilities are such that they can handle the loss of visual cues and maintain the aircraft in an upright attitude. Hunter et al. [33] confirms this in the finding that respondents who had actually flown into IMCs had also a greater history of other hazardous events in their flying careers—it is not just flights in poor weather conditions where the overconfidence is displayed.
Overconfidence by inexperienced operators across other sectors has long been noted in the literature. Keren noted how inexperienced bridge (cards) players had an overinflated confidence in their ability to win as compared to expert bridge players [39]. Keren noted that as well as overconfidence, the inexperienced players believed that the play of the cards would follow an assumed optimal pattern that left no room for vagaries of opposition players or any other variables in the playing of the cards. Much in the same way, the inexperienced pilots proceeding from VFRs into IMCs may have a belief that the flight will follow a predictable pattern—a pattern that the inexperienced overconfident pilot believes is predictable—and, thus, they will survive the flight into IMCs. Hunter’s et al. survey of pilots who had entered IMCs from VFRs found that nearly a third of these pilots did so deliberately and 13% of these pilots chose to enter IMCs because they thought they could handle it [33].
During a flight between two locations in New South Wales in 2012, a C182 was faced with a lowering cloud base, and before reaching the destination, that aircraft flew into terrain (CFIT accident) at an elevation that was above the cloud base [40]. The pilot held a private license and had approximately 300 h experience (the pilot logbook was presumed to have been lost in the accident). Although the cloud base at the departure aerodrome was at 12,000 feet above ground level, the pilot learned through a conversation with a friend based at the destination aerodrome that the meteorological conditions closer to the destination would probably prohibit VFR flight. The pilot decided to depart based on a decision to turn around should the conditions get too bad for VFR flight. Keren suggested that the overconfidence levels of the inexperienced card players may have arisen from the mental models of the situation and that these models are built up from past experiences [39]. The pilot’s overconfidence in his abilities to be able to cope with deteriorating conditions during the accident flight was buttressed by having flown regularly in the area. Witness statements indicate that the cloud base was lower than the impact point and, thus, as the cloud based lowered, the pilot was forced to fly at an ever-lower altitude until he flew into cloud and impacted the terrain [40].
Another example of overconfidence in ability is illustrated by a flight into Sunshine Coast Airport in ever-worsening meteorological conditions [41]. As the weather became worse and the aircraft was getting closer to these conditions, air traffic control (ATC) provided other options for the pilot to follow to avoid the bad weather at the aerodrome. However, the pilot continued the flight, descending ever lower to avoid the cloud and rain. After the aircraft entered, the aerodrome circuit ATC lost visual contact with the aircraft and contact was not re-established until the aircraft was on short finals. Despite the extremely poor conditions, the pilot was able to successfully land the aircraft. This pilot’s overconfidence was supported again by familiarity with the locality and technology with 2 GPS and 2 iPads with planning software onboard the aircraft.

6.2. Categorization

One example of the probabilistic approach with less strongly developed exemplars is the crash of a helicopter onto Fox Glacier in the South Island of New Zealand in 2015 [42]. The purpose of the flight had been to take the passengers up the glacier for sightseeing purposes. The pilot landed on a shelf towards the top of the glacier allowing the passengers to get out and walk around. On leaving the shelf to return to base at the foot of the glacier, the helicopter, at a level attitude with but a high rate of descent, impacted with the glacier, killing all six passengers and the pilot. On the day of the accident flight, the weather was changeable, with snow at times, and often below minima. At the start of the day, there was reduced visibility and the glacier was shrouded in cloud. Flights planned for early in the day had been cancelled due to the weather conditions. This would seem to be a strong exemplar that the pilot could easily recognize through his own previous experience, as well as the experience of other pilots in the vicinity who cancelled flights due to the weather conditions. As the morning progressed, there was an improvement, and photographs from a webcam show a lifting of the cloud base higher up the glacier. The decision to fly could have been influenced by what Jensen [43] describes as “anchoring”. People use a datum or anchoring point to which they measure against when making decisions. For weather-based decisions, this anchoring point can often be previous weather conditions rather than set minima—whether the minima be set by the regulator, the organization for which the pilot flies, or personally set minima. It would seem as if the weather was improving. If there had been CAVOK conditions in the lead-up to the day of the flight and then the cloud base had lowered to the levels present at the time of the flight, the measure against the anchoring point of fine weather of the deteriorating conditions may have caused the pilot to cancel the accident flight. For the pilot in the accident flight, the lifting of the cloud meant there was an improvement in conditions and, thus, he could go flying. The exemplar of the lower cloud base had now become fuzzy, or less certain. Whilst there were VFR conditions at the base from which the flight departed—and conditions were above both the legal minima and the organization’s minima [42]—the changeable cloud conditions at the higher levels of the glacier made it difficult for the pilot to perceive and pattern-match the cues in the environment with the possibility of proceeding from VFRs into IMCs. After allowing the passengers to walk on the glacier, the report states that “the pilot would have been unlikely to take off if conditions of reduced visibility were present in all directions. It is very unlikely that the pilot would have intentionally entered cloud after takeoff. However, the weather was marginal, and conditions were fluctuating quickly [42]. The report could not definitively determine that the pilot entered IMCs, but the effects of poor weather conditions such as cloud, precipitation, flat light conditions, or condensation on the windscreen contributed to the accident occurring (p. 1). The pilot appears to have been unable to match the existing environmental cues with those of his pre-existing stored exemplar.
As Clewley and Nixon summarize, environments that have been previously experienced and are typical provide a “relatively friendly situation to which pilots are well adapted” [30]. The exemplars arising from the familiar and typical situations may be tightly defined, and if there is a significant variation from the usually experienced, the new situation will “prompt alarm, and response protocols may become vulnerable” (p. 11).

6.3. Personal Standards

The ATSB in their educational brochure offers support for all pilots on the dangers of VFR flights continuing into IMCs, suggesting that all pilots, no matter their level of experience, set personal minima for their flying, including meteorological limits [44]. A FAA-sponsored training program sought to inculcate, in pilots, the need to establish the risk factors for each flight and the setting of personal minima before accepting the identified risks [32]. The researchers, like the ATSB, believed in the strength of personal minima as against those externally imposed, and this was supported by the participants in the training program, with 82% saying they use personal minima in preflight decision making. Additionally, the setting of personal minima was not found to be a difficult task, with over 90% of the training program participants declaring it to be an easily understood concept [32]. Unfortunately, Hunter et al. found that the setting of personal minima amongst the group of pilots who had flown from VFR into IMCs were “too liberal” (p. 183) when compared to groups of pilots who had not entered IMCs [33].
Despite the importance of personal minima, the Dunning–Kruger effect may be blinding pilots to recognizing that not only do they not have the required degree of flying skills, but also to the fact that they do not have the knowledge to evaluate their performance, including the important requirement of obtaining accurate, up-to-date weather forecasts and reports.

7. Discussion

7.1. Findings

A key difference between the results found in this study and previous literature is that pilot experience did not positively influence VFR2IMC occurrences. Specifically, the proportion of occurrences associated with pilots with over 500 h of experience was much higher than all the other experience categories. This contradicted the proposed research hypothesis that flight experience should have a positive influence. Previous research [3] reported the proportions expected for 2000–5000 h was 11.7%, while this dataset had 26% of occurrence at this level of experience. CASA notes that Australia has less risk due to weather and low values for lowest safe altitudes. As such, greater overconfidence could be present in Australian pilots.
Previous work also showed that pilots with less than 250 h accounted for 23.4% of occurrences. Based on this, it was hypothesized that student pilots and training operations would specifically be more likely to result in inadvertent flight into IMCs. All commercial operations actually had negative delta values, indicating that relative to the number of hours flown, the number of occurrences were less than expected. Only private operations showed an observed value greater than expected, indicating that VFR2IMC is a greater concern for private operations and is associated with poor planning and preflight preparation.
The final research hypothesis posed was that the type of aircraft would not influence the likelihood of VFR2IMC. This was not found to be the case, with Cessna and Piper aircraft being more likely to be involved in these occurrences, and Robinson helicopters less likely to be involved. It is not expected that aircraft type is in some way directly correlated with VFR2IMC and, rather, that there is a confounding variable responsible for the observed association. This is discussed further below in the assumptions and limitations.
There are a number of novel findings that have not previously been presented in the literature. The first of this is the association between VFR2IMC occurrences in months with less average rainfall. This result, supported by the lack of proper preflight planning using NAIPS by many pilots, is related to familiarity and overconfidence. The assumption that pilots make is that the weather now will be the weather later, and the time of year is associated with good weather. As such, flights are undertaken with no expectation to encounter inclement weather, meaning the pilots are unprepared for the situation. This overconfidence and familiarity would also make it more likely for pilots to assume the weather system or cloud is localized and, therefore, the extant of the threat is not appreciated.
The most crucial finding concerns the actions taken by pilots. While in Section 4.3 (Table 6), it is noted that continuing on is more likely to result in a fatal outcome, the key question to ask is what happened in the cases that were not fatal; more specifically, what happened in the occurrences that did not result in an accident (crash and/or fatality)? These 9 occurrences fall into two broad categories. The first (3 cases) is that the pilot held an IFR rating. The more interesting cases are those that are coded as “support”, which occurred in 7 of the 9 occurrences. Here, support was sought and given from either other pilots in the area or ATC, to help talk the pilot through the situation. This will be discussed further below in recommendations.

7.2. Assumptions and Limitations

There are a number of other factors that would have been interesting to code from the accident reports. Two demographics, gender and age, would have been interesting to determine if male pilots were more likely to engage in the risky behavior of continuing on into IMCs, and how age moderated the choice. Unfortunately, the reports did not provide sufficient data to test either of these hypotheses. Similarly, many of the factors investigated in the qualitative study could not be explained with a quantitative study as the data were not sufficient due to a lack of detailed information.
A crucial assumption made is that the data from the ATSB database are complete and correct. It should be noted that, according to the European Spreadsheet Risks Interest Group, over 90% of spreadsheets contain an error [45]. Most of these errors are associated with mathematical operations, resulting in computational errors. The ATSB data is presented as a spreadsheet as extracted from their database. Assuming the data are entered faithfully, it should then be accurately reproduced.
As previously mentioned, it is assumed that the sample of investigated occurrences is random. The ATSB sets out priority guidelines, and it is interesting to note that as an ongoing issue, which primarily involves private operations, VFR2IMC does not fall under the aviation broad hierarchy which reflect the priorities for investigation. As such, it is reasonable to assume that no systematic bias exists to investigate one type of VFR2IMC occurrence over another.
There is a limitation with regards to the aircraft manufacture. The current dataset does not account for the confounding effect between aircraft manufacturer and type of operation. In private operations, the common status of Cessna and Piper aircraft mean they are far more likely to be involved in private operations. It is assumed that if this confounding influence was factored into a measure of association, then the differences observed in aircraft manufacturer would be accounted for by differences in the type of operation.
Potentially the most interesting limitation to note in this work is the HFACS framework. While being an “industry standard” in aviation, for VFR2IMC, which is a significant issue in private operations, there are little to no failures that can be attributed to “unsafe supervision” and “organizational influences”, as these are not applicable in private operations. There are many directions this discussion could proceed in, for example, the view of the regulator as a supervisory organization, the need for private pilots to peer supervise, and many more.

7.3. Recommendations and Future Work

Although education efforts continue to try and reduce the number of VFR2IMC occurrences, the numbers suggest that they are not decreasing. Standard recommendations for inadvertent flight into IMCs already make it clear what the preventative and corrective actions should be. Pilots should always carry out a detailed review of weather and establish suitable minima, and weather conditions should be monitored throughout the flight. As conditions deteriorate, turning back should always be the first action. When stuck in IMC, a mayday radio call should be used, implementing the three “C’s” of contact, confess, and comply. The best way for these findings to be used is for the safety authority to utilize case reports in safety publications where pilots share their safe recovery accounts. The new findings from this work that pilots need to be mindful of, is the fact that occurrences are more likely in months where rain is not expected.
Future work is planned to understand the fatalness of all safety occurrences in aviation and how VFR2IMC fits in and compares with all types of occurrences. Following this work, the key question posed is which types of aviation safety occurrences in Australia are more fatal than VFR2IMC.

8. Conclusions

Prior studies have reported quantitative data that is from before 2013 [46], and almost exclusively in the US context [3,9,17,46,47]. In this work, we have reviewed Australian aviation safety occurrences over a 17 year timeframe, which facilitates a continuation of the work previously reported in Australia from 1976 to 2003 [20].
In terms of both the type of occurrence (accident or incident) and the fatalness of those occurrences, first and foremost, we note similar trends to all of the previous studies. If VFR2IMC occurs, then it is disproportionately more likely to result in an accident and to end fatally. The specific numbers for Australia from 2003 to 2019 are 10.2% of VFR2IMC occurrences are accidents, compared to 3.5% of all occurrences in the ATSB database for the same period and, more extremely disproportionally, 75% of VFR2IMC accidents are fatal accidents, compared to 12.4% for all accidents in the ATSB database for the same period.
When looking at the type of operation, private aviation activities are more likely to be involved in VFR2IMC occurrences. The number of reported occurrences was 3 times more than expected relative to the number of hours flown in each type of activity. As such, aerial work operations had significantly less occurrences of VFR2IMC relative to the number of h flown, at over 4 times less than expected. These results both influenced the aircraft that are associated with VFR2IMC occurrences. That is, those aircraft more typically owned and operated in private aviation activities were more likely to be involved in VFR2IMC occurrences, specifically, Cessna and Piper aircraft, accounting for almost 1.5 times more occurrences than expected relative to the number of hours flown. Similarly, for the Robinson helicopter, which is used extensively in aerial work in Australia, it had almost 8 times less occurrences than expected relative to the number of hours flown. It is important to note here that no direct influence of the aircraft is expected to account for the likelihood of VFR2IMC occurrences.
Even though the type of license had no significant link with fatalness, the type of rating held was associated with fatalness; specifically, holding only a night VFR rating was associated with an increased likelihood of a fatal occurrence. That is, of the 5 accidents where the “highest” rating held by the pilot was a night VFR rating, 4 of these ended fatally, that is, 80%; by contrast, for pilots with neither a night VFR nor an instrument rating, approximately 53% of these accidents ended fatally. The most interesting finding, which is in contrast to some previously published results, is that there was a clear association with the likelihood of a VFR2IMC occurrence, and the more flight experience a pilot had. That is, there were more accidents where the pilot had in excess of 5000 h of flight experience than when the pilot only had double-digit values for h of flight experience.
Environmental hazards (clouds, terrain, and cloud with rain) were a strong indicator not only of the frequency of accidents, but also of fatalness. The action a pilot takes when encountering IMC conditions, particularly the action to continue into IMCs, led to more accidents and fatalities. This finding is associated with the HFACS analysis which showed that errors (clearance, altitude/clearance, aircraft control) and violations occur with slightly greater frequency with fatal occurrences than non-fatal occurrences. A final contributing factor relates to preflight planning. Pilots who used NAIPS to access weather data had greatly reduced chances of experiencing a VFR2IMC occurrence, while those that did not use NAIPS were more likely to experience a fatal occurrence. Combining all the conclusions, the primary combination of factors likely to result in a fatal VFR2IMC occurrence are encountering cloud with rain, having undertaken no correct and thorough preflight weather assessment, for a flight over elevated rough terrain with trees, then not immediately turning around (and potentially climbing), and not making a mayday call to support this action.
The yearly count is significant to consider. In the study by Batt and O’Hare [20], there were 491 total occurrences in the ATSB database from September of 1976 to March of 2003. This gives 18.5 occurrences a year during a period in time where aviation was growing (7041 registered aircraft in 1979, growing to 16,900 registered aircraft in 2000). However, looking at recent traffic data, we note the aviation industry has stagnated, if not declined, in terms of hours over the last several years. Hence, while there is a reduction from 18.5 occurrences per year between 1976 and 2003, to 11.5 occurrences per year between 2003 and 2019, there has been no noticeable reduction in occurrence per year since 2003. Looking at the BITRE traffic data, total flying hours increased from 1985 to 1999, spiked up in 2005, and has remained constant around 3.5 million hours since then. As such, even when factoring in the total number of h flown over the periods of time, there has been no reduction on VFR2IMC occurrences in the last 15 years. Noting that the old ATSB data is not available, it would still be reasonable to assume that Batt and O’Hare would have noted that per flying hour, the number of occurrences decreased from 1976 to 2003.
Pilots should have requisite experience and qualifications to meet the minimum standards in Australia. However, the study shows that pilots with VFR night ratings were more likely to experience fatal occurrences, implying that even though pilots make an accurate assessment of the hazard situation, their decision to continue flight into adverse weather conditions was a result of overconfidence in their ability and unrealistic optimism about being able to control the aircraft and avoid personal harm.

Author Contributions

Conceptualization, A.A. and G.W.; Data curation, A.A., J.M. and G.W.; Formal analysis, J.M. and G.W.; Investigation, A.A. and J.M.; Methodology, G.W.; Project administration, A.A.; Supervision, A.A.; Validation, J.M.; Visualization, G.W.; Writing—original draft, A.A.; Writing—review & editing, J.M. and G.W. All authors have read and agreed to the published version of the manuscript.

Funding

This research received no external funding.

Acknowledgments

We acknowledge the support of the Australian Transport Safety Bureau for the free use of their database, and providing additional details when requested.

Conflicts of Interest

The authors declare no conflicts of interest.

References

  1. Ahlstrom, U.; Ohneiser, O.; Caddigan, E. Portable Weather Applications for General Aviation Pilots. Hum. Factors 2016, 58, 864–885. [Google Scholar] [CrossRef] [PubMed] [Green Version]
  2. Blickensderfer, E.L.; Lanicci, J.M.; Vincent, M.J.; Thomas, R.L.; Smith, M.; Cruit, J.K. Training General Aviation Pilots for Convective Weather Situations. Aerosp. Med. Hum. Perform. 2015, 86, 881–888. [Google Scholar] [CrossRef]
  3. Major, W.L.; Carney, T.; Keller, J.; Xie, A.; Price, M.; Duncan, J.; Brown, L.; Whitehurst, G.R.; Rantz, W.G.; Nicolai, D. VFR-into-IMC accident trends: Perceptions of deficiencies in training. J. Aviat. Technol. Eng. 2017, 7, 4. [Google Scholar] [CrossRef]
  4. Aircraft Owners and Pilots Association. VFR into IMC Accidents. Available online: http://www.aopa.org/asf/ntsb/vfrintoimc.cfm?window=1 (accessed on 1 January 2020).
  5. National Transportation Safety Board. Risk Factors Associated with Weather Related General Aviation Accidents; U.S. National Transportation Safety Board: Wachington, DC, USA, 2005. [Google Scholar]
  6. Wilson, D.R.; Sloan, T.A. VFR flight into IMC: Reducing the hazard. J. Aviat. Aerosp. Educ. Res. 2003, 13, 9. [Google Scholar] [CrossRef] [Green Version]
  7. Shappell, S.; Detwiler, C.; Holcomb, K.; Hackworth, C.; Boquet, A.; Wiegmann, D.A. Human Error and Commercial Aviation Accidents: An Analysis Using the Human Factors Analysis and Classification System. Hum. Factors 2007, 49, 227–242. [Google Scholar] [CrossRef]
  8. Andrzejczak, C.; Karwowski, W.; Thompson, W. The Identification of Factors Contributing to Self-Reported Anomalies in Civil Aviation. Int. J. Occup. Saf. Ergon. 2014, 20, 3–18. [Google Scholar] [CrossRef] [PubMed] [Green Version]
  9. Detwiler, C.; Holcomb, K.; Hackworth, C.; Shappell, S. Understanding the Human Factors Associated with Visual Flight Rules Flight into Instrument Meteorological Conditions; Federal Aviation Administration, Civil Aerospace Medical Institute: Oklahoma City, OK, USA, 2008. [Google Scholar]
  10. Hjelkrem, O.A.; Ryeng, E.O. Chosen risk level during car-following in adverse weather conditions. Accid. Anal. Prev. 2016, 95, 227–235. [Google Scholar] [CrossRef]
  11. Naik, B.; Tung, L.-W.; Zhao, S.; Khattak, A.J. Weather impacts on single-vehicle truck crash injury severity. J. Saf. Res. 2016, 58, 57–65. [Google Scholar] [CrossRef]
  12. Liu, X.; Saat, M.R.; Barkan, C.P.L. Analysis of Causes of Major Train Derailment and Their Effect on Accident Rates. Transp. Res. Rec. 2012, 2289, 154–163. [Google Scholar] [CrossRef]
  13. Changnon, S. Railroads and Weather: From Fogs to Floods and Heat to Hurricanes, the Impacts of Weather and Climate on American Railroading; American Meteorological Society: Boston, MA, USA, 2013. [Google Scholar]
  14. Weng, J.; Yang, D. Investigation of shipping accident injury severity and mortality. Accid. Anal. Prev. 2015, 76, 92–101. [Google Scholar] [CrossRef]
  15. Ventikos, N.; Koimtzoglou, A.; Louzis, K.; Eliopoulou, E. Statistics for marine accidents in adverse weather conditions. In Proceedings of the 2nd International Conference on Maritime Technology and Engineering, Lisbon, Portugal, 15–17 October 2014; pp. 243–251. [Google Scholar]
  16. Kulesa, G. Weather and aviation: How does weather affect the safety and operations of airports and aviation, and how does faa work to manage weather-related effects? In Proceedings of the Potential Impacts of Climate Change on Transportation Workshop, Washington, DC, USA, 1–2 October 2003; pp. 199–208. [Google Scholar]
  17. Goh, J.; Wiegmann, D.A. Visual flight rules (VFR) flight into instrument meteorological conditions (IMC): A review of the accident data. In Proceedings of the 11th International Symposium on Aviation Psychology, Columbus, OH, USA, 5–8 March 2001. [Google Scholar]
  18. Kenny, D.J. 24th Joseph T. Nall Report: General Aviation Accidents in 2012; Aircraft Owners and Pilots Association: Frederick, MD, USA, 2015. [Google Scholar]
  19. Transportation Safety Board of Canada. Report of a Safety Study on VFR Flight into Adverse Weather; 90-SP002; Transportation Safety Board of Canada: Gatineau, QC, Canada, 1990. [Google Scholar]
  20. Batt, R.; O’Hare, D. General Aviation Pilot Behaviours in the Face of Adverse Weather; Australian Transport Safety Bureau: Canberra, Australia, 2005. [Google Scholar]
  21. Gallo, M.A.; Alhallaf, H.; Baran, S.; Cremer, I.; Finn, C.; Maharaj, I.; Ozyurek, A.S.; Peker, A.E.; Reese, B.; Tuncman, I. Inadvertent VFR-into-IMC Flights: A Qualitative Approach to Describing GA Pilots’ First-Hand Experiences. Coll. Aviat. Rev. Int. 2018, 33. [Google Scholar] [CrossRef] [Green Version]
  22. O’Hare, D.; Smitheram, T. ‘Pressing on’ into deteriorating conditions: An application of behavioral decision theory to pilot decision making. Int. J. Aviat. Psychol. 1995, 5, 351–370. [Google Scholar] [CrossRef]
  23. Kahneman, D.; Tversky, A. Choices, values, and frames. In Handbook of the Fundamentals of Financial Decision Making: Part I; World Scientific: Hackensack, NJ, USA, 2013; pp. 269–278. [Google Scholar]
  24. Metcalfe, J. Cognitive optimism: Self-deception or memory-based processing heuristics? Personal. Soc. Psychol. Rev. 1998, 2, 100–110. [Google Scholar] [CrossRef] [PubMed]
  25. Kruger, J.; Dunning, D. Unskilled and unaware of it: How difficulties in recognizing one’s own incompetence lead to inflated self-assessments. J. Personal. Soc. Psychol. 1999, 77, 1121. [Google Scholar] [CrossRef]
  26. Naguib, M.; Brull, S.J.; Hunter, J.M.; Kopman, A.F.; Fülesdi, B.; Johnson, K.B.; Arkes, H.R. Anesthesiologists’ overconfidence in their perceived knowledge of neuromuscular monitoring and its relevance to all aspects of medical practice: An international survey. Anesth. Analg. 2019, 128, 1118–1126. [Google Scholar] [CrossRef]
  27. Bazerman, M.H.; Moore, D.A. Judgment in Managerial Decision Making; Wiley New York: New York, NY, USA, 1994. [Google Scholar]
  28. Pavel, S.R.; Robertson, M.F.; Harrison, B.T. The Dunning-Kruger effect and SIUC University’s aviation students. J. Aviat. Technol. Eng. 2012, 2, 6. [Google Scholar] [CrossRef]
  29. Endsley, M.R. Situation awareness global assessment technique (SAGAT). In Proceedings of the IEEE 1988 National Aerospace and Electronics Conference, Dayton, OH, USA, 23–27 May 1988; Volume 783, pp. 789–795. [Google Scholar]
  30. Clewley, R.; Nixon, J. Understanding pilot response to flight safety events using categorisation theory. Theor. Issues Ergon. Sci. 2019, 20, 572–589. [Google Scholar] [CrossRef]
  31. O’hare, D.; Wiggins, M. Remembrance of cases past: Who remembers what, when confronting critical flight events? Hum. Factors 2004, 46, 277–287. [Google Scholar] [CrossRef] [Green Version]
  32. Jensen, R.S.; Guilkey, J.E.; Hunter, D.R. An Evaluation of Pilot Acceptance of the Personal Minimums Training Program for Risk Management; Office of Aviation Medicine, Federal Aviation Administration: Washington, DC, USA, 1998. [Google Scholar]
  33. Hunter, D.R.; Martinussen, M.; Wiggins, M.; O’Hare, D. Situational and personal characteristics associated with adverse weather encounters by pilots. Accid. Anal. Prev. 2011, 43, 176–186. [Google Scholar] [CrossRef]
  34. Leedy, P.; Ormrod, J.E. Practical Research: Planning and Design, 10th ed.; Pearson Education Inc.: Boston, MA, USA, 2013. [Google Scholar]
  35. Wiegmann, D.A.; Shappell, S.A. A Human Error Approach to Aviation Accident Analysis: The Human Factors Analysis and Classification System; CRC Press: Surry, UK, 2017. [Google Scholar]
  36. Shappell, S.A.; Wiegmann, D.A. Applying reason: The human factors analysis and classification system (HFACS). Hum. Factors Aerosp. Saf. 2001, 1, 59–86. [Google Scholar]
  37. Raymond, M.; Rousset, F. An Exact Test for Population Differentiation. Evolution 1995, 49, 1280–1283. [Google Scholar] [CrossRef] [PubMed]
  38. Wild, G.; Murray, J.; Baxter, G. Exploring Civil Drone Accidents and Incidents to Help Prevent Potential Air Disasters. Aerospace 2016, 3, 22. [Google Scholar] [CrossRef] [Green Version]
  39. Keren, G. Facing uncertainty in the game of bridge: A calibration study. Organ. Behav. Hum. Decis. Process. 1987, 39, 98–114. [Google Scholar] [CrossRef]
  40. Australian Transport Safety Bureau. Visual Flight Rules in Instrument Meteorological Conditions and Controlled Flight into Terrain Involving Cessna 182Q, VH-CWQ 15 km North of Tooraweenah, NSW4 June 2012; AO-2012-076 Final; Australian Transport Safety Bureau: Canberra, Australia, 2013. [Google Scholar]
  41. Australian Transport Safety Bureau. VFR into IMC Involving Piper, PA-28R, Near Sunshine Coast Airport, Qld, on 22 February 2018; AB-2018-021; Australian Transport Safety Bureau: Canberra, Australia, 2018. [Google Scholar]
  42. TAIC. Airbus Helicopters AS350BA, ZK-HKU Collision with Terrain Fox Glacier, 21 November 2015. Aviation Inquiry; AO-2015-007; Transport Accident Investigation Commission: Wellington, New Zealand, 2019. [Google Scholar]
  43. Jensen, R.S. Pilot Judgment and Crew Resource Management; Routledge: Surry, UK, 2017. [Google Scholar]
  44. ATSB. Avoidable Accidents No. 4: Accidents Involving Visual Flight Rules Pilots in Instrument Meteorological Conditions; AR-2011-050; Australian Transport Safety Bureau: Canberra, Australia, 2013. [Google Scholar]
  45. Parker, M. Humble Pi: A Comedy of Maths Errors; Penguin Books Limited: London, UK, 2019. [Google Scholar]
  46. Ison, D. Correlates of continued visual flight rules (VFR) into instrument meteorological conditions (IMC) general aviation accidents. J. Aviat. Aerosp. Educ. Res. 2014, 24, 1–26. [Google Scholar] [CrossRef]
  47. Goh, J.; Wiegmann, D.; O’Hare, D. Human factors analysis of accidents involving visual flight rules flight into adverse weather. Aviat. Spaceand Environ. Med. 2002, 73, 817–822. [Google Scholar]
Figure 1. Human Factors Analysis and Classification System (HFACS) framework, illustrating the four levels of failure with their corresponding categories and subcategories.
Safety 06 00019 g001
Figure 2. Breakdown of flight experience, that is, total logged flight hours of pilots involved in the VFR2IMC occurrences. Inset: exponential growth of pilot experience (log plot) over the occurrences.
Safety 06 00019 g002
Figure 3. Delta values for each type of occurrence. Expected (secondary axis), all ATSB occurrences (line plot).
Safety 06 00019 g003
Figure 4. Delta values for fatal and non-fatal occurrences. Expected (secondary axis), all ATSB occurrences (line plot).
Safety 06 00019 g004
Figure 5. Delta values for different aircraft manufacturers. Expected (secondary axis), BITRE average annual hours for each manufacturer (line plot).
Safety 06 00019 g005
Figure 6. Delta values for type of flight operation. Expected (secondary axis), BITRE average annual hours for each type of operation (line plot).
Safety 06 00019 g006
Figure 7. Relative percentage difference between the observed and expected occurrences for the different classes of airspace. Expected (secondary axis), all ATSB occurrences (line plot).
Safety 06 00019 g007
Figure 8. Relative percentage difference between the observed and expected occurrences for each month based on the amount of rainfall in each month (line plot, secondary axis).
Safety 06 00019 g008
Figure 9. Trend in total number of VFR2IMC occurrences over the years of the study and the corresponding number of GA flight h in the same year (joined line, secondary axis). Note: the slight decrease is not statistically significant. 2019 hours not yet published.
Safety 06 00019 g009
Table 1. Aircraft manufacturers and models involved in the visual flight rule (VFR) flight into instrument meteorological condition (IMC) (VFR2IMC) occurrences.
Aircraft ManufacturerModelsCountFatal
Cessna Aircraft Company17221
18222
20631
2081
33711
Piper Aircraft CorpPA-2853
Bell Helicopter Co20622
Aerospatiale IndustriesAS3501
Airbus Helicopters DeutschlandEC13511
Beech Aircraft Corp561
de Havilland Aircraft Pty Ltd.DH-8411
EurocopterBK1171
Gippsland Aeronautics Pty Ltd.GA-81
Kavanagh BalloonsG-5251
Pacific Aerospace Corporation08-60011
SOCATA-Groupe AerospatialeTB11
Table 2. Type of operation for the VFR2IMC occurrences. Total breaks down into Fatal and Not. Not (fatal) breaks down into injury level (serious, minor, and none).
FatalnessInjury Level
OperationTotalFatalNotSeriousMinorNone
Private17134004
Charter505122
Aerial Work211001
Flying Training202002
Table 3. Licenses held by the pilots involved in the VFR2IMC occurrences. Total breaks down into Fatal and Not. Not (fatal) breaks down into injury level (serious, minor, and none).
FatalnessInjury Level
LicenseTotalFatalNotSeriousMinorNone
Private Pilot (Aeroplane)17107007
Private Pilot (Helicopter)211001
Commercial Pilot (Helicopter)321010
Commercial Pilot (Aeroplane)202011
Commercial Pilot (Balloon)101100
Table 4. Ratings held by the pilots involved in the VFR2IMC occurrences. Total breaks down into Fatal and Not. Not (fatal) breaks down into injury level (serious, minor and none).
FatalnessInjury Level
RatingTotalFatalNotSeriousMinorNone
None1798125
Night VFR440000
Instrument303003
Table 5. Hazards associated with VFR2IMC occurrences. Total breaks down into Fatal and Not. Not (fatal) breaks down into injury level (serious, minor and none).
FatalnessInjury Level
HazardTotalFatalNotSeriousMinorNone
Clouds13310127
Terrain1082020
Rain/Cloud761001
Night431001
Trees532110
Fog321100
Turbulence330000
Rain211001
Storms220000
Table 6. Pilot actions in VFR2IMC occurrences. Total breaks down into Fatal and Not. Not (fatal) breaks down into injury level (serious, minor, and none).
FatalnessInjury Level
ActionTotalFatalNotSeriousMinorNone
Continued On19145122
Turned back404004
Diverted202002
Fly around101001
Table 7. Weather planning information source utilized in the VFR2IMC occurrences. Total breaks down into Fatal and Not. Not (fatal) breaks down into injury level (serious, minor and none).
FatalnessInjury Level
SourceTotalFatalNotSeriousMinorNone
NAIPS936006
None770000
Verbal211101
AWIS101001
Briefing101011
ATIS110000
Table 8. HFACS analysis for the 25 Australian Transport Safety Bureau (ATSB) VFR2IMC occurrences.
HFACSTotalFatalNot
Level 1ErrorsSkill based errors743
Decision errors241311
Perceptual errors16133
ViolationsRoutine violations20137
Exceptional violations101
Level 2EnvironmentPhysical environment261412
Technological environment000
Condition of OperatorAdverse mental state312
Adverse psychological state211
Physical/mental limitations202
Personnel FactorsCrew resource management000
Personal readiness110
Level 3 Inadequate supervision725
Plan inappropriate operation404
Fail to correct known problem110
Supervisory violation312
Level 4 Resource management101
Organizational climate101
Operational process312
Table 9. Results of the Fisher’s exact tests for different levels of HFACS. * Insufficient data.
ParameterSizep-Value
Level 1–4 (HFACS)4 × 20.022
Level 1 (Unsafe Acts) 2 × 21
Errors3 × 20.209
Violations2 × 20.381
Level 2 (Preconditions)3 × 20.398
Environmental Factors2 × 21
Condition of Operator3 × 21
Personnel Factors2 × 2*
Level 3 (Supervision)4 × 20.267
Level 4 (Organization)3 × 21
Table 10. Outputs from Pearson’s chi-squared test for goodness of fit for each of the factors.
FactorTypeFatalnessManuOpAirspaceMonth
χ2962246812212266
df21104511
p-value<0.001<0.001<0.001<0.001<0.001<0.001
Conclusionrejectrejectrejectrejectrejectreject
Table 11. Observed number of operations for the VFR2IMC occurrences, fatal and not fatal, with expected values give in the parentheses.
OperationFatalNot
Private13 (8.47)56 (60.5)
Charter0 (2.09)17 (14.9)
Aerial Work1 (0.860)6 (6.14)
Flying Training0 (2.58)21 (18.4)