1. Introduction
Although statistics on road crashes have shown a reduction in the number of fatalities and injuries in recent years, road safety still remains a current issue [
1]. Data available in the literature [
2] show that the exposure to crash risk for road users is much more than the exposure to natural or anthropogenic events for citizens.
Compared to a few years ago, the specific features of road crashes are quite different. A couple of decades ago, road safety policies were geared to address the speed and high crash rates of highway networks. At present, although the general underestimation of crash phenomena and their social consequences is still high [
3], these aspects appear to be much less critical, and new problems and some specific aspects have emerged in light of new evidence. Among these, the mobility of “vulnerable users” (i.e., pedestrians and bicyclists) is a critical issue, especially in densely populated areas [
4]. Bicycling mobility is growing in all developed areas; it has evolved from transport for sport or leisure into a routine solution to transport needs, especially in urban areas. Italian data [
5] show that in 2012 bicycling trips accounted for about 4% of total trips, with a growing trend. The evidence shows a cultural change; cars are no longer the ideal mode of transport to reduce travel time, and they do not meet the needs of citizens [
6]. Cities have exhibited car-centered development, but over time this choice has produced urban and metropolitan areas characterized by more traffic, congestion, and pollution [
7]. These conditions have actually nullified the expected “utility” of motorized vehicles. For example, according to the Italian observatory of vulnerable users [
8], in urban centers the average speed of motorized private vehicles does not exceed 20 km/h. Therefore, two-wheeled vehicles become competitive, especially when trips are not more than 5–10 km long. In addition, the externalities of motorized transport (e.g., pollution, noise, congestion) lead to blocks or restrictions on the circulation of vehicles, and these measures further push citizens to use non-motorized vehicles.
On the road, vulnerable users conflict with vehicles with larger dimensions and masses; bicyclists and pedestrians clearly constitute the “weak” element, and they are more exposed in the event of a crash [
9]. As vehicle mass, size, and complexity increase, driving actions generally become more complicated and cumbersome, and often the vehicle structure prevents the full and unobstructed view of the driver. Bicyclists, on the other hand, can control the bike with greater immediacy and agility, and they can immediately grasp indications and sensations which are useful for correctly setting their driving actions [
10]. All these uneven conditions contribute to make the interaction between traffic flows belonging to such categories very critical. Most of the time, bicyclists use the same carriageway used by motorized vehicles, while a specific site is reserved for pedestrians. Even when bicycles have reserved “tracks”, the latter are generally placed at the same level as the lanes of motorized traffic, and they are typically separated from these lanes by easily penetrable elements [
11]. Interactions are relevant and unavoidable at road intersections, since all vehicles (motorized and not) and all users occupy the same spaces and perform particular operations (i.e., maneuvers). Successive and intense variations of speed and direction stress some sensitive components and/or relationships within the road system (e.g., mutual visibility between users, transmission of dynamic actions and tire-pavement adherence, maneuverability in restricted spaces, plano-altimetric continuity of pavements) [
12]. Therefore, intersections are a potentially critical infrastructural element where crashes often occur. Recent studies have shown that over 70% of crashes involving bicyclists occur in areas where four- and two-wheel vehicles share the space, particularly at intersections [
13], and the case of Rome can serve as a prime example [
3,
14,
15].
Considering the above, it is necessary to explore the specific characteristics of crashes between motor vehicles and bicyclists that occur in intersections in order to understand the typical conditions and to act positively for risk mitigation. Utmost attention should be paid to this aspect, with the aim of setting up appropriate policies and specific actions to manage road safety [
16]. Therefore, it is necessary to adopt quantitative methods to recognize the problems and to correctly address countermeasures [
17].
The aim of this paper is to assess the risk of crash between bicyclists and motorized vehicles at different urban on-level road intersections. Starting from simple layouts of urban intersections (i.e., four-leg intersections, with and without bike paths), the authors designed 22 modified layouts to reduce interactions between different road users. Geometric characteristics of the intersections and maneuvers were considered to assess the risk of collision and to classify intervention priorities. Several modifications of the reference intersections and traffic flow regulations were implemented, changing the original layouts in order to make the studied intersections safer for all users. A before–after analysis was adopted to examine and compare the safety levels of each examined layout.
2. Data and Methods
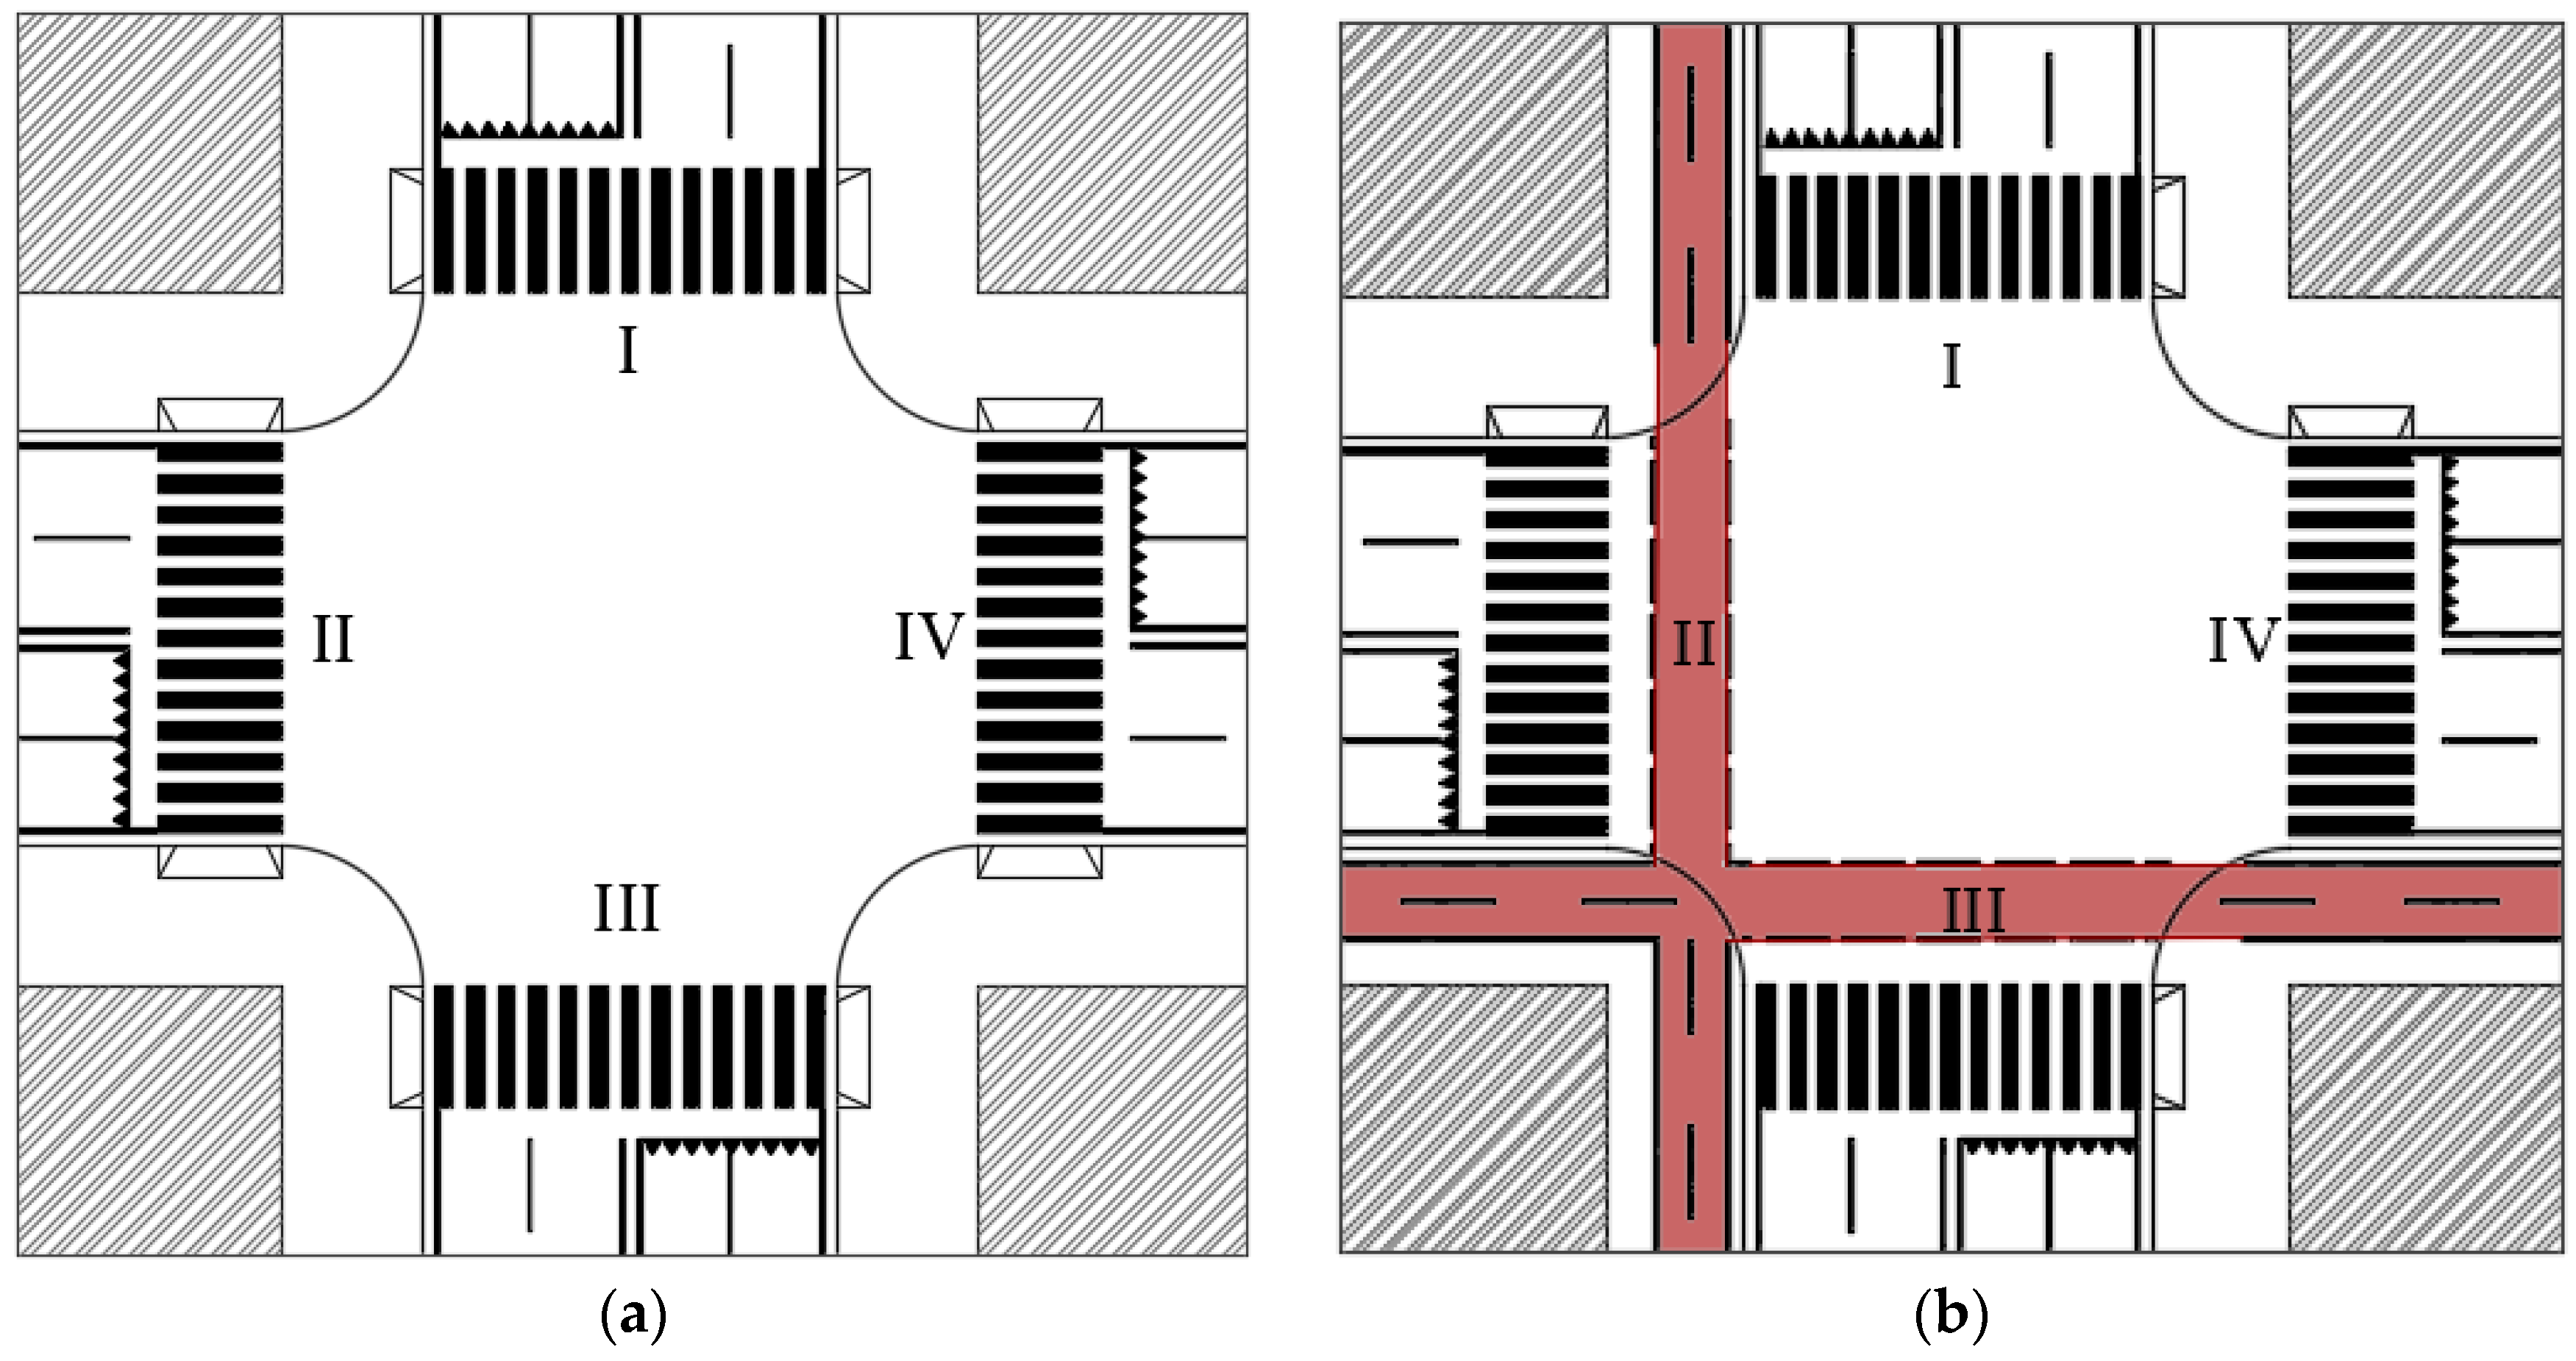
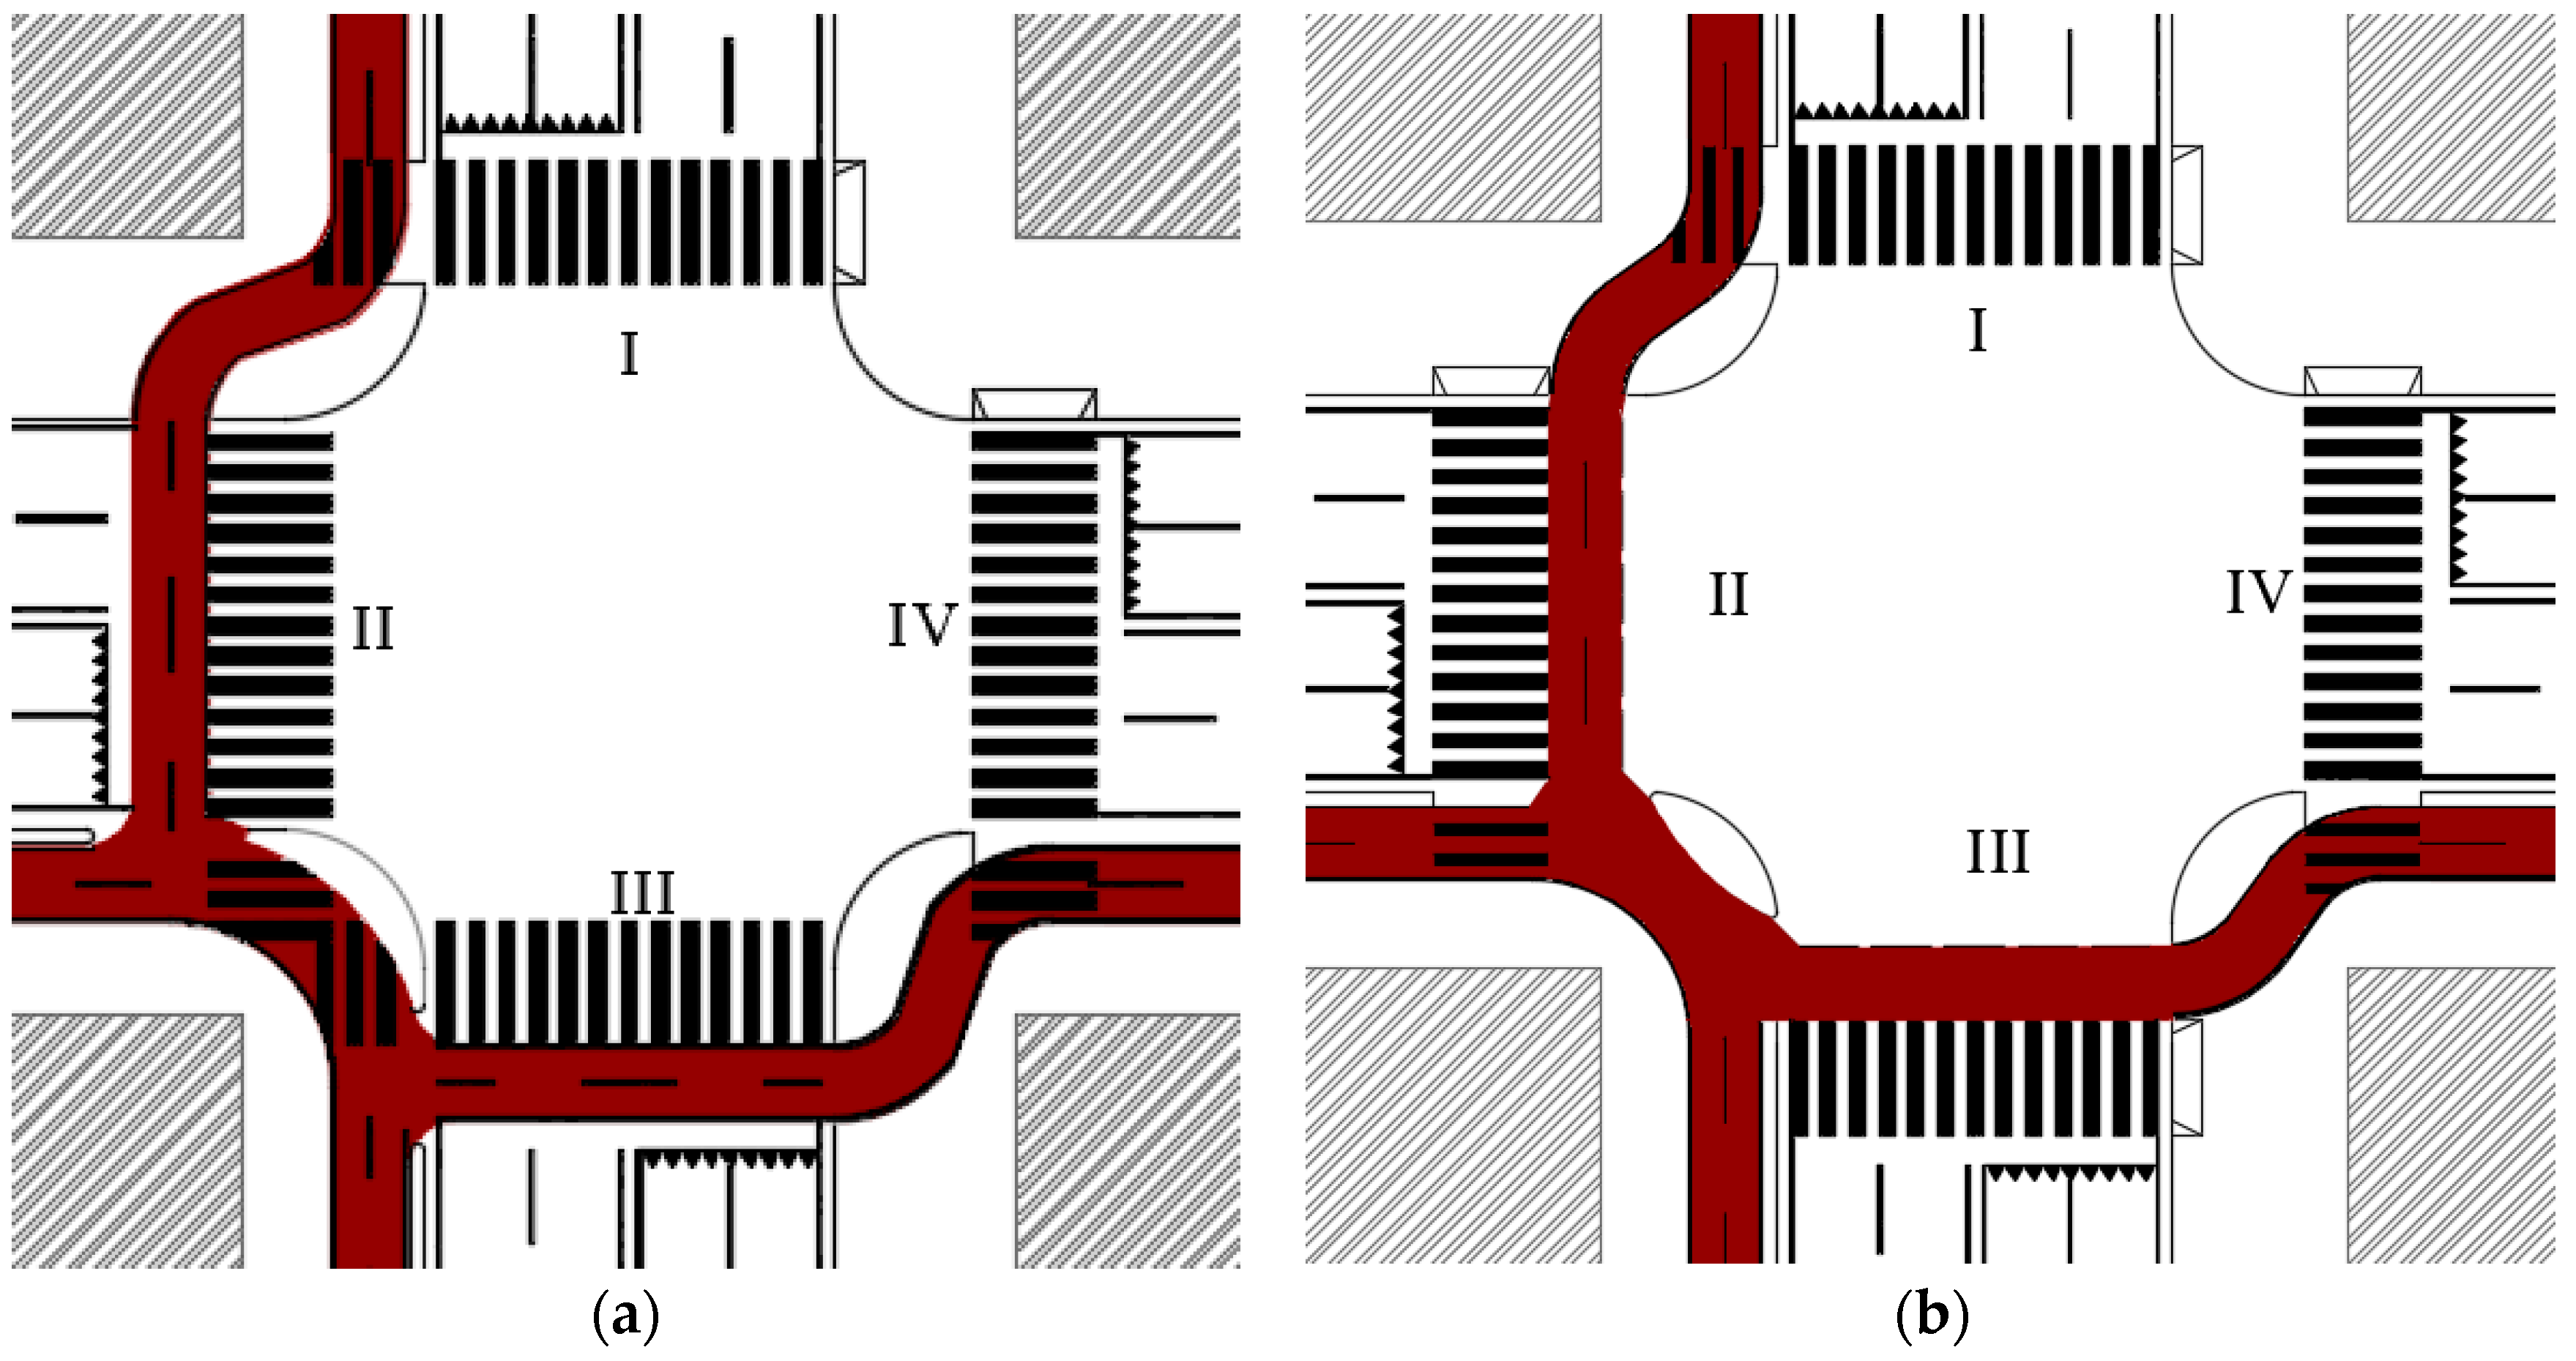
Two geometrical layouts of four-leg urban intersections were considered—without (
Figure 1a) and with (
Figure 1b) a reserved bicycle path.
For both cross-sections, vehicle lanes are 3.0 m wide, shoulders are 0.5 m wide, and medians are 0.5 m wide. Bicyclists run on the carriageway for intersections without a cycle path (
Figure 1a); they leave and arrive 0.75 m off the right-edge of the outer lane [
18]. Each bike lane is 1.25 m wide (
Figure 1b).
In all the examined cases, vehicles and bicycles can perform three maneuvers: crossing, right turn, and left turn [
19]. All trajectories of users start from the yield line and end after the pedestrian crossing. The turn maneuvers are composed of three branches: a straight stretch, a circle arc, and an ending straight stretch. According to the Italian standard of road design [
20], different trajectories were designed to describe different user behaviors [
17]. This permitted us to consider the variability of risk conditions caused by users’ choices. However, it was assumed that all road users are not affected by critical physical or psychological characteristics, and that they respect the road signs according to the geometrical and functional layout of the crossed intersection.
Each conflict point (CP) is identified as the intersection point between a bike and a motorized vehicle trajectory.
All users cross the intersection at a constant speed: 10 km/h for bicyclists and 20 km/h for motorized vehicles [
17]. According to the Italian standard of road design [
20], the stopping distance is 3.51 m and the time distance needed for motorized vehicles is 0.628 s.
The adopted method for risk assessment is composed of a probability model and a damage model [
17].
For the probability model, we assumed that a binomial distribution describes the probability
P that at least one crash may occur at the intersection where
N conflict points are detected (Equation (1)):
where
p is the probability that a vehicle
p(
V) will make impact versus a bicycle
p(
B) within the elementary unit of exposure (1 s according to [
21]). Furthermore,
q is the probability there will not be a collision according to Equation (2):
Poisson’s law [
22] describes the points of arrival of vehicles at the intersection, which are independent from each other when traffic volume is far from the capacity [
23]. Under such conditions,
p is calculated according to Equation (3):
where
λV and
λB are the values of the average number of events per elementary unit of exposure calculated for motorized vehicles and bikes, respectively.
λV and
λB depend on the hourly number of arrivals of vehicles (
QV) and bikes (
QB), which are assumed to be equal from each approach, but not coincident (therefore,
QV can differ from
QB).
Regarding the damage model, the danger classification depends on the reaction time available (
ART) to a driver of motorized vehicle to avoid a collision in a
CP. This parameter depends on the assumed constant speed and the geometrized trajectories of users between the yield line and the
CP. The
ART is the time available to a driver for perception, reflection, reaction, and implementation—it does not include the braking time. Therefore, the minimum safety condition is given by Equation (4):
where
RRT is the required reaction time.
In the proposed model, the comparison between
ART and
RRT allows the quantification of the expected damage on bikers when they interact with motorized vehicles. Equation (5) describes the condition proposed to calculate the damage
D when vehicles and bikes interact:
According to the Italian standard of geometric and functional characteristics of intersections, we assumed that
RRT is 3 s, and it is equal to the time needed for perception, reflection, reaction, and implementation [
18]. Therefore, in all the analyses the stopping time was not considered; rather, it was considered and separated in advance.
Table 1 lists the danger classification adopted for this analysis.
According to the defined probability and damage models, the risk of collision between bikes and motorized vehicles
R* (defined as “risk of collision”) at urban intersections is (Equation (6)):
where
is the average expected damage calculated for the overall intersection according to Equation (7):
where
Di is the damage calculated for the
ith
CP.
Therefore, the probability model gives a quantitative parameter which represents the overall intersection, while the damage model allows for the calculation of a risk value for each detected CP. As consequence, it is possible to calculate both the average risk value for the overall intersection (i.e., R*) and N values of the risk of collision Rij. This last aspect is of crucial importance to identify the most hazardous CPs considering the maximum value of Rij (max(Rij)), to design modified intersection layouts, and to mitigate the current level of risk. We examined three starting layouts in which all maneuvers were admitted:
Layout 1 (L1) is the symmetrical four-leg intersection represented in
Figure 1a. Bicyclists use the carriageway to cross the intersection.
Layout 2 (L2) is the symmetrical four-leg intersection represented in
Figure 1a. It differs from L1 in its functional configuration; bicyclists use the pedestrian crossings to cross the intersection using the shortest paths.
Layout 3 (L3) is the four-leg intersection represented in
Figure 1b.
From each starting layout, we designed several strategies to modify the geometric and functional configuration and improve traffic safety. In particular, the adopted strategies were:
According to [
24], a traffic light setup was implemented to temporally separate flows from different directions;
A 2.25 m yield line retraction was adopted to extend the vehicle trajectories in order to gain more time to react in the presence of an obstacle;
Areas reserved for bicyclists protected to eliminate the disadvantage of shared areas were designed.
Table 2 lists the characteristics of the examined layouts (codes L from 4 to 25 identify the final layouts).
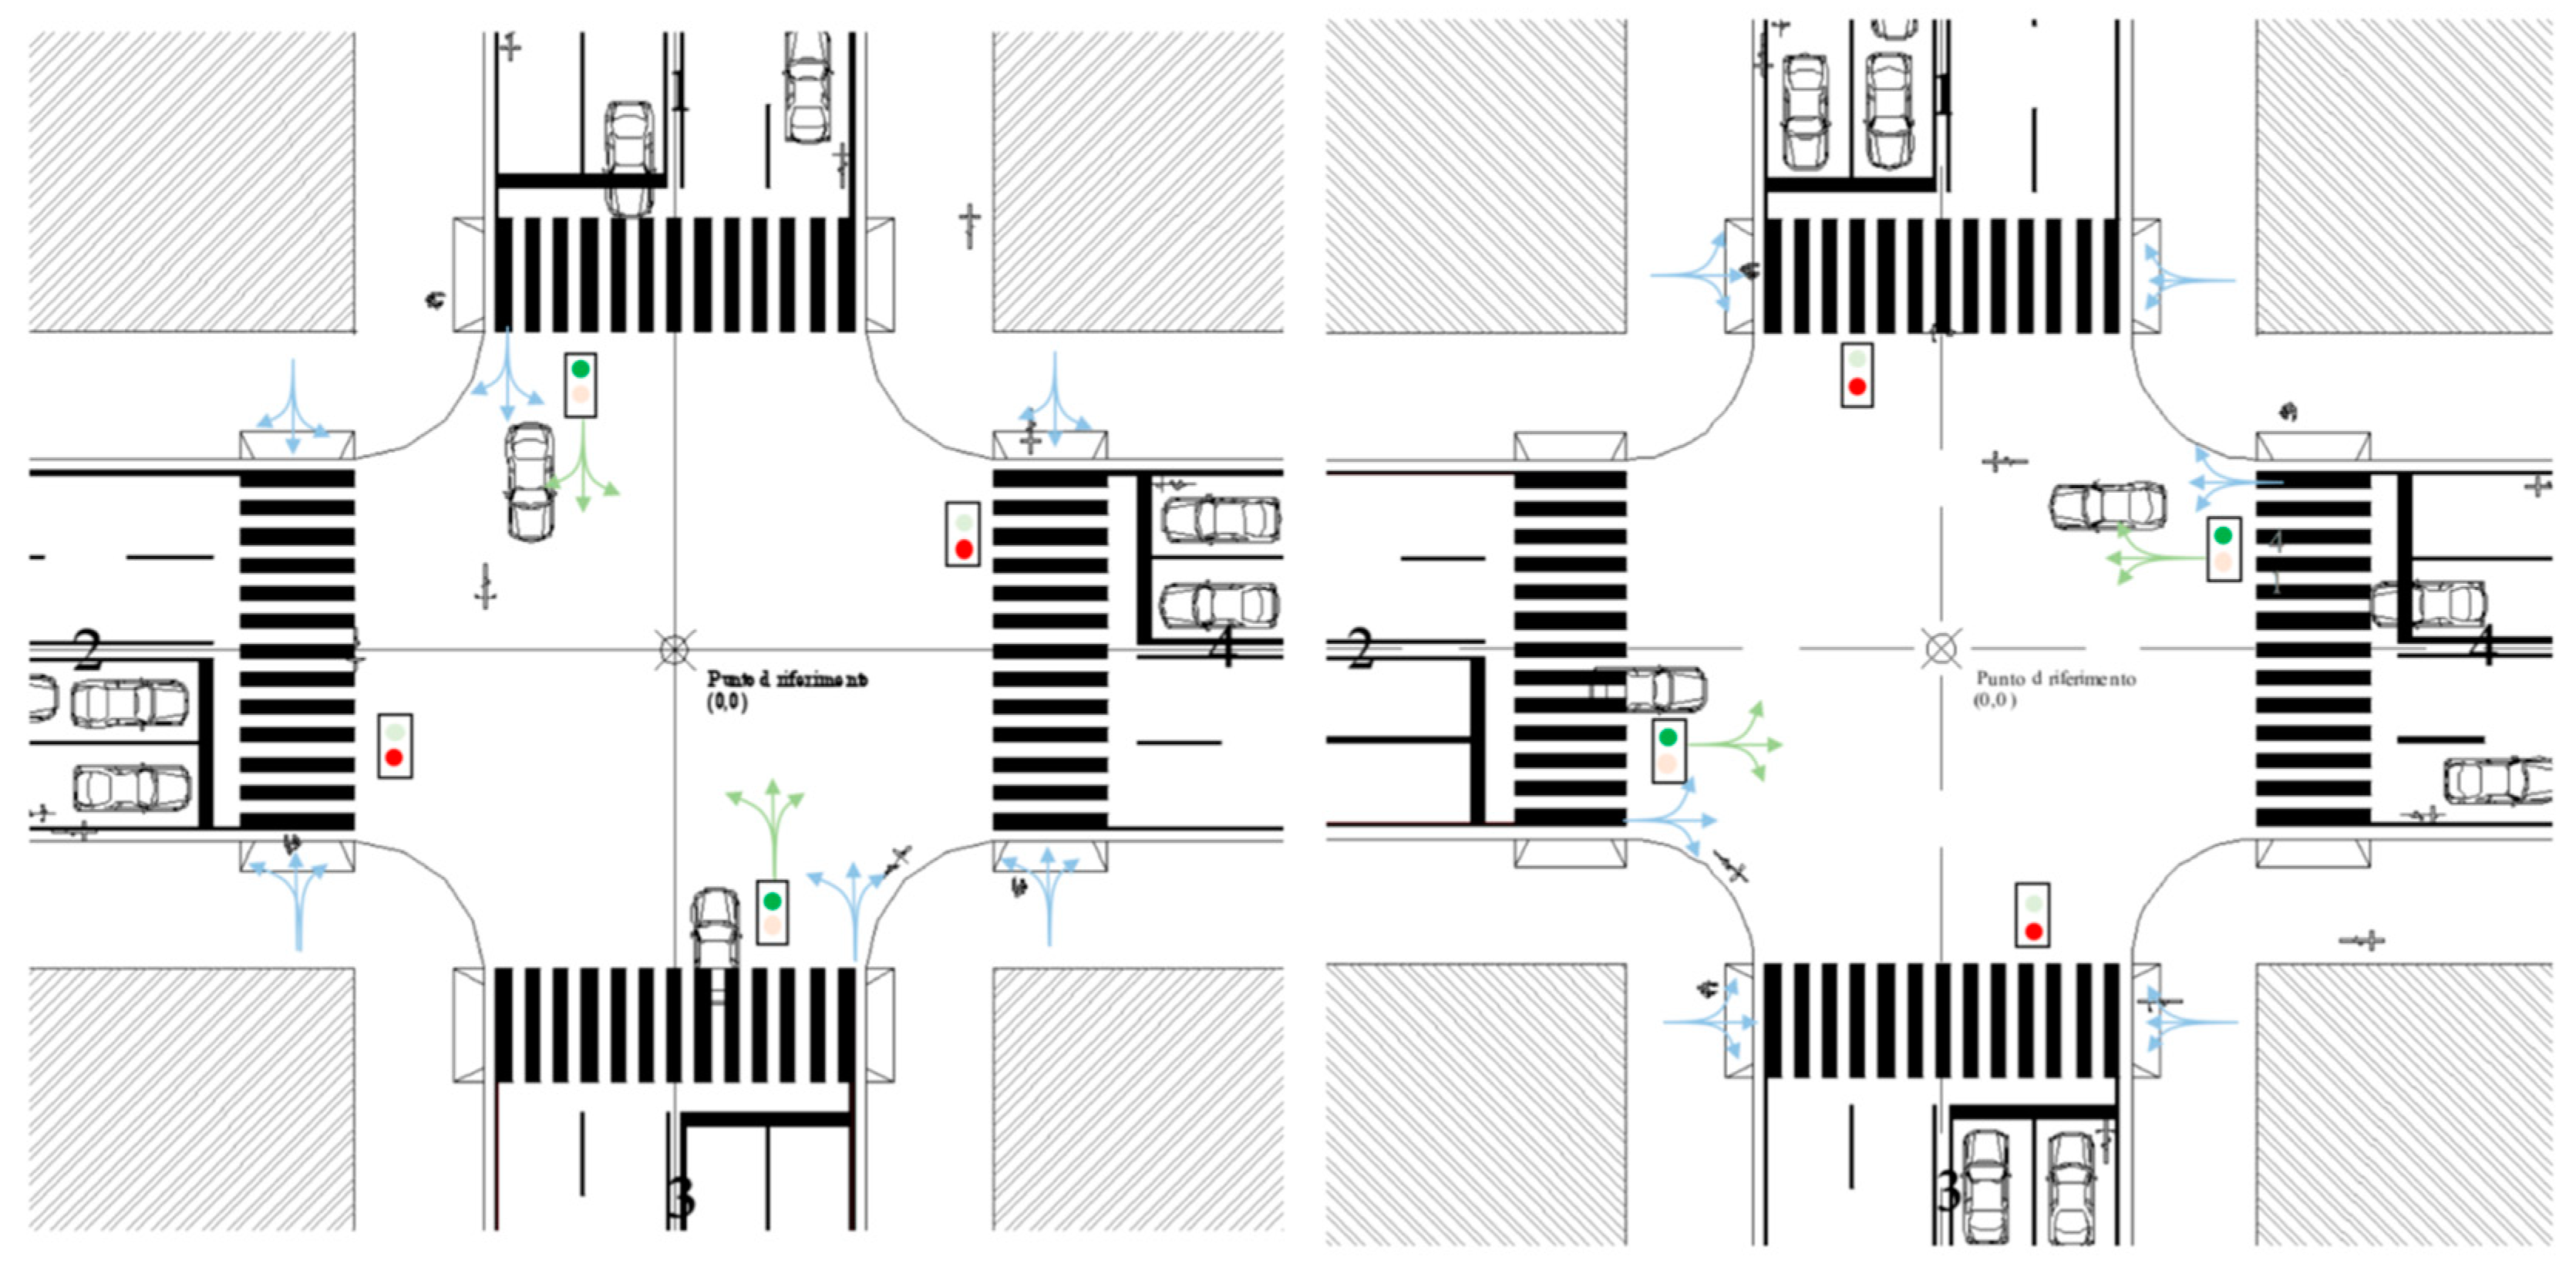
The two-phase signal system of L4 and L5 is represented in
Figure 2: phase 1 allows movements from approaches I and III; phase 2 allows movements from approaches II and IV. The same functional phasing was designed for L6.
In order to obtain the three-phase signal system of L7 and L8, we added a third phase dedicated to bicyclists’ movements. The same functional phasing was designed for L9.
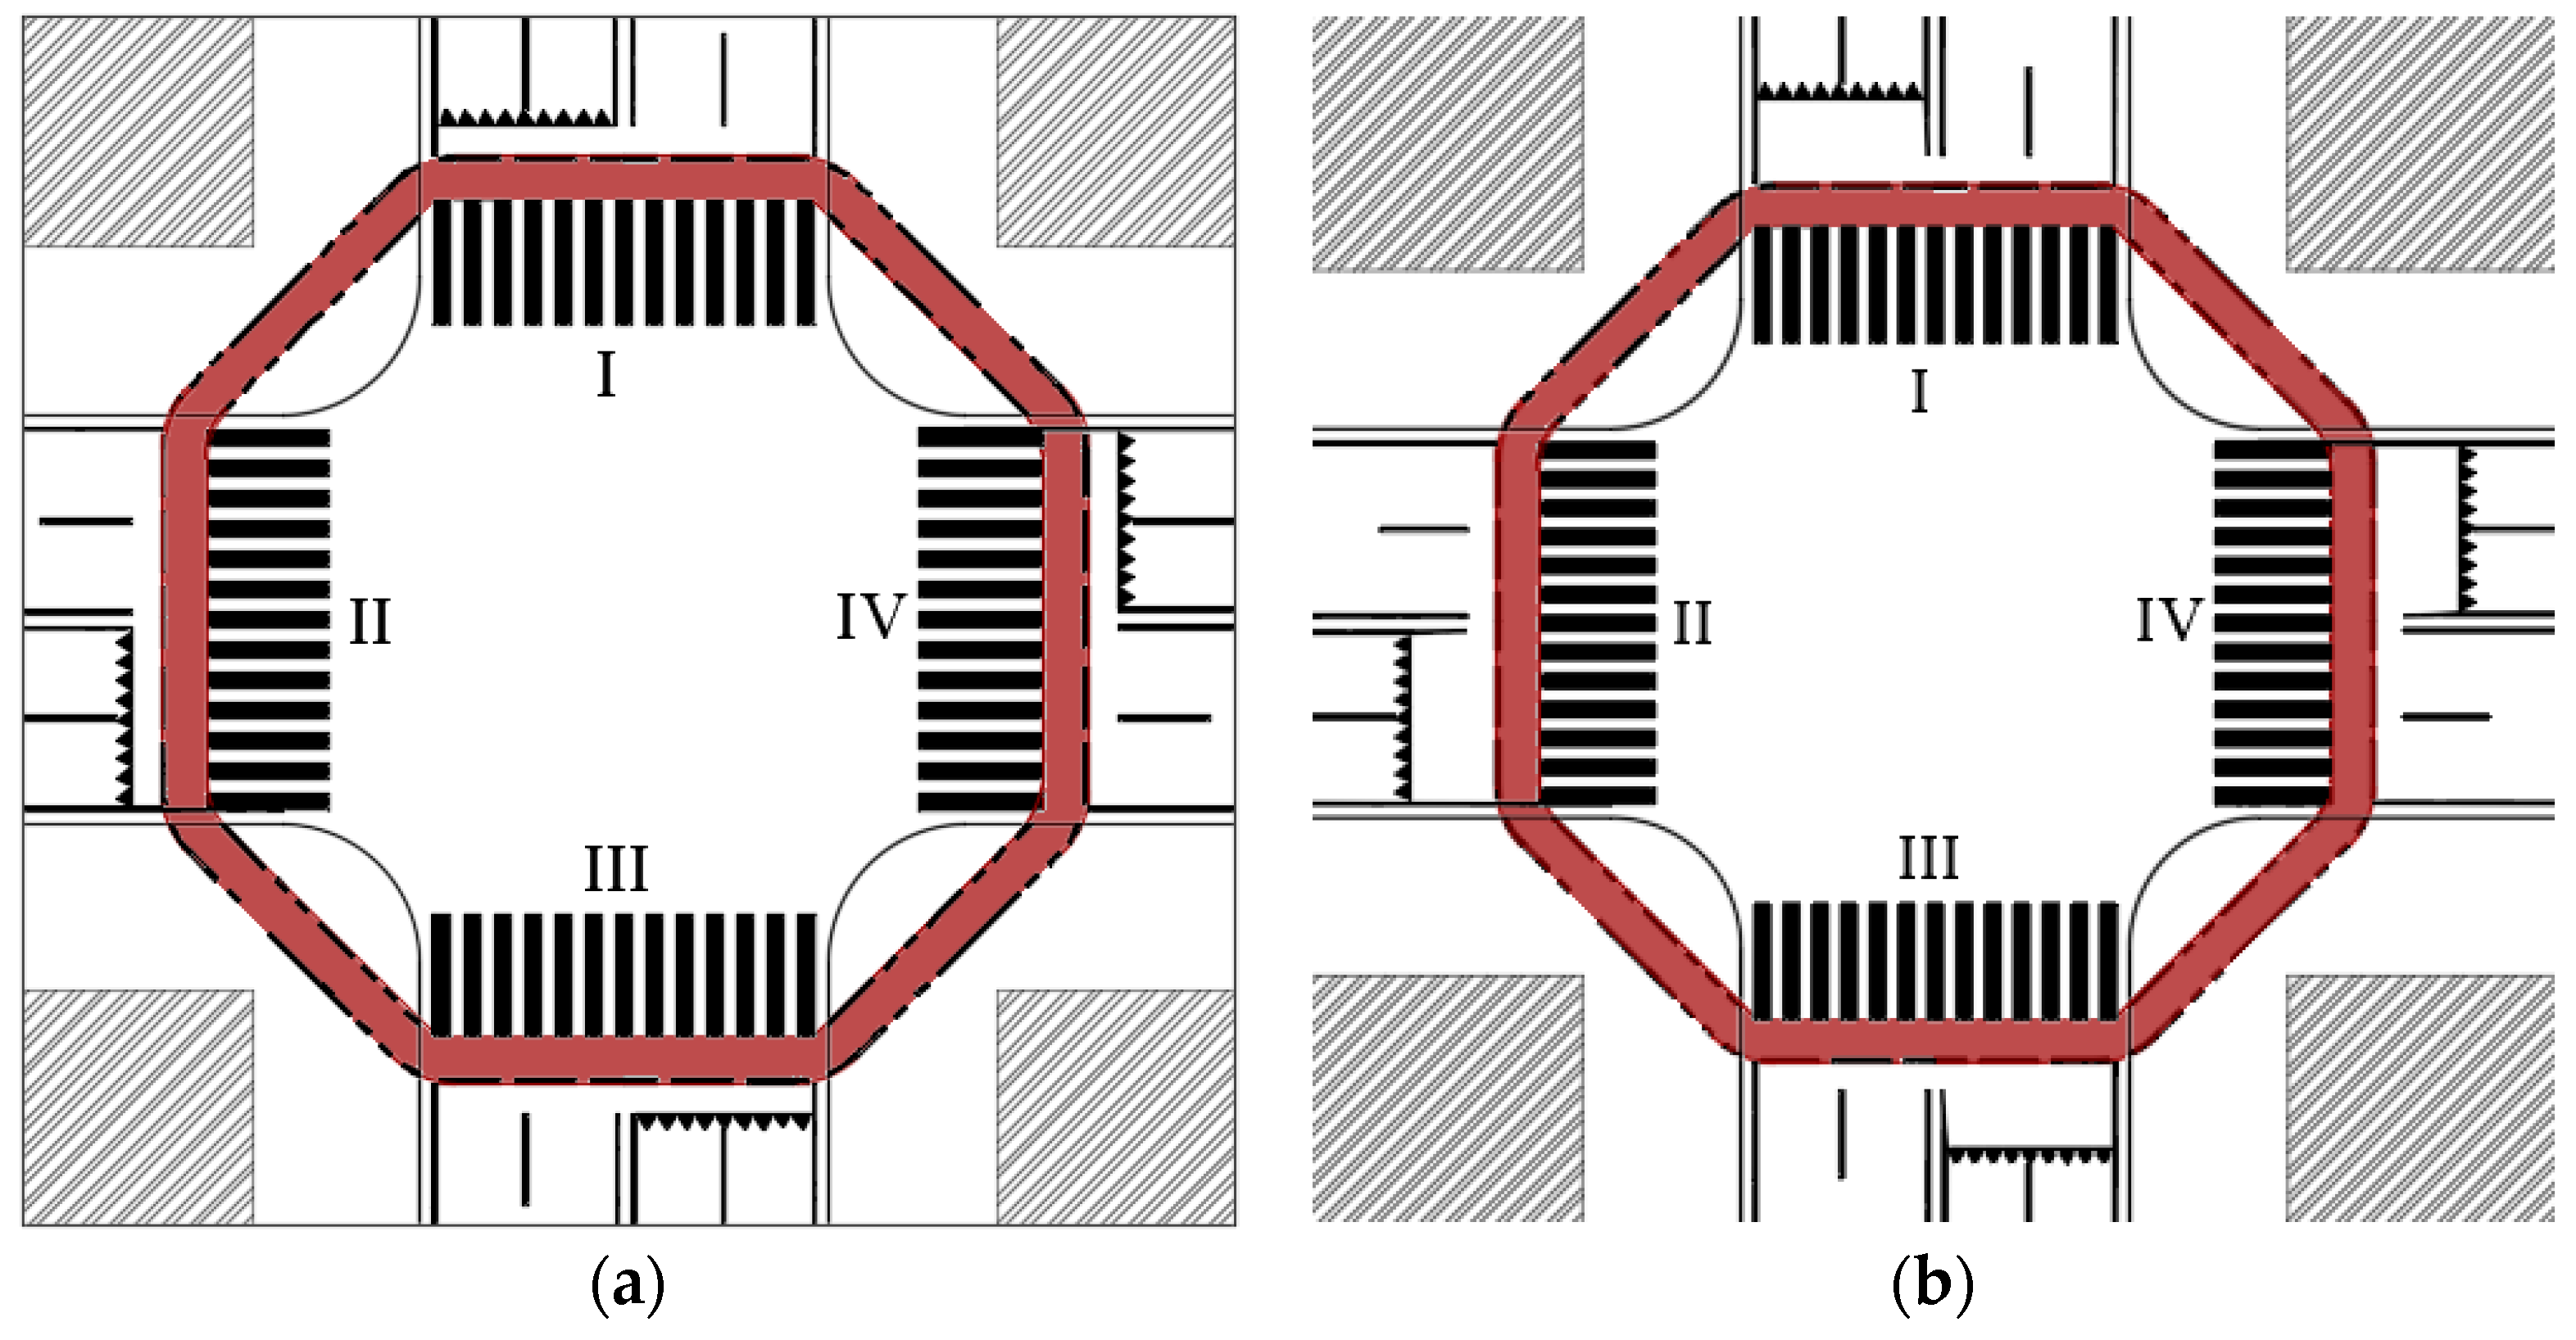
Figure 3a represents the configuration of L10, an unsignalized intersection controlled by a yield sign. All bicyclists’ maneuvers occur in the red area, which represents their reserved path. The counter-clockwise circulation forces bicyclists to reduce their dispersion of paths, lengthens their trajectories, and provides drivers with more reaction time. Indeed, this layout enables the collection and distribution of all bicyclists that access and egress the intersection, from the different legs, on the same trajectory [
25].
In the L11 configuration (
Figure 3b), the yield lines are placed 2.25 m in advance of and parallel to those placed in L10. This additional strategy ensures an even longer available reaction time to avoid collisions between bicycles and motorized vehicles. However, pedestrians are more exposed to collision.
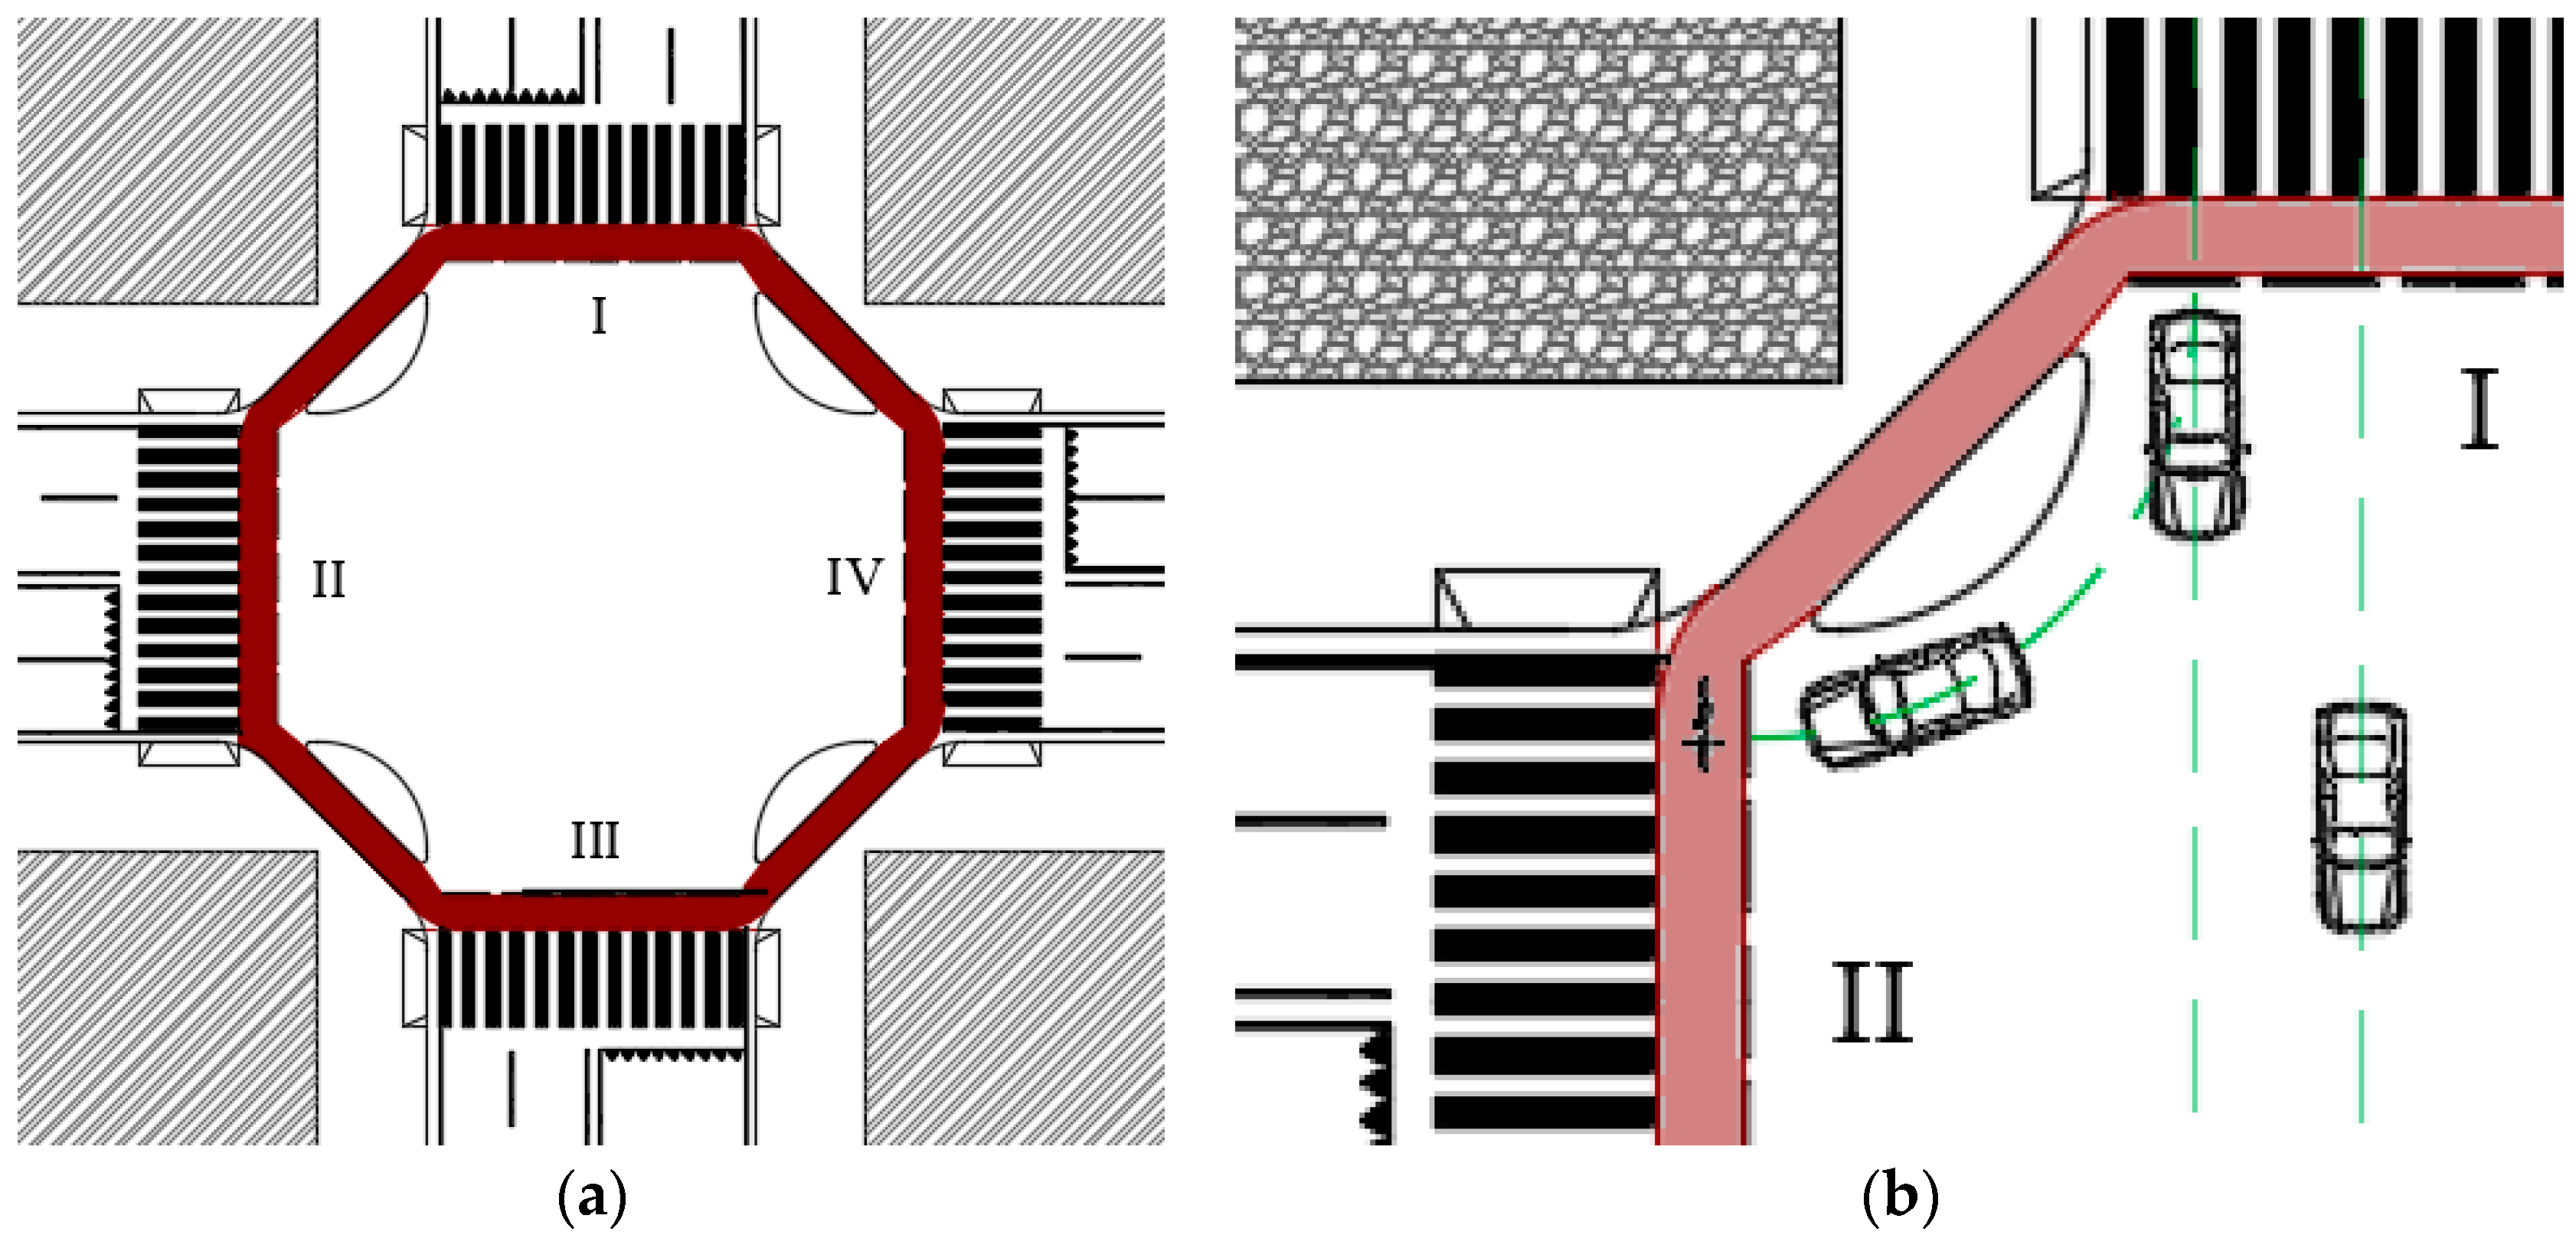
Figure 4a represents the configuration of L12. It is similar to L11, but the counter-clockwise circulation forces bicyclists to use a central area of the intersection. Compared to L11, L12 allows a better operational performance for right-turning motorized vehicles (
Figure 4b) because they do not obstruct the crossing maneuvers of other motorized vehicles. Moreover, pedestrians and bicyclists are not forced to merge maneuvers and do not share space.
L13 and L14 (
Figure 5a,b, respectively) are proposals to improve the safety and operational efficiency of L3. In line with the previously described modified configurations, all trajectories of bicyclists are longer—this reduces the intersection hazardousness. Moreover, both the horizontal alignments of the bicycle paths are more uniform and continuous than those of L3. In L14, the corner between approaches II and III provides refuge for bicyclists waiting for a chance to enter the moving traffic.
L15, L16, and L17 consist of the geometric designs of L10, L11, and L12, respectively, and a two-phase signal.
L18 and L19 consist of the geometric designs of L13 and L14, respectively, and a two-phase signal.
L20, L21, L22, L23, and L24 consist of the geometric designs of L10, L11, L12, L13, and L14, respectively, and a three-phase signal whose third phase is reserved for bicyclists.
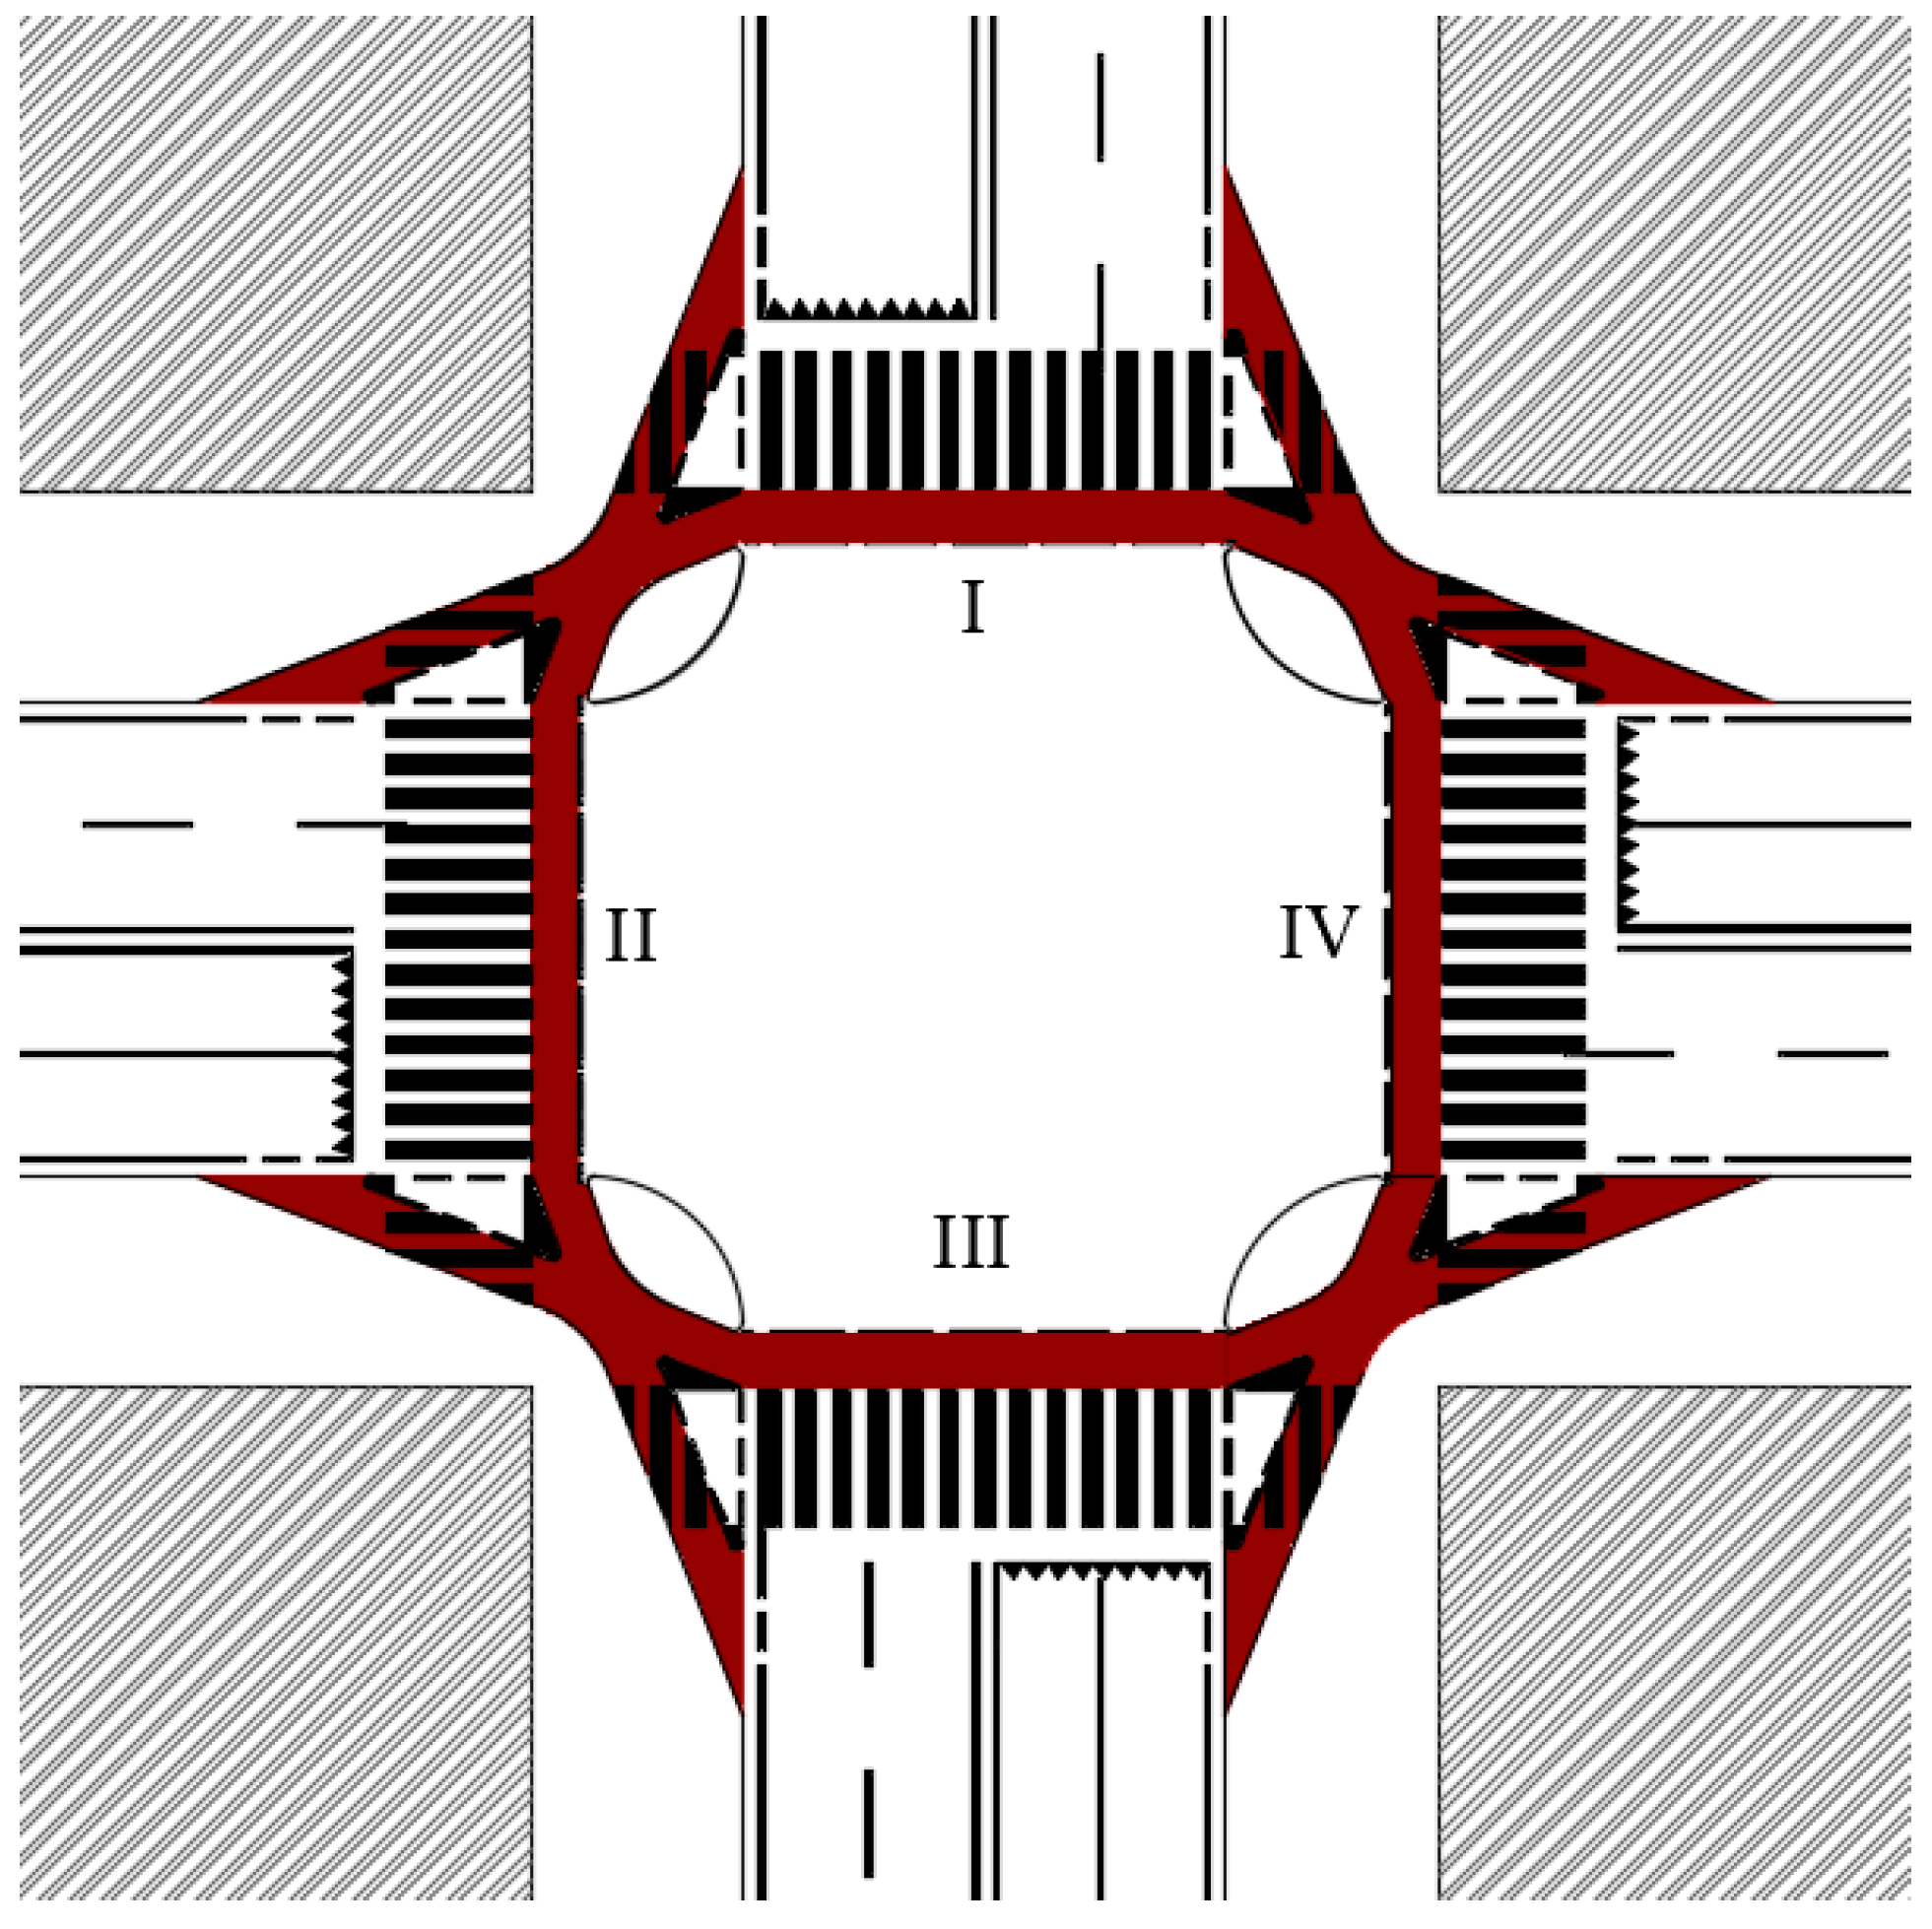
Finally, L25 summarizes the pursued approaches—it arises from the geometric and functional design of L12 and consists of an internal bicycle counter-clockwise circulation and reserved lanes for right turns in order to reduce conflict points between pedestrians and bicyclists (
Figure 6).
In all of the examined configurations, the four approaches are labeled with Roman numerals from I to IV in a counter-clockwise direction from the northern leg.
The proposed model was implemented to assess the highest and lowest levels of risk for each layout, as well as the average level of risk for each layout, so as to identify the best choice.
3. Results
The implementation of the adopted methodology permitted us to calculate the values of ART and the risk of collision for each CP.
According to recent traffic surveys in Rome [
4,
6], the hourly flows
QV and
QB were assumed equal to 500 and 80 veh./h, respectively. These volumes could be analyzed with the Poisson distribution because they are far from approaching capacity.
Table 3 summarizes the results of the risk analyses.
The following observations were made concerning the obtained results:
In the starting layouts (i.e., L1 to L3) and their modifications with the two-phase signal system (i.e., L4 to L6), bicyclists and motorized vehicles interacted in all CPs—not even one CP has a risk of collision equal to 0 (min(Rij) is always greater than 0);
In L4 to L6, no appreciable differences in terms of ART were observed. The results in terms of min and max ART did not differ with respect to L1 to L3. However, the results in terms of min(Rij) and max(Rij) reveal that the functional configurations of L4 to L6 reduced the risk of collision calculated for the starting configurations by half (for min(Rij): −54% for L4 with respect to L1, −49% for L5 with respect to L2, −47% for L6 compared to L3; for max(Rij): −100% for L4 with respect to L1, −49% for L5 with respect to L2, −47% for L6 compared to L3);
No symmetrical layouts (i.e., L3 and its amendments) gave results comparable to those of other layouts in terms of ART and Rij values;
Counter-clockwise circulation (i.e., L10 and its amendments) gave interesting results—although the minimum values of ART were not sufficient to react and stop before an obstacle, the values of the maximum ART significantly increased. Therefore, there were CPs at which no interactions between bicyclists and motorized vehicles occurred and the values of min(Rij) were null. The examined counter-clockwise circulations differed in the relative position of bicyclists’ and pedestrians’ areas. Specifically, the internal bicycle counter-clockwise circulation reduced functional interaction between bicyclists and pedestrians, ensured more comfortable paths for bicyclists, and distanced them from motorized vehicles. However, this choice increased the risk of collision for pedestrians because the zebra crossings are closer to the yield line;
Layouts with a three-phase signal (i.e., L7 to L9 and L20 to L24) had the best performances in terms of safety for bicyclists because all conflict points were avoided, but not all of them had positive functional performances. Indeed, in L7–L9, interactions between pedestrians, motorized vehicles, and bicyclists waiting for their phase cannot be overlooked. Schemes L20 to L24 offer space to bicyclists waiting for a green light and ensured better operational performances than L7 to L9. In particular, L22 minimized the number of CPs between pedestrians and bicyclists. However, these solutions can be implemented only when the traffic volume of bikes is very important, and this choice does not penalize the mobility of motorized vehicles. For this purpose, transport and cost/benefit analyses should be carried out to test the feasibility of introducing these solutions because the proposed model does not allow risk assessment under such conditions.
In order to synthesize the obtained results,
Table 4 lists the number of overall and red
CPs, the average expected damage
, and the risk of collision
R* for each layout where interactions between bicyclists and motorized vehicles occur.
L1, L2, and L3 were characterized by a high number of red
CPs (84, 60, and 47, respectively), low average
ART values (less than 1.77 s), and high values of
(more than 0.90). In particular, L1 had the highest number of
CPs (i.e., 112) and red
CPs (i.e., 84), and the highest
R* of all the examined layouts. L2 ensured better performances than L1 in terms of safety, but it implied more uncertainty because bicyclists can have different trajectories within the zebra crossing areas, potentially causing conflicts between pedestrians and bicyclists. Among the starting layouts, L3 had the best performances in terms of the number of
CPs,
, (
), and
R*. However, the considered scheme differs from L1 and L2 in its non-symmetrical geometry. L3 and its amended layouts could be successfully implemented in intersections whose traffic volumes are not symmetrical or whose traffic signs do not permit all maneuvers to each traffic stream. Indeed, according to
Figure 1b, vehicles traveling from approach I to approach IV and vice versa are not affected by bicycle flow. Therefore, non-symmetrical layouts are suitable for non-symmetrical traffic demands or functional configurations.
In L4, L5, and L6, the two-phase signal reduced the numbers of both overall CPs and red CPs by more than half; the R* values of L4 to L6 were on average 49% of those calculated for L1 to L3. However, the percentages of red CPs in L4 to L6 were 79%, 70%, and 63%, respectively; this highlights the need for different and safer layouts.
L10 to L14 are layouts without the two-phase signal, but their results in terms of the number of red
CPs,
,
, and
R* are interesting. Although the number of
CPs was high (i.e., 92 for L10, L11, and L12; 72 for L13 and L14), the average number of red
CPs fell to 47% and the value of
was not less than 2.26 s. Therefore, the average interaction between bicyclists and motorized vehicles was dangerous (i.e., orange conflict point), but it was not far from the level of slight interaction damage (i.e., yellow conflict point) according to
Table 1. The best results in terms of
R* were obtained for L14 (i.e., 1.23 × 10
−1) and L12 (i.e., 1.27 × 10
−1). L14 consists of a yield line retraction in the L3 configuration, while L12 consists of both yield line retraction and internal areas reserved for bicyclists. However, the retraction of the yield line implies an inefficient use of the road space and it can be implemented only if urban furniture and buildings do not interfere with the sight distance triangle.
Finally, L15 to L19 add the two-phase signal to the L10 to L14 configurations. These configurations drastically reduced the number of red CPs—they ranged between 12 and 16, and they amounted to 36% of the overall CPs. In L15 to L19, the average values of R* were one order of magnitude less than those calculated for the starting layouts. However, these solutions seriously impact the geometrical and functional design of the intersection. Therefore, they should be chosen and designed with a critical approach, identifying the best option while considering the managed maneuvers and the traffic volume.
For this purpose, we analyzed L25 (
Figure 6), whose configuration is composed of a four-leg symmetrical intersection where the yield lines are retracted and internal areas are reserved for the counter-clockwise circulation of bicyclists. Moreover, in order to reduce the shared areas between bicyclists and pedestrians, areas reserved for bicyclists on sidewalks are provided. In this last layout, the number of red
CPs (i.e., 40) was 40% of the overall
CPs, the value of
was 0.55, and the
R* value was almost half (i.e., 1.27 × 10
−1) of that obtained for L1.
4. Discussion
The proposed geometrical and functional approaches to mitigate the current level of risk for different at-grade intersections were applied, taking different traffic volumes into account. In the sensitivity analysis, all crossing, left turn, and right turn maneuvers were available to all users. Therefore, the presented approaches were implemented on two four-leg symmetrical intersections (i.e., L1 and L2) and one four-leg intersection with bidirectional bike facility adjacent to one side of the carriageway (i.e., L3). We applied the method to six different levels of traffic (Ti), which represent some specific conditions observed in Italian urban intersections (
Table 5).
Table 6 and
Table 7 list the results.
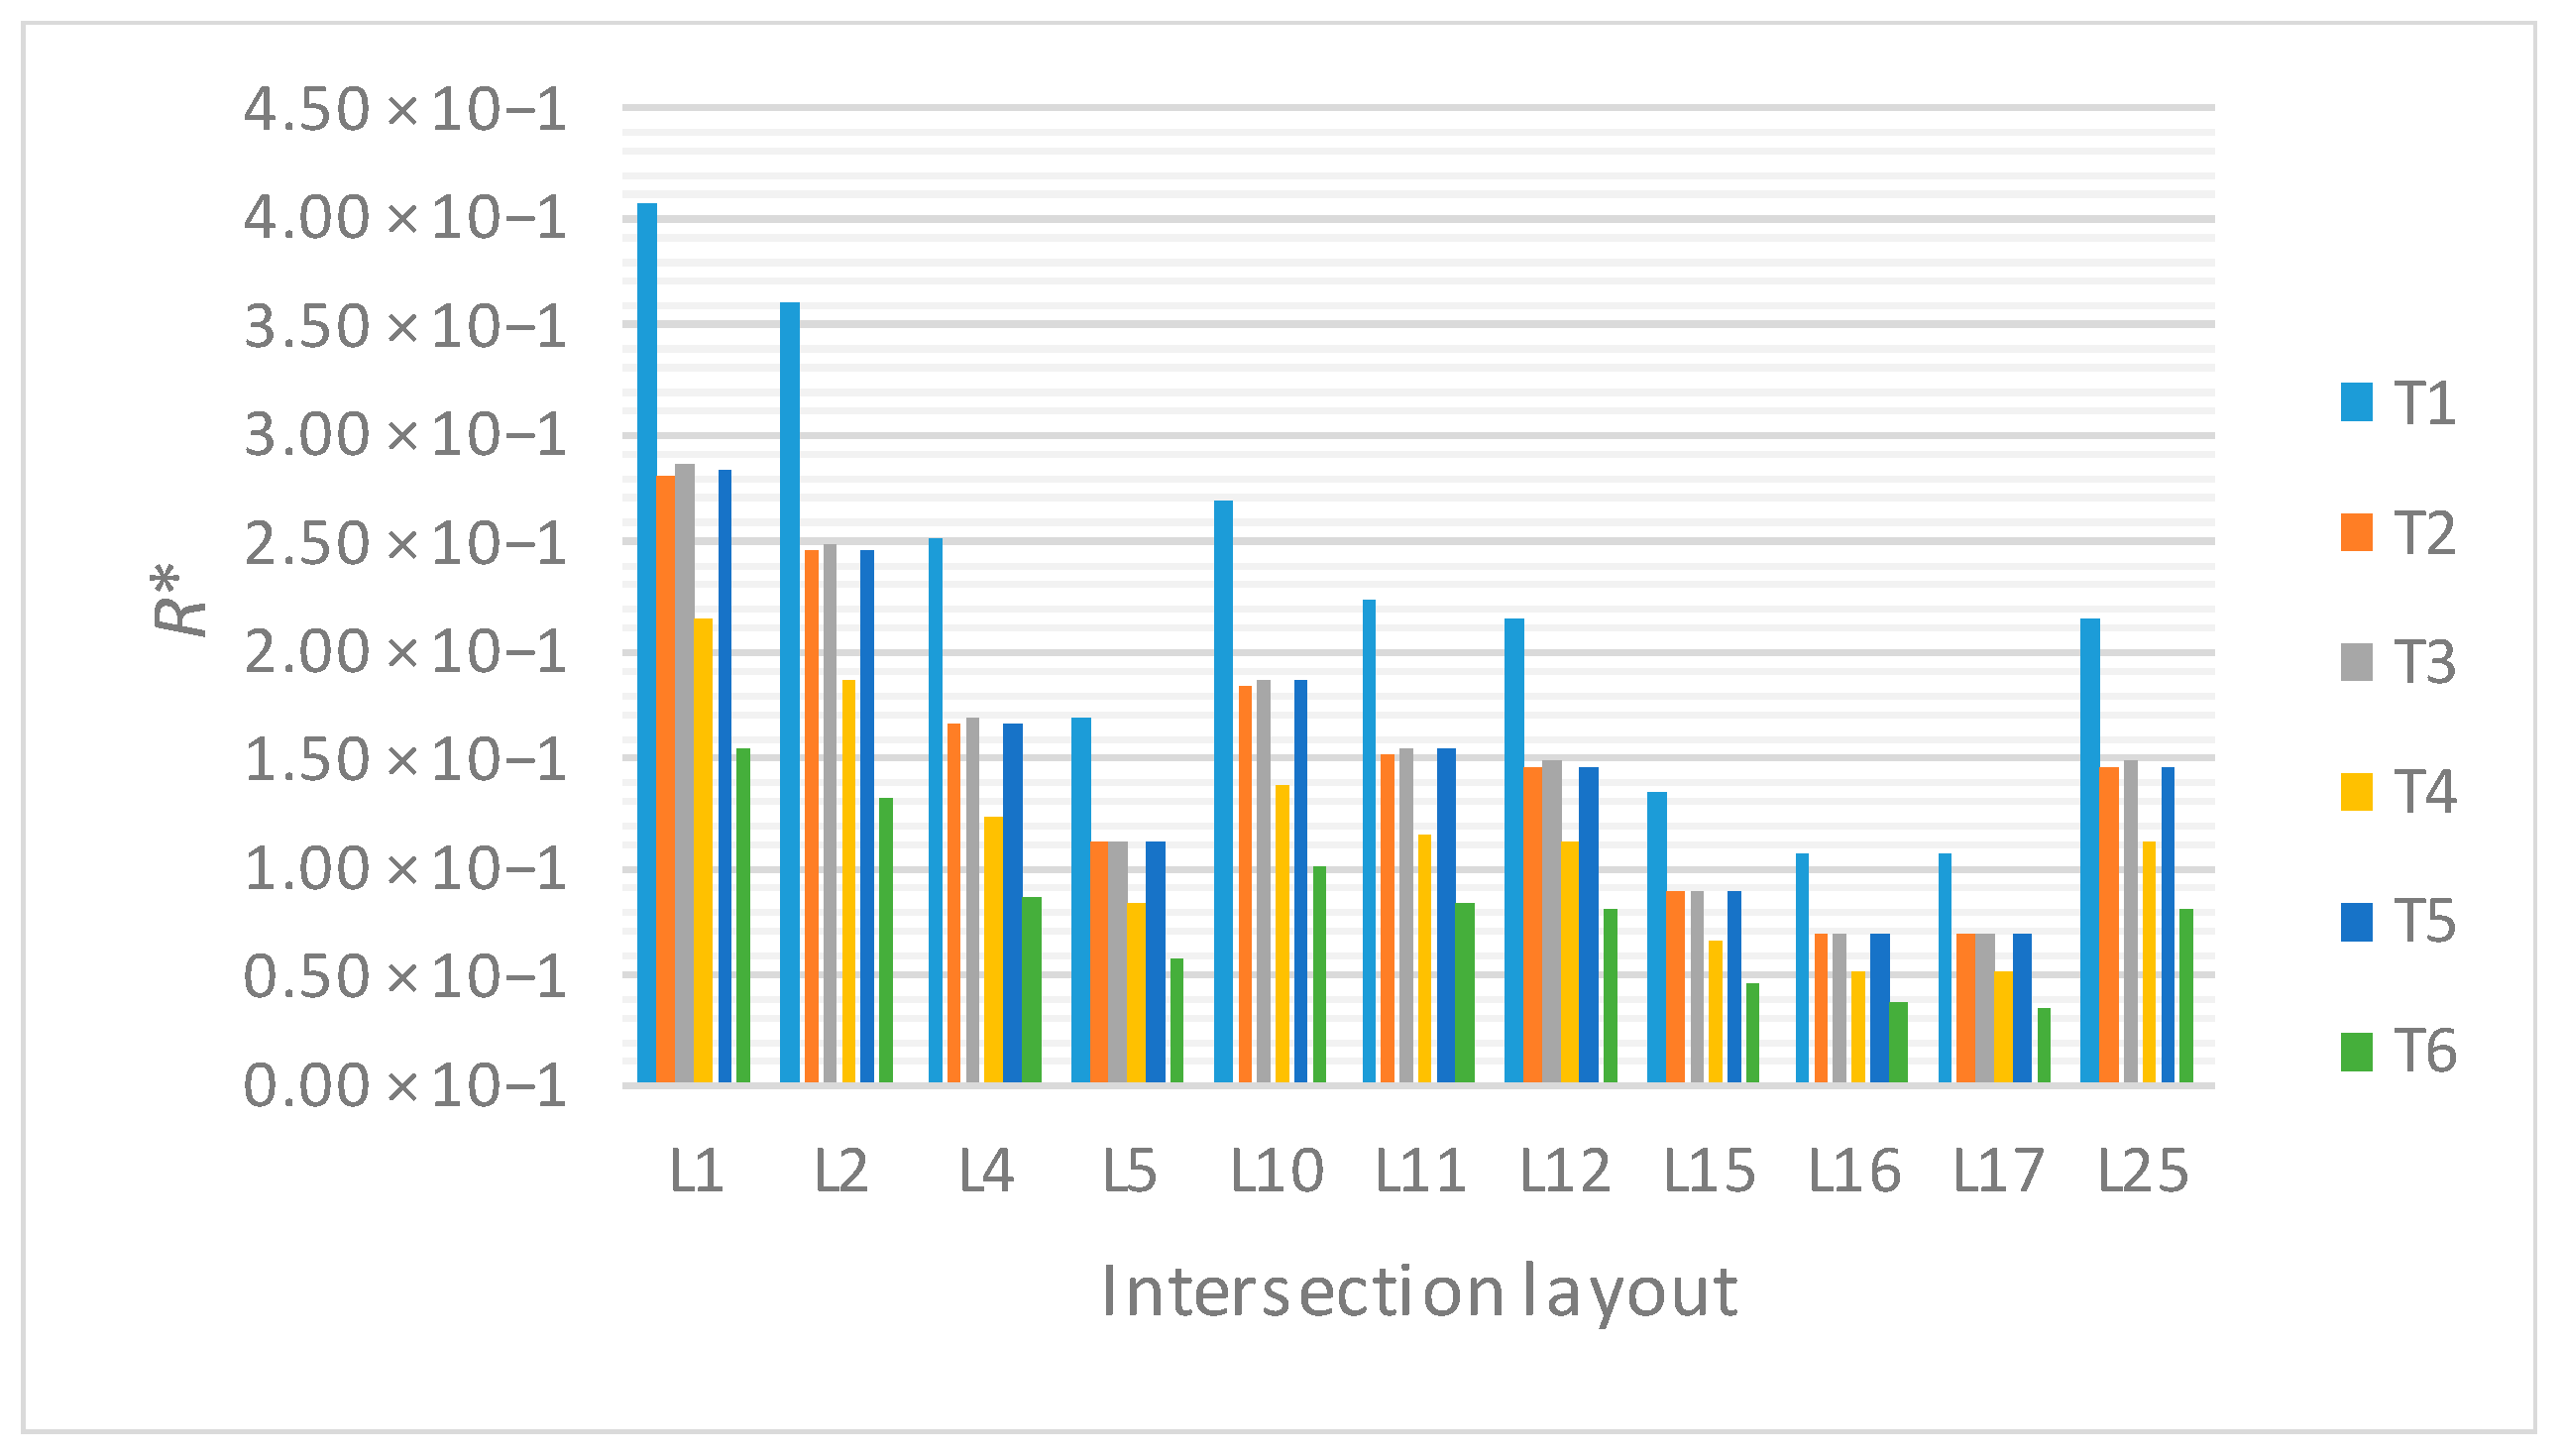
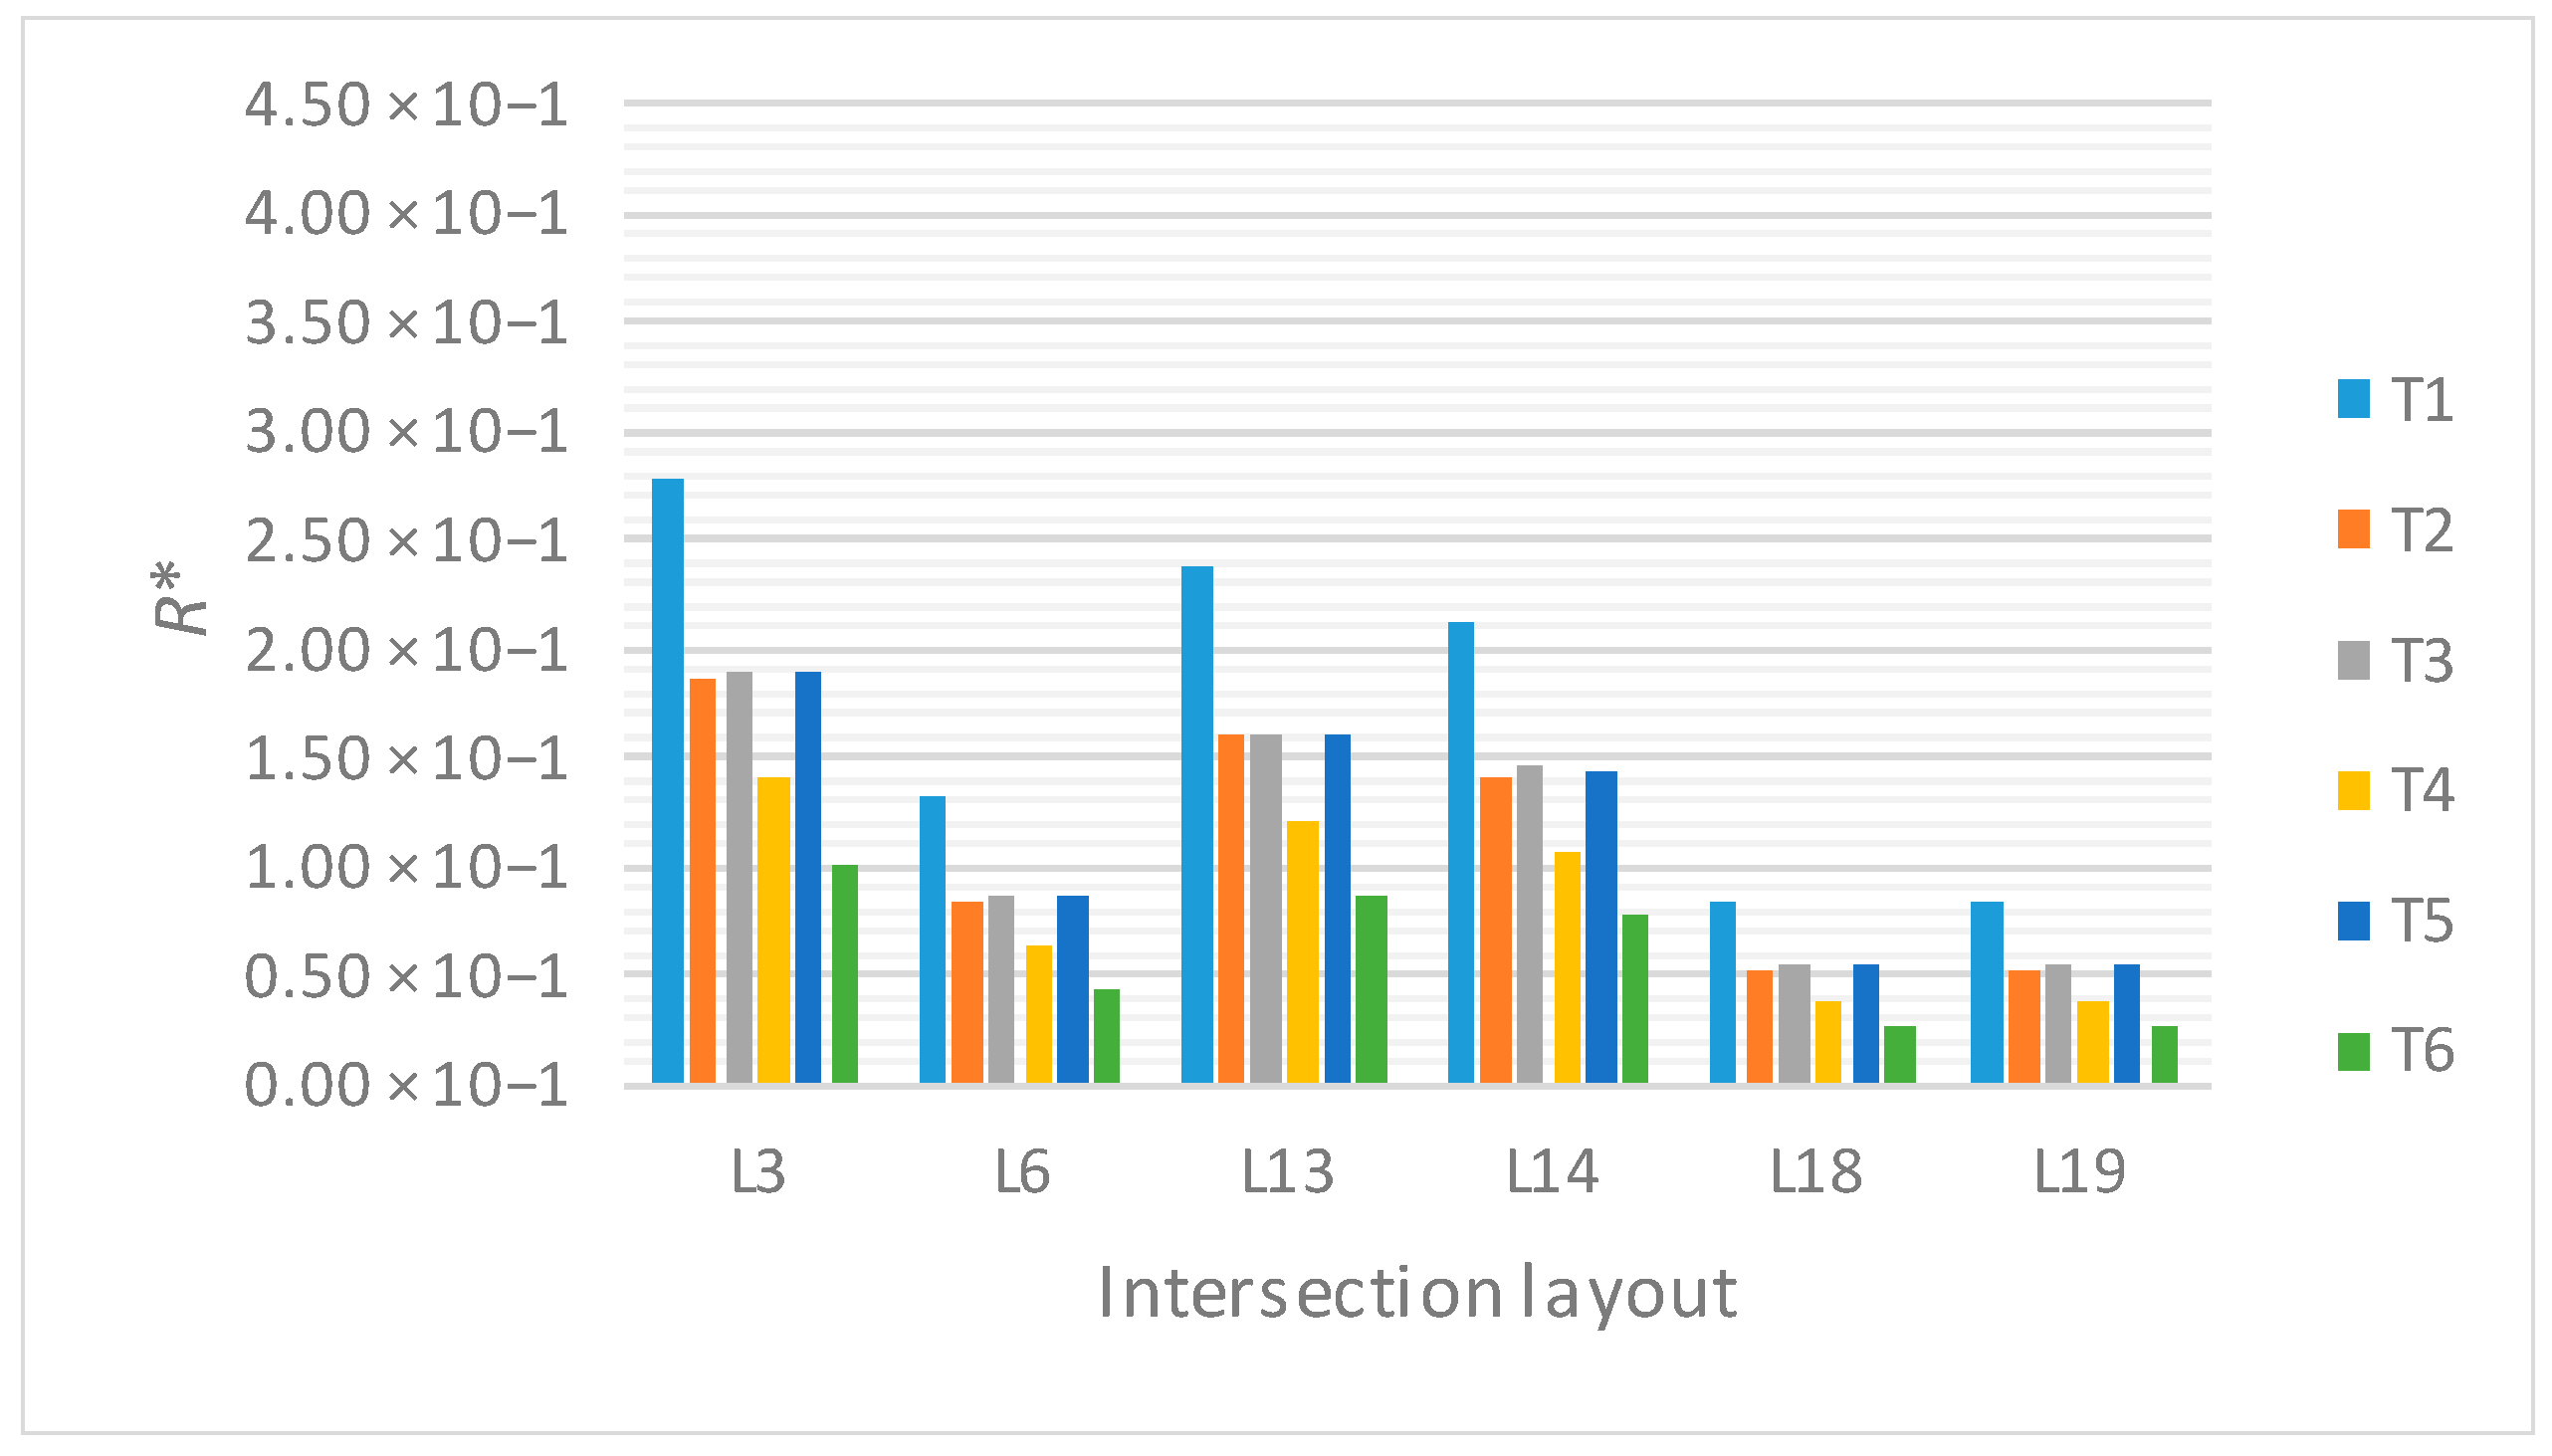
The quantitative results listed in
Table 6 and
Table 7 allow for a comparative and objective analysis between traffic levels and intersection layouts. According to the results in
Table 4, regardless of the traffic volume, the
R* value of the starting layouts (i.e., L1, L2, and L3) was greater than that obtained for the modified layouts; thus, all the proposed layouts are able to improve the safety level of the intersection (
Figure 7 and
Figure 8).
Therefore, the choice of the optimal design solution should consider the constraints of the site and the specific needs according to the real traffic conditions.
In particular, according to
Table 6 and
Table 7, the following conclusions were drawn concerning the traffic volume:
The high traffic volume (both of motorized vehicles and bicycles) of T1 affected the high values of R*, which were on average double those of T2, T3, and T5;
Small differences of R* existed between T2, T3, and T5 (on average not more than 1%);
T6 implies R* values that were on average 62% less than those calculated for T1.
Regarding the geometrical and functional layout, the following conclusions were made:
A traffic light setup to temporally separate flows from different directions (i.e., L4 and L5 in
Table 6, and L6 in
Table 7) had a tangible impact on the level of safety because, on average, it reduced the
R* values of the starting layouts by half (i.e., L1 and L2, and L3, respectively). However, comparable results could be obtained by implementing yield line retraction and counter-clockwise circulation for bicyclists;
Counter-clockwise circulation for bicyclists reduced the risk of crash. On average, the value of R* of L10 was equal to 65% of that calculated for L1, while for L13 it was 86% of that calculated for L3;
The yield line retraction added to the counter-clockwise circulation for bicyclists gave interesting results—in L11 and L14, the values of R* were 55% and 77% of those calculated for L1 and L3, respectively;
However, in all the examined scenarios, the often-conflicting objectives of motorized vehicles, bicycles, and pedestrians cannot be overlooked when designing the best layout. The disadvantage of shared areas between different road users should be minimized, taking all categories of traffic into account.
The proposed approach could be implemented in different symmetrical four-leg intersections (e.g., with one lane per direction or with bike lanes on each side), or to not-perpendicular four-leg intersections and intersections with different numbers of legs, or to intersections where not all maneuvers are permitted. Therefore, the road management body could identify the best choices to increase the level of safety at the network level.
5. Conclusions
Road design should focus on the safety of users, particularly when different types of users interact and share the space. At-grade intersections are among the most hazardous road branches, where trajectories of heavy and light vehicles, bicyclists, and pedestrians interact.
This paper assesses the risk of collision between motorized vehicles and bicycles in different geometrical and functional layouts of a four-leg urban intersection where all users can perform all types of maneuvers (i.e., crossing, left turn, and right turn) and all the users arrivals/headways are independent of each other. Three starting layouts were examined with consideration of the number and hazardousness of conflict points, the reaction time available to drivers of motorized vehicles to avoid crash, and the current level of collision risk. Different strategies were compared in order to reduce the number of conflict points, to increase the reaction time available to a driver of a motorized vehicle to avoid a collision, and to reduce point-to-point and overall risk level. In particular, the installation of a two-phase or three-phase signal, the retraction of the yield line, the institution of areas reserved for bicyclists, and the creation of counter-clockwise circulation were considered with regard to different traffic mixes. The most effective solutions were found to consist of the installation of a three-phase signal, but they seriously affected the operational performances of pedestrians and motorized vehicles. Thus, these layouts could be implemented only when the traffic volume of bicycles is very important. When the bicycle traffic volume is modest, low-impact geometrical and functional strategies can be implemented. The retraction of the yield line gave interesting results (on average, the risk of collision was halved with respect to the starting configurations), but it does not optimize the use of road spaces. On the other hand, the counter-clockwise circulation of bicyclists seems to be the most feasible solution (on average, the risk of collision was 65–86% of the value calculated for the starting configurations), balancing the often-conflicting objectives of motorized vehicles, bicycles, and pedestrians.
Moreover, the obtained results highlight the need to identify and decide upon strategic priorities concerning modifications to improve the safety level of urban intersections. For this purpose, transport and cost/benefit analyses should be carried out to test the feasibility of introducing these solutions, because the proposed risk assessment does not allow economic evaluations.


