1. Introduction
The choices in terms of the design of a safety-critical architecture classically rely on the required safety and reliability targets. Although these architectures have now spread to different fields, the constraining trend of the reference safety standards requires more frequently assessing the pertinence of the hypothesis used for the demonstration. Basically, lots of methodologies can be adopted to demonstrate the fulfillment of safety and reliability targets.
Within the railway domain, CENELEC standards are required to demonstrate a lack of systematic safety-relevant failures, and that random failures occur with a frequency directly linked to the desired safety target, also called the Safety Integrated Level (SIL).
The more demanding target in the railway domain is the SIL4, which is related to an occurrence of 10−9/h of safety-related failures. Several methodologies can be adopted to demonstrate the quantitative estimation of safety targets: most of them rely on a basic metric, the failure rate.
Let us take the example of a fault-tree analysis (FTA), in which the top event is the scenario we want to avoid, and the basic events (BE1 and BE2) are the elementary events that, once combined, can lead to the hazardous situation. The hypothesis considered is that the occurrence of each single event can be detected and passivated. Under this hypothesis, the latency, considered as the time in which the event has occurred but not detected or passivated, plays a key role. The two considered events are independent and the event BE1 is “tested” each T1 hours (in order to reduce the latency), while for BE2, the time considered is the time of the mission (supposed to be 30 years).
It is a common belief that electronic behavior is described by reliability functions based on constant failure rates throughout the entire life. Within this case, wearing-out phases are not taken into account.
The way reliability performances are determined is then crucial because the adopted assumptions can impact the quantitative analysis and, consequently, choices on architecture and allowed latency for safety purposes.
Although railways can benefit from the existence of standards providing recommendations for reliability aspects, the CENELEC EN50129 [
1] standard does not specify the process by which reliability evidence has to be gathered. CENELEC EN50129 directly or indirectly refers to reliability prediction models for the demonstration of reliability figures, implicitly considering the assumption of a constant failure rate. The massive presence of reliability prediction models such as FIDES [
2], MIL-HDBK-217F [
3], or RDF2000 [
4], all based on the constant failure rate hypothesis, might contribute to an abuse of exponential distribution, determining a complete misalignment between predictive and operational reliability figures [
5,
6,
7] that are adopted to describe the basic events that could lead to hazardous situations. These reliability prediction models aim at providing empirical formula in order to determine the (constant) failure rate for each component of the board. Moreover, the use of such reliability prediction models might lead to inaccurate reliability figures, calculated as the sum of the reliability of each component of the board.
Despite the fact that the cost of implementing such reliability models at the beginning of a project can be relatively low compared to more complex models, the non-achievement of reliability or safety target could lead to high costs during the project life.
The use of more realistic distributions, like Weibull distribution, has been demonstrated in several works pertaining to railway infrastructure [
8], and is common in other industrial domains.
In most industrial fields, the Markovian assumption considering the failure rates (or mean time between failures) as constant is no longer considered acceptable since systems are aging. This is also the case in the railway industry. A literature analysis can thus underline that, in reliability and safety analysis of infrastructure components, it is commonly accepted that Gamma processes are particularly adapted to model the track geometry degradation [
9]. Petri nets are also used to model the degradation of the track [
10] or to analyze the safety of level crossings. Piecewise deterministic Markov processes were also used for the reliability analysis of air conditioning systems for rolling stock [
11]. Among all the standard stochastic approaches for modeling reliability and safety, the use of the Weibull distribution has been particularly relevant in the railway field, for infrastructure as for rolling stock.
Thus, Weibull approaches are often considered to model the degradation of rails [
12,
13] and sleepers [
14] but also rolling stock components such as bearings [
15] or wheels [
16].
Finally, the only railway field still reluctant to undergo this evolution is the railway signaling industry. Indeed, most studies still consider that all electronic devices verify the Markov hypothesis [
17,
18,
19]. Moreover, this misconception is a common basis for industrial practices.
If this assumption was true in the past, the evolution of electronic structures, components, and materials seems to introduce changes in this behavior. The aim of this study is to sensitize the community to another possibility, by benefiting from the domains where the use of Weibull distribution is widely adopted.
The disadvantage related to inappropriate reliability estimation approaches might have an impact on the achievement of safety and reliability targets, resulting in a complete misinterpretation of the performances of complex systems as depicted by [
20,
21,
22], and cost of mitigations that have to be undertaken to cope with this problem.
What if the reliability misestimating is discovered only after the safety-related architecture has been set up?
The aim of this paper is to investigate the possible consequences of the unjustified adoption of a constant failure rate and to provide insights to enhance the process for gathering reliability-oriented data from systems already in revenue service by working on both the logbook and the functions of the electronic system [
23,
24].
2. Considered Railway Signaling Systems
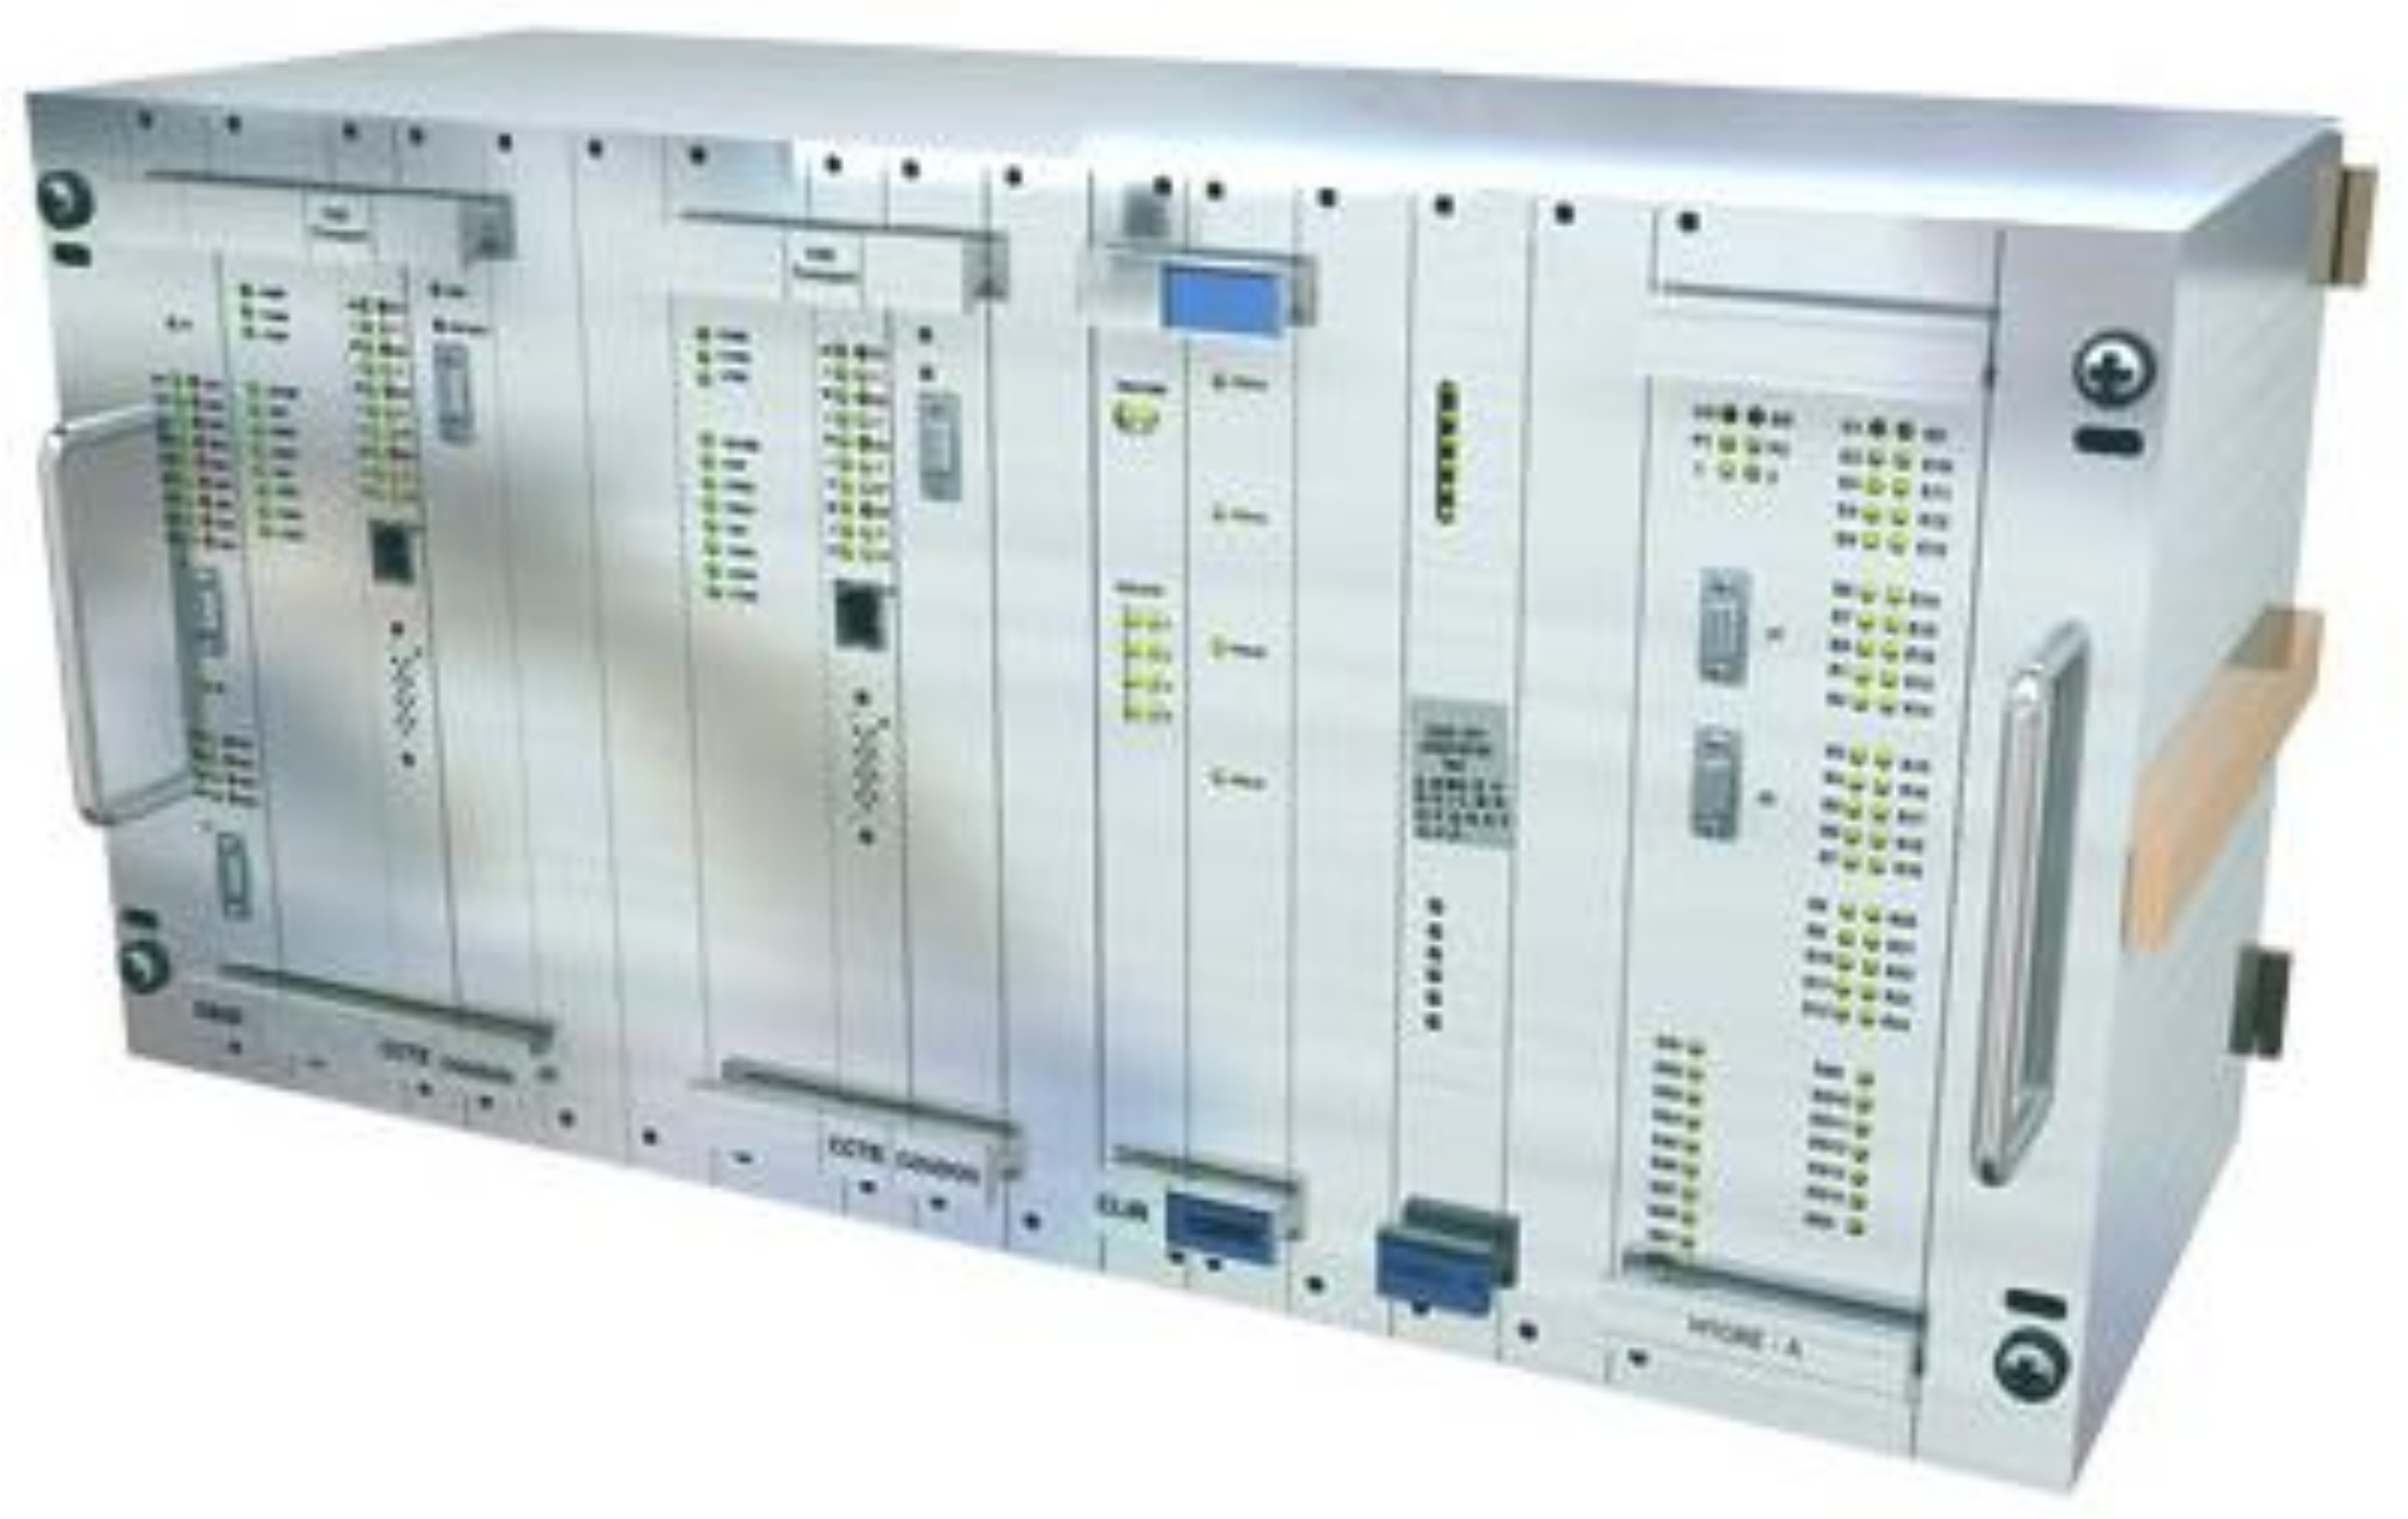
All electronic railway signaling systems, like the one presented in
Figure 1, could benefit from the considerations presented in this work. The problem of fulfilling reliability and safety targets is common to onboard and wayside signaling systems, both for high-speed lines and metro applications. Despite the generality of the approach, some railway systems require more constraining target, like communication-based train control (CBTC). CBTC is a railway signaling system based on communication between the train and the track in order to perform traffic management and infrastructure control. CBTC systems can ensure a more accurate positioning of the train compared to traditional signaling systems such as track circuits, thus ensuring more efficient and safer traffic management. Moreover, the headway is improved while safety is maintained (or even improved). Modern CBTC systems allow different levels of automation (technically known as Grades of Automation (GoA)). They range from “manual protected operation,” GoA 1, to “fully automated operation,” GoA 4, also referred to as a “driverless solution.”
In case of driverless solutions, unavailability might have several impacts that cannot be neglected:
- -
Potential safety-related impacts due to the fact that a train that is wrongly stuck down might be linked to inappropriate and unsafe evacuation passenger procedures;
- -
Service availability impact, because a blocked train can be removed only by means of a so-called “rescue train” that is used to drive the failed train to a depot. This case might dramatically impact the availability of the whole line, causing an unacceptable degradation of the headway.
The overestimation of safety and reliability performances might be due to the bias induced by unverified reliability models. Quantitative analysis, like FTA, adopted to numerically estimate the performance, is based on failure rates of components that need to be correctly addressed along the whole life of the system. That is why adopting Weibull distribution is one of the key recommendations of this paper.
3. Introduction to the Use-Case Study
3.1. Use-Case Definition
In order to move from constant predictive reliability parameters to time-dependent field-based ones, Weibull distribution is chosen to describe the behavior of a use case identified in an electronic railway signaling system [
25,
26]. The probability density function (denoted pdf) mathematically defines the Weibull distribution, which is widely used in life-data analysis:
where
β is the shape parameter, also known as the Weibull slope;
η is the scale parameter;
γ is the location parameter.
In this paper, the location parameter γ will be assumed to be zero. The value of the β parameter has a huge impact on the whole Weibull distribution. If β < 1, the failure rate decreases over time, a condition known as early-life or infantile failure. Weibull distributions in which β is close to or equal to 1 have a constant failure rate, indicative of useful life or random failures.
In case β > 1, the distribution presents a failure rate increasing with time due to wear-out failures. The three sections describe the classic “bathtub curve.” A mixed Weibull distribution with one subpopulation with β < 1, another with β = 1, and a third one with β > 1 would have a failure rate plot identical to the bathtub curve [
25,
26].
The fact that, in some cases, the initialization time of the degradation is unknown (introducing a left censor) would require the use of a negative Gamma parameter. Nevertheless, considering such a value would mean that the considered system began its degradation before the initial temporal step
t0 = 0; that is far from reality and should induce a stronger bias that censored data themselves. For this reason, in this study, a Gamma = 0 was chosen. Alternative options [
27] allowing for dealing with censored data could be taken into account but are not considered for this article and will be exploited in further works, although extensions of the expectation-maximization (EM) algorithm are available in the literature [
28].
In order to significantly determine Weibull parameters, field-return data need to be relevant: from this perspective, the reference use-case is a signaling system based on deployed electronic boards and in revenue service since years. Because of the possible impact on the whole maintenance costs, both wayside and on-board equipment have been considered for this application.
Each circuit board composing the signaling system is a line replaceable unit (LRU) of the system; the LRU is an element that can be replaced on site and with standard techniques and tools to restore the operating status following a failure.
3.2. Field-Return Data Processing
Field-return data are collected in a database represented by the after-sales service logbook. The after-sales department collects all the boards that are brought back to the maintenance workshops for repair when they are out of service or have experienced failures after deployment. A huge amount of data is present within this database:
Name and serial number of the board: for the unique identification of the circuit board.
Customer indication and project data: provides a useful link to the relevant people involved in the project to gather critical information, which is often not included within the database. This information is also useful to perform project-specific reliability demonstration tests and evaluations.
Part number and revision number: allows for clearly identifying a bill of material (BOM). Each circuit board could have different BOMs along its life, in case obsolescence phenomena or retrofitting occurs.
The date, on which the board was brought back to the after-sales service for the calculation of the TTF (Time To Failure). This information must be supplemented with further details such the deployment date in order to have an accurate calculation. Moreover, depending on the customer’s policy, this could potentially not be the date on which the failure occurred. This phenomenon, known as censoring, might affect the accuracy of the TTF calculation with a subsequent impact on the determination of reliability figures.
Customer analysis of the failure: describes observations of the customer about the failure event.
After-Sales analysis: based on the knowledge of the electronic board and the analysis of the customer, it describes the real failure that occurred on the board. In some cases, no failures are detected and the logbook reports “no fault found.” This information is not relevant for reliability purposes.
The structure of the database used to collect relevant information has not been designed for reliability purposes, even if the amount and quality of information available is impressive: the number of boards deployed within a given project and the deployment information are not included in the database. As a consequence, relevant persons of the targeted projects are involved to retrieve or fill in the missing information, causing a delay and uncertainty in the processing of the information
3.3. Field-Return Data Analysis: The Case of Censored Data
After-sales database has been processed by selecting different types of boards in the use-case.
Investigations have been made to gather all the possible data from the maximum number of projects. Some old projects were affected by censored data, meaning that observations of failures and TTF are only partially known, like for projects in which the complete deployment of the signaling equipment lasted months or years. In such a situation it is not possible to accurately calculate the TTF on the basis of the boards brought back to the after-sales department.
In further cases, the beginning of the revenue service phase has been delayed even if the signaling system was already installed and deployed. Even in this case it is not possible to accurately estimate the TTF.
Another source of data censoring is the supply policy of specific customers: in some cases, customers buy big stocks of boards that are gathered in a dispatching center for an unknown period. The customer decides when and which project has to be provided with a given number of boards: this might have a major impact on reliability analysis. Censoring might also affect the moment at which the failure is accounted for.
On-field failure might not be immediately recorded: the effective record depends on the frequency of inspections of the system.
Before bringing the electronic boards back to the provider’s maintenance department, the customer might collect several items affected by failures. The moment at which the boards are recorded in the after-sales database might hide relevant reliability information.
Even some already known chart formats designed for reliability purposes, such as the Nevada Charts for warranty data analysis, might not be sufficient to cope with that kind of problem.
4. Discussion
4.1. Weibull Analysis
The choice of projects already in service for allows increasing the accuracy of information provided within the database; moreover, these data have been verified by interviews with relevant people involved in each project considered. This allowed for gathering more complete information for the calculation of Weibull parameters.
All the data present in the logbook have been processed in order to remove irrelevant data, for example related to failures associated with “no fault found.”
Once the relevant information has been collected, they are processed by a proprietary tool developed in Matlab® that is able to accurately determine the Weibull parameters associated with the considered set of data.
Results of this processing are shown in Table 2.
Three projects have been selected for the analysis. Field data of one wayside (hereafter called “Board_WS”, WS meaning wayside) and one on-board circuit board (hereafter called “Board_OB”, OB meaning onboard) have been collected.
Table 1 shows synthetic information about each project, called Prj1, Prj2, and Prj3: the revenue service date and the number of boards deployed. These data are essential for the evaluation of reliability figures. TTF information for Wayside board has been gathered on both Prj1 and Prj2.
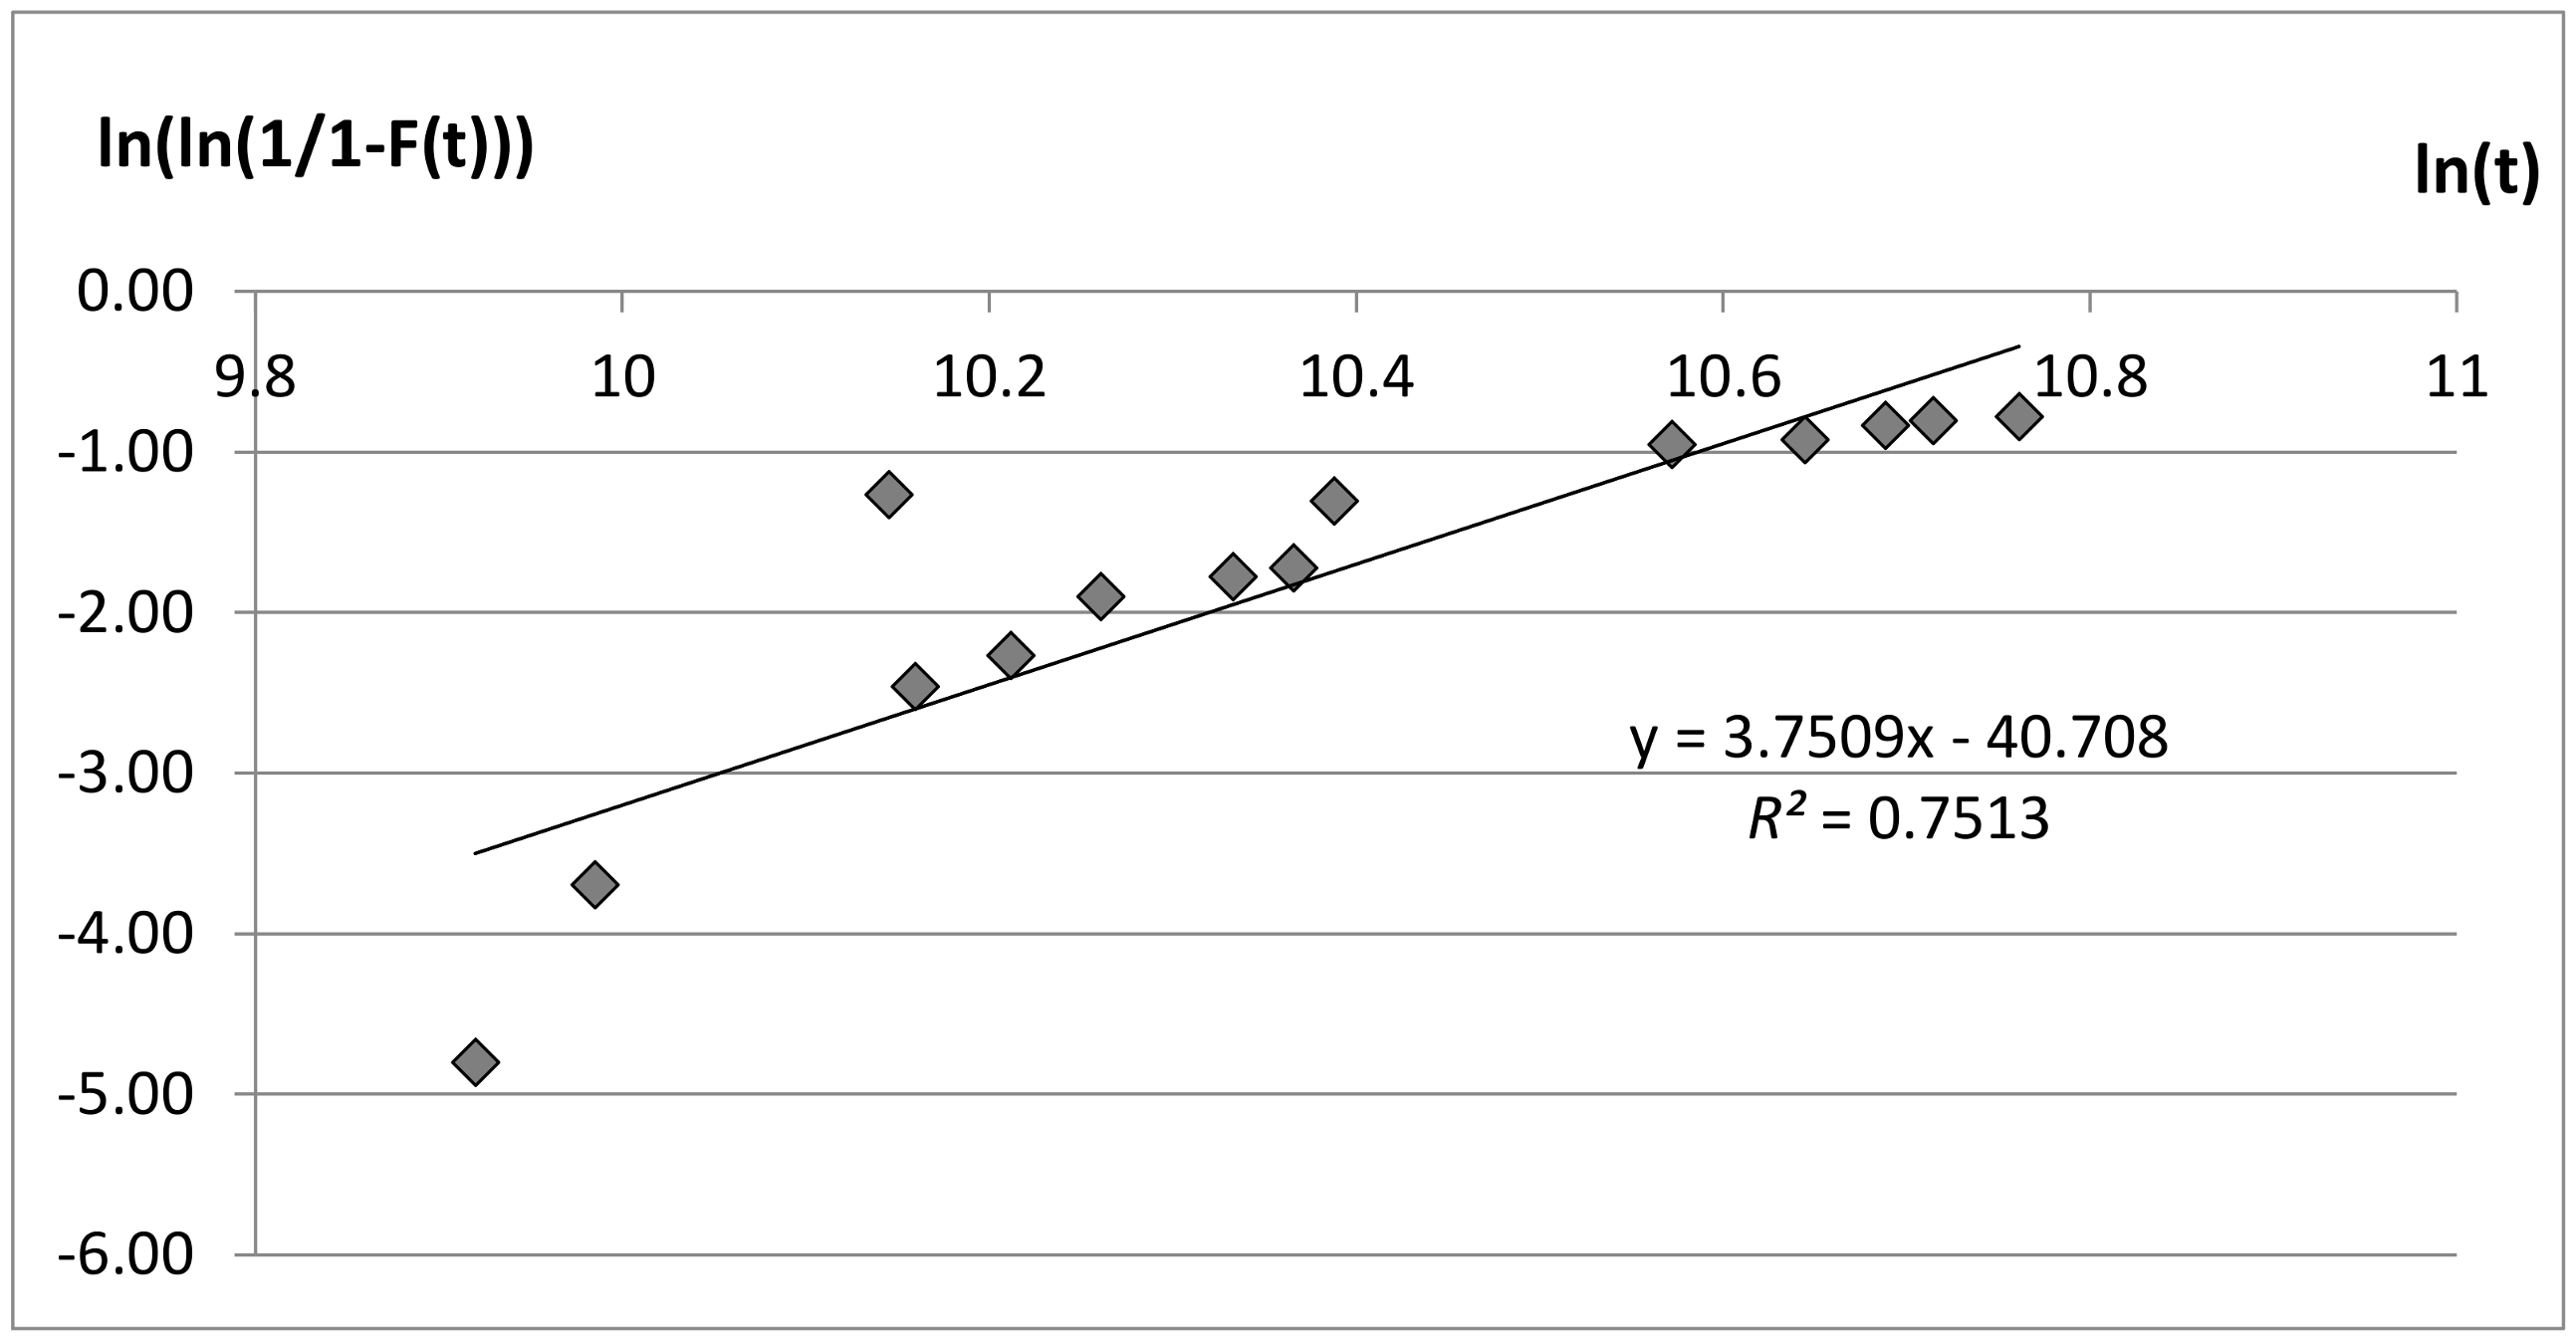
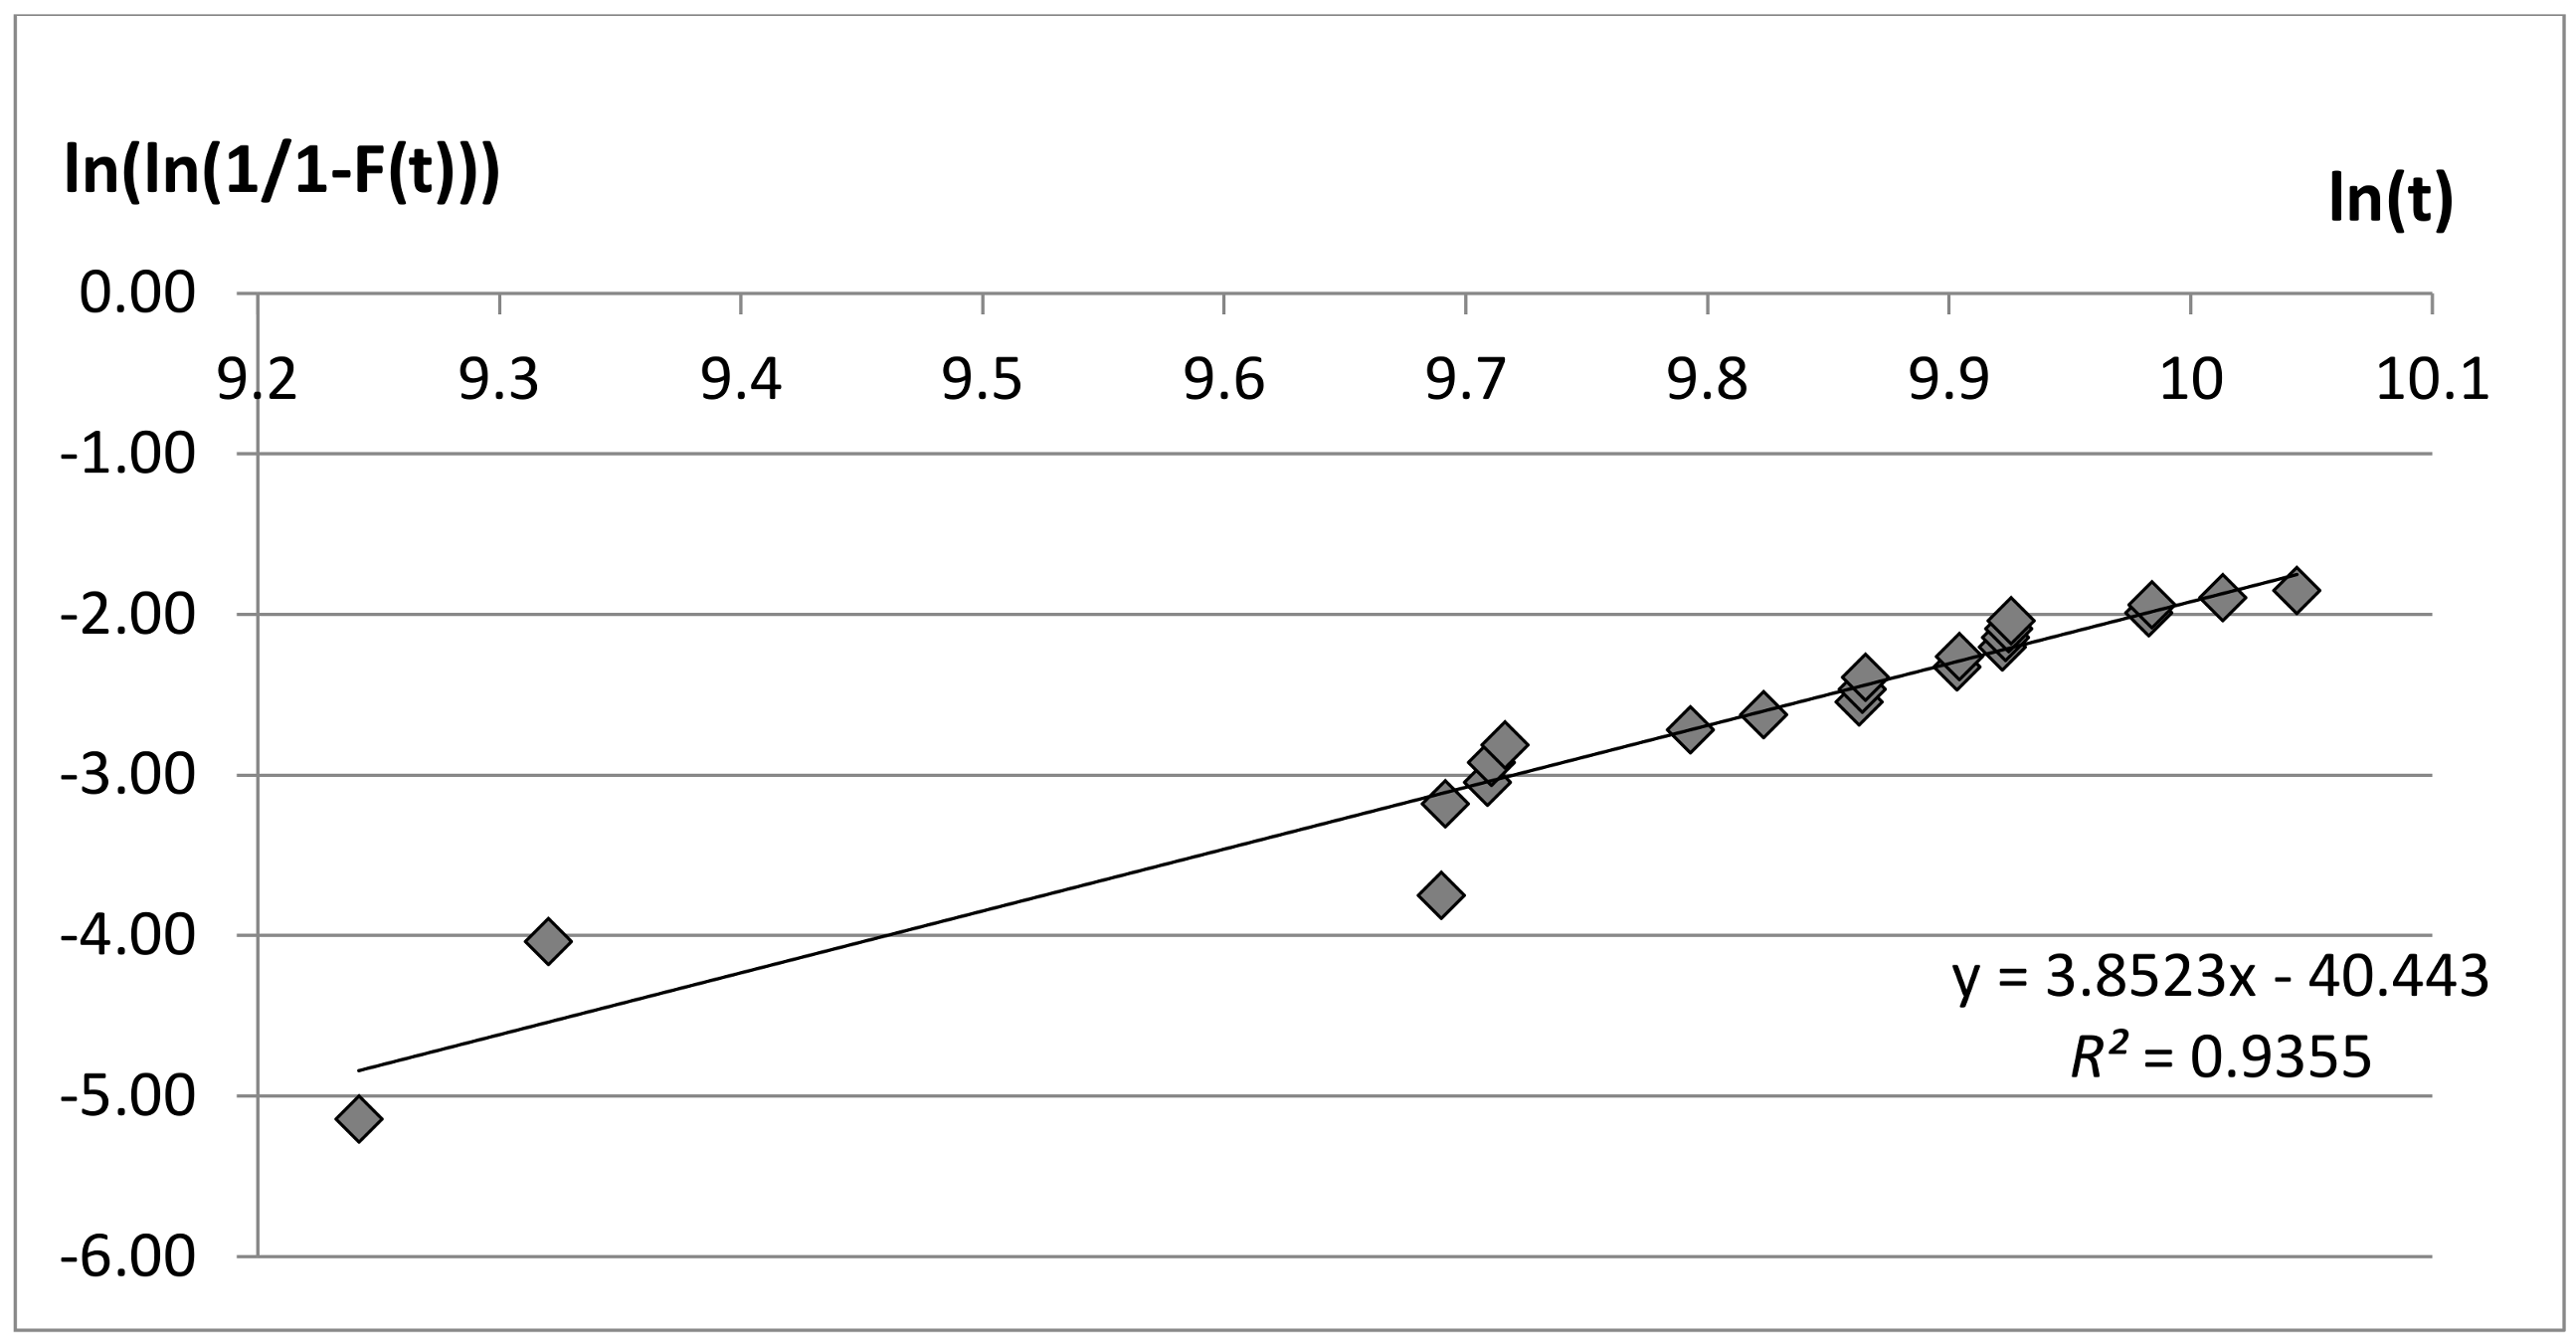
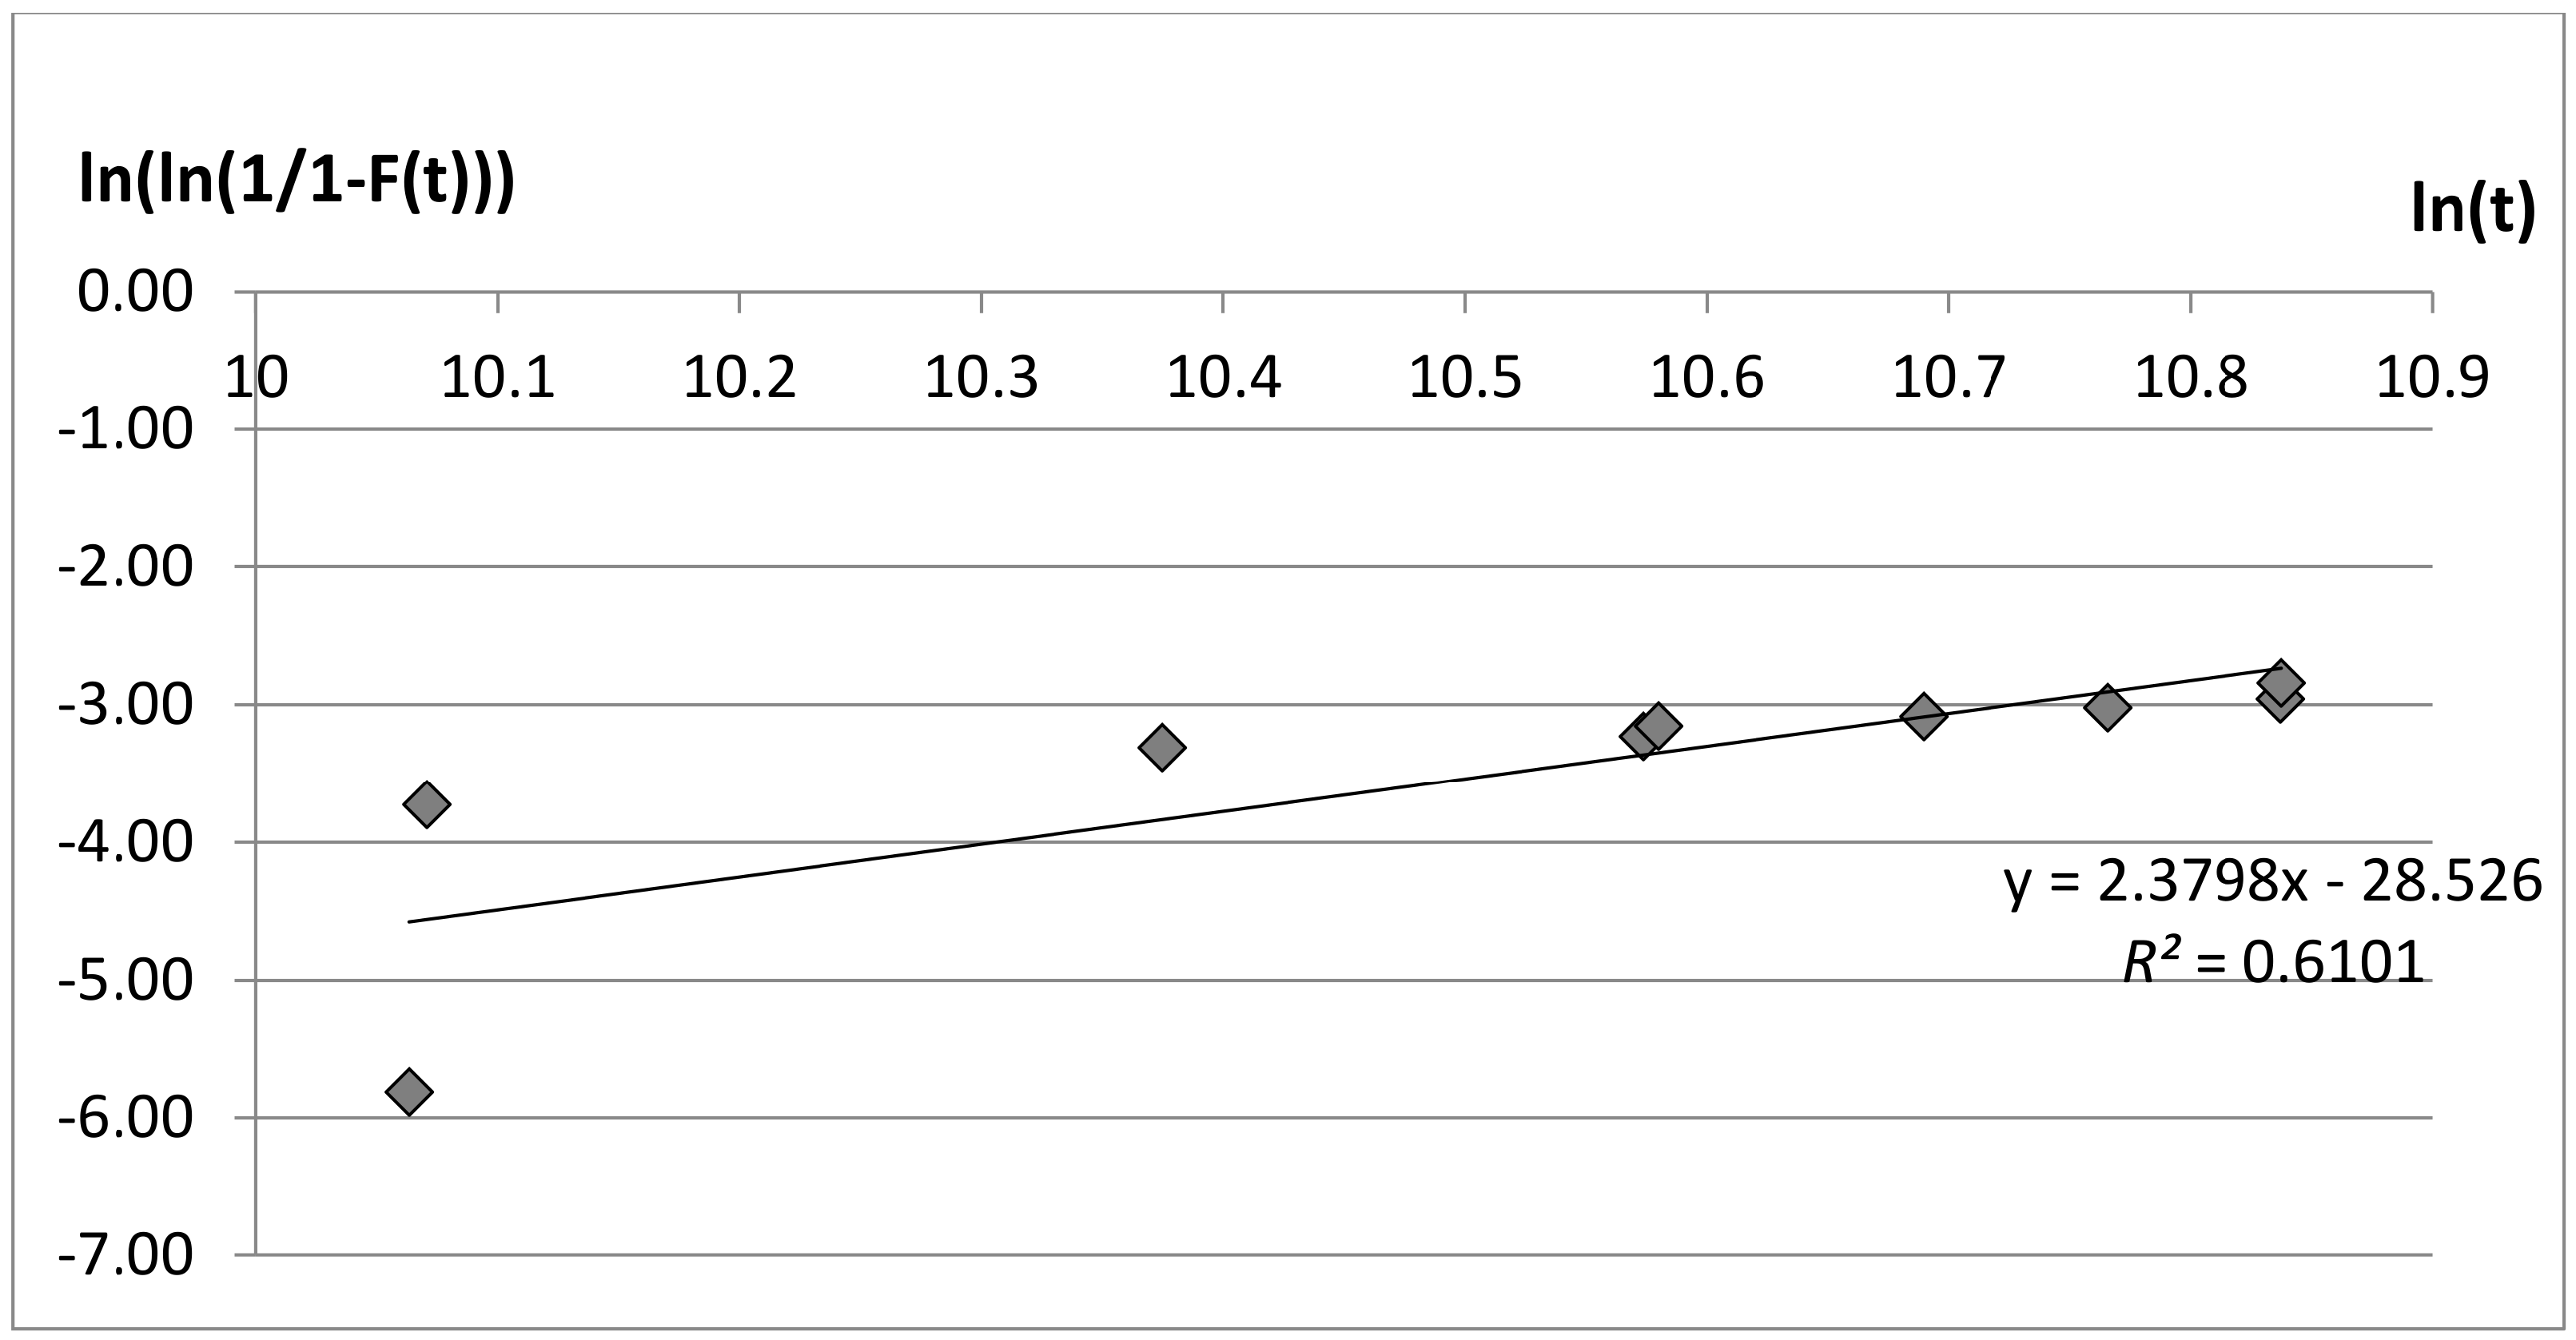
Cumulated failures and TTF information have been plotted for each [board, project] couple on a Weibull chart, as depicted in
Figure 2,
Figure 3 and
Figure 4.
A first graphic approach helps understanding that the β factor is not close to ‘1’ in all three considered cases. Consequently, the hypothesis of constant failure rate, referring to exponential distribution, is not verified. Datasets have been tested to verify that the data follow Weibull distribution. Among the possible indicators providing a measure of how well the observed outcomes are replicated by the model, the coefficient of determination R2 has been adopted: it indicates the proportion of the variance in the dependent variable that is predictable from the independent variable and can vary between 0 and 1. The closer this number is to 1, the better the observed outcomes are replicated by the model. When R2 is equal to 1, the observed outcomes perfectly fit the model.
This coefficient has been applied to each considered project and assumes values of 0.7513 for Prj1, 0.9355 for Prj2, and 0.6101 for Prj3, allowing us to conclude that the data indeed follow Weibull distribution. Numeric iterative techniques, using the “least squares” method, have been implemented, which allows for calculating a straight line that best fits the available data. The equation of this straight line is presented in each Weibull chart, and the slope represents the Weibull parameter, β. Datasets used for the determination of Weibull distribution are mainly right-censored: this is not limiting the determination of the parameters, but is necessary to correct them when new data are made available through an adaptive approach along the whole project life.
Table 2 collects the exact β and η values for each electronic board and associated project. The fact that β value > 1 confirms the distribution is in its wear-out phase. Considering that Board_WS is the same for Prj1 and Prj2, it can be assumed that the behavior of the distribution is not exactly the same within the two projects.
4.2. Failure Rate Estimation
With the calculation of β and η, it is possible to determine and plot the failure rate over time. A comparison of the behavior in the case of exponential distribution versus the case of Weibull distribution is also presented.
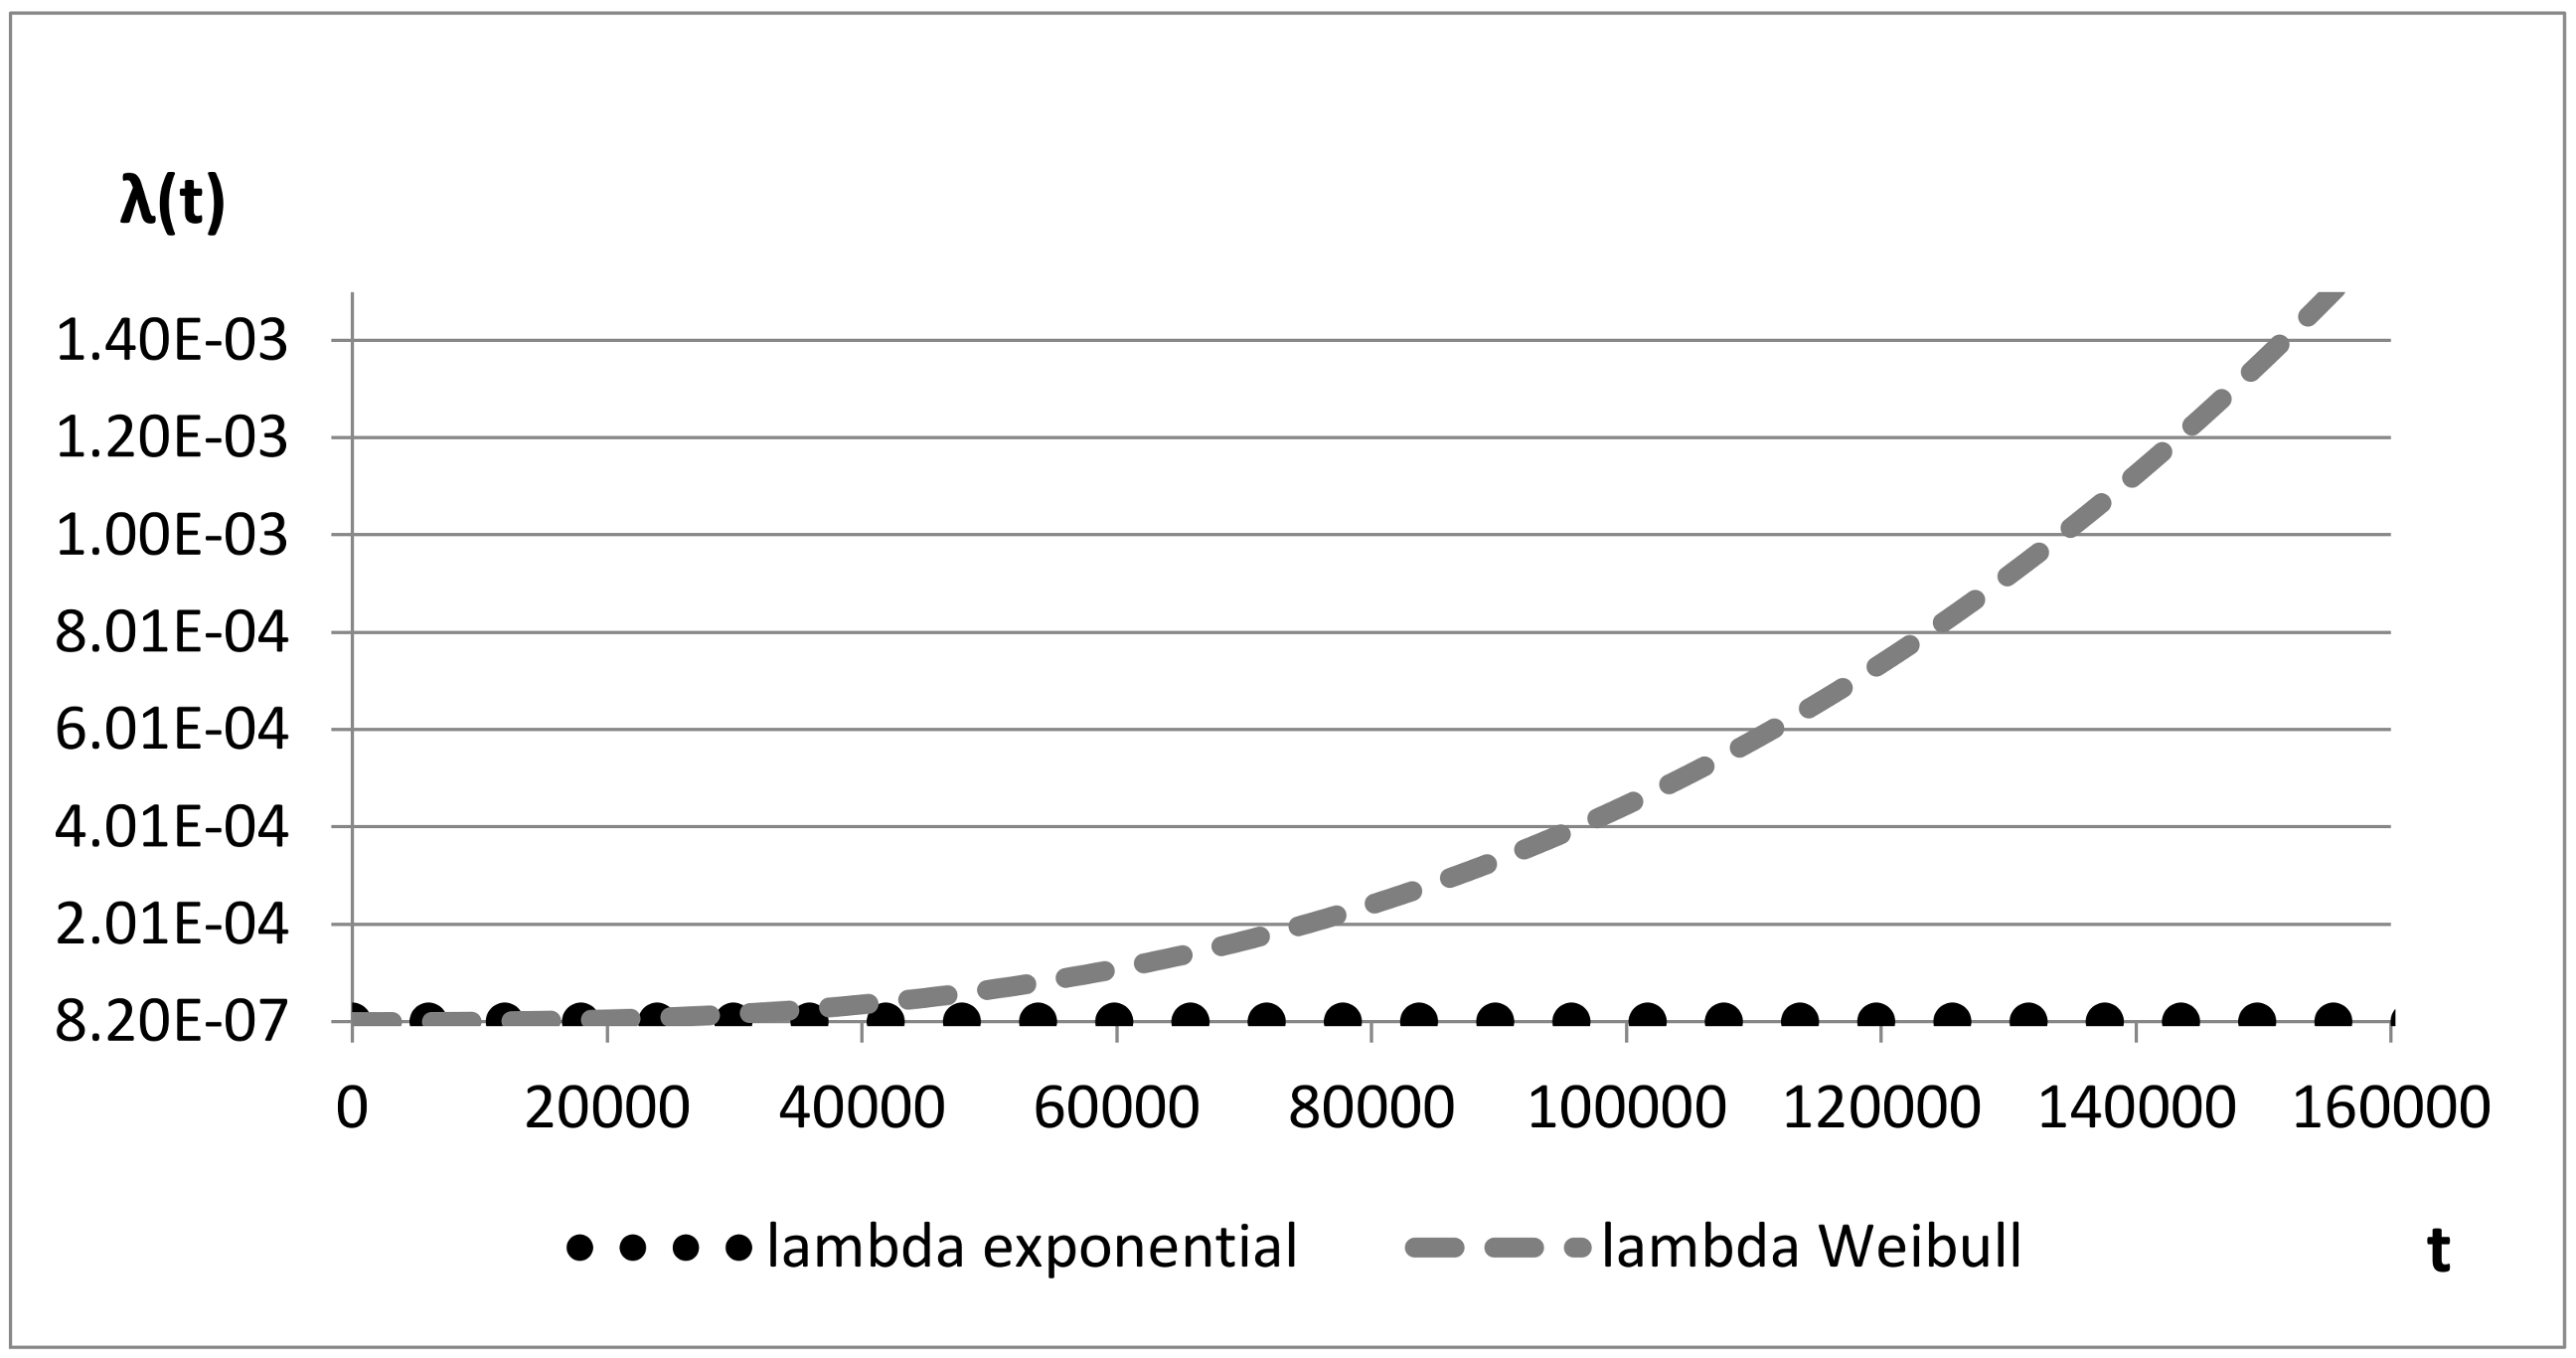
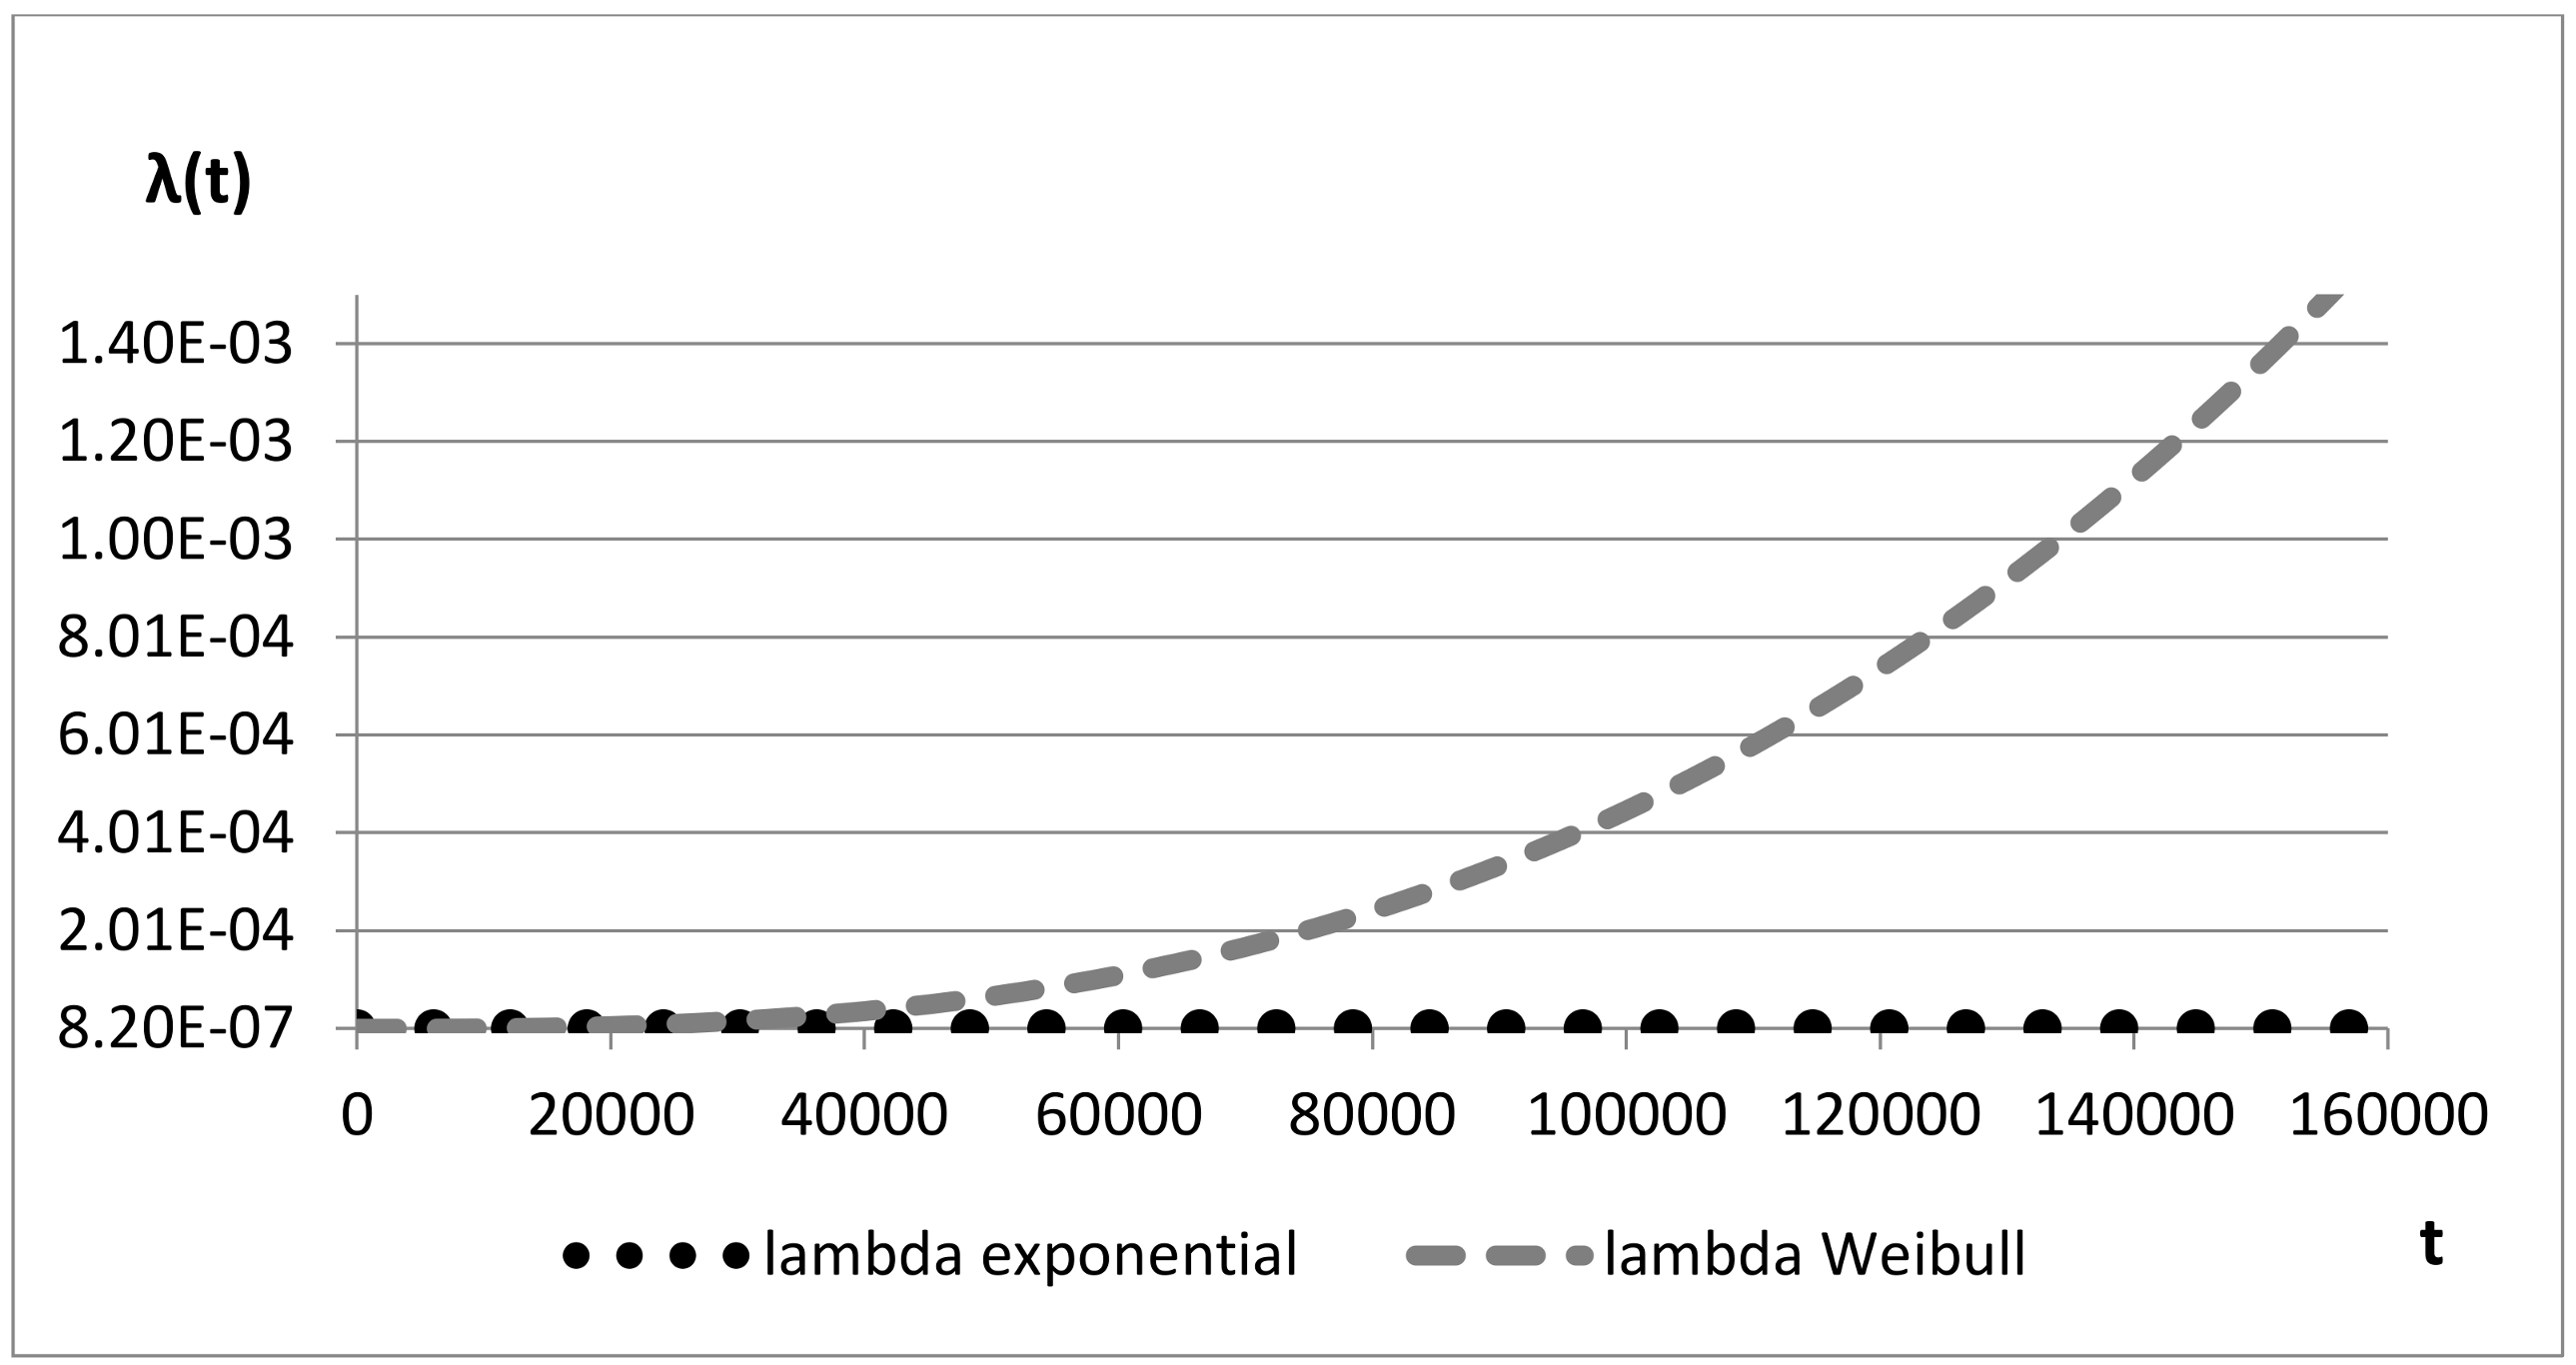
Figure 5 and
Figure 6 compare the constant failure rate, referring to exponential distribution, and the time-dependent failure rate, referring to Weibull distribution, over time: the two values quickly diverge and after 10 years (100,000 h) they have almost four orders of magnitude of difference.
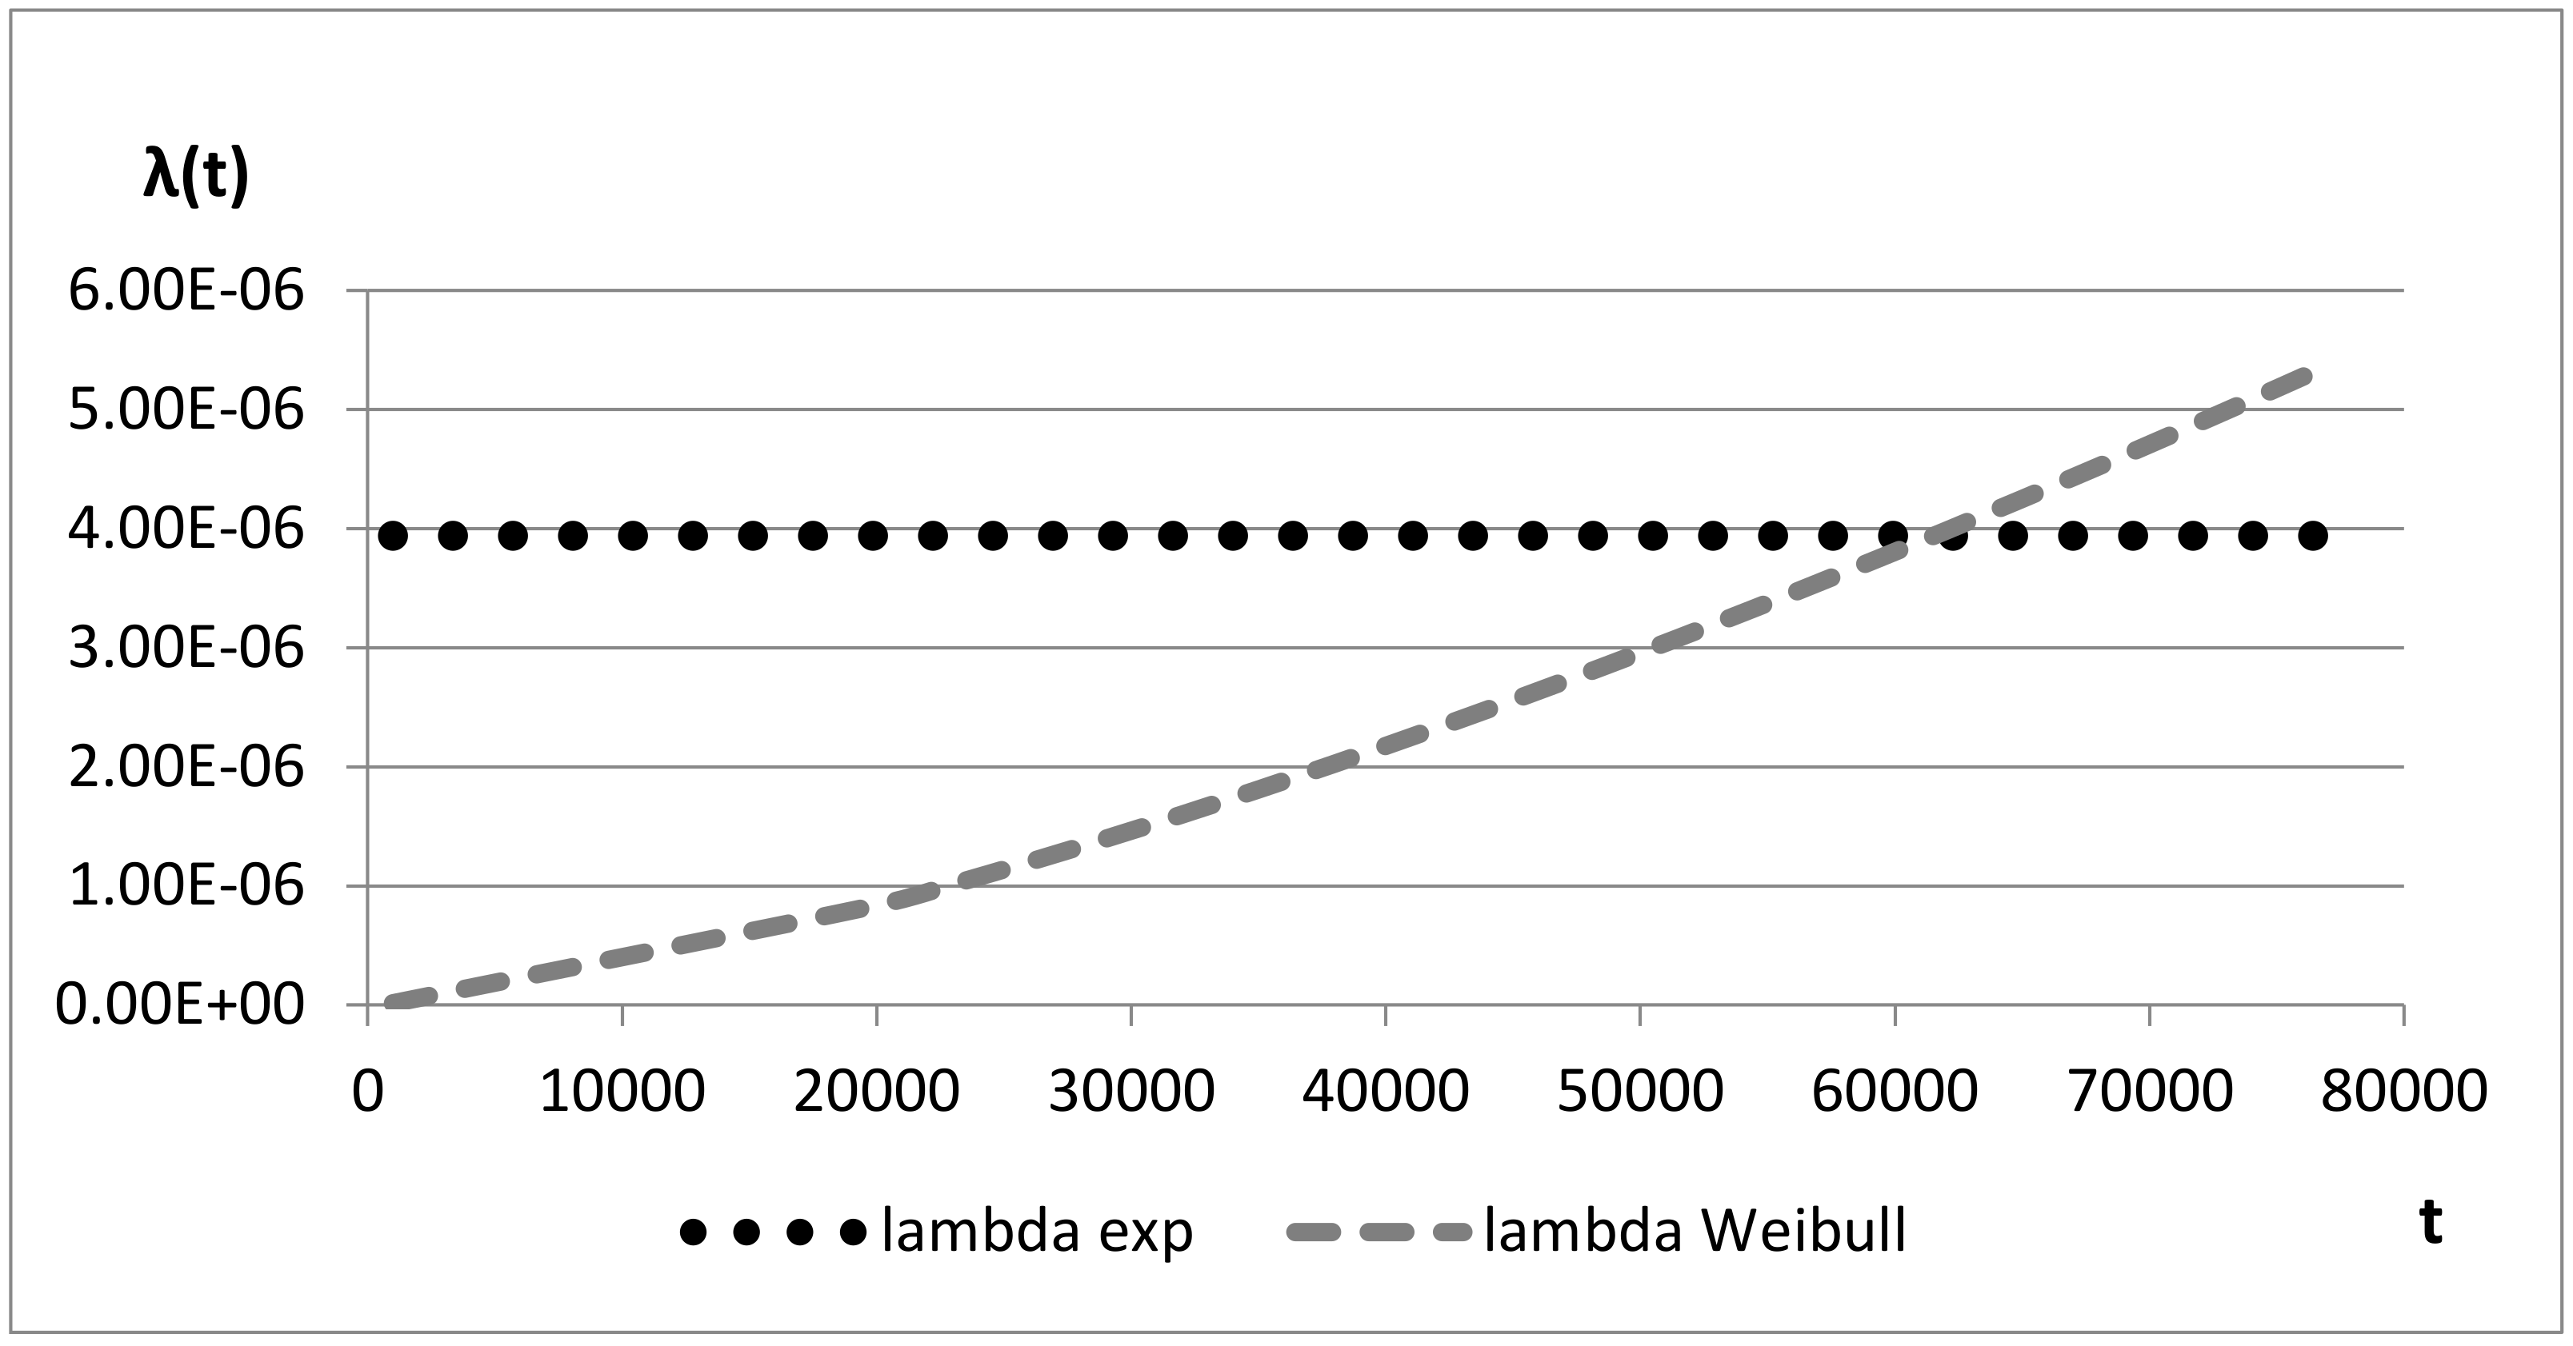
Figure 7 presents the same comparison for Board_OB and Prj3. In this case the divergence between the two values is restrained due to the fact that the β value is lower than in the two previous cases.
In
Table 3 a comparison between the predictive MTBF (Mean Time Between Failures) figure, calculated according to the exponential distribution, and the MTBF figure calculated according to Weibull distribution is presented. The calculation of exponential MTBF is performed by using “RDF2000” reliability prediction models. RDF2000 is a reliability prediction model providing empirical relationships to deduce MTBF for several families of devices by taking into account several factors such as environmental and qualitative parameters [
29]. Limits of the constant failure rate approach appear evident in
Table 3 since Board_WS presents the same exponential MTBF value for Prj1 and Prj2, instead of the Weibull-based MTBF that is calculated by using the β and η values previously calculated. This application also underlines the fact that Weibull MTBF is more conservative compared to the exponential MTBF value.
4.3. Comparison in Terms of Cumulative Distribution
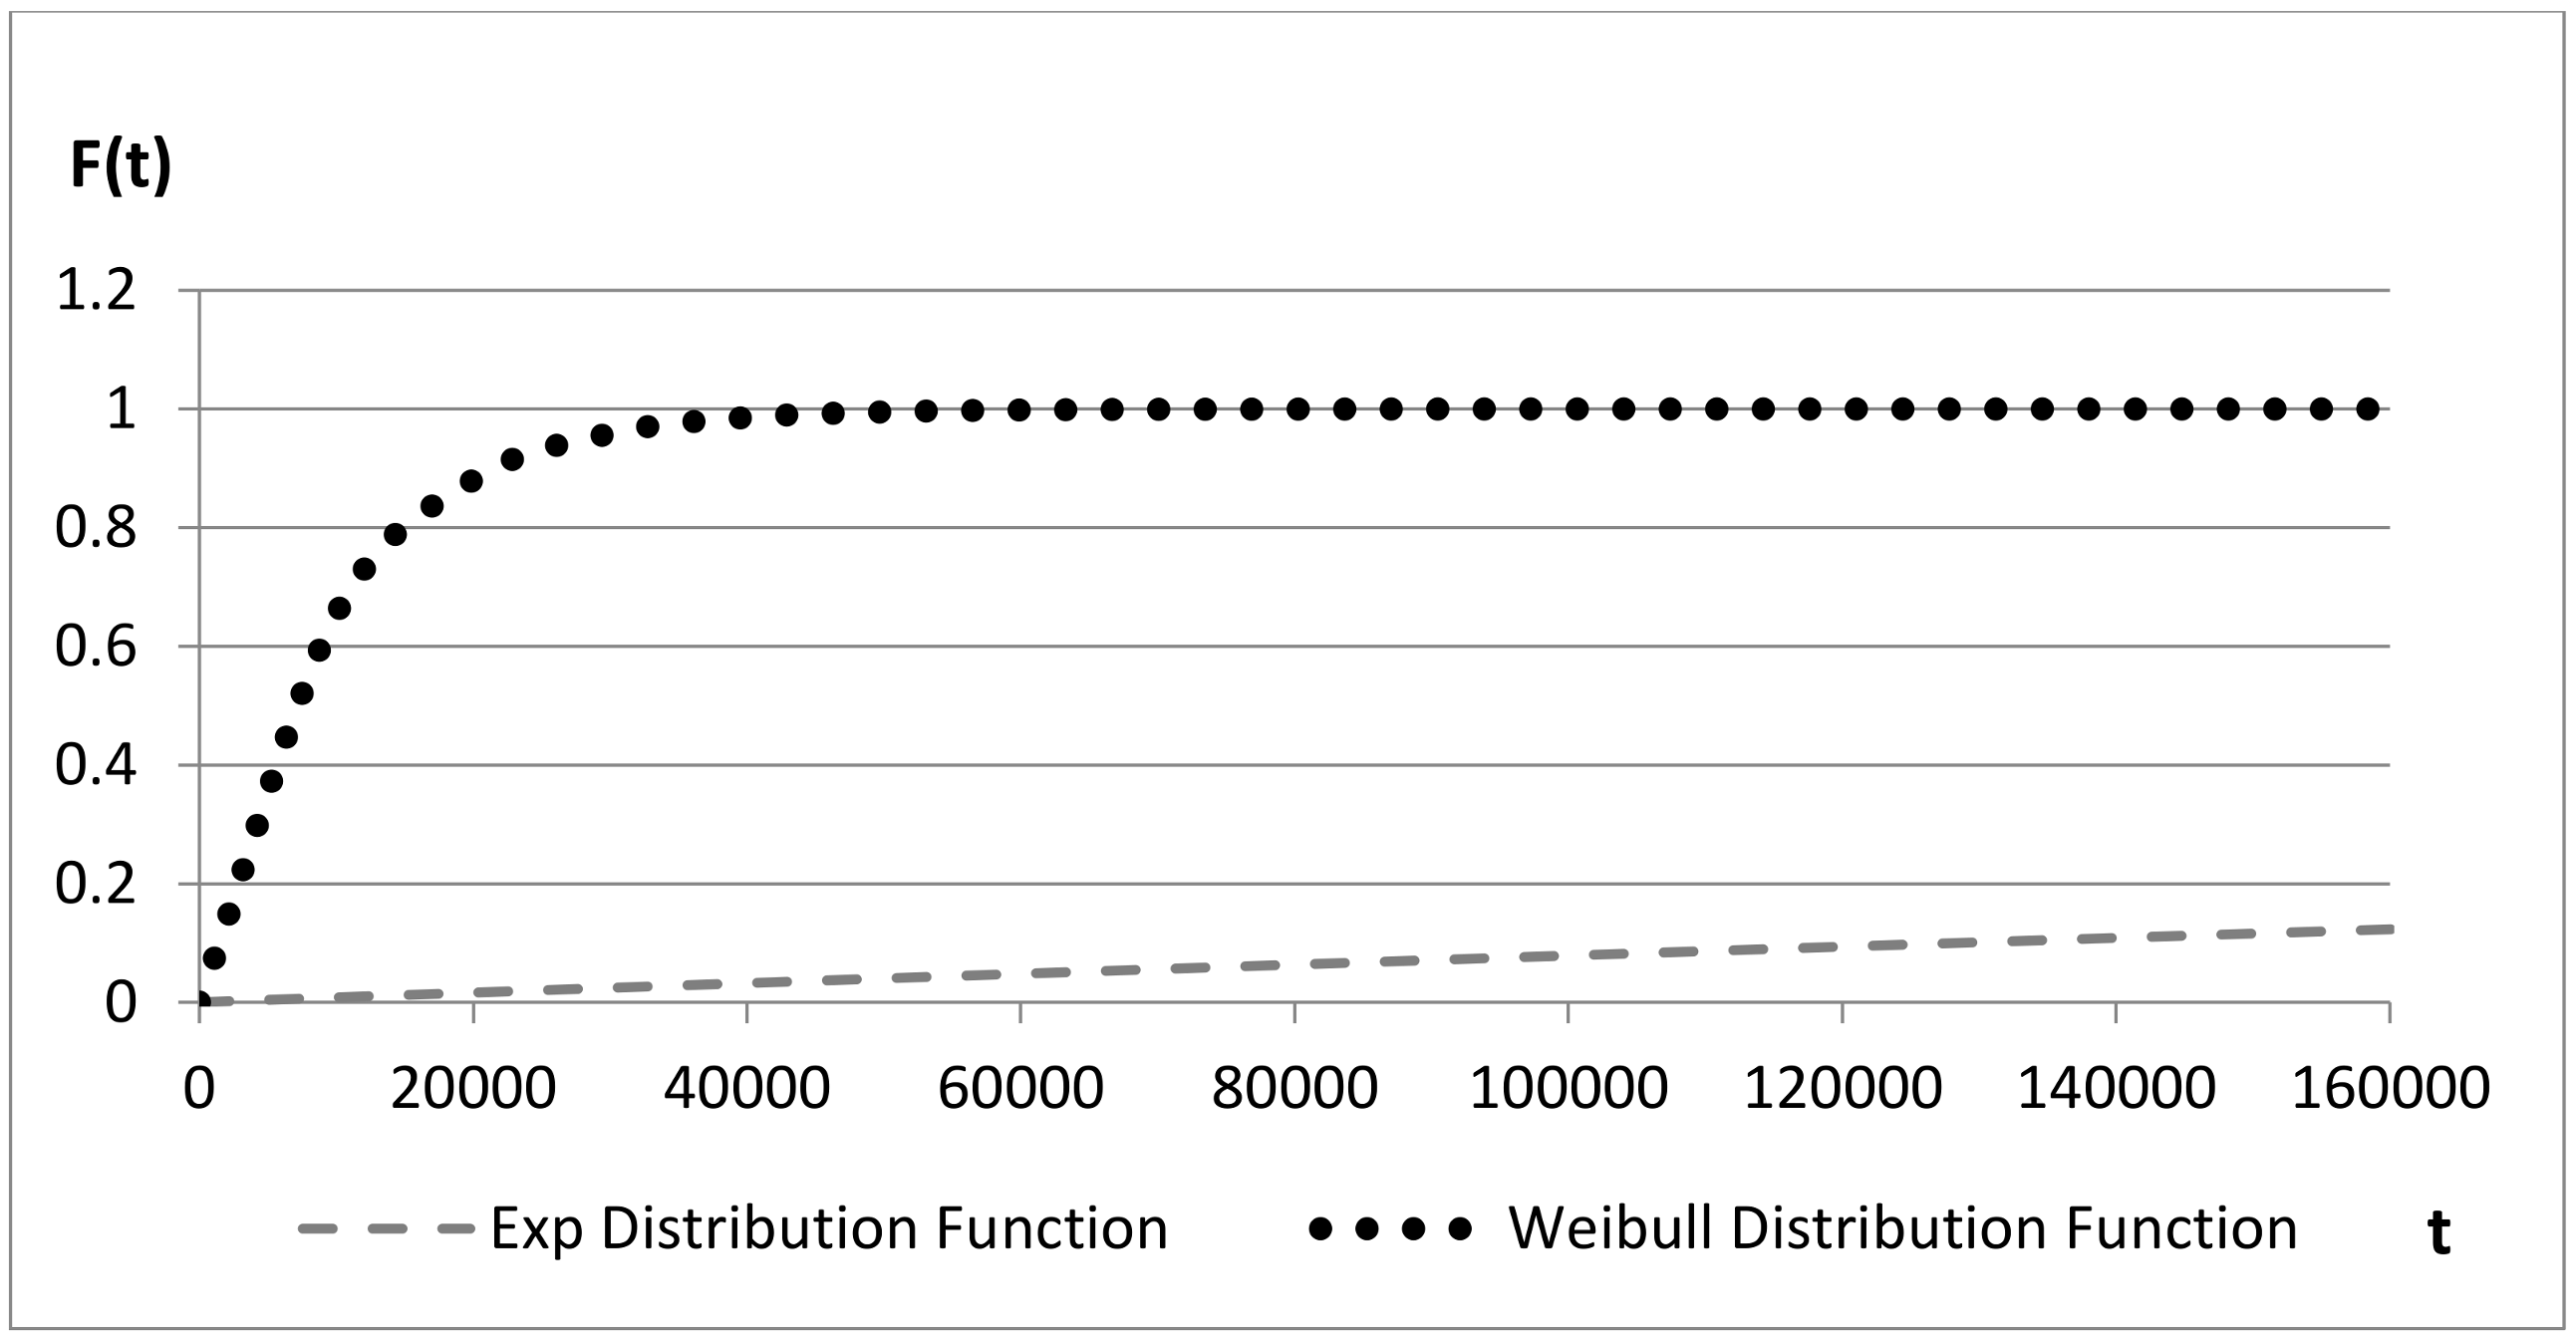
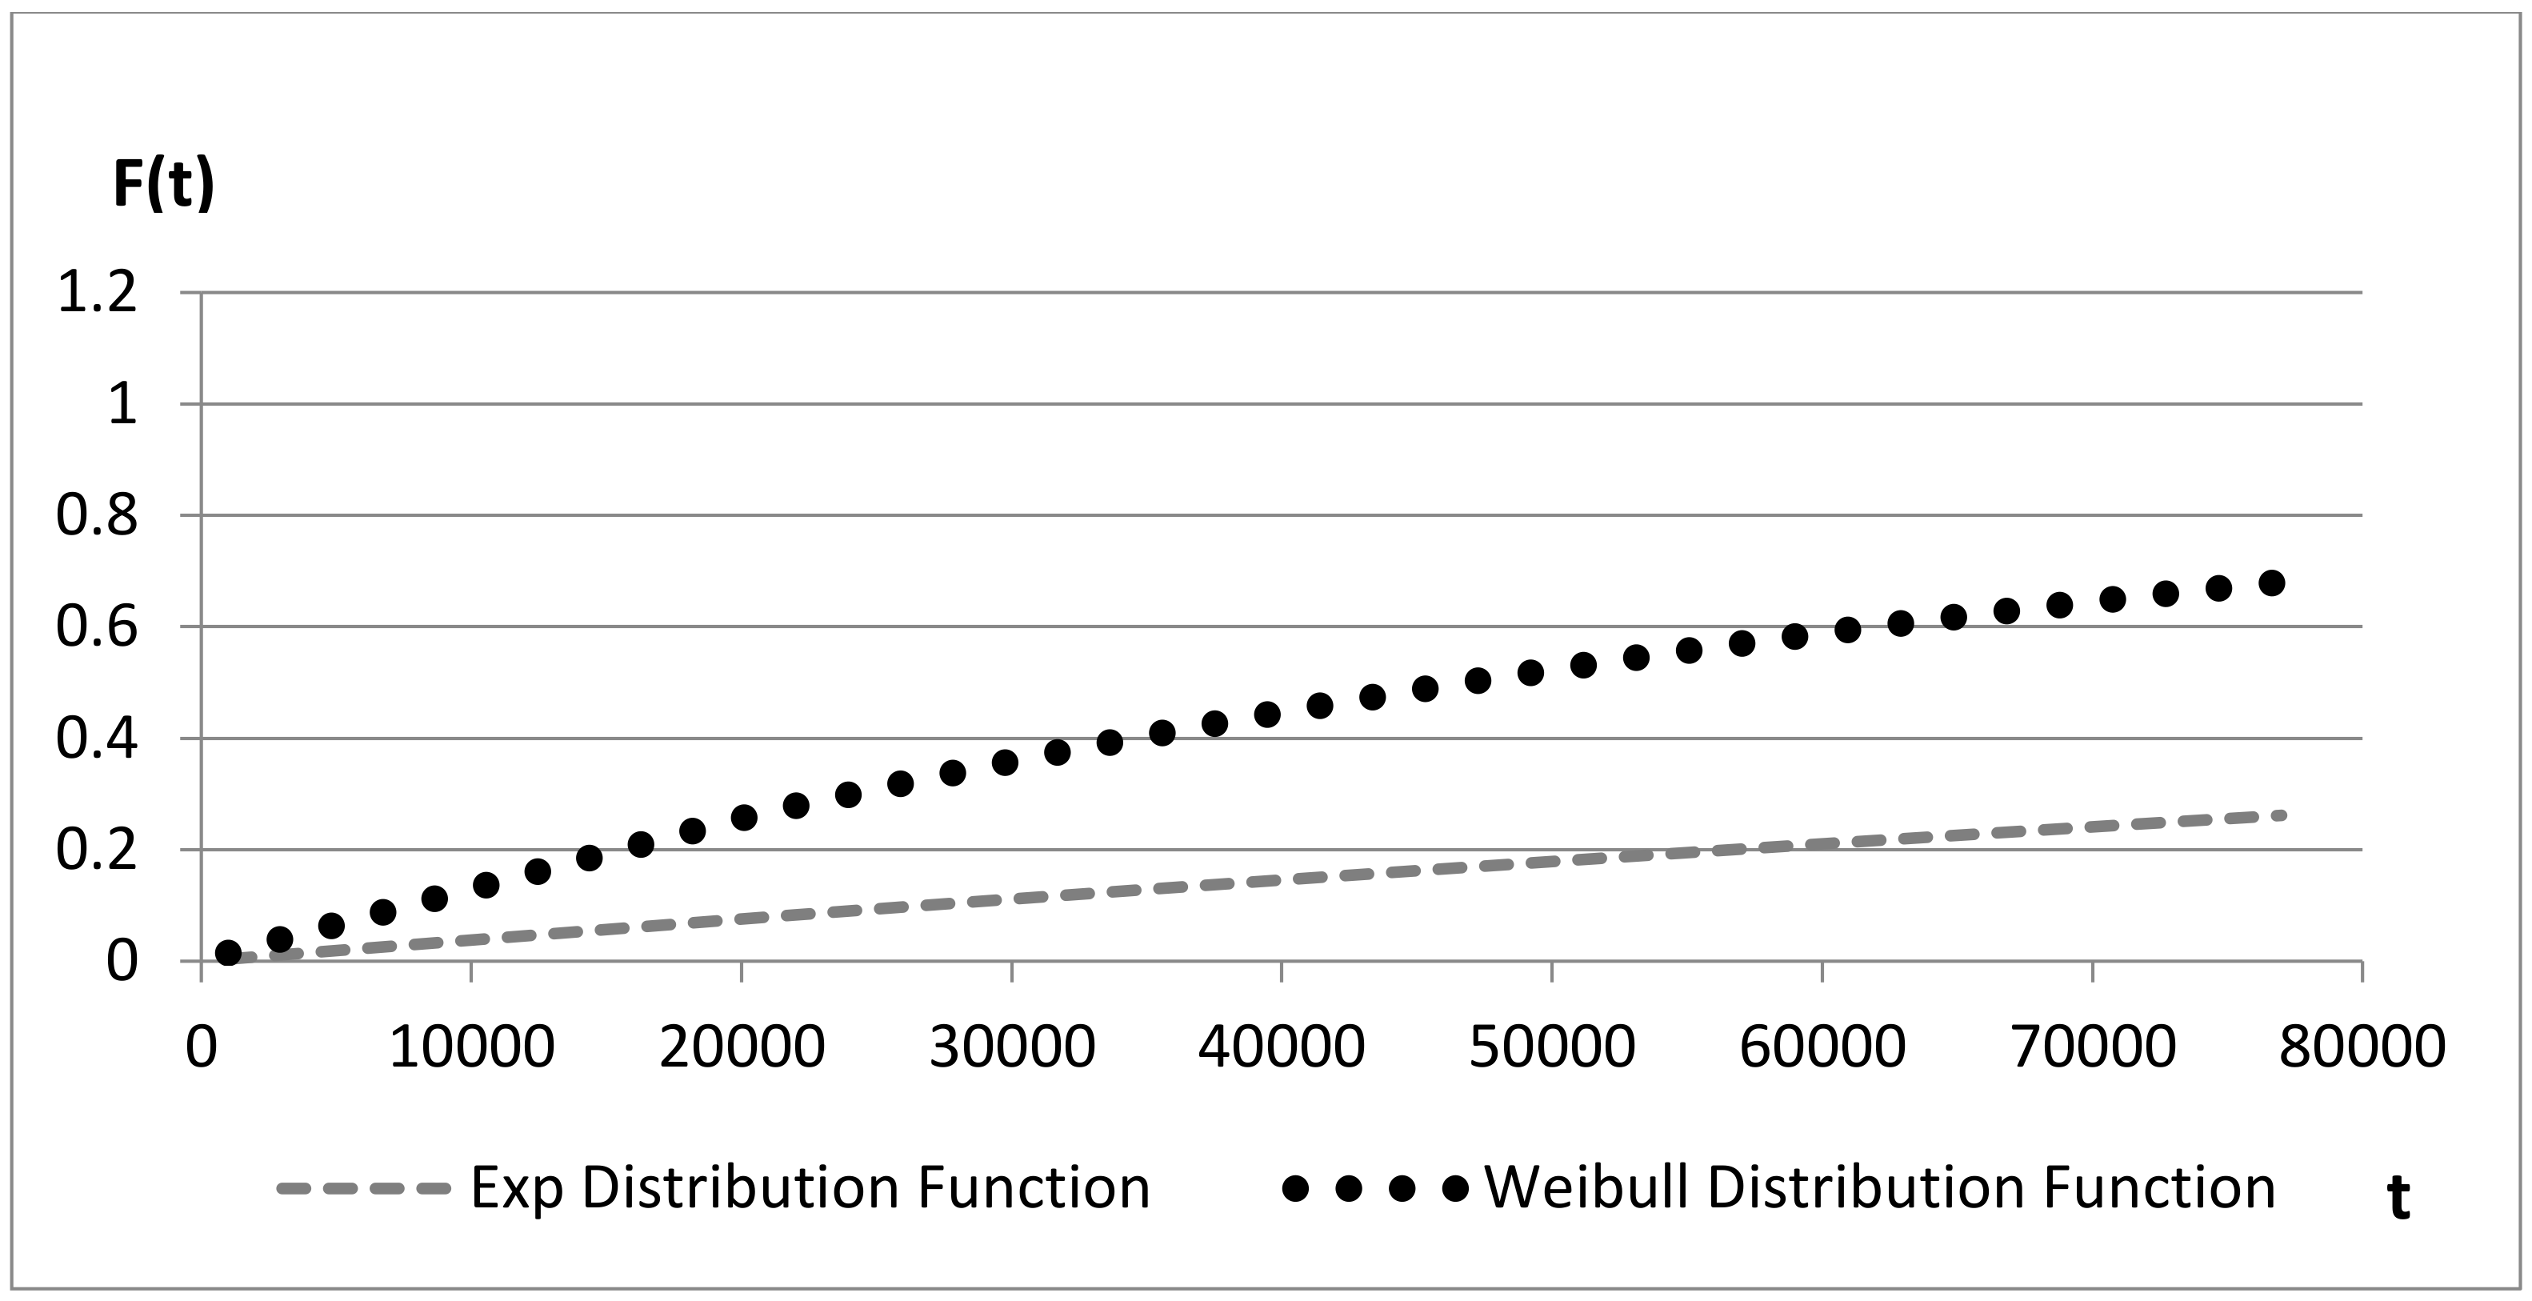
The cumulative distribution function (CDF) of each board and within each considered project is plotted for both exponential
and Weibull distribution:
The use of CDFs allows for evaluating the probability at a given time, in order to define basic events and move to the top event of a fault tree analysis.
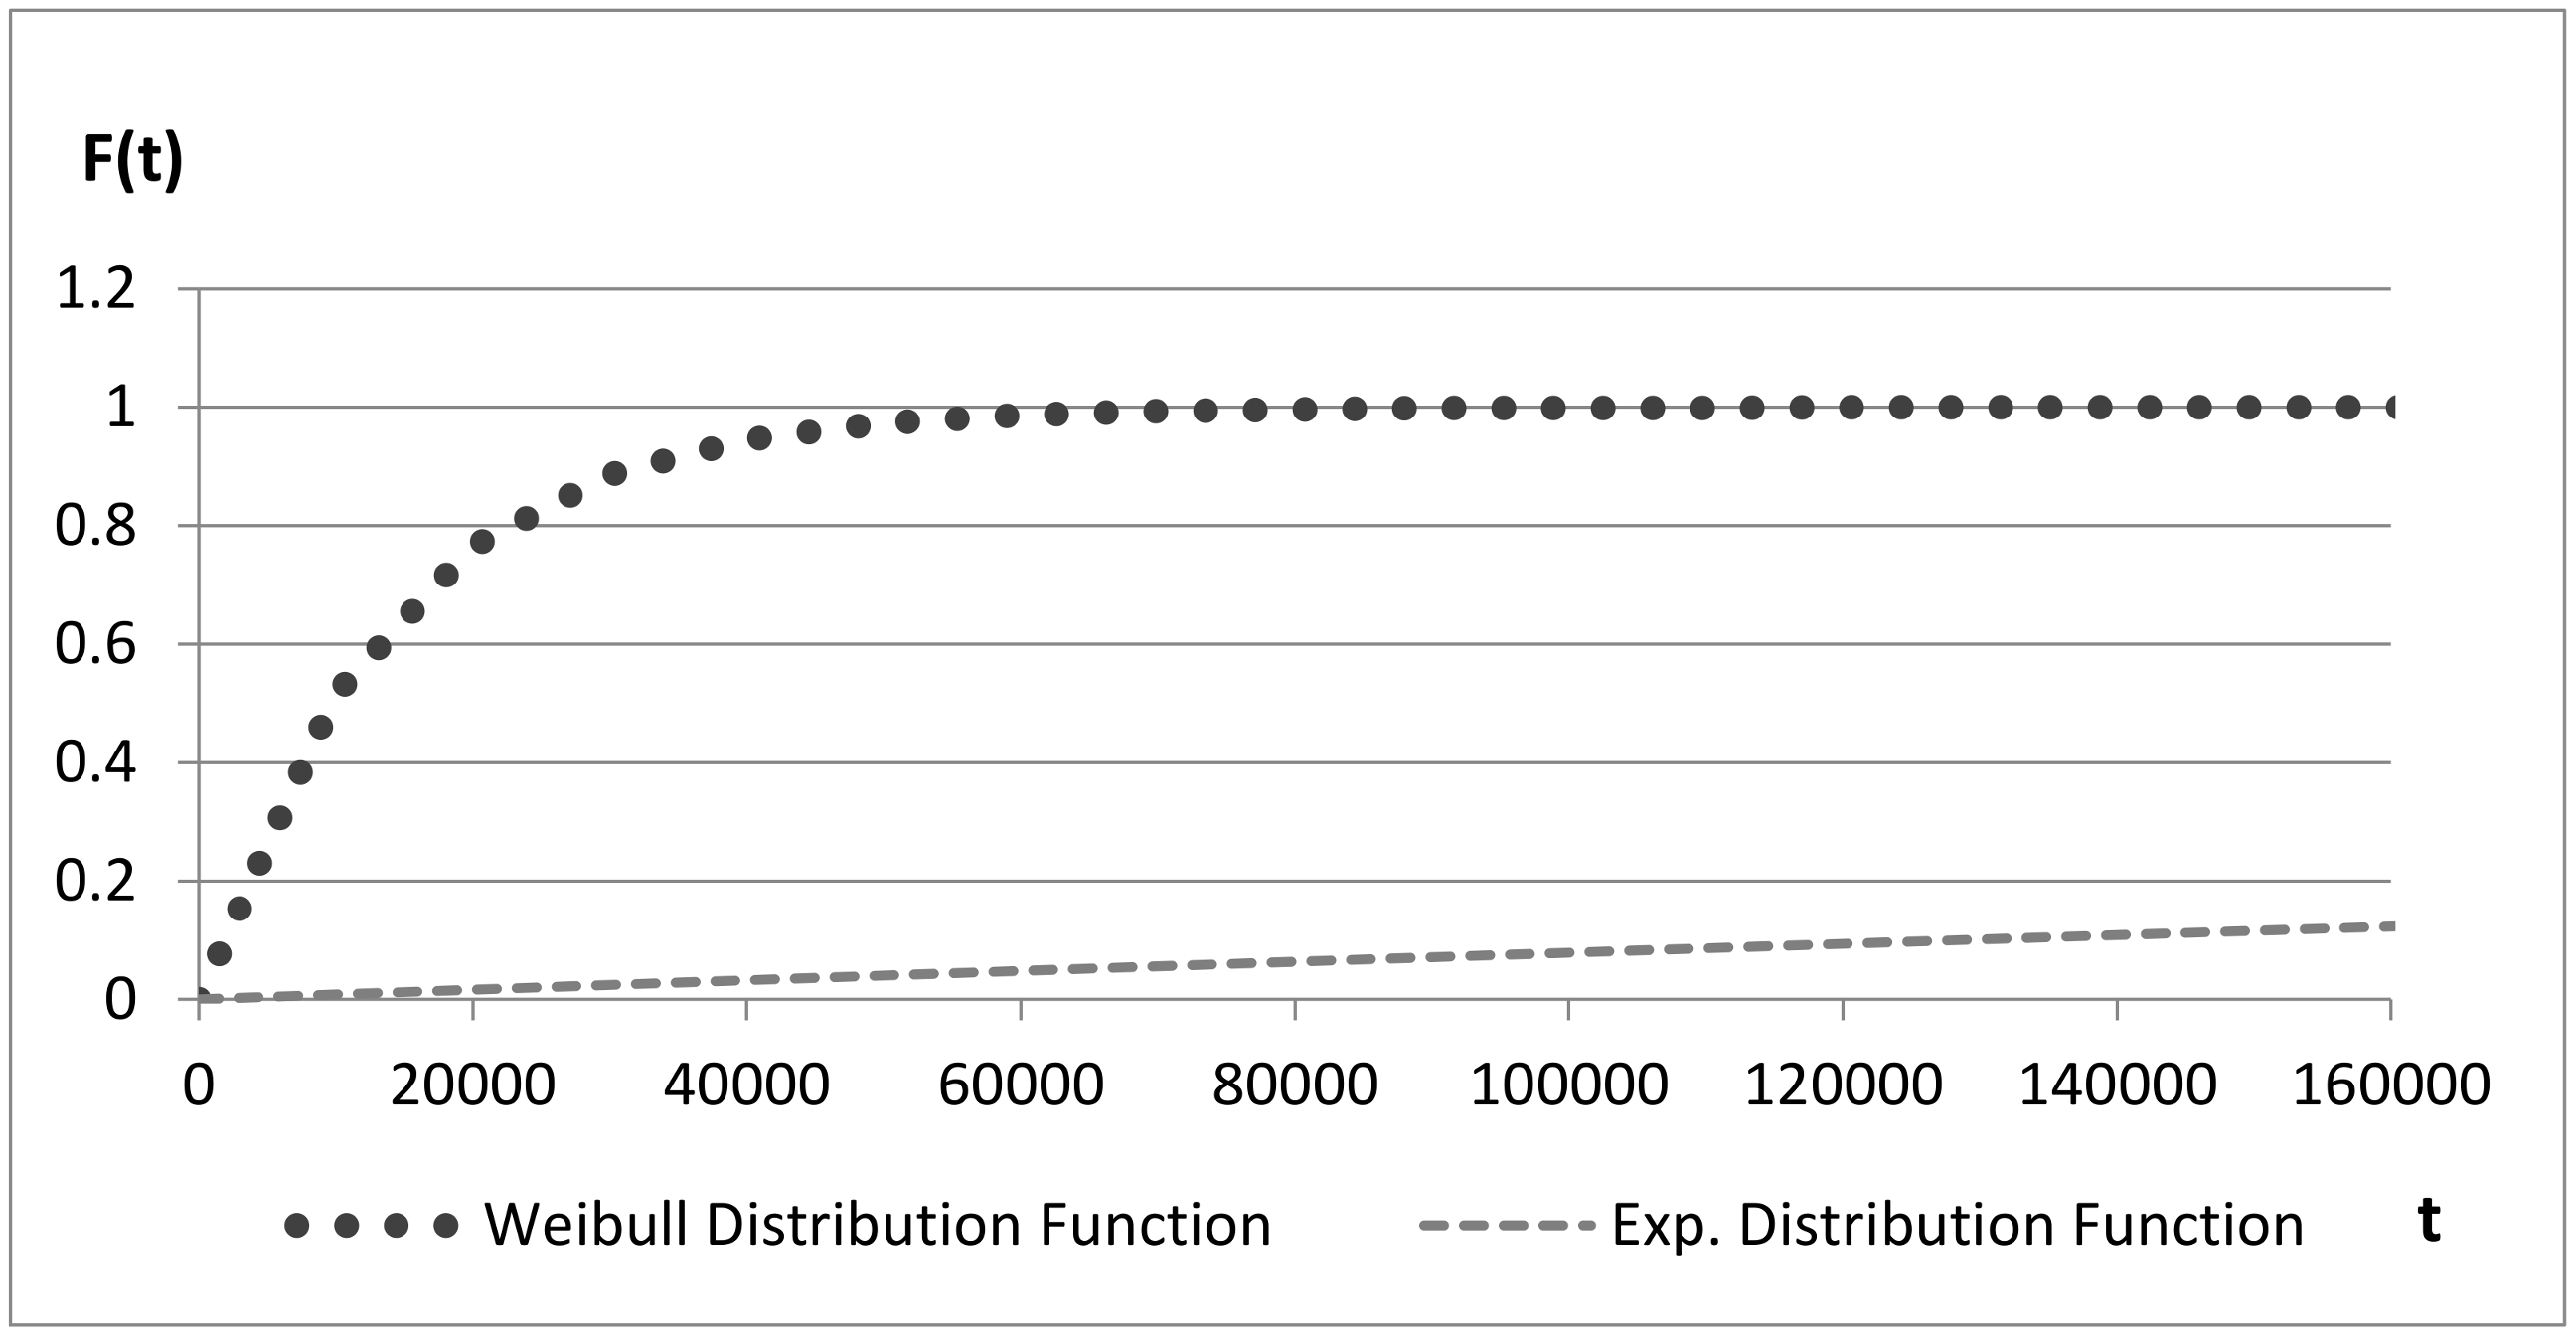
Figure 8 and
Figure 9 compare distribution functions over time: the value of the CDFs for Weibull distribution quickly tends to 1 due to the wear-out described by the value assumed by β.
Figure 10 presents the same evidence, but the slope of the function for Weibull distribution is lower compared to the previous cases, in line with the associated values of β.
These results highlight the possible bias of the use of exponential distributions, impacting not only reliability-centered maintenance policies but the demonstration of safety targets. This evidence will be presented in
Section 5.
5. Comparison between Exponential and Weibull Distribution Approaches
5.1. Comparison for a Given Architecture
It is possible to numerically evaluate the impact of adopting the two models on the demonstration of safety targets.
Let us consider the FTA mentioned in
Section 1, and let us assume the exponential failure rate model represents the basic events failure occurrence, such that:
- -
Failure Rate λ1 is (calculated as the reciprocal of the exponential MTBF for Board_WS);
- -
Failure Rate λ2 is (calculated as the reciprocal of the exponential MTBF for Board_OB);
- -
The time for “testing” BE1 is T1 = 4 months, expressed as 2628 h.
- -
The time T2 is the time of the mission, supposed to be 30 years, expressed as 262,800 h.
The probability associated with the BE
1 is then
while the probability associated with BE
2 is
The probability associated with the top event is
Let us assume the target value is the probability of failure associated with a SIL4 function with a mission time of 30 years:
With the assumptions made, , so that the target is fulfilled.
Let us now consider the same FTA, but we now assume the Weibull failure rate model.
For BE1, we have β1 = 3.75 and η1 = 51,683.
For BE2, we have β2 = 2.37 and η2 = 160,667.
For the calculation of the associated probability we will use the Weibull distribution function, with:
and
so that
PTE = 0.17, and the target has clearly not been met.
What could be the mitigation route if the reliability function adopted to build the architecture is exponential, and the field-return data does not confirm that choice? Possible solutions deal with the optimization of the architecture or the use of preventive maintenance tasks. These possibilities will be presented in
Section 5.2.
5.2. Definition of a Reliability-Driven Architecture
The unjustified use of exponential distribution instead of the more realistic Weibull distribution might have a dramatic impact on the choice of architecture of the signaling system if the field return data do not confirm the hypothesis made at the beginning of the project. Let us consider that exponential distributions have been wrongly adopted to describe reliability performances and that the considered system, under that hypothesis, fulfills the reliability and safety requirements for which it has been developed. If the relationship between exponential and Weibull parameters is as presented in
Table 2 and
Table 3, some mitigation should be put in place to allow the system to fulfill the requirements, for example introducing opportune redundancies. The choice of the redundancy is influenced by reliability parameters: optimistic figures can determine low redundant architectures. Such a situation might have dramatic consequences since reliability targets might not be reached and the architecture is already established.
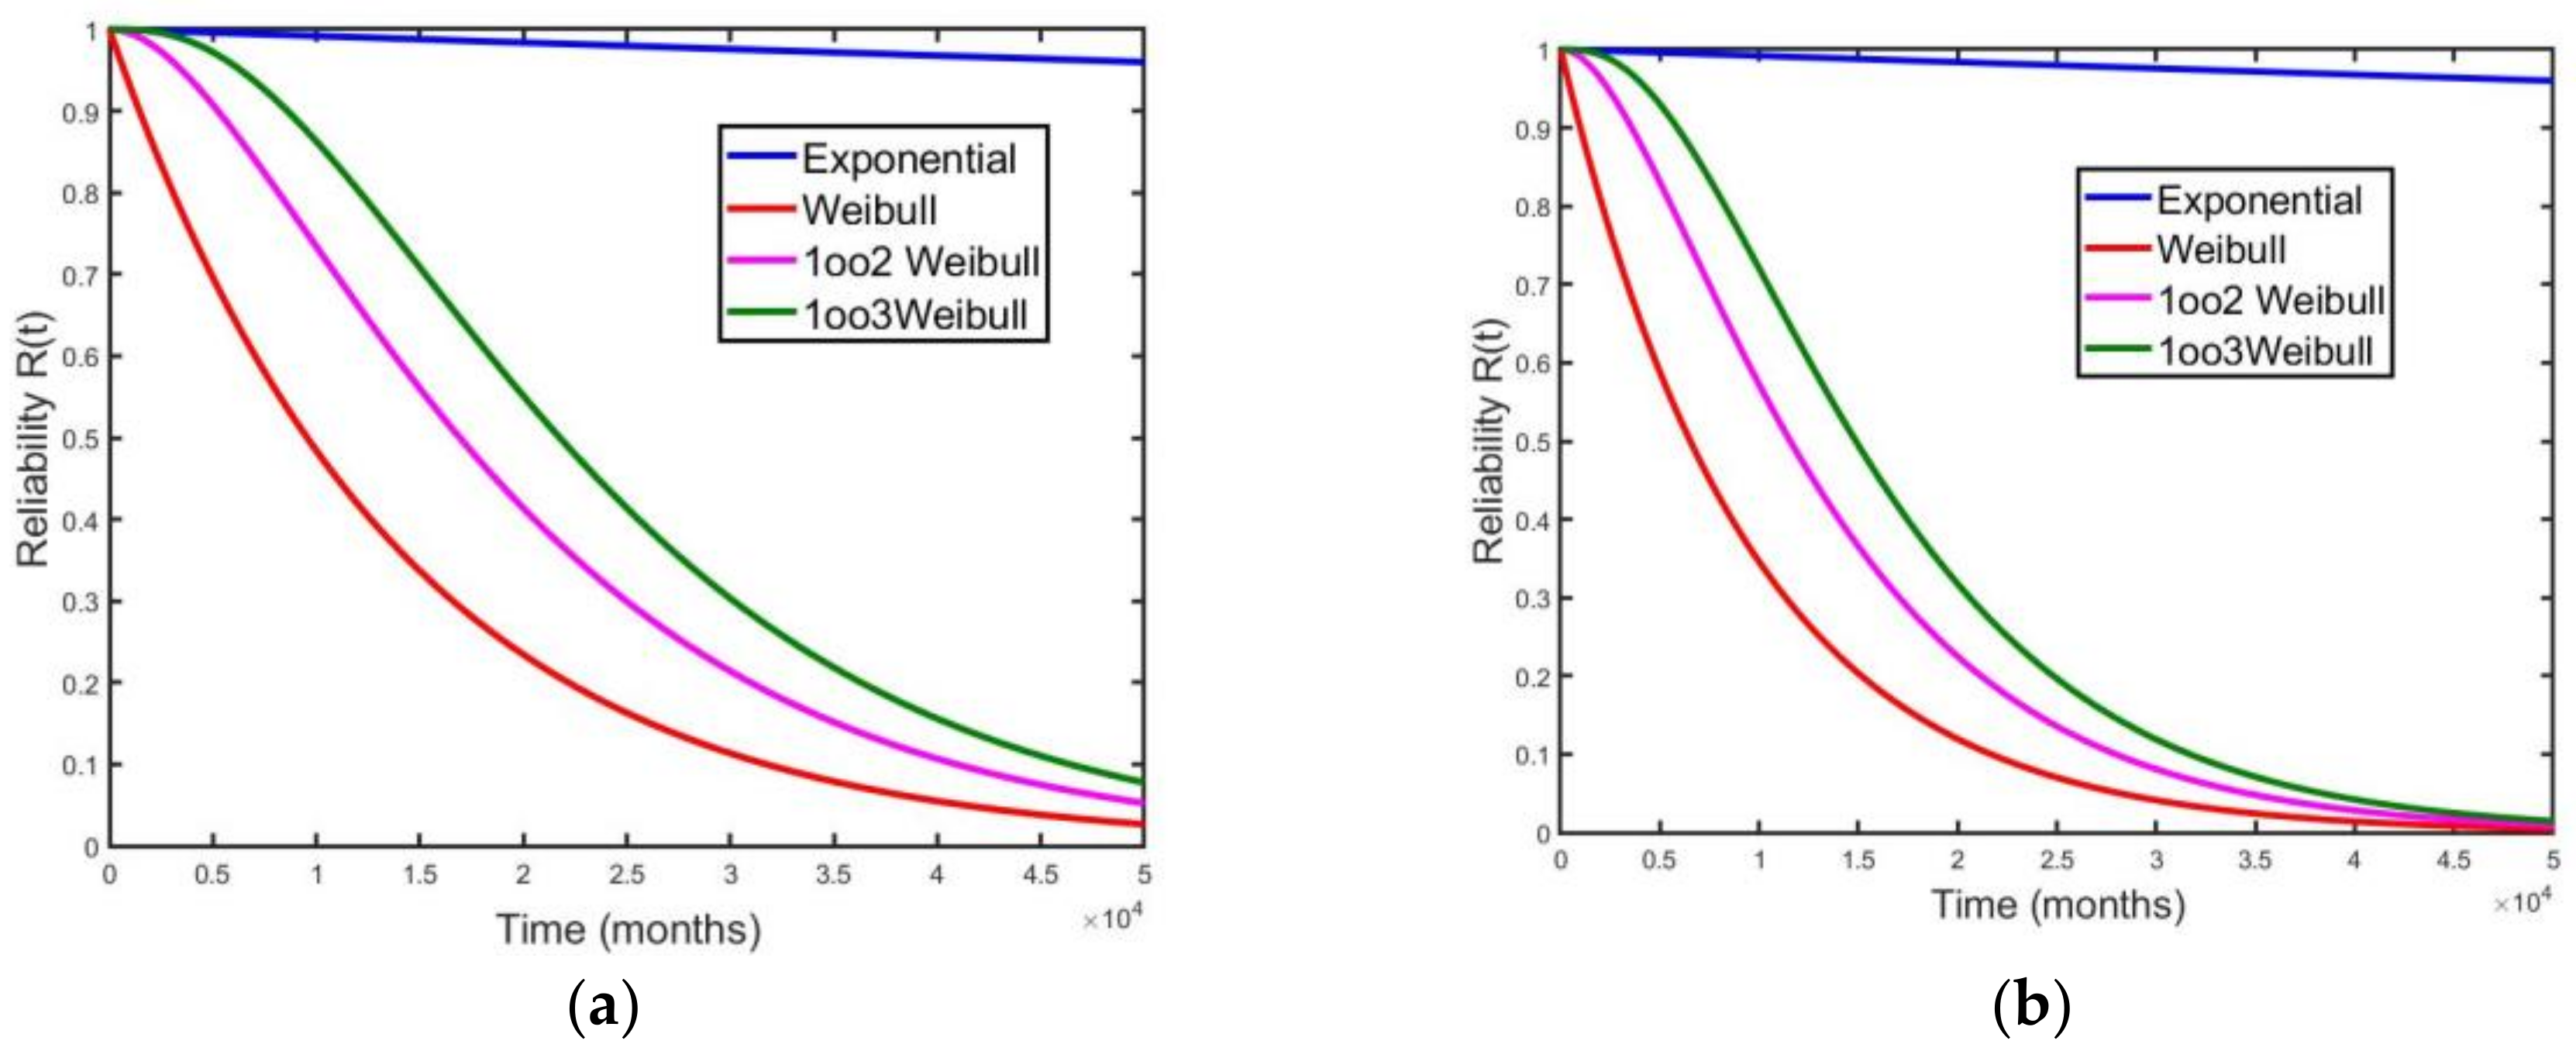
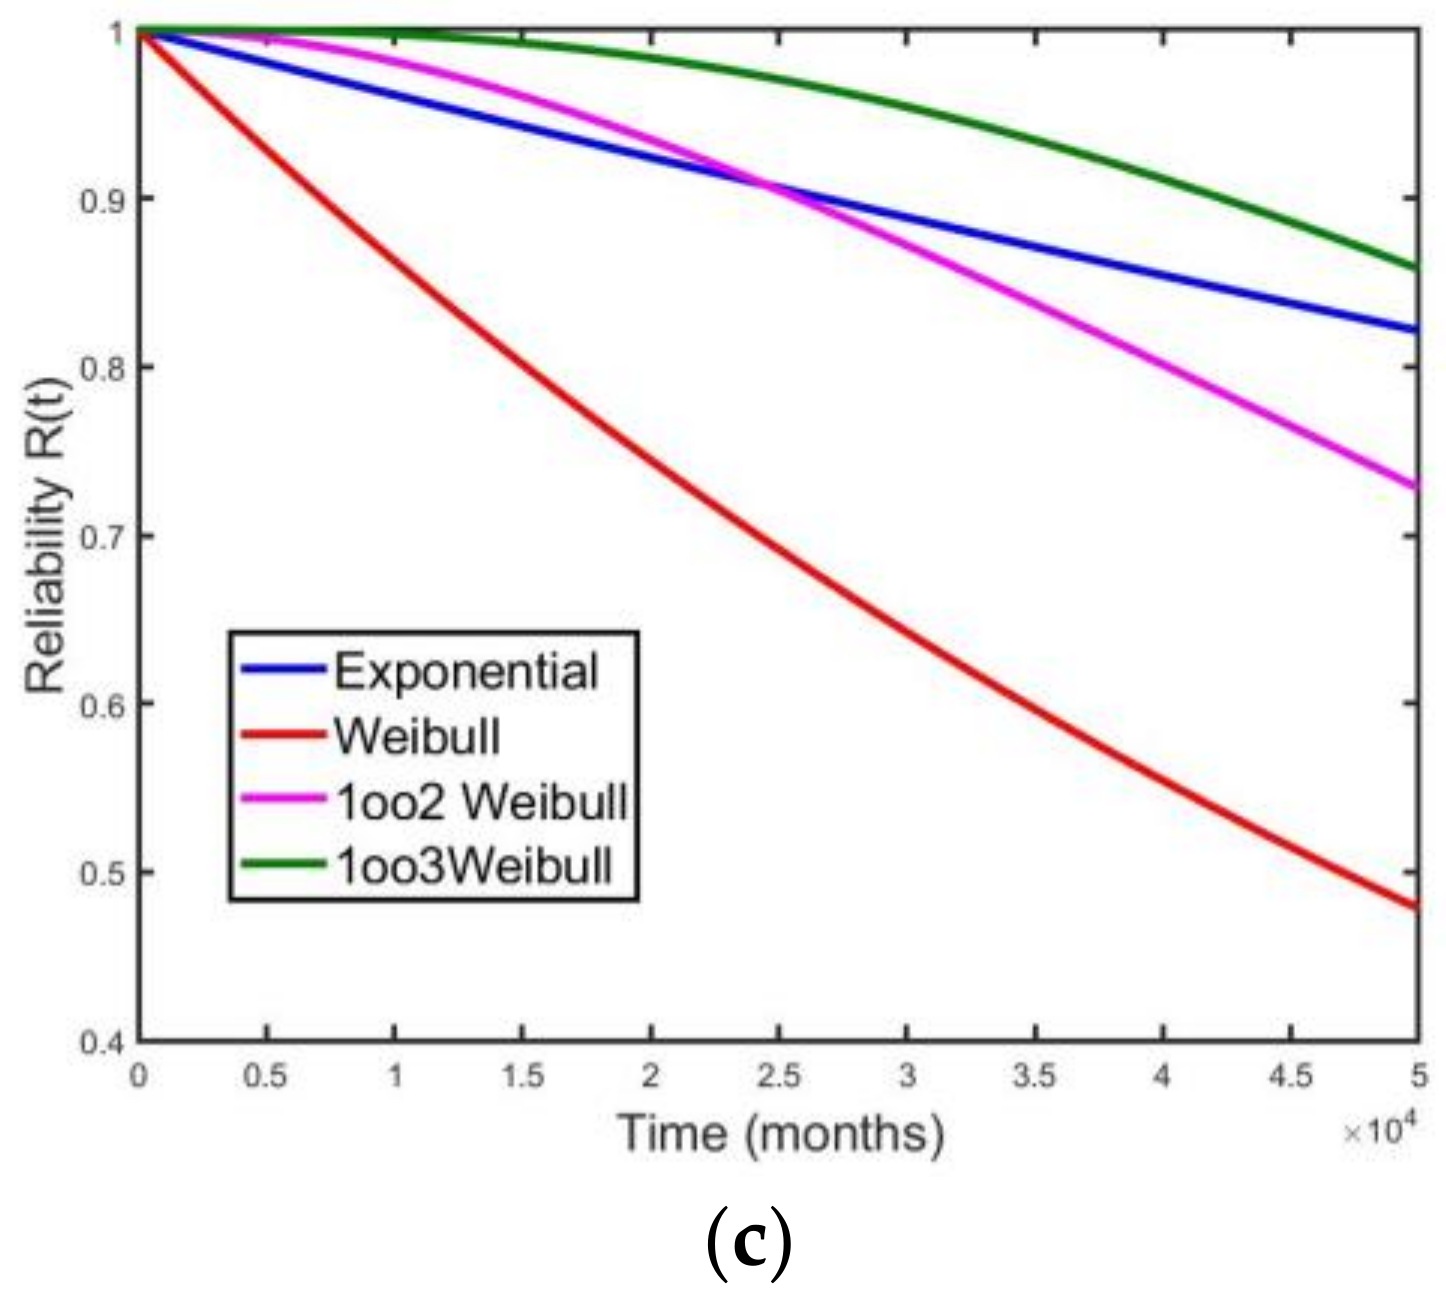
Even under the hypothesis that it is always possible to introduce redundancies into the considered system, do they allow for filling the gap with respect to the exponential case? In order to answer that question, the reliability function has been calculated for different types of k-out-of-n.
For the system considered in our examples, we make the hypothesis that corrective maintenance tasks cannot take place even in the case of detection of loss in one of the redundant sections.
The considered redundancy is for safety purposes, and a comparison of safety-related configurations is shown in
Figure 11a–c. Only in the case of project Prj3 is it possible to achieve performances comparable with the single unit described by exponential distribution, considering two redundant 2-out-of-3 architectures (
Figure 11c). Even with that kind of redundancy, performance drops in case of exponential behavior after about four years. In all the other cases, adding redundancies of the type
k-out-of-
n, with
k and
n greater than 1, will not provide significant advantages compared to the exponential bias (
Figure 11a,b).
Another option to achieve safety targets, once the architecture has already been set up, relies on the possibility of preventive maintenance tasks. The presence of wearing-out circuit boards within the use-case signaling system is the condition allowing the introduction of systematic preventive as-good-as-new maintenance activities. This consists of replacing a board before a possible failure occurs due to wear-out phenomena. The choice of the time at which the maintenance is scheduled depends on the β factor of the board, which is the measure of the wear-out degree, and on the ratio between the average cost of systematic preventive maintenance and the average cost of corrective maintenance.
6. Conclusions and Further Work
This paper aimed at describing the consequences of the unjustified adoption of exponential reliability distributions to model basic events leading to hazardous situations. Although the advantages of using Weibull distribution compared to exponential distribution are well understood in the industrial domain, the railway signaling field seems to suffer from calcified practices based on the constant failure rate myth. Although reliability prediction models have historically adopted exponential distribution for modeling the behavior of electronic components, the hypothesis of a constant failure rate needs to be verified by using field-return data.
A numerical example has been provided to assess the gap introduced when wrong data are used to perform the demonstration of safety targets.
Reliability figures have been calculated following Weibull distribution and compared with existing predictive figures, demonstrating that the hypothesis of constant failure rate is not respected, since the form parameter is over 1.
An example has been provided for an SIL4 function. Given the relationship between the basic events and the top event, the evaluation of the probability has been provided for both cases, demonstrating that the SIL4 target is not fulfilled when data are modeled through Weibull distribution. This can have consequences on the choice of architecture and the mitigations that could be put in place to reach the safety target.
The first consideration dealt with the impact on the architecture of a system when reliability parameters have been calculated with a reliability model overestimating performance. It has been shown that even adding redundancies might not solve the problem and the whole performance would be below the expected behavior, jeopardizing safety and reliability targets.
The second consideration is the use of systematic preventive maintenance tasks, allowing for reducing the impact of the wear-out of the electronic system.
As depicted in previous sections of this paper, some factors strongly impact the reliable collection of field-return data, consequently determining data censoring.
The calculation of Weibull parameters and reliability figures is limited by such phenomena.
Possible improvements, to be detailed and studied in future work, are presented hereafter.
A first element that can be enhanced is the after-sales database: all the information required for the calculation of reliability figures should be gathered within it, in particular the number of boards deployed in the project as well as the revenue service date. Accurate information about the time at which failures occur should also be provided to the customers, or somehow gathered directly by the system.
Improvements in the design of the circuit boards can also be considered: typically, efforts are made only to reduce the Mean Time to Repair (MTTR) in case of failure. Therefore, the diagnostic system is implemented, allowing for the quick identification of the failed LRU, so that the activities of the maintainer can be completed in the shortest possible time.
The design of the boards could be enhanced by adding functions monitoring the operating time. For electronic boards already equipped with logic circuits, like CPU (Central Processing Unit)-based boards, it is possible to add a real-time clock (RTC) with a backup battery and non-volatile memory. “Non-intelligent” circuit boards, like power supply, front-end boards, and power controller boards, could be redesigned in order to add the same components required for the CPU boards, allowing a minimum of intelligence to be used for reliability purposes. This improvement is justified since the cost of the components is much lower than the whole cost of the board.
Another improvement could be the monitoring of some environmental parameters that could affect the reliability of the boards. Considering that temperature, physical solicitations, and low-quality power supply are some of the most influential parameters, the design of the boards could be enhanced by adding temperature sensors (e.g., very low cost negative temperature coefficient (NTC) devices) or integrated accelerometers like cheap MEMS (Micro Electro-Mechanical Sensors) mastered by a microprocessor. The collection over time of all this information can increase the knowledge of the system in terms of reliability, allowing defining correlations between stress and reliability reduction. These improvements allow for gathering several mission profiles that can be used to predict behavior in case of new projects.
Improved design, combined with the proposed methodology to calculate reliability figures based on Weibull distribution, allows for building up a portfolio of mission profiles that can be used to predict the behavior in case of new projects based on the reference signaling system, avoiding the use of existing architecture to fulfill unreachable safety targets.
