Addressing Differences in Safety Influencing Factors—A Comparison of Offshore and Onshore Helicopter Operations

Abstract
:1. Introduction
- 1: Introduction (i.e., this section)
- 2: Method and theory description
- ○
- (-Literature review; -Data from Norway; -Terminology)
- 3: Exploratory study of international helicopter accidents offshore and onshore
- ○
- (-Accident levels; -Causes, -Measures)
- 4: Comparison of Norwegian offshore and onshore helicopter transportation
- ○
- (-Type of operations offshore and onshore; -Accident frequencies and descriptions of accidents; -Regulators; -Companies, training and employment conditions; -Implementation of risk-reducing measures);
- 5: Discussion, lessons learned and conclusion
- ○
- (-Discussion; -Conclusions and lessons learned; -Recommendations)
- References
2. Method and Theory Description
2.1. Literature Review
2.2. Data from Norway
- The accident database of the Civil Aviation Authority, Norway
- Records of flight hours reported to the Civil Aviation Authority, Norway
- Findings presented in research reports regarding Norwegian helicopter transportation
2.3. Terminology
3. Exploratory Study of International Helicopter Accidents Offshore and Onshore
3.1. Accident Levels
3.1.1. Accident Levels in the Emergency Services (EMS)
3.1.2. Accident Levels in the International Oil and Gas Industry
3.2. Causes
3.3. Measures
- (1)
- Certification of the equipment and the pilot; the pilot should be certified through systematic training;
- (2)
- Redundancy of equipment, auto-rotational capacity or other resilient capabilities (or if this is not possible—preventive maintenance such as health and usage monitoring systems (HUMS);
- (3)
- Protection of occupants through crash survival features (airbags; fire inhabitancies; better seats and belts, protective clothing).
4. Comparisons of Norwegian Offshore and Onshore Helicopter Transportation
- (1)
- Types of operations offshore and onshore
- (2)
- Accident frequencies and description of two fatal accidents
- (3)
- Regulators
- (4)
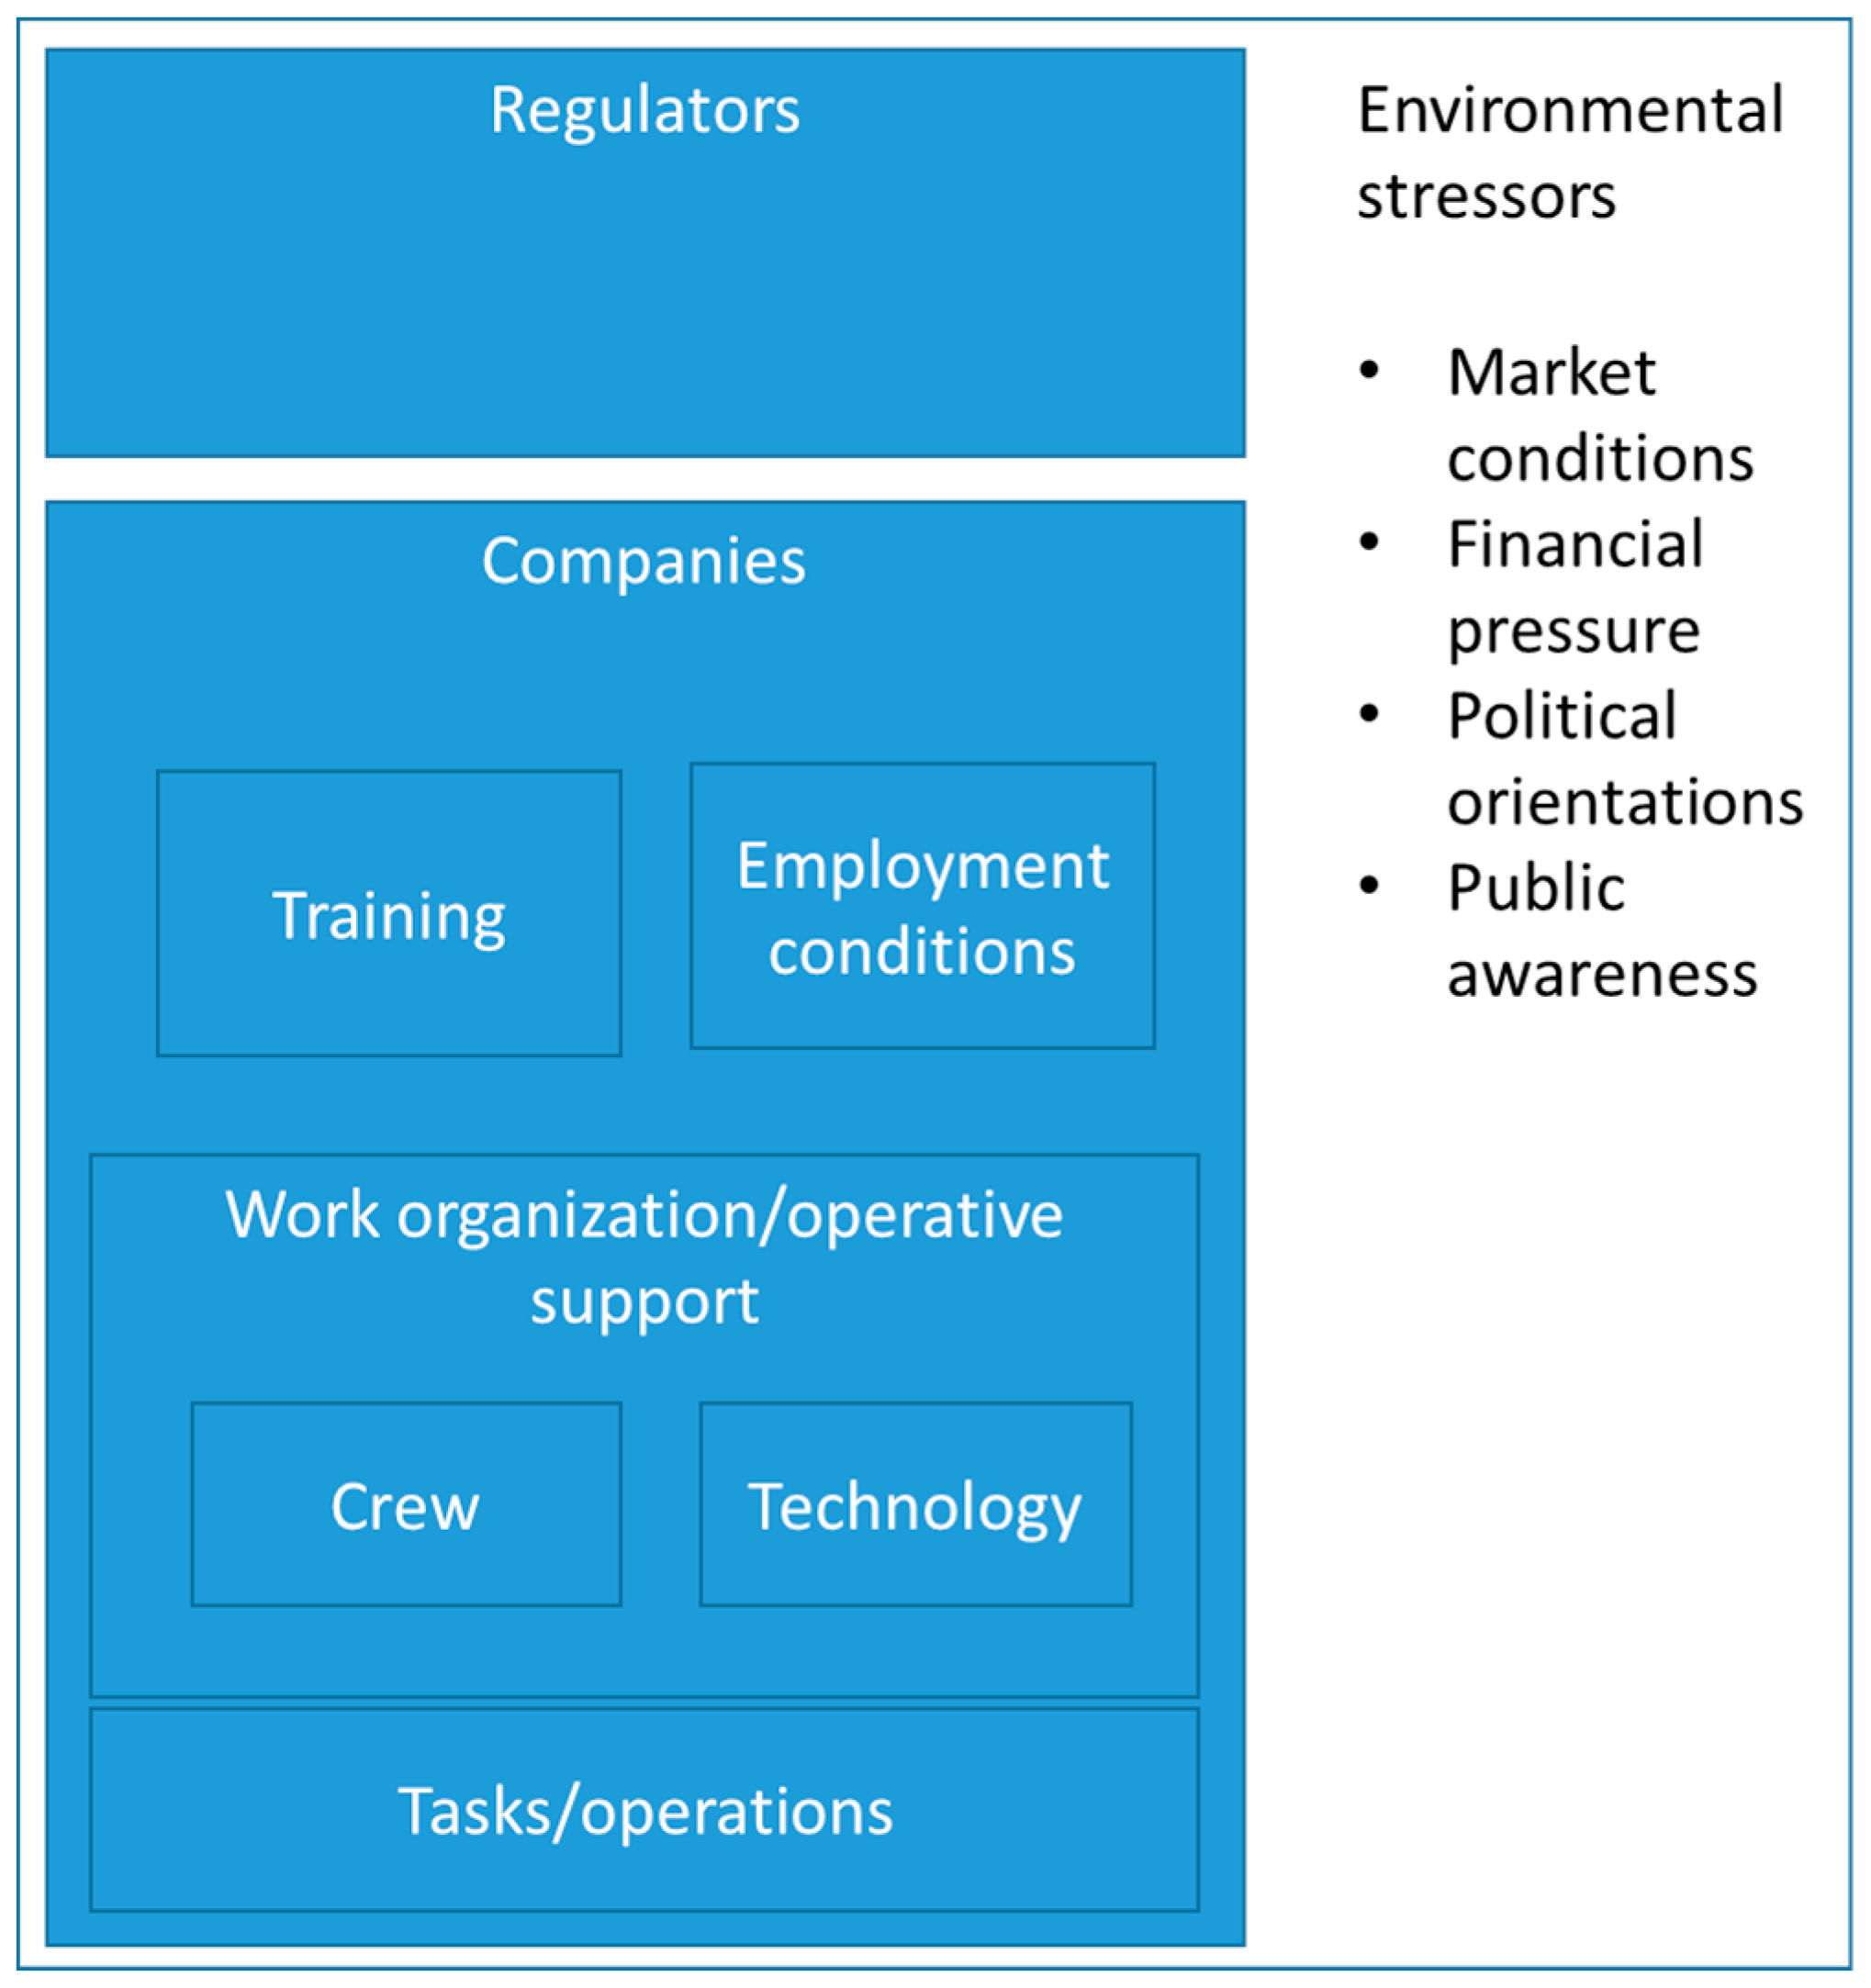
- Companies, training and employment conditions
- (5)
- Work organization and support related to technology, pilots and crew
- (6)
- Implementation of risk-reducing measures
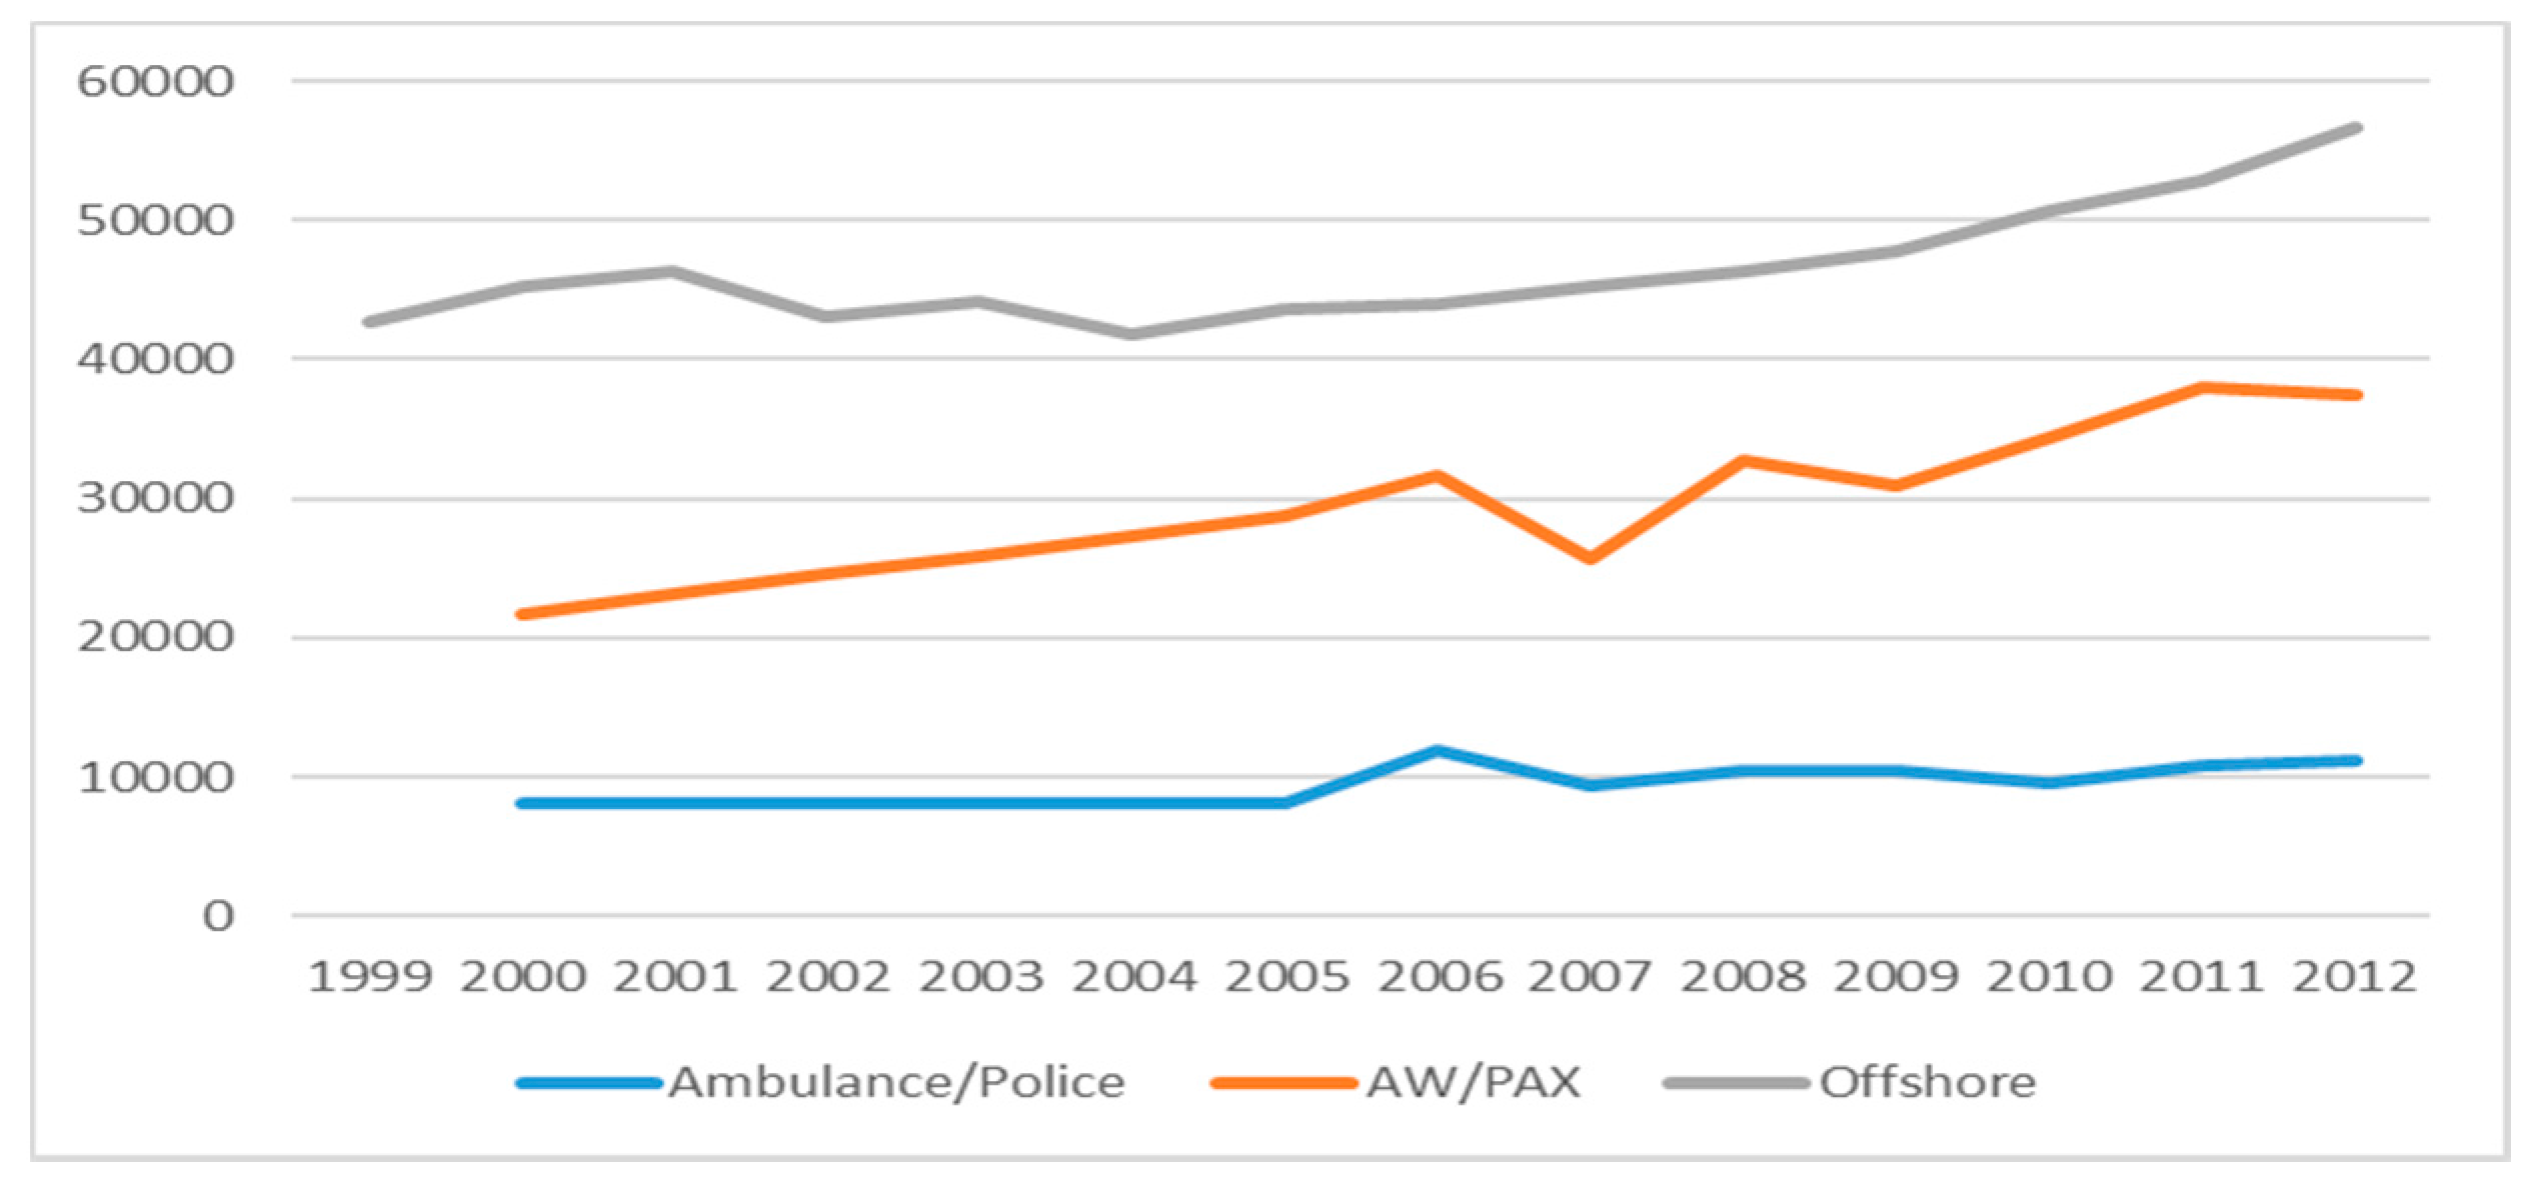
4.1. Type of Operations Offshore and Onshore
- (1)
- Charter (Passenger flight from A to B)
- (2)
- Taxi-flight (Passenger flight from A to B)
- (3)
- Other passenger flight (Passenger flight from A to A)
- (4)
- Ambulance/Helicopter Emergency Medical Service (HEMS)
- (5)
- Educational and training flights
- (6)
- Surveillance (Line inspection/top control/…, etc.
- (7)
- Aerial Work—AW (including all flights with external loads)
- (8)
- Cargo transportation (Cargo inside the helicopter)
- (9)
- Transfer/technical flights
4.2. Accident Frequencies and Description of Two Fatal Accidents
4.2.1. Characteristics of the Accidents
4.3. Regulators
4.4. Companies, Training and Employment Conditions
4.4.1. Companies (the Suppliers)
4.4.2. Training
4.4.3. Employment Conditions
4.5. Work Organization and Support Related to Technology, Pilots and Crew
4.5.1. Work Organization and Support
4.5.2. Technology
4.5.3. Pilots and Crew
- CPL H (Commercial Pilot License—to act as a pilot of a commercial aircraft);
- IR (Instrument Rating—to perform instrument-based flight, without visual references);
- ATPL H (Air Transport Pilot License—to act as pilot in command within a two-pilot system).
4.6. Implementation of Risk-Reducing Measures
5. Discussion, Lessons Learned and Conclusions
5.1. Discussion
5.2. Conclusions and Lesson Learned
5.3. Recommendations
- Improve reporting of normalized accident and incident data, and get a richer set of data to understand accidents (through recording of more sensor data, and extended data such as video recordings of pilots in the cockpit in collaboration/agreement with the pilots).
- More focus on improved design of critical components in helicopters, supporting resilience and ability to identify necessary maintenance before breakdown. New technology such as HUMS must be implemented by continuous learning and the evolvement of rules, regulation and practice. (This can be done in the offshore helicopter segment; however, the cost outside this segment may be prohibitive).
- Use of modern technology to avoid or mitigate risks (such as lightweight unmanned drones to conduct relevant aerial operations).
- Improvement of pilot training and certification.
- Avoid employment conditions that imply that pilot revenues (salaries and accumulated flight hours) are dependent on their decisions to accomplish assigned flights.
- Customers should be made more accountable for helicopter operations. This may function as an incentive to increase their willingness contribute to develop safer helicopter services.
- Focus on helicopter safety through organizational structures, such as the Committee for Helicopter Safety (CHS). We have seen that helicopter safety has been improved through collaboration between industry operators, equipment manufacturers, regulators and the customer base, based on systematic documentation of causes and agreement to implement mitigating actions.
Author Contributions
Conflicts of Interest
References
- Ingstad, O.; Rosness, R.; Sten, T.; Ulleberg, T.; Rausand, M.; Lydersen, S. Helicopter Safety Study; Main Report; SINTEF Report STF75A90008; SINTEF: Trondheim, Norway, 1990. [Google Scholar]
- Bye, R.J.; Seljelid, J.; Heide, B.; Lillehammer, G.; Aasprang, B.; Antonsen, S.; Vinnem, J.E.; Bø, B. Sikkerhetststudie Innlandshelikopter—Hovedrapport [Safety Study Onshore Helicopters—Main Report]. Doc.Nr. ST-04215-2. Safetec. 2013. Available online: www.helikoptersikkerhet.no/?a_id=978&ac_parent=246 (accessed on 6 June 2016).
- The International Association of Oil & Gas Producers (IOGP). Risk Assessment Data Directory—Aviation Transport Accident Statistics; Report No. 434-11.1, March 2010; The International Association of Oil & Gas Producers: London, UK, 2010. [Google Scholar]
- Rasmussen, J. Risk management in a dynamic society: A modelling problem. Saf. Sci. 1997, 27, 183–213. [Google Scholar] [CrossRef]
- Reason, J. Human Error; Cambridge University Press: Cambridge, UK, 1990. [Google Scholar]
- Reason, J. Managing the Risks of Organizational Accidents; Ashgate: Farnham, UK, 1997. [Google Scholar]
- Shappell, S.A.; Wiegmann, D.A. Applying Reason: The Human Factors Analysis and Classification System (HFACS). Hum. Factors Aerosp. Saf. 2001, 1, 59–86. [Google Scholar]
- O’Hare, D.; Wiggins, M.; Batt, R.; Morrison, D. Cognitive failure analysis for aircraft accident investigation. Ergonomics 1994, 37, 1855–1869. [Google Scholar] [CrossRef]
- Ferrante, O.; Jouniaux, P.; Loo, T.; Nicolas, G.; Cabon, P.; Mollard, R. Application of ADREP 2000 taxonomy for the analysis and the encoding of aviation accidents and incidents: A human factors approach. Hum. Factors Aerosp. Saf. 2004, 4, 19–48. [Google Scholar]
- Hokstad, P.; Jersin, E.; Hansen, G.K.; Sneltvedt, J.; Sten, T. Helicopter Safety Study 2; Main Report; SINTEF Report No. STF38; SINTEF: Trondheim, Norway, 1999; Volume 1, p. A99423. [Google Scholar]
- Herrera, I.A.; Håbrekke, S.; Kråkenes, T.; Hokstad, P.; Forseth, U. Helicopter Safety Study 3; Main Report; SINTEF Report No. A14973; SINTEF: Trondheim, Norway, 2010. [Google Scholar]
- Petroleum Safety Authority (PSA). Risikonivå i Petroleumsvirksomheten Hovedrapport, Utviklingstrekk 2014, Norsk Sokkel [Trends in Risk Level in the Petroleum Activity]; Petroleum Safety Authority: Stavanger, Norway, 2014. [Google Scholar]
- Nævestad, T.O.; Ross, O.P.; Elvebakk, B.; Bye, R.J.; Antonsen, S. Work Related Accidents in Road Sea and Air Transport: Prevalence And Risk Factors; Report. Nr. 1428/2015; Norwegian Centre for Transport Research: Oslo, Norway, 2015; ISBN 978-82-480-1653-3. [Google Scholar]
- Beaubien, J.M.; Baker, D.P. A review of selected aviation human factors taxonomies, accident/incident reporting systems, and data reporting tools. Int. J. Appl. Aviat. Stud. 2002, 2, 11–36. [Google Scholar]
- Dekker, S.W.A. Illusions of explanation: A critical essay on error classification. Int. J. Aviat. Psychol. 2003, 13, 95–106. [Google Scholar] [CrossRef]
- Chesters, A.; Grieve, P.H.; Hodgetts, T.J. A 26-year comparative review of United Kingdom helicopter emergency medical services crashes and serious incidents. J. Trauma Acute Care Surg. 2014, 76, 1055–1060. [Google Scholar] [CrossRef] [PubMed]
- Nevile, M. Beyond the Black Box: Talk-in-Interaction in the Airline Cockpit; Ashgate Publishing Ltd.: Farnham, UK, 2004. [Google Scholar]
- Nascimento, F.A.; Majumdar, A.; Ochieng, W.Y. Helicopter accident analysis. J. Navig. 2014, 67, 145–161. [Google Scholar] [CrossRef]
- Clark, E.; Edwards, C.; Perry, P.; Campbell, G.; Stevens, M. Helicopter safety in the oil and gas business. In Proceedings of the IADC/SPE Drilling Conference, Miami, FL, USA, 21–23 February 2006. [Google Scholar]
- Rao, A.H.; Marais, K. Identifying high-risk occurrence chains in helicopter operations from accident data. In Proceedings of the 15th AIAA Aviation Technology, Integration, and Operations Conference, Dallas, TX, USA, 22–26 June 2015. [Google Scholar]
- Gore, A. Final Report to President Clinton by White House Commission on Aviation Safety and Security; White House Commission on Aviation Safety and Security: Washington, DC, USA, 1997. [Google Scholar]
- European Aviation Safety Agency (EASA). Annual Safety Review 2016. Available online: www.easa.europa.eu (accessed on 6 June 2017).
- Advisory Council for Aeronautics Research in Europe (ACARE). Strategic Research& Innovation Agenda. 2012. Available online: www.acare4europe.com/sria/flightpath-2050-goals/ensuring-safety-and-security (accessed on 6 June 2016).
- NOU. [White paper] Samferdselsdepartementet. NOU 2002: 17 Helikoptersikkerheten på Norsk Kontinentalsokkel. Delutredning nr. 2: Utviklingstrekk, Målsettinger, Risikoinfluerende Faktorer og Prioriterte Tiltak; Report in Norwegian/Executive Summary in English; Ministry of Transport: Oslo, Norway, 2002.
- Vinnem, J.E. Helicopter Transportation Fatality Risk Assessment. In Offshore Risk Assessment Vol 1; Springer: London, UK, 2014; pp. 483–501. [Google Scholar]
- Baker, S.P.; Grabowski, J.G.; Dodd, R.S.; Shanahan, D.F.; Lamb, M.W.; Li, G.H. EMS helicopter crashes: What influences fatal outcome? Ann. Emerg. Med. 2006, 47, 351–356. [Google Scholar] [CrossRef] [PubMed]
- Hinkelbein, J.; Schwalbe, M.; Neuhaus, C.; Wetsch, W.A.; Genzwürker, H.V. Incidents, accidents and fatalities in 40 years of German helicopter emergency medical system operations. Eur. J. Anaesthesiol. (EJA) 2011, 28, 766–773. [Google Scholar] [CrossRef] [PubMed]
- Rhee, K.J.; Holmes, E.M., 3rd; Moecke, H.P.; Thomas, F.O. A comparison of emergency medical helicopter accident rates in the United States and the Federal Republic of Germany. Aviat. Space Environ. Med. 1990, 61, 750–752. [Google Scholar] [PubMed]
- Harris, J.S. US hospital-based EMS helicopter accident rate declines over the most recent seven-year period. Helicopter Saf. 1994, 20, 1–7. [Google Scholar]
- Holland, J.; Cooksley, D.G. Safety of helicopter aeromedical transport in Australia: A retrospective study. Med. J. Aust. 2005, 182, 17–19. [Google Scholar] [PubMed]
- Blumen, I.J. A Safety Review and Risk Assessment in Air Medical Transport: Supplement to the Air Medical Physician Handbook; Air Medical Physician Association: Salt Lake City, UT, USA, 2002. [Google Scholar]
- Hinkelbein, J.; Dambier, M.; Viergutz, T.; Genzwuerker, H.V. A six-year analysis of German emergency medical services helicopter crashes. J. Trauma Acute Care Surg. 2008, 64, 204–210. [Google Scholar] [CrossRef] [PubMed]
- Wright, R.M., Jr. Air medical service, an industry under scrutiny. Rotor. Winter 2004, 2005, 6–8. [Google Scholar]
- Civil Aviation Authority. Safety Review of Offshore Public Transport Helicopter Operations in Support of the Exploitation of Oil and Gas; Report CAP, 1145; Civil Aviation Authority: London, UK, 2014. [Google Scholar]
- Van Hijum, M.; Masson, M. Final Report—EHEST Analysis of 2000–2005 European Helicopter Accidents. 2010. Available online: www.easa.europa.eu/document-library/general-publications/ehsat-safety-analysis-reports-former-ehest (accessed on 6 June 2016).
- Fox, R.G. The History of Helicopter Safety. In Proceedings of the International Helicopter Safety Symposium, Montréal, QC, Canada, 26–29 September 2005; pp. 26–29. [Google Scholar]
- Manwaring, J.C.; Conway, G.A.; Garrett, L.C. Epidemiology and prevention of helicopter external load accidents. J. Saf. Res. 1998, 29, 107–121. [Google Scholar] [CrossRef]
- De Voogt, A.J.; Uitdewilligen, S.; Eremenko, N. Safety in high-risk helicopter operations: The role of additional crew in accident prevention. Saf. Sci. 2009, 47, 717–721. [Google Scholar] [CrossRef]
- Gałązkowski, R.; Wołkowski, W.; Mikos, M.; Szajda, S.; Wejnarski, A.; Świeżewski, S.P. The strategy of training staff for a new type of helicopter as an element of raising the security level of flight operations. Int. J. Occup. Saf. Ergono. 2015, 21, 558–567. [Google Scholar] [CrossRef] [PubMed]
- Couch, M.; Lindell, D. Study on rotorcraft safety and survivability. In Proceedings of the International Helicopter Safety Symposium, Estoril, Portugal, 3–4 October 2010. [Google Scholar]
- Bensyl, D.M.; Moran, K.; Conway, G.A. Factors associated with pilot fatality in work-related aircraft crashes, Alaska, 1990–1999. Am. J. Epidemiol. 2001, 154, 1037–1042. [Google Scholar] [CrossRef] [PubMed]
- Garrett, L.C.; Conway, G.A.; Manwaring, J.C. Epidemiology of work-related aviation fatalities in Alaska, 1990–1994. Aviat. Space Environ. Med. 1998, 69, 1131–1136. [Google Scholar] [PubMed]
- Iseler, L.; De Maio, J. Analysis of US civil rotorcraft accidents from 1990 to 1996 and implications for a safety program. In Annual Forum Proceedings-American Helicopter Society; American Helicopter Society: Fairfax, VA, USA, 2001; Volume 57, pp. 1776–1783. [Google Scholar]
- O’Hare, D.; Chalmers, D.; Scuffham, P. Case-control study of risk factors for fatal and non-fatal injury in crashes of civil aircraft. Aviat. Space Environ. Med. 2003, 74, 1061–1066. [Google Scholar] [PubMed]
- Habib, F.A.; Shatz, D.; Habib, A.I.; Bukur, M.; Puente, I.; Catino, J.; Farrington, R. Probable cause in helicopter emergency medical service crashes: What role does ownership play? J. Trauma Acute Care Surg. 2014, 77, 989–993. [Google Scholar] [CrossRef] [PubMed]
- Larder, B.D. Helicopter HUM/FDR: Benefits and developments. In Proceedings of the American Helicopter Society 55th Annual Forum, Montreal, QC, Canada, 25–27 May 1999. [Google Scholar]
- Wackers, G.; Korte, J. Drift and vulnerability in a complex technical system: Reliability of condition monitoring systems in North Sea offshore helicopter transport. Int. J. Eng. Educ. 2003, 19, 192–205. [Google Scholar]
- Reinecke, M.; Prinsloo, T. The influence of drone monitoring on crop health and harvest size. In Proceedings of the 2017 1st International Conference on Next Generation Computing Applications (NextComp), Mauritius, 19–21 July 2017; IEEE: Piscataway, NJ, USA, 2017; pp. 5–10. [Google Scholar]
- AIBN—Aircraft Accident Investigation Board Norway. Investigation of Helicopter Accident 1997 (Rapport om Luftfartsulykke 8. September 1997 i Norskehavet ca. 100 NM Vest-Nordvest av Brønnøysund Med Eurocopter AS 332L1 Super Puma, LN-OPG, Operert av Helikopter Service AS). 2001. Available online: www.aibn.no (accessed on 10 June 2015).
- AIBN—Aircraft Accident Investigation Board Norway. Investigation of Helicopter Accident at Turøy near Bergen in Hordaland County, Norway. 2016. Available online: www.aibn.no/Aviation/Investigations/16-286 (accessed on 10 October 2017).
- Aasprang, B.; Bye, R.J. Analyse av Risikopåvirkende Faktorer [Analysis of Risk Influencing Factors] in Sikkerhetsstudie [Safety Study]. Doc.Nr. ST-04215-2. Attachment D-1. Safetec. 2013. Available online: www.helikoptersikkerhet.no/?a_id=978&ac_parent=246 (accessed on 6 June 2016).
- Government Notification. 24 May 2017, No. 104/17. 2017. Available online: www.regjeringen.no/no/aktuelt/offshore-helikopteroperasjoner-norge-sier-nei-til-felles-europeiske-regler/id2554393/ (accessed on 10 August 2017).
- The Norwegian Oil and Gas Association (NOG). Guideline 066—Norwegian Oil and Gas Recommended Guidelines for Flights to Petroleum Installations. 2015. Available online: www.norskoljeoggass.no (accessed on 10 January 2017).
- Aasprang, B.; Bye, R.J. Beskrivelsen av Bransjen [Description of the Industry] in Sikkerhetsstudie [Safety Study]. Doc.Nr. ST-04215-2. Attachment C. Safetec. 2013. Available online: www.helikoptersikkerhet.no/?a_id=978&ac_parent=246 (accessed on 6 June 2016).
- Bye, R.J. Resultater fra Spørreskjemaundersøkelsen [Results from survey ] in Sikkerhetsstudie [Safety Study]. Doc.Nr. ST-04215-2. Attachment F. Safetec. 2013. Available online: www.helikoptersikkerhet.no/?a_id=978&ac_parent=246 (accessed on 6 June 2016).
- Nyheim, O.M.; Kvalheim, S.A.; Jensen, K.R.; Asphjell, M.K.; Henriksen, G.L.; Lien, G. Konsekvensutredning Regelverksendringer Offshore Helikopteroperasjoner. [Impact Assessment of Regulatory Amendments within Offshore Helicopter Operations]. Report. Doc.Nr. ST-11926-1. Safetec. 2016. Available online: https://www.regjeringen.no/no/dokumenter/konsekvensutredning---regelverksendringer-offshore-helikopteroperasjoner/id2524919/ (accessed on 10 May 2017).
- Hokstad, P.; Jersin, E.; Sten, T. A risk influence model applied to North Sea helicopter transport. Reliab. Eng. Syst. Saf. 2001, 74, 311–322. [Google Scholar] [CrossRef]
- Nascimento, F.A.; Majumdar, A.; Ochieng, W.Y.; Schuster, W.; Studic, M. Fundamentals of safety management: The offshore helicopter transportation system model. Saf. Sci. 2016, 85, 194–204. [Google Scholar] [CrossRef]
- Groff, L.S.; Price, J.M. General aviation accidents in degraded visibility: A case control study of 72 accidents. Aviat. Space Environ. Med. 2006, 77, 1062–1067. [Google Scholar] [PubMed]


| Country | Period | Fatal Accidents | Ref. |
|---|---|---|---|
| US | 1982–1987 | 47 | [28] |
| Germany | 1982–1987 | 41 | [28] |
| US | 1987–1993 | 16.1 | [29] |
| Australia | 1992–2002 | 14.6 | [30] |
| US | 1992–2001 | 16.9 | [31] |
| Germany | 1999–2004 | 9.1 | [32] |
| US | 2000–2004 | 18 | [33] |
| Offshore Transport | Fatal Accidents |
|---|---|
| - Helicopter North Sea | 1.44 |
| - Helicopter Gulf of Mexico | 4.54 |
| - Helicopter Rest of the World | 8.15 |
| Fixed wing transport | 0.23 |
| Description | Offshore 1990–1998 | Offshore 1999–2008 | Amb./Police 2000–2012 | AW/PAX 2000–2012 |
|---|---|---|---|---|
| Number of accidents | 4 | 1 | 2 | 39 |
| Helicopter crash | 1 | 0 | 0 | 23 |
| Accidents with personal injuries | 1 | 0 | 1 | 20 |
| Fatal accidents | 1 | 0 | 0 | 7 |
| Fatalities | 12 | 0 | 0 | 16 |
| Flight hours | 355760 | 442764 | 122052 | 382452 |
| Fatal acc. rate per million flight hours | 2.8 | 0 | 0 | 18.3 |
| Onshore Operations | Accident Frequency |
|---|---|
| AW/PAX-Large Company | 3.44 |
| AW/PAX-Medium Company | 4.56 |
| AW/PAX-Small Company | 8.22 |
| Ambulance/Police | 2.45 |
| Description | Piston Engine | Single Engine | Twin Engine |
|---|---|---|---|
| Accidents | 353.5 (N = 7) | 89.8 (N = 29) | 75.2 (N = 3) |
| Accidents with personal injuries | 101.0 (N = 2) | 43.4 (N = 14) | 50.1 (N = 2) |
© 2018 by the authors. Licensee MDPI, Basel, Switzerland. This article is an open access article distributed under the terms and conditions of the Creative Commons Attribution (CC BY) license (http://creativecommons.org/licenses/by/4.0/).
Share and Cite
Bye, R.J.; Johnsen, S.O.; Lillehammer, G. Addressing Differences in Safety Influencing Factors—A Comparison of Offshore and Onshore Helicopter Operations. Safety 2018, 4, 4. https://doi.org/10.3390/safety4010004
Bye RJ, Johnsen SO, Lillehammer G. Addressing Differences in Safety Influencing Factors—A Comparison of Offshore and Onshore Helicopter Operations. Safety. 2018; 4(1):4. https://doi.org/10.3390/safety4010004
Chicago/Turabian StyleBye, Rolf J., Stig O. Johnsen, and Grethe Lillehammer. 2018. "Addressing Differences in Safety Influencing Factors—A Comparison of Offshore and Onshore Helicopter Operations" Safety 4, no. 1: 4. https://doi.org/10.3390/safety4010004
APA StyleBye, R. J., Johnsen, S. O., & Lillehammer, G. (2018). Addressing Differences in Safety Influencing Factors—A Comparison of Offshore and Onshore Helicopter Operations. Safety, 4(1), 4. https://doi.org/10.3390/safety4010004