Development of a Preliminary Model for Evaluating Occupational Health and Safety Risk Management Maturity in Small and Medium-Sized Enterprises
Abstract
:1. Introduction
2. Research Problem
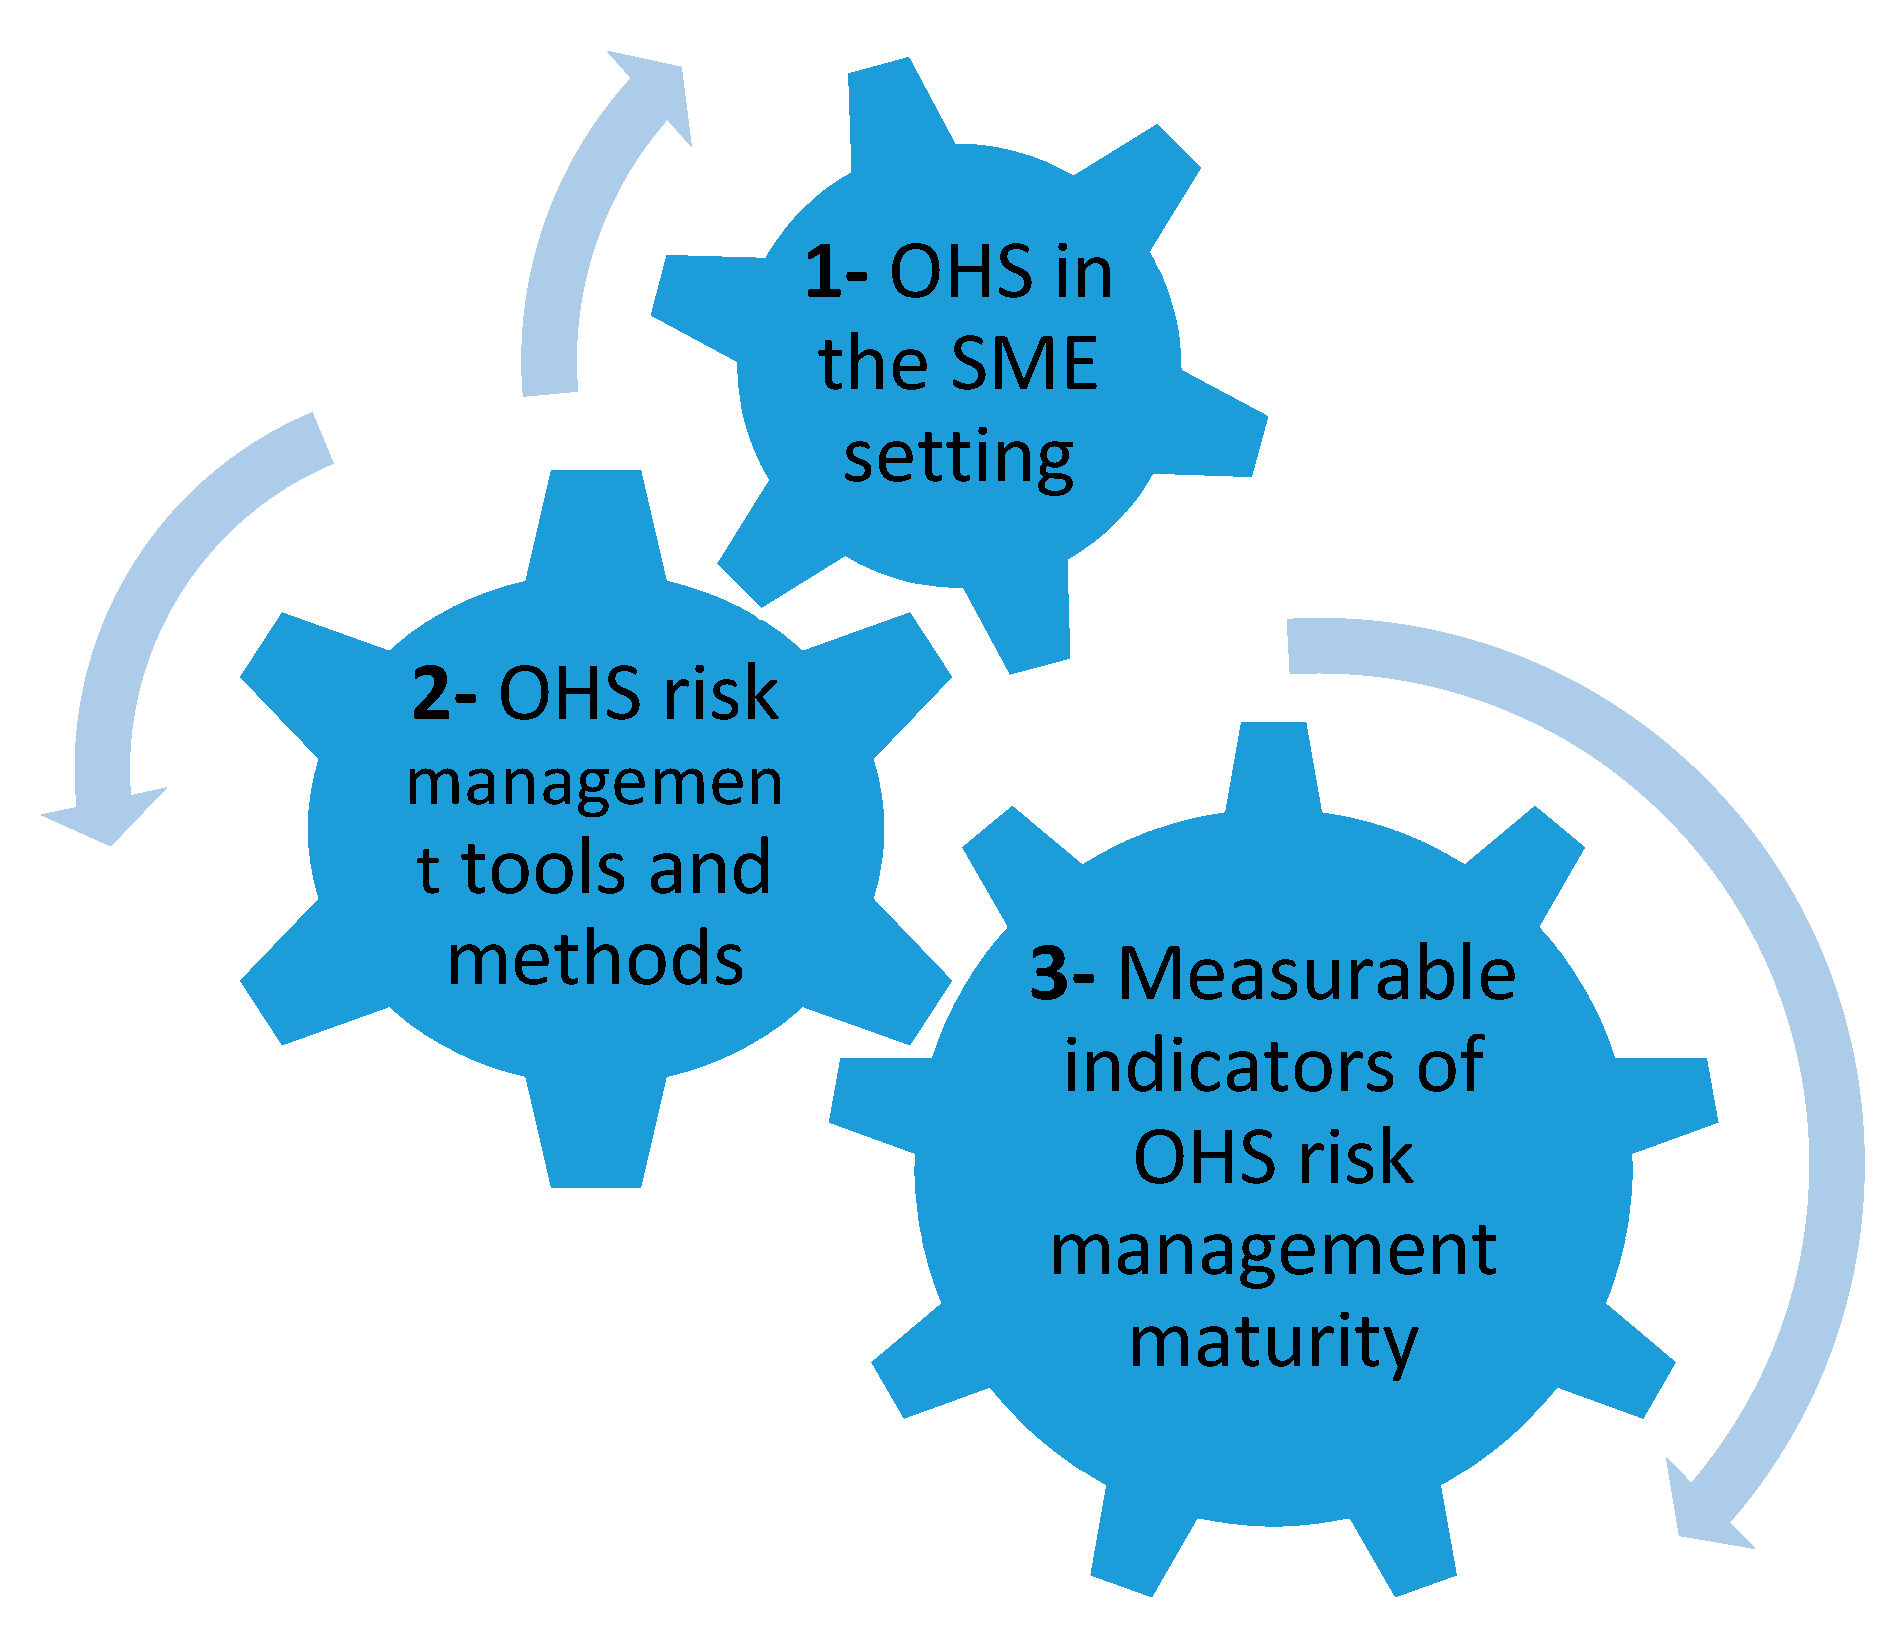
2.1. Occupational Health and Safety in the SME Setting
2.2. OHS Risk Management Tools and Methods
2.3. Measurable Indicators OHS Risk Management Maturity
3. Materials and Methods
3.1. Review of the Literature
3.2. Development of the Preliminary Model of Risk Management Maturity Evaluation
4. Results
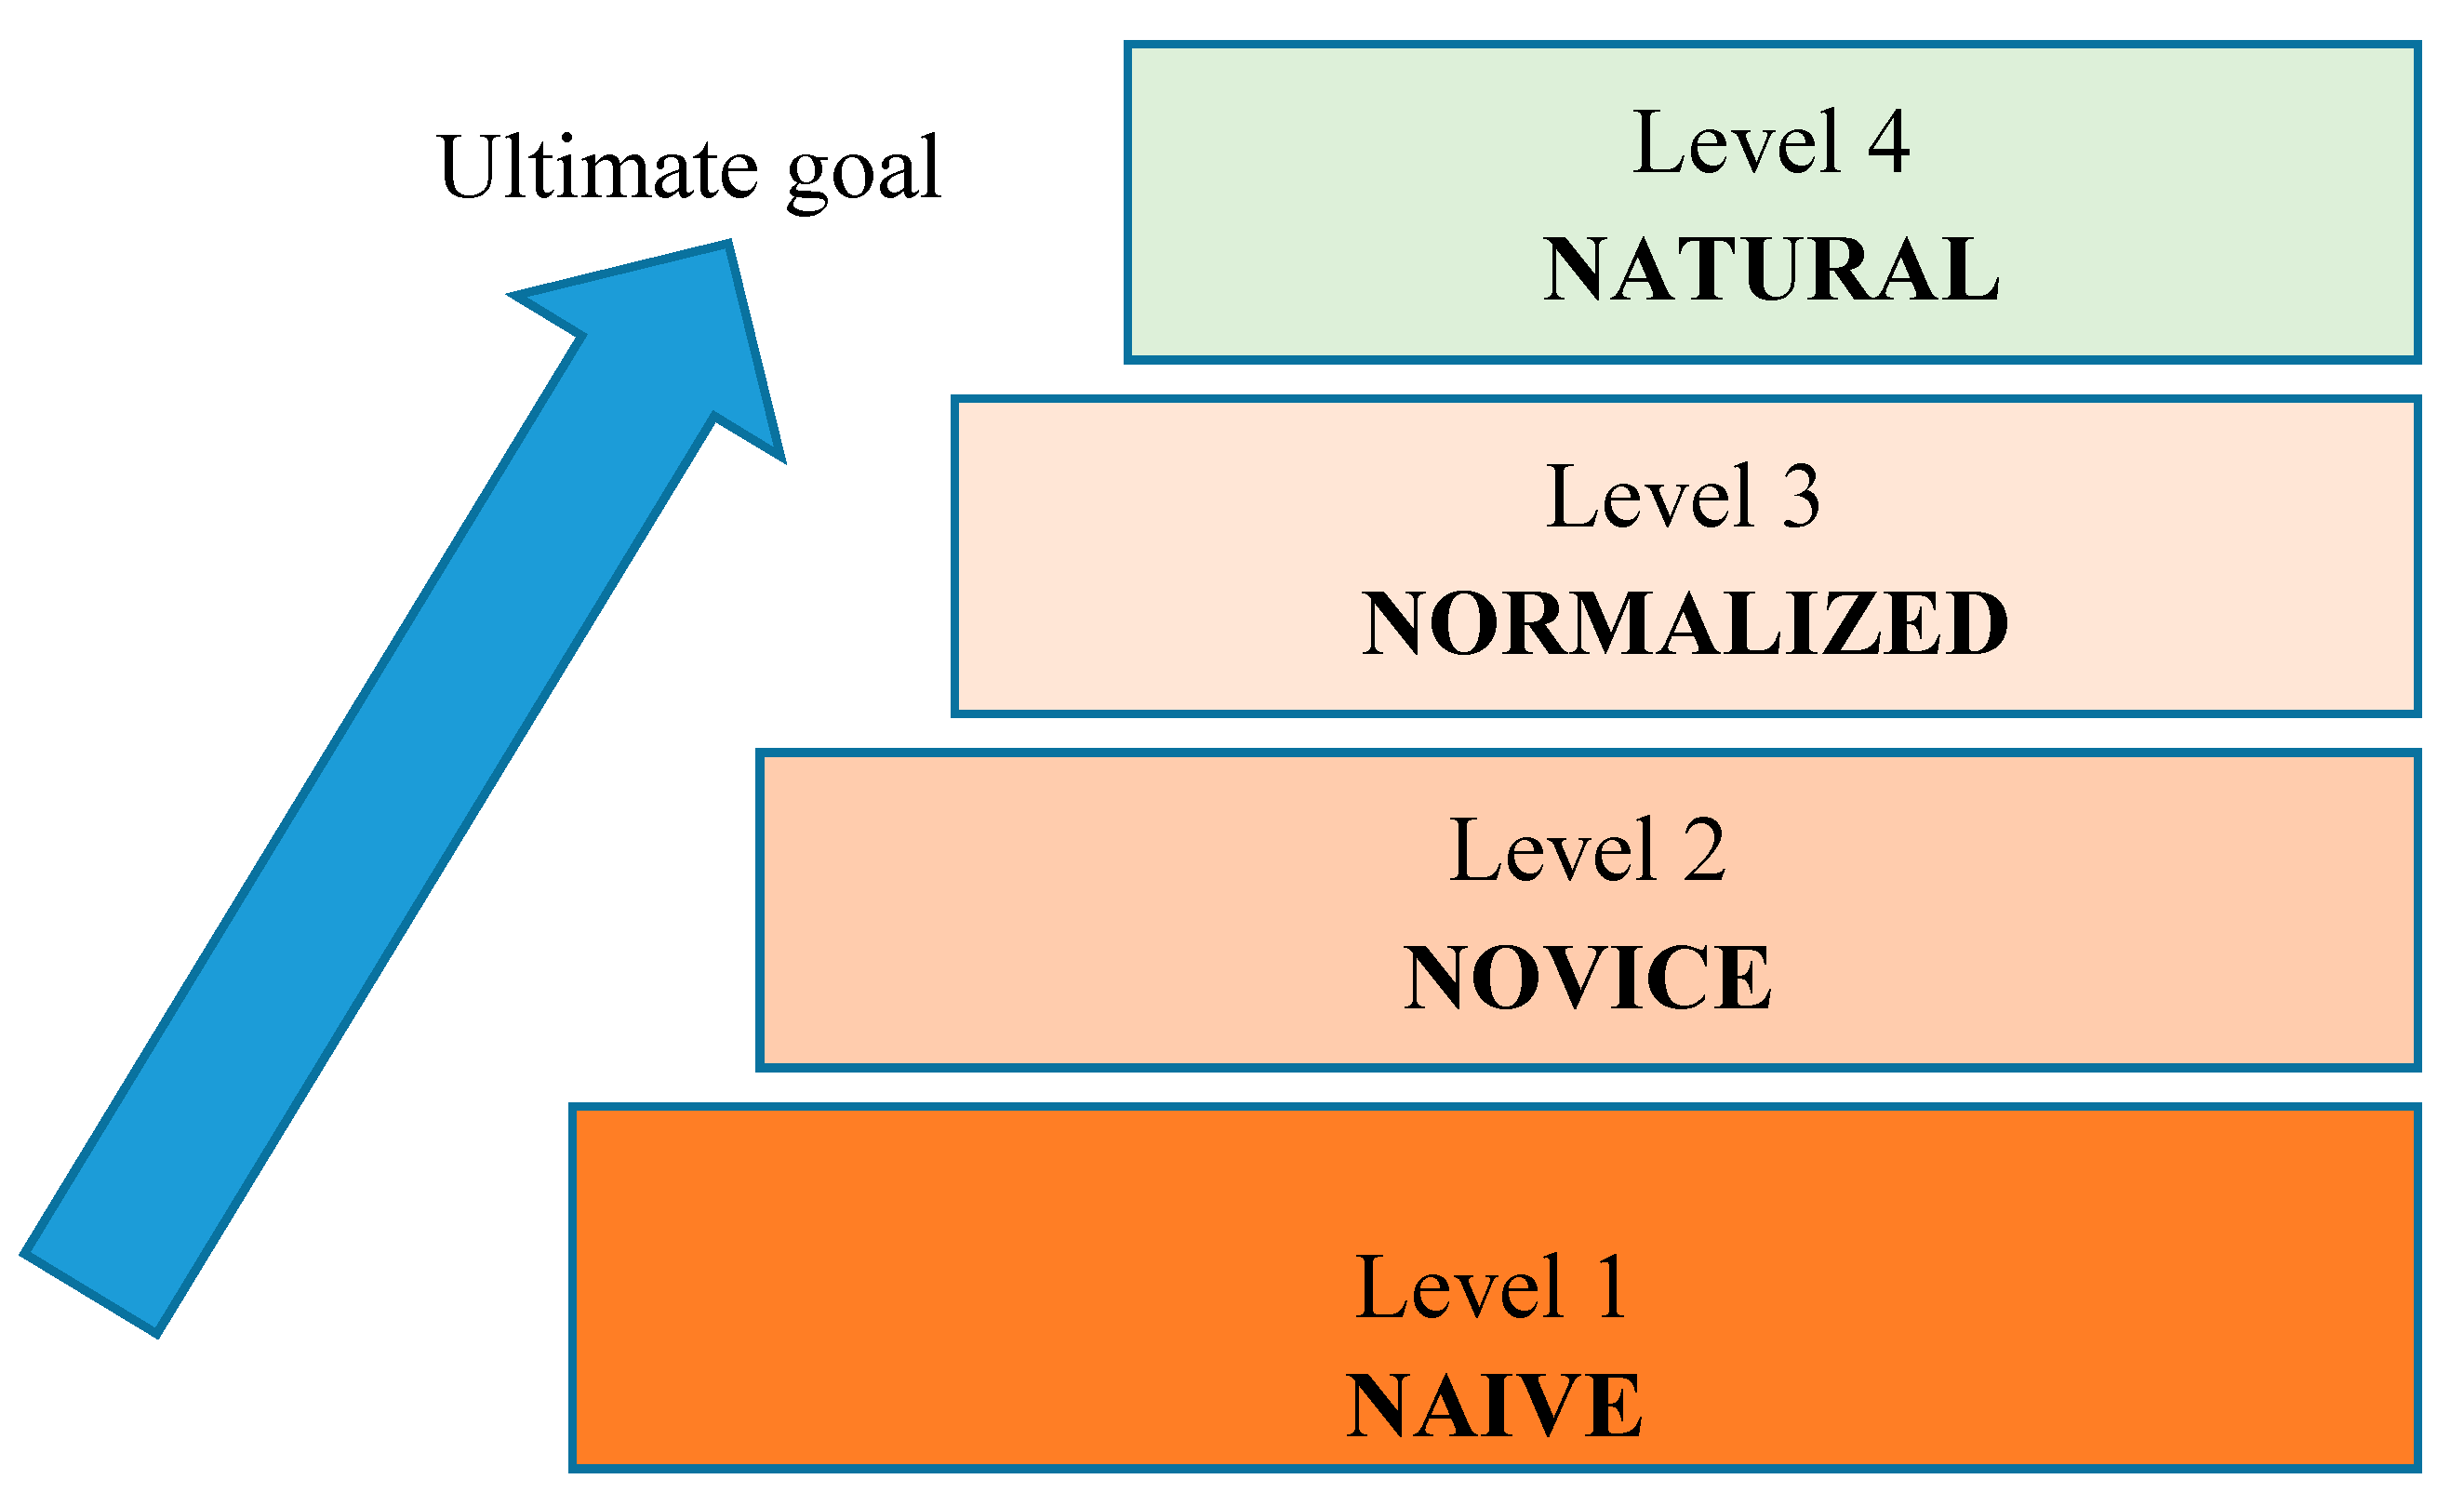
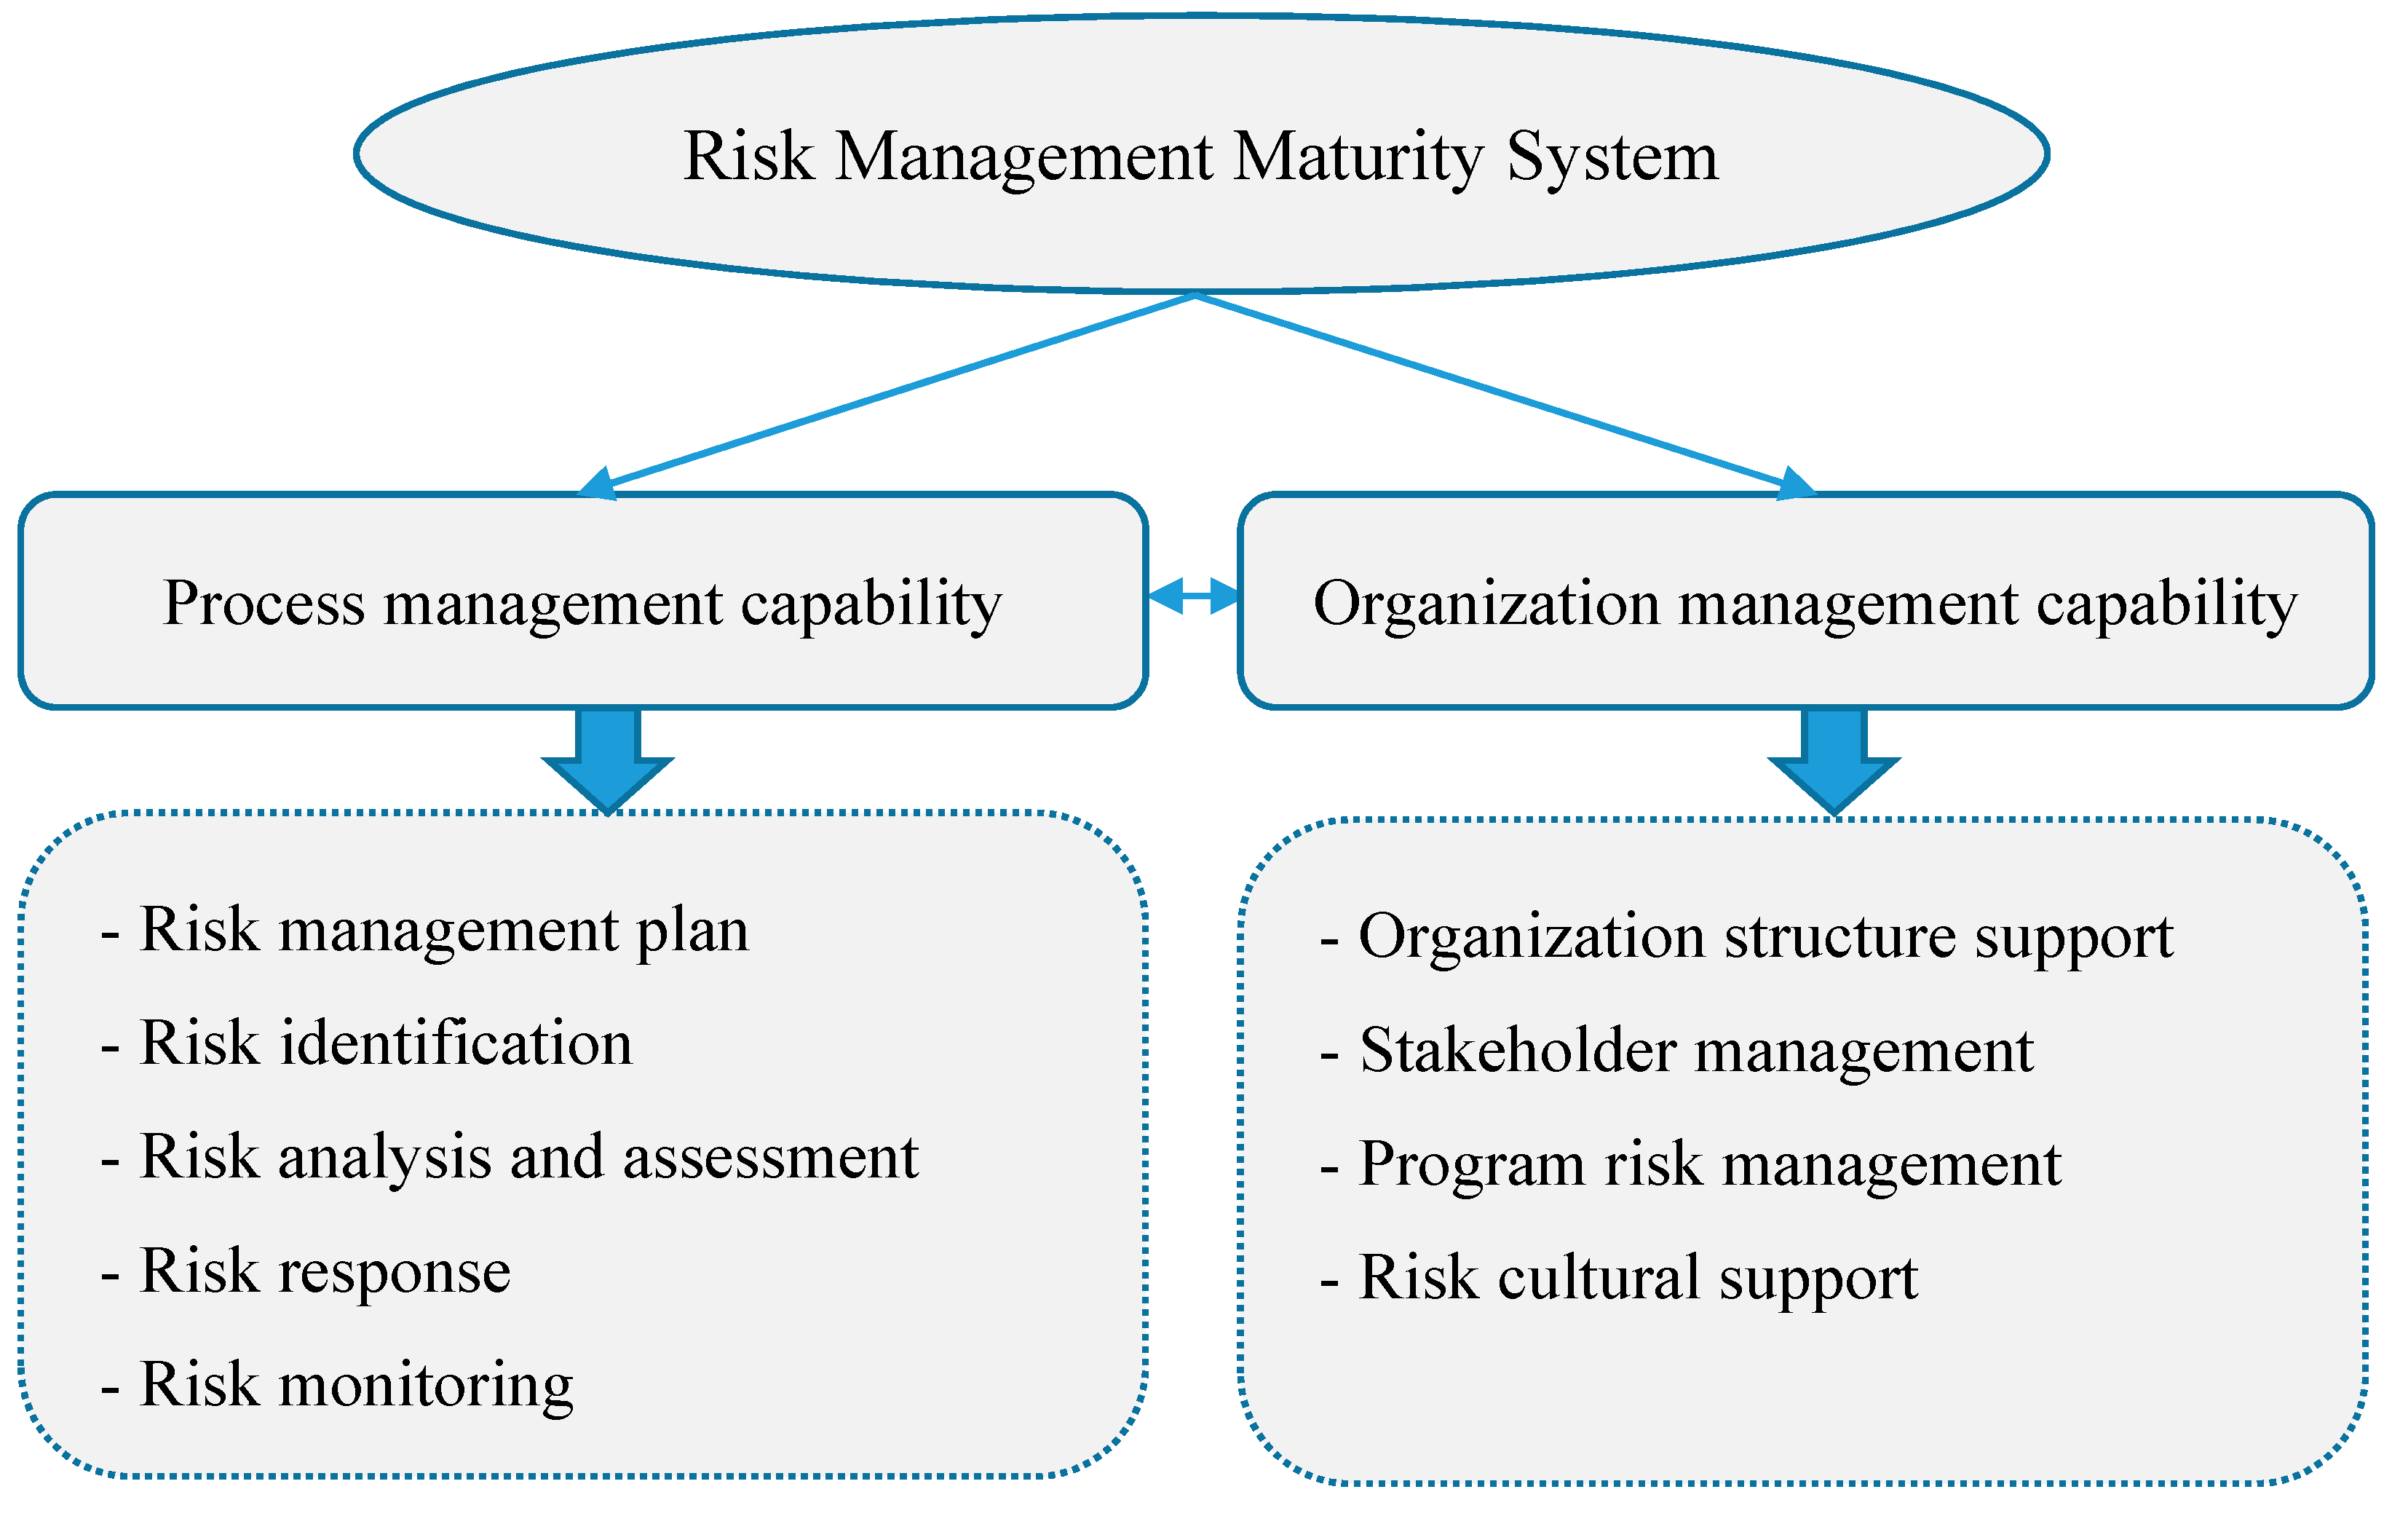
4.1. Risk Management Maturity Measurement Models
- Pathological: characterized by worker-caused unsafe conditions. The principal focus of the business is productivity. Safety legislation and regulations are disregarded or circumvented deliberately.
- Reactive: the organization is starting to take safety seriously. Measures and actions are undertaken as accidents occur.
- Calculating: safety is guided by management systems based on data gathering. It is more suggested or imposed by the administration than desired by the workers.
- Proactive: performance is improved using predictions. Worker involvement is starting the transition from a purely top-down approach.
- Generative: active participation is preached and practised at all levels. Safety is perceived as a central and crucial issue for the company.
- “Information” refers to the information system, that is, the manager’s evaluation of the system put in place to favour circulation of and access to information on workplace accidents, for the purpose of improving safety performance.
- “Organizational learning” refers to information processing and analysis and to training of workers in subjects related to safety.
- “Involvement” refers to that of workers in the risk management process.
- “Communication” refers to horizontal as well as vertical exchanges of information within the company.
- “Commitment” refers to the support provided by the company with regard to safety.
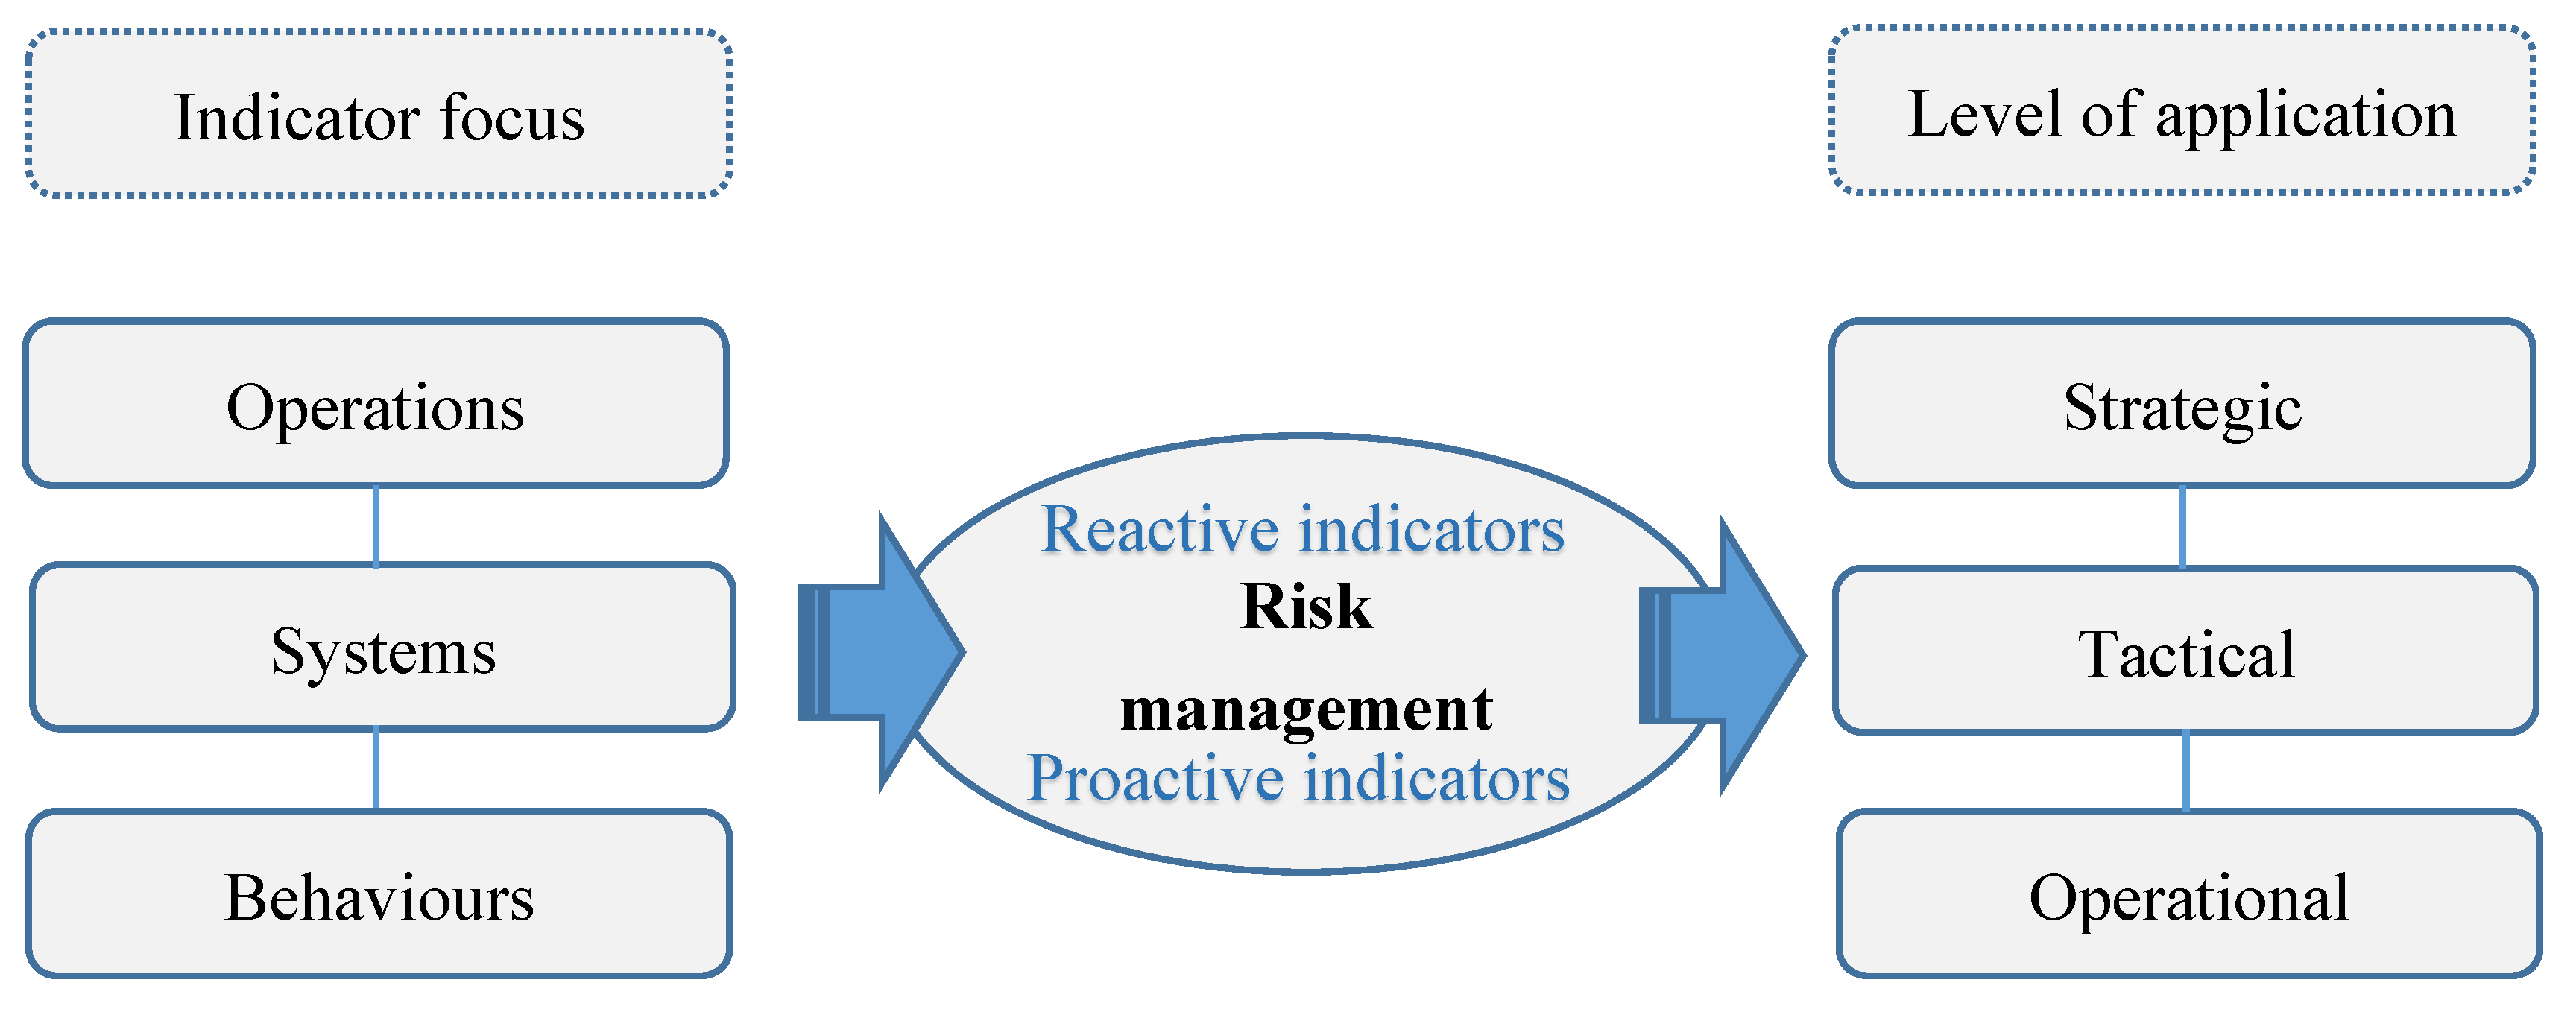
4.2. Indicators Suitable for Measuring Risk Management Maturity
- Relevance: The preoccupation and the associated expectations have real significance in terms of the objective to be met. The result or phenomenon to be measured is shown clearly and sufficient information is obtained on the effects of the activities underway and the expected results.
- Validity: The measurement provides accurate and precise evaluation of the situation of concern. It should be noted that validity is verified by cross-comparison with other indicators used to measure the same phenomenon.
- Feasibility: The data associated with an indicator are accessible when needed and at an acceptable cost.
- User friendliness: The criterion (indicator) is simple, clear, easy to understand and to present and is interpreted the same way by all within known limits.
- Reliability: The measurements obtained correspond to reality. Values remain constant while the measurement is repeated under identical conditions. The overall reliability of the indicator depends largely on the reliability of the data (of the actual measurements).
- Compatibility: Standard variables, calculation methods and frequencies of measurement are used, as recommended by recognized official organizations, thus lending credibility to the indicator.
4.3. Preliminary Model of OHS Risk Management Maturity Measurement
5. Discussion
Limitations of this Research
6. Conclusions
Acknowledgments
Author Contributions
Conflicts of Interest
References
- International Labour Organization. Investigation of Occupational Accidents and Diseases: A Practical Guide for Labour Inspectors, 1st ed.; International Labour Office: Geneva, Switzerland, 2015. [Google Scholar]
- International Labour Organization. Small and Medium-Sized Enterprises and Decent and Productive Employment Creation, Report IV; International Labour Office: Geneva, Switzerland, 2015. [Google Scholar]
- Commission des Normes, de L’équité, de la Santé et de la Sécurité du Travail (CNESST). Statistiques Annuelles CNESST 2014. Available online: http://www.cnesst.gouv.qc.ca/Publications/200/Documents/DC200-1046web.pdf (accessed on 15 February 2017).
- Commission des Normes, de L’équité, de la Santé et de la Sécurité du Travail (CNESST); Institut de Recherche Robert-Sauvé en Santé et en Sécurité du Travail (IRSST). Prévention au Travail (La Sécurité Dans les Ateliers de Mécanique). 2016. Available online: http://www.cnesst.gouv.qc.ca/Publications/600/Documents/DC600-202-164web.pdf (accessed on 15 February 2017).
- Association des Commissions des Accidents du Travail du Canada (ACATC). Statistiques des Accidents Professionnels au Canada 2015. Available online: http://awcbc.org/fr/?page_id=381 (accessed on 6 September 2016).
- Mendeloff, J.; Nelson, C.; Ko, K.; Haviland, A. Small Businesses and Workplace Fatality Risk—An Exploratory Analysis. Available online: http://www.rand.org/content/dam/rand/pubs/technical_reports/2006/RAND_TR371.pdf (accessed on 20 August 2016).
- Holizki, T.; McDonald, R.; Gagnon, F. Patterns of underlying causes of work-related traumatic fatalities—Comparison between small and larger companies in British Columbia. Saf. Sci. 2015, 71, 197–204. [Google Scholar] [CrossRef]
- Masi, D.; Cagno, E. Barriers to OHS interventions in Small and Medium-sized Enterprises. Saf. Sci. 2015, 71, 226–241. [Google Scholar] [CrossRef]
- Brody, B.; Létourneau, Y.; Poirier, A. Le coût des accidents du travail: État des connaissances. Relat. Ind. 1990, 45, 94–117. [Google Scholar] [CrossRef]
- Commission des Normes, de L’équité, de la Santé et de la Sécurité du Travail (CNESST). Rapport Annuel Gestion SST. Available online: http://www.cnesst.gouv.qc.ca/Publications/400/Documents/DC-400-2032-8web.pdf (accessed on 15 October 2016).
- Lebeau, M.; Duguay, P. Les Coûts des Lésions Professionnelles, Une Revue de Littérature. Available online: http://www.irsst.qc.ca/media/documents/PubIRSST/R-676.pdf (accessed on 5 October 2016).
- Ressources Humaines et Développement des Compétences Canada. Accidents de Travail et Maladies Professionnelles au Canada, 1996–2008—Programme du Travail. Available online: http://www.travail.gc.ca/fra/sante_securite/pubs_ss/atmc.shtml (accessed on 6 December 2016).
- Abad, J.; Lafuente, E.; Vilajosana, J. An assessment of the OHSAS 18001 certification process: Objective drivers and consequences on safety performance and labour productivity. Saf. Sci. 2013, 60, 47–56. [Google Scholar] [CrossRef]
- International Organization for Standardization (ISO). ISO 31000: Risk Management—Principles and Guidelines, 1st ed.; International Organization for Standardization: Geneva, Switzerland, 2009. [Google Scholar]
- Canadian Standards Association (CSA). CAN/CSA-Z1000-14: Occupational Health and Safety Management; Canadian Standards Association: Mississauga, ON, Canada, 2014. [Google Scholar]
- British Standard Institute (BSI). OHSAS 18001: Occupational Health and Safety Management; British Standard Institute: London, UK, 2007. [Google Scholar]
- Sghaier, W.; Hergon, E.; Desroches, A. Global risk management. Transfus. Clin. Biol. 2015, 22, 158–167. [Google Scholar] [CrossRef] [PubMed]
- Meyssonnier, F.; Zawadzki, C. L’introduction du contrôle de gestion en PME. Revue Internationale P.M.E. Économie et Gestion de la Petite et Moyenne Entreprise 2008, 21, 69–92. [Google Scholar] [CrossRef]
- Becker, B.; Gerhart, B. The Impact of Human Resource Management on Organizational Performance: Progress and Prospects. Acad. Manag. J. 1996, 39, 779–801. [Google Scholar] [CrossRef]
- Legg, S.J.; Olsen, K.B.; Laird, I.S.; Hasle, P. Managing safety in small and medium enterprises. Saf. Sci. 2015, 71, 189–196. [Google Scholar] [CrossRef]
- International Labor Office. Guidelines on Occupational Safety and Health Management Systems (ILO-OSH/ISBN 92-2-111634-4); International Labor Office: Geneva, Switzerland, 2001. [Google Scholar]
- Mazars. Management des Risques—Enquête Gestion des Risques 2007. Available online: https://www.mazars.fr/Accueil/News/Publications/Enquetes-et-Etudes/Enquete-sur-la-gestion-des-risques (accessed on 20 July 2017).
- Baldock, R.; James, P.; Smallbone, D.; Vickers, I. Influences on Small-Firm Compliance-Related Behaviour. Available online: http://epc.sagepub.com/content/24/6/827.full.pdf+html (accessed on 18 September 2016).
- Reinhold, K.; Järvis, M.; Tint, P. Practical tool and procedure for workplace risk assessment: Evidence from SMEs in Estonia. Saf. Sci. 2015, 71, 282–291. [Google Scholar] [CrossRef]
- Unnikrishnan, S.; Iqbal, R.; Singh, A.; Nimkar, I.M. Safety management practices in small and medium enterprises in India. Saf. Health Work 2015, 6, 46–55. [Google Scholar] [CrossRef] [PubMed]
- Laird, I.; Hasle, P.; Olsen, K.; Harris, L.A.; Legg, S.; Perry, M.J. Utilising the characteristics of small enterprises to assist in managing hazardous substances in the workplace. Int. J. Workplace Health Manag. 2011, 4, 140–163. [Google Scholar] [CrossRef]
- Cassell, C.; Nadin, S.; Older Gray, M. The use and effectiveness of benchmarking in SMEs. Benchmark. Int. J. 2001, 8, 212–222. [Google Scholar] [CrossRef]
- Kaplan, R.S.; Norton, D.P. The Balanced Scorecard: Translating Strategy into Action; Harvard Business Press: Boston, MA, USA, 1996; p. 231. [Google Scholar]
- Kongsvik, T.; Kjøs Johnsen, S.Å.; Sklet, S. Safety climate and hydrocarbon leaks: An empirical contribution to the leading-lagging indicator discussion. J. Loss Prev. Process Ind. 2011, 24, 405–411. [Google Scholar] [CrossRef]
- Hale, A. Why Safety Performance Indicators? Saf. Sci. 2009, 47, 479–480. [Google Scholar] [CrossRef]
- Moriarty, J.P.; Smallman, C. En route to a theory of benchmarking. Benchmark. Int. J. 2009, 16, 484–503. [Google Scholar] [CrossRef]
- Wendler, R. The maturity of maturity model research: A systematic mapping study. Inf. Softw. Technol. 2012, 54, 1317–1339. [Google Scholar] [CrossRef]
- Jia, G.; Ni, X.; Chen, Z.; Hong, B.; Chen, Y.; Yang, F.; Lin, C. Measuring the maturity of risk management in large-scale construction projects. Autom. Constr. 2013, 34, 56–66. [Google Scholar] [CrossRef]
- Cienfuegos, I. Developing a Risk Management Maturity Model—A Comprehensive Risk Maturity-Model for Dutch Municipalities. Ph.D. Thesis, University of Twente, Enschede, The Netherlands, 2013. [Google Scholar]
- Argyris, C.; Schön, A. L’apprentissage Organisationnel, Théorie, Méthode et Pratique; Addison-Wesley: Reading, MA, USA, 1978. [Google Scholar]
- Min, Ho.; Min, H. Cross-cultural competitive benchmarking of fast-food restaurant services. Benchmark. Int. J. 2013, 20, 212–232. [Google Scholar] [CrossRef]
- Wang, K.-J.; Hong, W.-C. Competitive advantage analysis and strategy formulation of airport city development—The case of Taiwan. Transp. Policy 2011, 18, 276–288. [Google Scholar] [CrossRef]
- Watson, G. Strategic Benchmarking: How to Rate Your Company’s Performance against the World’s Best; Research Technology Management; J. Wiley & Sons: New York, NY, USA, 1993; Volume 36, 288p. [Google Scholar]
- Wynn, L.M. Highlights of an industry benchmarking study: Health and safety excellence initiatives. J. Chem. Health Saf. 2008, 15, 22–24. [Google Scholar] [CrossRef]
- Fang, D.; Huang, X.; Hinze, J. Benchmarking studies on construction safety management in China. J. Constr. Eng. Manag. 2004, 130, 424–432. [Google Scholar] [CrossRef]
- Zairi, M. Benchmarking: The Best Tool for Measuring Competitiveness. Benchmark. Qual. Manag. Technol. 1994, 1, 11–24. [Google Scholar] [CrossRef]
- Zairi, M.; Baidoun, S. Understanding the Essentials of Total Quality Management—A Best Practice Approach, Part 2. Available online: http://citeseerx.ist.psu.edu/viewdoc/download?doi=10.1.1.195.7364&rep=rep1&type=pdf (accessed on 13 September 2016).
- Deguil, R. Mapping Entre un Référentiel D’exigences et un Modèle de Maturité: Application à L’industrie Pharmaceutique. Ph.D. Thesis, Université de Toulouse, Toulouse, France, 2008. [Google Scholar]
- Fraser, M.; Moultrie, J.; Gregory, M. The use of maturity models/grids as a tool in assessing product development capability. In Proceedings of the 2002 IEEE International Engineering Management Conference, Cambridge, UK, 18–20 August 2002; Centre for Technology Management, Institute for Manufacturing, University of Cambridge: Mill Lane, Cambridge, UK, 2002. [Google Scholar]
- Crosby, P.B. La Qualité, C’est Gratuit: L’art et la Manière D’obtenir la Qualité; Economica: Paris, France, 1986. [Google Scholar]
- Ferchichi, A.; Bourey, J.-P.; Bigand, M. Contribution à L’intégration des Processus Métier—Application à la Mise en Place d’un Référentiel Qualité Multi-Vues. Ph.D. Thesis, École Centrale de Lille, Villeneuve-d’Ascq, France, 2008. [Google Scholar]
- Project Management Institute. Organization Project Management Maturity Model (OPM3) Knowledge Foundation, Project Management Institute (PMI®); Project Management Institute: Pittsburgh, PA, USA, 2003. [Google Scholar]
- Sahibudin, S.; Sharifi, M.; Ayat, M. Combining ITIL, COBIT and ISO/IEC 27002 in Order to Design a Comprehensive IT Framework in Organizations. In Proceedings of the 2008 Second Asia International Conference on Modelling & Simulation (AMS), Washington, DC, USA, 13–15 May 2008; pp. 749–753. [Google Scholar] [CrossRef]
- Hillson, D. Towards a risk maturity model. Int. J. Proj. Bus. Risk Manag. 1997, 1, 35–45. [Google Scholar]
- Arrow, J. Risk Intelligence and Measuring Excellence in Project Risk Management. AACE International Transactions; RISK.845.2 Risk Intelligence and Measuring Excellence in Project Risk Management; AACE International: San Antonio, TX, USA, 2012. [Google Scholar]
- Chapman, R.J. Risk Maturity Models. Simple Tools and Techniques for Enterprise Risk Management, 2nd ed.; John Wiley & Sons, Ltd.: London, UK, 2011. [Google Scholar]
- Yeo, K.T.; Ren, Y. Risk management capability maturity model for complex product systems (CoPS) projects. Syst. Eng. 2009, 12, 275–294. [Google Scholar] [CrossRef]
- Zou, P.X.W.; Chen, Y.; Chan, A.T.-Y. Understanding and Improving Your Risk Management Capability Assessment Model for Construction Organizations. J. Constr. Eng. Manag. 2010, 136, 854–863. [Google Scholar] [CrossRef]
- Filho, A.P.G.; Andrade, J.C.S.; Oliveira Marinho, M.M. A safety culture maturity model for petrochemical companies in Brazil. Saf. Sci. 2010, 48, 615–624. [Google Scholar] [CrossRef]
- Reason, J. Managing the Risks of Organizational Accidents. Available online: https://books.google.fr/books?id=UVCFCwAAQBAJ (accessed on 9 December 2016).
- Hudson, P. Applying the Lessons of High Risk Industries to Health Care. Available online: http://qualitysafety.bmj.com/content/12/suppl_1/i7.full.pdf+html (accessed on 15 September 2016).
- Hudson, P.T.W. Safety management and safety culture: The long, hard and winding road. In Occupational Health and Safety Management Systems; Pearse, W., Gallagher, C., Bluff, L., Eds.; Crown Content: Melbourne, Australia, 2001. [Google Scholar]
- Parker, D.; Lawrie, M.; Hudson, P. A framework for understanding the development of organisational safety culture. Saf. Sci. 2006, 44, 551–562. [Google Scholar] [CrossRef]
- Fleming, M. Safety Culture Maturity Model; Prepared by The Keil Centre for the Health and Safety Executive, Offshore Technology Report 2000/049; Offshore Technology Report-Health and Safety Executive OTH: Norwich, UK, 2000. [Google Scholar]
- Mayer, J.; Fagundes, L.L. A Model to Assess the Maturity Level of the Risk Management Process in Information Security. Available online: http://ieeexplore.ieee.org/stamp/stamp.jsp?arnumber=5195935 (accessed on 13 September 2016).
- Goncalves, A.P.; Kanegae, G.; Leite, G. Safety Culture Maturity and Risk Management Maturity in Industrial Organizations. Available online: http://www.abepro.org.br/biblioteca/icieom2012_submission_131.pdf (accessed on 15 November 2016).
- International Nuclear Safety Advisory Group. Key Practical Issues in Strengthening Safety Culture. Available online: http://www-pub.iaea.org/MTCD/publications/PDF/Pub1137_scr.pdf (accessed on 5 September 2016).
- Tee, K.F.; Rick Edgeman, P.A.N.D. Identifying critical performance indicators and suitable partners using a benchmarking template. Int. J. Prod. Perform. Manag. 2015, 64, 434–450. [Google Scholar] [CrossRef]
- Institut National de L’environnement Industriel et des Risques (INERIS). Pilotage de la Sécurité par les Indicateurs de Performance—Guide à L’attention des ICPE. Available online: http://www.ineris.fr/centredoc/guide-ineris-sips-1459850449.pdf (accessed on 5 September 2016).
- Voyer, P. Tableaux de Bord de Gestion et Indicateur de Performance, 2nd ed.; Presses de l’Université du Québec: Sainte-Foy, QC, Canada, 2002; p. 446. [Google Scholar]
- Conseil du Trésor du Québec. Guide sur les Indicateurs. Available online: https://www.tresor.gouv.qc.ca/fileadmin/PDF/publications/guide_indicateur.pdf (accessed on 10 September 2016).
- Meek, V.L.; van der Lee, J.J. Performance Indicators for Assessing and Benchmarking Research Capacities in Universities. Available online: https://minerva-access.unimelb.edu.au/handle/11343/28907 (accessed on 8 September 2016).
- Roy, M.; Desmarais, L.; Cadieux, J. Améliorer la Performance en SST: Les Résultats vs les Prédicteurs. Available online: https://pistes.revues.org/3214 (accessed on 25 June 2016).
- Commission de la Santé et de la Sécurité du Travail (CNESST). Pour Comprendre le Régime Québécois de Santé et de Sécurité du Travail. Available online: http://bibvir1.uqac.ca/archivage/000588663.pdf (accessed on 16 August 2016).
- Roy, M.; Bergeron, S.; Fortier, L. Développement D’instruments de Mesure de Performance en Santé et Sécurité du Travail à L’intention des Entreprises Manufacturières Organisées en Équipes Semi-Autonomes de Travail. Available online: https://www.usherbrooke.ca/ceot/fileadmin/sites/ceot/documents/Publications/Projets_de_recherche/R-357_IRSST.pdf (accessed on 13 June 2016).
- Chemical Safety Board (CSB). US Chemical Safety and Hazard Investigation Board, Investigation Report, Refinery Explosion and Fire; Report No. 2005-04-ITX; Chemical Safety Board: Texas City, TX, USA, 2007. [Google Scholar]
- Knegtering, B.; Pasman, H.J. Safety of the process industries in the 21st century—A changing need of process safety management for a changing industry. J. Loss Prev. Process Ind. 2008, 22, 162–168. [Google Scholar] [CrossRef]
- Government of Alberta. Leading Indicators for Workplace Health and Safety—A User Guide. Available online: http://work.alberta.ca/documents/ohs-best-practices-BP019.pdf (accessed on 5 June 2017).
- USA National Safety Council. Elevating EHS Leading Indicators—Cambpell Institut. Available online: http://www.nsc.org/CambpellInstituteandAwardDocuments/WP-From-Defining-to-Designing.pdf (accessed on 2 February 2017).
- Paltrinieri, N.; Øien, K.; Cozzani, V. Assessment and comparison of two early warning indicator methods in the perspective of prevention of atypical accident scenarios. Reliab. Eng. Syst. Saf. 2012, 108, 21–31. [Google Scholar] [CrossRef]
- Wu, X.; Liu, Q.; Zhang, L.; Skibniewski, M.J.; Wang, Y. Prospective safety performance evaluation on construction sites. Accid. Anal. Prev. 2015, 78, 58–72. [Google Scholar] [CrossRef] [PubMed]
- Zwetsloot, G.I.; Aaltonen, M.; Wybo, J.-L.; Saari, J.; Kines, P.; Beeck, R.O.D. The case for research into the zero accident vision. Saf. Sci. 2013, 58, 41–48. [Google Scholar] [CrossRef]
- Nordlöf, H.; Wiitavaara, B.; Winblad, U.; Wijk, K.; Westerling, R. Safety culture and reasons for risk-taking at a large steel-manufacturing company: Investigating the worker perspective. Saf. Sci. 2015, 73, 126–135. [Google Scholar] [CrossRef]
- Skogdalen, J.E.; Vinnem, J.E. Combining precursor incidents investigations and QRA in oil and gas industry. Reliab. Eng. Syst. Saf. 2012, 101, 48–58. [Google Scholar] [CrossRef]
- Arocena, P.; Núñez, I.; Villanueva, M. The impact of prevention measures and organisational factors on occupational injuries. Saf. Sci. 2008, 46, 1369–1384. [Google Scholar] [CrossRef]
- Euzenat, D.; Mortezapouraghdam, M. Les changements d’organisation du travail dans les entreprises: Quelles conséquences sur les accidents du travail des salariés? Econ. Stat. 2016, 486, 129–147. [Google Scholar] [CrossRef]
- Greenan, N.; Mairesse, J. Les changements organisationnels, l’informatisation des entreprises et le travail des salaries—Un exercice de mesure à partir de données couplées entreprises/salariés. Rev. Écon. 2006, 57, 1137–1175. [Google Scholar] [CrossRef]
- Bellemare, M.; Trudel, L.; Ledoux, É.; Montreuil, S.; Marier, M.; Laberge, M.; Godi, M.-J. Intégration de la Prévention des TMS dès la Conception d’un Aménagement—Le cas des Bibliothèques Publiques; l’Institut de Recherche Robert-Sauvé en Santé et en Sécurité du Travail: Montreal, QC, Canada, 2005; p. 210. [Google Scholar]
- Commission de la Santé et de la Sécurité du Travail (CNESST). Prévention des Phénomènes Dangereux D’origine Mécanique (2008). Available online: https://www.irsst.qc.ca/media/documents/PubIRSST/RG-552.pdf (accessed on 16 August 2016).
- International Organization for Standardization. ISO 12100: Safety of Machinery—General Principles for Design—Risk Assessment and Risk Reduction, 1st ed.; International Organization for Standardization: Geneva, Switzerland, 2010. [Google Scholar]
- Podgórski, D. Measuring operational performance of OHS management system—A demonstration of AHP-based selection of leading key performance indicators. Saf. Sci. 2015, 73, 146–166. [Google Scholar] [CrossRef]
- Reason, J. Safety paradoxes and safety culture. Inj. Control Saf. Promot. 2000, 7, 3–14. [Google Scholar] [CrossRef]
- Antonsen, S.; Skarholt, K.; Ringstad, A.J. The role of standardization in safety management—A case study of a major oil & gas company. Saf. Sci. 2012, 50, 2001–2009. [Google Scholar] [CrossRef]
- Commission des Normes, de L’équité, de la Santé et de la Sécurité du Travail (CNESST). Des Métiers Transformés par les Technologies (2014b). Available online: http://www.cnesst.gouv.qc.ca/Publications/600/Documents/DC600_410_40web.pdf (accessed on 15 April 2017).
- Institut de Recherche Robert-Sauvé en Santé et en Sécurité du Travail (IRSST). Étude Exploratoire des Facteurs de la Charge de Travail Ayant un Impact sur la Santé et la Sécurité (2010). Available online: http://www.irsst.qc.ca/media/documents/pubirsst/R-668.pdf (accessed on 7 November 2016).
- Argyris, C.; Moingeon, B.; Ramanantsoa, B. Savoir Pour Agir-Surmonter les Obstacles à L’apprentissage Organisationnel; Publiée Originally in the USA by Jossey-Bass; Jossey-Bass: San Francisco, CA, USA, 1993. [Google Scholar]


| Proactive Indicator | Examples of Measurement | References |
|---|---|---|
| Identification of OHS hazards | – Number of hazards uncovered | [14,17,33,52] |
| – Number of incident reports | ||
| OHS risk estimation and evaluation | – Number of estimations and evaluations carried out and validated | [23,24,33,52] |
| Preventive and corrective actions | – Number of preventive and corrective actions recommended | [14,17,24] |
| Risk characterization or profiling | – Number of potential risks, by level of seriousness | [33,74] |
| – Number of risks per category | ||
| Disciplinary policy or program | – Number of disciplinary actions | [75,76,77] |
| Communication of OHS risks | – Number of OHS meetings | [20,33,54,59,76,78,79] |
| – Number of OHS reports communicated | ||
| Monitoring and review | – Number of re-evaluations of OHS risk management activities | [14] |
| Perception of OHS risks | – Number and frequency of inquiries into staff perception of OHS | [25,54,59,76,77] |
| OHS training | – Number of hours of training | [23,25,33,54,59] |
| Information on OHS risks | Not specified | [8,33] |
| Organizational/process changes | – Number of new organizational practices implemented | [80,81,82] |
| – Frequency of certification and audits | ||
| Prevention by design | Not specified | [83,84,85] |
| Commitment of management | Not specified | [24,59,79] |
| Worker commitment and participation | – Percent response to questionnaires | [24,59,78,86] |
| OHS-related behaviour | – Number of observations of unsafe or deviant actions | [78,87] |
| Compliance with OHS guidelines or regulations | – Number of penalties for non-compliance | [8,23,40,54,88] |
| OHS inspection | – Number of inspections carried out | [25,40,79,86] |
| Equipment and preventive maintenance | Not specified | [25,79] |
| Work setting and situations potentially at risk | Not specified | [7,8,20,24,79] |
| Evaluation of proactive indicators | Not specified | [74,79,86] |
| Technology | – Degree of integration of technology into the processes | [33,89] |
| Budget | – The amount allotted to OHS | [33,40,59] |
| Workload | – Evaluation of workload | [90] |
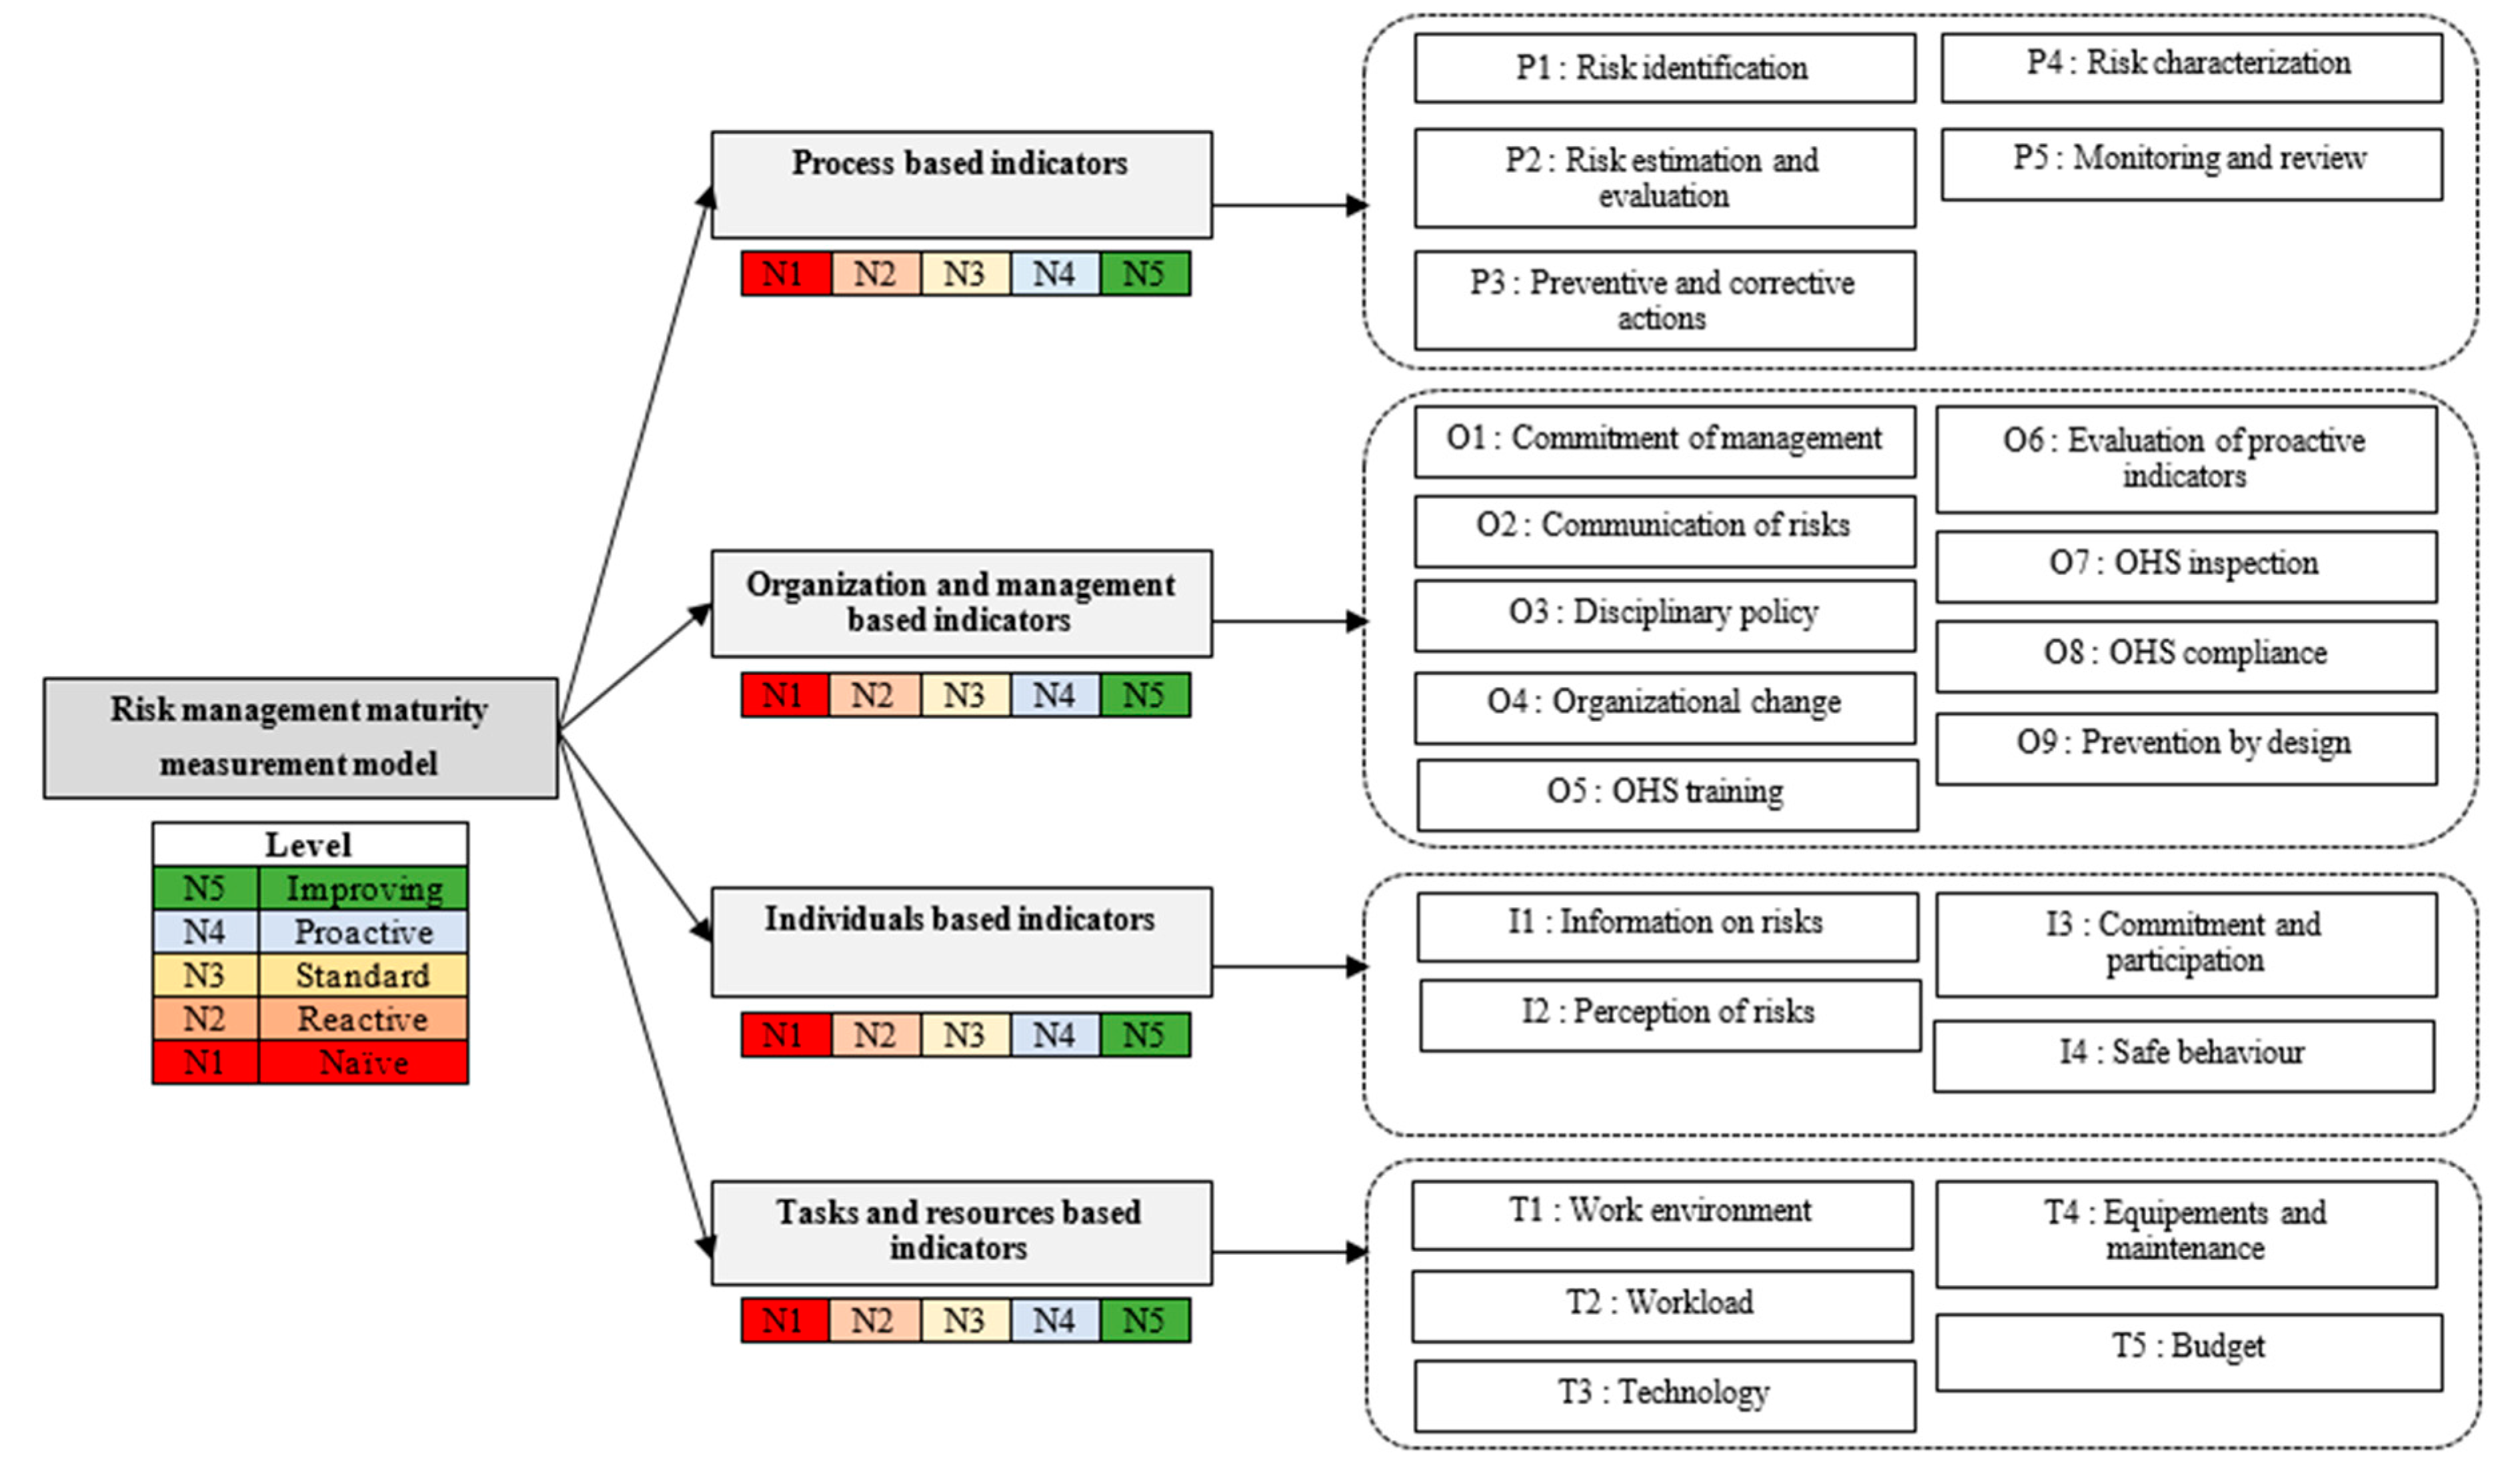
| Code | Indicator | Measurement |
|---|---|---|
| P1 | Identification of OHS risks (or hazards) | – Number of hazards identified |
| – Number of incident reports filed | ||
| – Number of inspections carried out | ||
| – Number of persons trained in hazard identification | ||
| P2 | OHS risk estimation and evaluation | – Number of estimations/evaluations carried out and validated |
| – Risks identified per level | ||
| P3 | Preventive and corrective actions | – Number of preventive and corrective actions recommended |
| – Number of preventive and corrective actions found effective (audited and validated) | ||
| – Number of preventive actions per type of hazard (e.g., closed spaces, etc.) | ||
| – Number of corrective actions prioritized per level of hazard (e.g., severe and minor) | ||
| – New number of hazards reported after implementation of preventive and corrective measures | ||
| P4 | Risk characterization | – Correlation between proactive and reactive indicators |
| – Number of potential hazards, by severity | ||
| – Number of hazards per specific category (e.g., closed spaces, heights, etc.) | ||
| P5 | Monitoring and review | – Number of new evaluations of OHS risks |
| – Effectiveness of corrective actions implemented |
| Code | Indicator | Examples of Measurement |
|---|---|---|
| O1 | Commitment of management | – Number of suggestions implemented by managers |
| – Percentage of positive OHS evaluations carried out by managers in the design phase | ||
| – Number (percentage) of managers participating in OHS meetings | ||
| O2 | Communication of risks (or hazards) | – Number and frequency of OHS meetings |
| – Number of OHS information posters | ||
| O3 | Leadership and disciplinary policy | – Number of OHS-related disciplinary actions |
| – Number of recognitions of safe behaviours | ||
| O4 | Organizational and/or process changes | – Number of new OHS organizational practices implemented |
| – Frequency of OHS audits | ||
| O5 | OHS training | – Hours of training/hours of work ratio |
| – Number of training sessions | ||
| O6 | Evaluation of proactive indicators | – Number of evaluations correlating predictive measures with OHS results |
| – Number of preventive actions for reaching OHS objectives | ||
| O7 | OHS inspection | – Number of workplace inspections |
| – Percent compliance (and/or non-compliance) with applicable regulations and standards | ||
| O8 | OHS compliance | – Number of in-house regulatory inspections |
| – Number of compliance inspections carried out by external evaluators | ||
| O9 | Prevention by design | – Number of plans or models that pass safety testing or validation |
| Code | Indicator | Examples of Measurement |
|---|---|---|
| I1 | Information on OHS risks or hazards | – Number of injuries attributable to lack of information |
| – Number of consultations of the OHS intranet by managers | ||
| I2 | Perception of OHS risks | – Number, frequency and results of surveys or questionnaires on the perception of OHS in the organization |
| I3 | Worker commitment and participation | – Number (percentage) of workers involved in OHS activities (inspection, training, etc.) |
| I4 | Safe behaviour | – Number of observations of behaviour indicating mindfulness (or lack thereof) of OHS |
| – Observed ratio of high-risk to low-risk behaviours |
| Code | Indicator | Examples of Measurement |
|---|---|---|
| T1 | Work environment, situations potentially at risk | – Number of evaluations of written procedures relating to OHS risks |
| – Number of managers trained regarding specific tasks (e.g., closed spaces, work at heights, etc.) | ||
| T2 | Workload | – Hours of overtime per week |
| – Frequency of measurement of workload | ||
| T3 | Technology | – Level of integration of risk management technology |
| – Level of integration of the technology into the processes | ||
| T4 | Equipment and preventive maintenance | – Percentage of time designated as maintenance time |
| – Number of injuries attributable to equipment failures | ||
| T5 | Budget | – Budget allotted to OHS |
| – Ratio of OHS allotment to overall budget |
| Type | Level of Maturity | Definition | |
|---|---|---|---|
| Single-loop learning | 1 | Naïve | The company learns little from its errors and is not conscientious with regard to OHS. |
| 2 | Reactive | The company learns from its errors but lacks formalized and standardized methods for managing situations at risk. | |
| 3 | Standard | The company learns from its errors and has a formalized and standardized risk management process intended to avoid repetition of problems. | |
| 4 | Proactive | The company carries out continued analysis and evaluation of OHS performance and responds in order to reduce or eliminate risks. | |
| Double-loop learning | 5 | Ameliorative | The company is continually improving its management of OHS risks. It has well-rooted OHS values, strategy, standards and methodologies in place. |
© 2018 by the authors. Licensee MDPI, Basel, Switzerland. This article is an open access article distributed under the terms and conditions of the Creative Commons Attribution (CC BY) license (http://creativecommons.org/licenses/by/4.0/).
Share and Cite
Kaassis, B.; Badri, A. Development of a Preliminary Model for Evaluating Occupational Health and Safety Risk Management Maturity in Small and Medium-Sized Enterprises. Safety 2018, 4, 5. https://doi.org/10.3390/safety4010005
Kaassis B, Badri A. Development of a Preliminary Model for Evaluating Occupational Health and Safety Risk Management Maturity in Small and Medium-Sized Enterprises. Safety. 2018; 4(1):5. https://doi.org/10.3390/safety4010005
Chicago/Turabian StyleKaassis, Bilal, and Adel Badri. 2018. "Development of a Preliminary Model for Evaluating Occupational Health and Safety Risk Management Maturity in Small and Medium-Sized Enterprises" Safety 4, no. 1: 5. https://doi.org/10.3390/safety4010005
APA StyleKaassis, B., & Badri, A. (2018). Development of a Preliminary Model for Evaluating Occupational Health and Safety Risk Management Maturity in Small and Medium-Sized Enterprises. Safety, 4(1), 5. https://doi.org/10.3390/safety4010005


