1. Introduction
Road traffic crashes remain one of the most significant global challenges, claiming approximately 1.19 million fatalities annually [
1,
2]. In the United States, 40,901 traffic fatalities were recorded in 2023, a 4.2% decrease from the prior year, yet fatal and serious injury crashes continue to impose substantial societal and economic burdens [
2]. Florida alone recorded 3331 traffic fatalities in 2023 [
3]. Arterial highways are consistently overrepresented in fatal and incapacitating injury crashes relative to their share of total vehicle miles traveled, a pattern attributable to their moderate to high operating speeds with frequent access point density and complex interaction among vehicles, pedestrians and cyclists that differentiate them from limited-access facilities. In 2024, arterial roads accounted for 61% of urban crash deaths in the United States, and 34% of urban crash deaths occurred at intersections [
4]. Understanding the factors that shape crash injury severity on these facilities is therefore an important and practically consequential area of traffic safety research, with direct implications for how transportation agencies target countermeasures and allocate safety investments.
Specifically, severe crash outcomes are closely linked to failures in driver perception and response, including delayed hazard detection, misjudged gap acceptance, and insufficient reaction to encroaching vehicles. These failures are consistent with the well-established finding that human error contributes to more than 90% of all traffic crashes [
5,
6,
7]. Addressing driver recognition and response failures through vehicle-based technological intervention has emerged as a central focus of both traffic safety policy and automotive industry investment. Advanced Driver Assistance Systems (ADAS) represent a class of in-vehicle technologies that integrate sensing, warning, and automated control functions to detect hazardous conditions and support driver response before or during a collision event [
8,
9,
10]. Commonly deployed Level 1 and Level 2 features include Automatic Emergency Braking (AEB), Forward Collision Warning (FCW), Lane Departure Warning (LDW), Lane Keeping Assist (LKA), and Blind Spot Warning (BSW). These systems were designed and validated primarily in highway and freeway operating environments, where conflicts are predominantly longitudinal and car-following is the dominant driving task; empirical evidence confirms that FCW, LDW, and BSW achieve their highest practical effectiveness on expressways and freeways [
11]. Evidence from these settings consistently demonstrates reductions in rear-end crash involvement for ADAS-equipped vehicles [
12,
13], and projections suggest that widespread deployment of Level 1–2 systems could prevent a substantial proportion of crashes and fatalities in the United States over the coming decades [
14].
Arterial highways, however, present operating conditions that differ substantially from the environments in which ADAS benefits have been most thoroughly established. Unlike limited-access freeways, arterials involve frequent signalized intersections, high access-point density, diverse turning movements, mixed-speed operations, and regular interactions with pedestrians and cyclists [
15,
16]. These characteristics generate diverse crash types such as angle, turning, and lane-departure collisions alongside rear-end events, each with distinct severity profiles and conditions for ADAS activation. Longitudinal systems such as AEB and FCW are designed for forward-axis conflict detection, and their effectiveness in the cross-path conflicts that predominate at arterial intersections may be far more limited than in rear-end scenarios [
17]. Lane-dependent systems such as LKA are further constrained by the variable pavement marking quality of arterial segments. Consistent with these constraints, the practical effectiveness of integrated ADAS varies nearly twofold across roadway facility types and falls well below idealized estimates once real-world adoption and usage are accounted for [
11,
18]. These distinctions suggest that safety benefits documented in freeway-based ADAS evaluations may not transfer directly to arterial settings; therefore, it is necessary to investigate how ADAS availability relates to injury outcomes under the complex operating conditions of arterial highways.
Despite growing interest in real-world ADAS performance, empirical evidence on injury severity outcomes conditional on crash occurrence within arterial corridor environments remains limited. The majority of severity-focused studies rely on national crash databases aggregated across diverse roadway types, which may not capture the distinct operational characteristics of arterial facilities [
19,
20]. Corridor-specific evidence linking vehicle–level ADAS identification to severity outcomes on high-volume arterials is absent from the current literature.
This study addresses these gaps using police-reported crash data from the US 98 corridor in Panama City, Florida, a principal arterial road. The analysis covers crashes reported from 2022 to 2024. Three specific research objectives are pursued. (1) identify ADAS availability for crash-involved vehicles using VIN-decoded information (2) to quantify the adjusted association between ADAS availability and crash injury severity on a defined arterial corridor while controlling for roadway characteristics, driver behaviors, vehicle characteristics, crash characteristics and environmental factors and (3) to validate the primary finding through an independent nonparametric model and a probabilistic sensitivity analysis that explicitly accounts for uncertainty in ADAS system activation status and potential unmeasured confounding. Vehicle-level ADAS information was identified through VIN decoding via the NHTSA Vehicle Product Information Catalog (vPIC) API and linked to individual crash records using unique crash report numbers as the matching key. Although system engagement at the time of crash was not directly observed, ADAS availability represents an upper bound on exposure to safety interventions and remains the metric used in regulatory evaluations and fleet-wide safety assessments. By focusing on a defined arterial corridor, the study provides empirical evidence on the injury-severity implications of ADAS availability under complex real-world arterial operating conditions. The remainder of the paper is organized as follows:
Section 2 reviews relevant prior studies, followed by the material and methods section.
Section 4 presents the results;
Section 5 discusses the findings and
Section 6 summarizes the key conclusions and directions for future research.
2. Literature Review
Advanced Driver Assistance Systems have emerged as a key technological strategy for reducing crash frequency and mitigating injury severity by supporting driver perception, decision-making, and vehicle control in complex traffic environments [
21,
22,
23]. These systems operate across different levels of automation as defined by the Society of Automotive Engineers (SAE), ranging from Level 1 (driver assistance with warning functions) to Level 5 (full automation), with most commercially available systems currently operating at Level 2 (partial automation) [
20]. Contemporary Level 1–2 automation features include AEB, LKA, ACC, FCW, and BSD, which operate by issuing warnings or applying partial automation to address common human recognition and response failures responsible for the majority of roadway crashes [
24]. The advancement of these technologies is particularly significant for arterial highways, where crashes involving multiple vehicles or vulnerable road users can result in severe outcomes. Understanding the influence of ADAS on crash severity in these specific contexts is essential for informing policy decisions, guiding manufacturers in system optimization, and ultimately advancing traffic safety objectives.
Several studies have examined the effectiveness of these technologies in reducing crash involvement, particularly rear-end collisions. Quasi-induced exposure analyses and insurance-based studies consistently report reductions in rear-end crash frequency ranging from 40% to 60% for vehicles equipped with AEB and FCW systems [
12,
13]. Simulation-based reconstructions further suggest that collision-avoidance systems may substantially reduce serious or fatal injury risk when activation occurs within appropriate speed and visibility thresholds [
25].
However, the distinction between crash avoidance and injury mitigation remains essential. While crash frequency reductions have been widely documented, fewer studies isolated injury severity conditional on crash occurrence [
19]. In-depth crash reconstructions indicate that ADAS-equipped vehicles often experience lower impact velocities even when collisions are not fully avoided, suggesting that these technologies may function primarily as injury-mitigation systems rather than complete crash-prevention mechanisms [
26,
27]. This distinction is particularly important in complex roadway environments where full crash avoidance may be less feasible.
Emerging evidence indicates that the effectiveness of ADAS is strongly context-dependent. System performance varies with environmental conditions, roadway design, and traffic complexity. Performance degradation under adverse weather such as rain, fog, and snow has been documented due to sensor occlusion and reduced detection reliability [
28]. Similarly, lane-dependent systems such as LKA are constrained by the quality and consistency of pavement markings, limiting their effectiveness in infrastructure-deficient environments [
18].
Arterial highways present particularly complex operating conditions. Unlike limited-access freeways, arterials involve frequent access points, signalized intersections, turning conflicts, and interactions with vulnerable road users [
15,
29]. These features generate diverse crash mechanisms, including rear-end, angle, and lane-departure collisions, each associated with distinct severity profiles. Although ADAS technologies targeting longitudinal and lateral control may theoretically mitigate several of these conflict types, their real-world performance is likely moderated by infrastructure compatibility and traffic density.
Empirical evaluation of ADAS safety impacts relies on multiple complementary data sources. National crash databases maintained by NHTSA, including the Fatality Analysis Reporting System (FARS) and the Crash Investigation Sampling System (CISS), provide high-quality information on crash circumstances and injury outcomes but limited insight into system activation status and pre-crash dynamics [
30]. Naturalistic driving datasets, particularly the SHRP 2 Naturalistic Driving Study, capture continuous driver behavior and vehicle kinematics, enabling identification of recognition and response failures that ADAS could plausibly mitigate [
9,
31]. Insurance claims and telematics data further supply large-scale real-world evidence on crash involvement and damage severity for ADAS-equipped vehicles, albeit with limited contextual detail [
12].
Real-world analyses of ADAS-involved crashes reveal both safety benefits and systematic limitations. Studies using NHTSA and insurance datasets indicate that ADAS-equipped vehicle crashes are disproportionately concentrated in rear-end and straight-driving scenarios, often occurring under adverse weather and low-light conditions [
28]. Recent evidence indicates that the factors associated with injury severity may vary across levels of vehicle automation. Ding et al. [
22], using random-parameters multinomial logit models, identified different severity mechanisms in crashes involving SAE level 2 ADAS and level 4 ADS vehicles, Similarly, Samadi et al. [
20], using logistic regression, random forest, support vector machines, and XGBoost, found that lighting conditions and fixed- object involvement were important predictors whose relative importance differed between ADS and ADAS-L2 crashes. In-depth crash investigations consistently show lower impact velocities and reduced injury severity when ADAS is present, even when crashes are not fully avoided, indicating partial mitigation rather than complete prevention [
26].
Huang et al. [
32] investigated rear-end collision characteristics using 130 ADS-involved and 84 ADAS-involved crashes reported to NHTSA under the Standing General Order between July 2021 and May 2022. Using binomial logistic regression models, the authors found that rear-end collisions dominated both ADS- and ADAS-involved crashes, with a higher proportion observed among ADAS-equipped vehicles. For ADAS-controlled vehicles, rear-end collision likelihood increased with the speed-gap ratio and was significantly higher on highway/freeway and rural facilities, whereas for ADS-controlled vehicles, crash occurrence was more strongly associated with the pre-crash movement of the crash partner and roadway type, suggesting fundamentally different operational and interaction mechanisms across automation levels.
Consistent with these findings, Kutela et al. [
19] evaluated injury outcomes using U.S. crash reports submitted to NHTSA and applied Bayesian network models to assess KABCO injury severity while accounting for roadway, environmental, and vehicle characteristics. Their results indicated that ADS-involved crashes were associated with approximately 12% lower probability of KA injuries and 11% lower probabilities of KABC injuries compared with Level 2 ADAS-involved crashes. Moreover, the severity benefits of ADS were found to be context-dependent, with stronger reductions on low-speed roadways and at intersections and diminished benefits under high-speed, low-visibility, and adverse surface conditions, reinforcing the role of operating environment and crash mechanisms in shaping injury outcomes.
Despite the existing literature providing valuable insight on the benefits of ADAS technologies on roadways, important gaps remain in understanding ADAS’ performance on arterial highways. Three specific gaps motivate the present study. First, empirical evaluations of ADAS safety benefits have predominantly focused on crash frequency outcomes rather than injury severity conditional on crash occurrence. Second, the majority of severity-focused studies rely on national crash databases aggregated across diverse roadway types, with limited attention to the unique operational characteristics of arterial highways. Arterial facilities differ fundamentally from limited-access freeways in terms of conflict diversity, access density, intersection frequency, and vulnerable road user exposure. Since ADAS effectiveness depends not only on technological capability but also on roadway context and crash mechanism, severity outcomes on arterial corridors require dedicated investigation. Third, there is a need for extensive studies that have systematically examined the differential association of ADAS availability with severity outcomes across the injury spectrum.
This study addresses the gaps by using police-reported crash data from 2022–2024 along a defined urban arterial corridor (US-98, Panama City, FL, USA), integrating vehicle-level ADAS availability through NHTSA VIN decoding, and modeling injury severity outcomes using multinomial logistic regression with random forest robustness validation. By focusing on severity outcomes conditional on crash occurrence, controlling roadway, environmental, behavioral, and vehicle characteristics, and explicitly testing for differential ADAS effects across severity levels, the analysis provides corridor-specific empirical evidence that extends the existing literature on ADAS safety performance.
3. Materials and Methods
3.1. Data Description
This study focuses on the US-98 corridor in Panama City, Florida, classified by the Florida Department of Transportation (FDOT) as Functional Class 14, a principal urban arterial serving major activity centers, high-traffic corridors, and longer-distance travel demand. The corridor carries up to 70,000 vehicles per day and is characterized by frequent signalized intersections, high access-point density, mixed land use, and distinct urban and rural operating segments. These characteristics produce a complex and diverse crash environment that is well-suited for examining how vehicle safety technology interacts with roadway conditions, driver behavior, and crash mechanisms to shape injury outcomes.
Crash data were obtained from Signal 4 Analytics (S4A), a web-based geospatial crash analysis platform maintained for the State of Florida by the University of Florida. S4A integrates police-reported crash records submitted through the Florida Department of Highway Safety and Motor Vehicles (FLHSMV) and provides crash-level and vehicle-level attributes for each incident. The dataset covers a three-year period from January 2022 through December 2024 and includes 24,107 crash records initially recorded along the US-98 corridor. This corridor-specific, multi-year dataset provides the sustained exposure and within-corridor variation in roadway context, environmental conditions, and fleet composition needed to detect meaningful associations between ADAS availability and injury severity outcomes.
3.2. Data Processing
3.2.1. Data Cleaning and VIN Validation
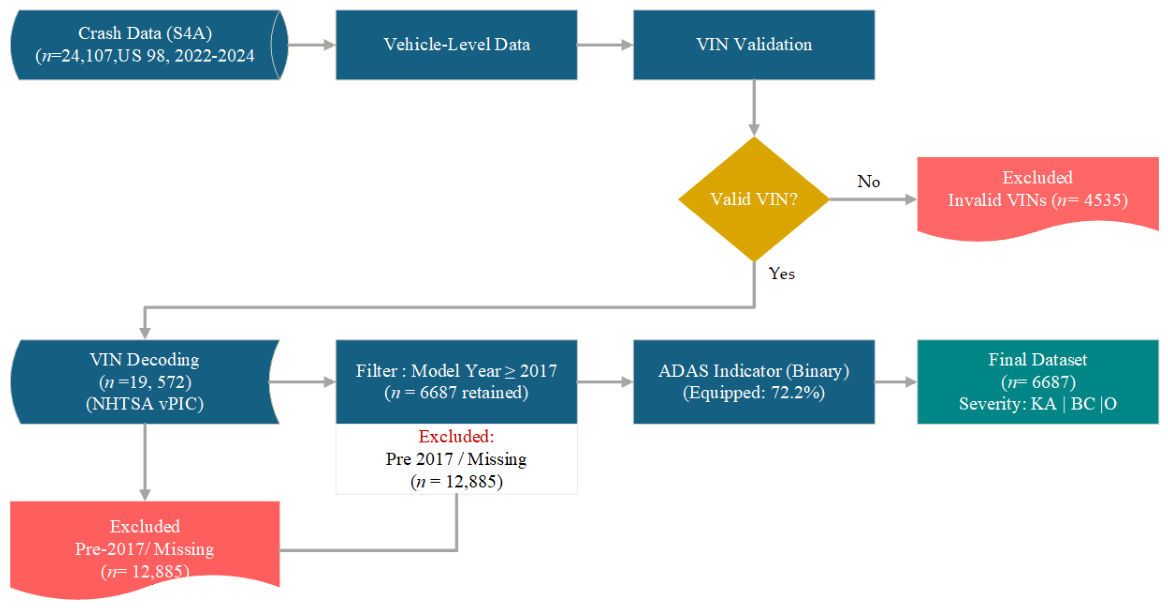
The raw dataset of 24,107 crash records was subjected to a structured cleaning protocol. Records containing duplicate entries, internal inconsistencies, or systematically missing crash-level attributes were removed. The primary criterion for inclusion in the analytical sample was the availability of a valid VIN for at least one crash-involved vehicle. VINs were validated by checking for the standard 17-character alphanumeric format and structural consistency with manufacturer position codes. Records with missing, malformed, or unverifiable VINs were excluded from all subsequent analyses. This step reduced the working dataset from 24,107 to 19,572 crash records, representing the exclusion of 4535 records (18.8%) on VIN validity grounds.
3.2.2. ADAS Feature Identification via VIN Decoding
Vehicle-level ADAS availability was identified through systematic VIN decoding using the NHTSA vPIC) database, accessed via its publicly available API. For each retained vehicle VIN, the vPIC API returned manufacturer-reported vehicle specifications, including the availability of ADAS features at the trim and configuration level. Features extracted included AEB, FCW, LDW, LKA, BSW, and ACC, among others. The returned ADAS attribute data were merged with crash records at the vehicle level using unique crash report numbers as the linking key.
A key constraint of this approach is that the ADAS feature database provides reliable coverage only for model year 2017 and later. Crash records involving vehicles manufactured prior to model year 2017 were therefore excluded, as ADAS availability could not be reliably determined for these vehicles. Following VIN decoding and this model year restriction, and after applying a complete-case protocol that removed records with missing values in any selected explanatory variable, the final analytical sample comprised 6687 crash records, which represent 27.7% of the original 24,107 records. The full data processing workflow, including sample attrition at each step, is illustrated in
Figure 1.
3.2.3. ADAS Exposure Variable Construction
Binary indicators were constructed to represent ADAS availability at the vehicle level. Separate indicators were created for the primary vehicle (Vehicle 1, or V1) and the secondary vehicle (Vehicle 2, or V2) in each crash record, as well as a composite indicator denoting whether at least one ADAS-equipped vehicle was involved in the crash. These binary variables represent ADAS availability as reported by the vehicle manufacturer at the configuration level and serve as proxy measures for ADAS exposure at the crash event. It is important to note that the vPIC database records feature presence based on vehicle specifications and do not indicate whether individual systems were enabled or actively engaged at the time of the crash. ADAS availability therefore represents an upper-bound estimate of ADAS exposure and is consistent with the exposure metric used in regulatory fleet-level safety assessments and prior observational studies of vehicle safety technology [
16].
3.3. Sample Characteristics and Descriptive Statistics
Table 1 presents the descriptive statistics of the study variables. The temporal distribution of crashes was relatively consistent across the study period, with 2470 crashes (36.9%) in 2022, 2197 crashes (32.9%) in 2023 and 2020 crashes (30.2%) in 2024. With respect to injury severity, most crashes resulted in no injury (
n = 5501; 82.3%), while moderate injury (BC) accounted for 1094 cases (16.4%) and severe injury (KA) represented 92 cases (1.4%).
Most crashes occurred during daylight (80.2%) and under clear weather conditions (78.2%). Dry road surfaces accounted for 85.9% of crashes. Approximately 75.7% of crashes occurred in urban areas, with the remaining 24.3% on rural segments. Intersection-related crashes comprised 26.1% of the sample, and speeding was recorded as a contributing factor in 1.2% of crashes. Alcohol involvement was identified in 2.9% of records.
With respect to ADAS, 82.1% of crash records involved at least one ADAS-equipped vehicle. At the vehicle level, 72.2% of primary vehicles (V1) and 63.2% of secondary vehicles (V2) were identified as ADAS-equipped. The high ADAS prevalence in the analytical sample reflects the restriction to model year 2017 and later vehicles, during which period ADAS features are commonly standard or optional equipment. This fleet composition should be considered when interpreting ADAS effect estimates and generalizing findings to the broader vehicle fleet.
3.4. Variable Specification
3.4.1. Dependent Variable
The dependent variable is crash injury severity, measured using the KABCO scale recorded in Florida police crash reports. The KABCO scale classifies crash outcomes into five categories: Fatal (K), Incapacitating Injury (A), Non-Incapacitating Injury (B), Possible Injury (C), and No Injury/Property Damage Only (O). To improve model stability and reduce category sparsity particularly in the fatal outcome category, which comprised a small proportion of the sample the five KABCO categories were collapsed into three ordered severity groups: Severe Injury (KA), combining Fatal and Incapacitating Injury outcomes; Moderate Injury (BC), combining Non-Incapacitating and Possible Injury outcomes; and Minor Injury (O), representing No Injury or Property Damage Only crashes. This three-category structure is consistent with prior crash severity modeling studies using similar data [
19,
33]. The Minor Injury category served as the reference outcome in all regression models.
3.4.2. Independent Variables
Independent variables were selected based on established crash severity theory, data availability, and prior empirical evidence, and were organized into five conceptual groups: ADAS availability, crash characteristics, environmental conditions, roadway context, and driver demographics.
ADAS availability was operationalized as a binary indicator (Yes/No) at the crash level, reflecting whether at least one crash-involved vehicle was equipped with ADAS features as identified through VIN decoding. Supplementary vehicle-level indicators for V1 and V2 were also constructed to support descriptive analysis.
Crash characteristics included the manner of collision (e.g., rear-end, angle, single-vehicle), intersection involvement (Yes/No), lane-departure involvement (Yes/No), and the presence of speeding as a contributing factor (Yes/No). These variables capture the crash mechanism and conflict geometry, which are expected to moderate both the probability of ADAS activation and the resulting injury severity.
Environmental and temporal conditions included lighting conditions (Daylight, Dark-Lighted, Dark-Not Lighted, Dusk/Dawn, and Other), weather conditions (Clear, Cloudy, Rain, Fog/Smoke, and Other), road surface condition (Dry, Wet, Other), and a binary temporal indicator distinguishing daytime from nighttime crashes. These variables characterize the operating environment at the time of the crash and are known to influence both human perception-response performance and ADAS sensor effectiveness. Roadway context was captured by a binary urban/rural location indicator, consistent with FDOT functional classification data for the US-98 corridor. This variable reflects systematic differences in posted speed limits, access density, and crash energy between the urban and rural segments of the corridor.
Driver demographics included driver age, which was discretized into four categories (≤24, 25–44, 45–64, and ≥65 years) following established binning conventions in the crash severity literature [
34,
35]. Alcohol involvement and drug involvement were included as binary behavioral indicators. Hit-and-run status and pedestrian involvement were also included to capture additional crash context factors.
3.5. Analytical Framework
This study combines MNL and RF to provide both statistical inference and predictive assessment of crash injury severity. The MNL model serves as the primary crash severity model since it does not require the assumption of normality, linearity or homoscedasticity, and the dependent variable consists of multiple discrete injury outcomes. The MNL model offers a distinct advantage in interpretability and theoretical foundation, as coefficients and odds ratios directly represent the influence of each explanatory variable on injury severity outcome [
36,
37,
38].
RF was used as a complementary model to support the MNL findings. RF can capture nonlinear relationships and interaction effects that may not be fully represented in the MNL specification. It also provides variable-importance rankings, which help evaluate whether the main predictors identified in the MNL model remain relevant under a flexible machine learning framework. Compared with more complex machine learning methods such as XGBoost, RF offers a useful balance between predictive flexibility and interpretability, making it appropriate as a supporting model rather than replacing the MNL analysis.
3.5.1. Multinomial Logistic Regression
The dependent variable Minor, Moderate, and Severe carries an inherent ordinal ranking. While Ordered Logistic Regression (OLR) is the natural candidate for an ordinal outcome, its application rests on the proportional odds assumption, which requires that the relationship between each predictor and the outcome is consistent in direction and magnitude across all severity thresholds. Formally, this assumption states that a single set of regression coefficients adequately describes the predictor–outcome relationship at every cumulative threshold of the ordinal scale. When this assumption holds, OLR is the more parsimonious choice. When it is violated, however, OLR produces biased and inconsistent parameter estimates, because it forces a single coefficient to represent relationships that differ substantially across severity levels.
The proportional odds assumption was formally tested using the Brant test [
39], which assesses whether the coefficients estimated from a series of binary logistic regressions, each collapsing the ordinal outcome at a different threshold, are statistically equivalent. The test returned significant violations (
p < 0.05) for multiple predictors in the current dataset, indicating that the parallel lines constraint is not satisfied. This finding is consistent with the broader crash severity literature, where the proportional odds assumption is frequently rejected for arterial highway data, particularly when predictors such as roadway context, lighting conditions, and vehicle characteristics are included [
40]. When proportional odds are violated, MNL is the recommended and widely adopted alternative, as it estimates separate coefficients for each outcome level relative to a reference category, placing no constraint on the predictor–severity relationship across thresholds.
Let
denote the injury severity outcome for crash i, where
= 0 represents minor injury (O),
moderate injury (BC), and
severe injury (KA). Minor injury (O) was specified as the reference category. The model is expressed as:
where
denotes the
explanatory variable for crash
,
is the intercept for outcome
, and
is the coefficient associated with predictor
for severity level
.
The probability of observing severity outcome
j ∈ {1,2} is:
Model parameters were estimated by maximum likelihood estimation (MLE) expressed in Equation (3), using iterative gradient-based numerical optimization implemented in Python. Model results are reported as Relative Risk Ratios
, where values below 1.0 indicate a reduction in relative risk of a given injury category compared to the reference, and values above 1.0 indicate an increase. Statistical significance was assessed at the α = 0.05 level.
where
is an indicator function equal to 1 if crash
results in outcome
, and 0 otherwise.
3.5.2. Random Forest as a Nonparametric Robustness Check
A Random Forest (RF) classification model was estimated as a nonparametric robustness check. RF is an ensemble learning method that constructs multiple decision trees from bootstrap samples of the data, selects a random subset of predictors at each split, and derives the final class prediction through majority voting across trees [
41]. The method can capture nonlinear relationships and interaction effects among roadway, environmental, driver, behavioral, and vehicle-related variables that may not be fully represented in a linear-in-parameters model [
20]. Permutation-based variable importance was computed using macro-averaged F1 score to account for class imbalance.
RF was selected as the machine learning method to support and validate the MNL results due to its balance of predictive flexibility, robustness, and interpretability. The model is well suited for crash severity data, which typically include mixed categorical and continuous predictors, nonlinear relationships, interaction effects, and imbalanced outcome classes [
42]. XGBoost and other boosting algorithms can also provide strong predictive performance; however, RF was selected for this study as a stable and interpretable ensemble benchmark to complement the MNL model. Additional algorithmic comparisons, including XGBoost, are recommended for future work.
3.6. Model Diagnostics and Assumption Checks
3.6.1. Multicollinearity Assessment
Multicollinearity was assessed using the Generalized Variance Inflation Factor (GVIF) following Fox and Monette [
43]. Standard VIF is defined only for predictors represented by a single coefficient; for categorical variables encoded as multiple dummy terms (Light Condition, Weather Condition, and Driver Age each contribute three columns to the design matrix), GVIF provides a single generalized collinearity measure per model term, computed from the determinants of the predictor correlation matrix. The degrees of freedom adjusted statistic GVIF
(1/(2×Df)) is directly comparable across binary and multi-level terms, with values below √5
2.24 (equivalent to the conventional VIF threshold of 5 for single-coefficient terms) indicating acceptable collinearity. For binary predictors, GVIF reduces exactly to standard VIF.
3.6.2. Independent of Irrelevant Alternative Assumption Test
The IIA assumption was assessed using the Hausman–McFadden specification test. In the MNL framework, IIA means that the odds between any two outcome categories are unaffected by the presence or absence of the third category [
37,
44]. For this study, this assumption implies that the relative odds of Severe Injury (KA) versus Minor Injury (O) should remain statistically consistent when the Moderate Injury (BC) category is excluded, and similarly for other severity-category comparisons. The test was implemented by estimating the full MNL model with all three injury severity categories and comparing it with restricted models formed by removing one severity category at a time. The Hausman–McFadden statistics were computed as
where
is the coefficient vector from the full model and
is the coefficient vector from the restricted model.
3.7. Sensitivity Analysis
3.7.1. Probabilistic Sensitivity Analysis
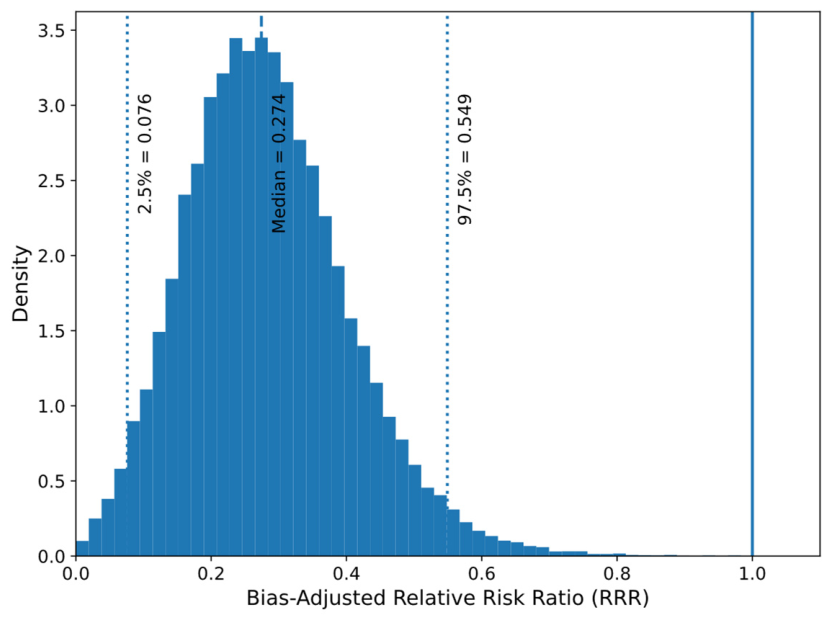
A key methodological limitation of VIN-decoded ADAS research is that feature availability, as recorded in manufacturer specifications, does not confirm system engagement at the time of the crash. To evaluate the robustness of the primary ADAS effect estimate under uncertainty in system activation, a probabilistic sensitivity analysis was conducted using Monte Carlo simulation with 50,000 iterations. Three sources of uncertainty were modeled simultaneously: (i) sampling variability in the estimated ADAS coefficient, represented by drawing from the asymptotic normal distribution defined by the MNL point estimate and its standard error; (ii) uncertainty in the probability that ADAS was actively engaged during the crash event, represented by a Beta distribution parameterized to reflect plausible real-world activation rates informed by naturalistic driving literature; and (iii) residual confounding from unobserved variables, introduced as a multiplicative bias factor applied to the engagement probability. The resulting distribution of bias-adjusted RRR was examined to assess whether the protective ADAS association persisted under conservative assumptions regarding system activation and unmeasured confounding.
3.7.2. Alternative Exposure Specification
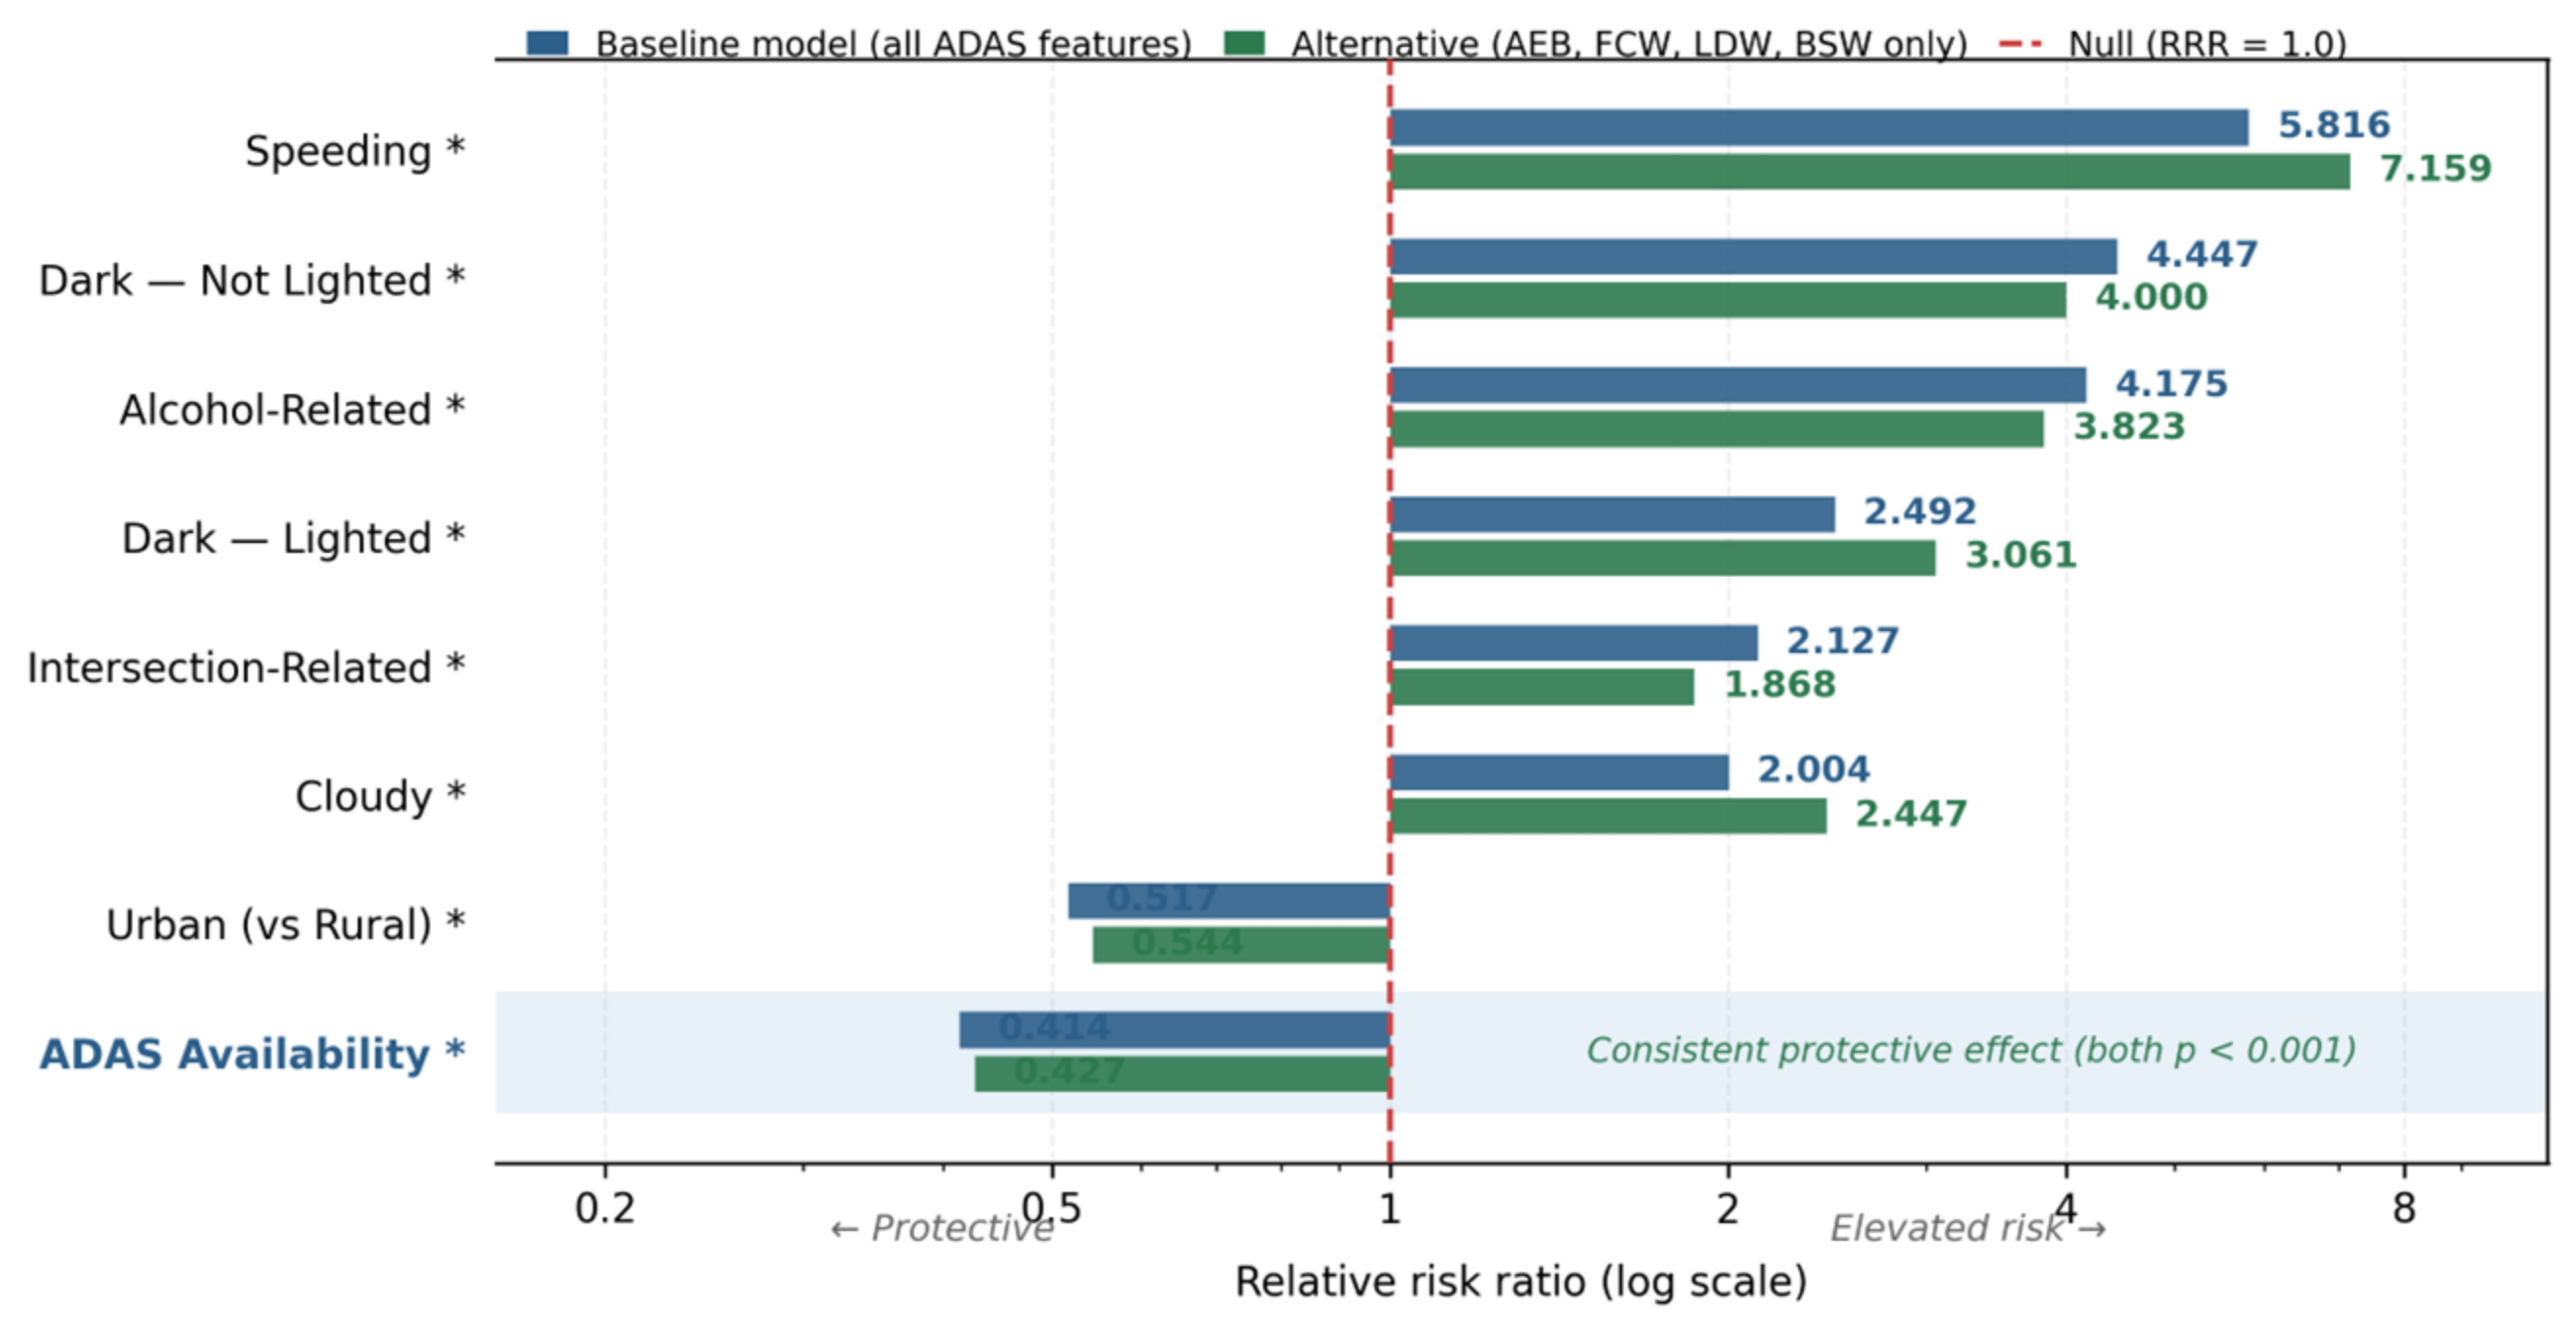
A deterministic sensitivity analysis was conducted by redefining the ADAS exposure variable to better approximate actual system activation conditions. Specifically, the analytical sample was restricted to crashes involving vehicles equipped with safety-relevant ADAS features most likely to be engaged in relevant pre-crash scenarios, namely AEB, FCW, LDW, and BSW. This subsample analysis excludes vehicles for which ADAS availability is limited to features such as ACC or parking assistance, which are unlikely to have been active in the crash scenarios recorded in the dataset. An MNL model was re-estimated on this restricted sample, and the resulting ADAS coefficient and RRR were compared with those from the baseline model to assess sensitivity to exposure definition. Directional consistency between the two specifications was taken as evidence that exposure misclassification arising from the availability-vs-activation distinction does not materially bias the primary conclusions.
All data processing, VIN decoding, variable construction, and statistical analyses were conducted in Python (version 3.13). NHTSA vPIC API queries were automated using Python’s requests library, with results stored in structured CSV format.
5. Discussion
This study extends the ADAS safety literature by examining injury severity conditional on crash occurrence within a defined arterial corridor rather than across aggregated roadway networks. That distinction matters. Arterial highways combine moderate-to-high operating speeds with dense access, turning activity, signalized control, and heterogeneous conflict types, creating operating conditions that differ fundamentally from freeway environments where many ADAS evaluations have been conducted. In addition, the study links police-reported crash records from arterial segments with vehicle-level ADAS specifications through automated VIN decoding via the NHTSA vPIC API conducted at the individual vehicle level using crash report numbers as the linking key. This approach improves upon the fleet-level ADAS approximations used in most prior large-scale studies by enabling feature-specific identification at each crash-involved vehicle, rather than assigning ADAS status based on vehicle class or manufacturer aggregate data [
20].
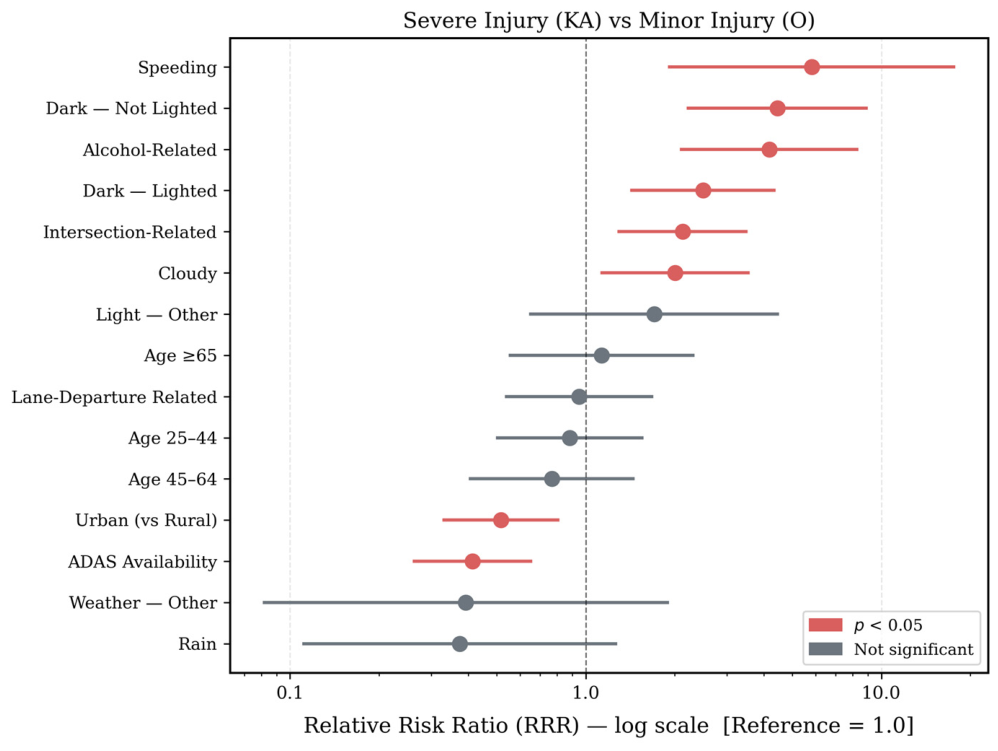
The MNL results show that speeding was the strongest behavior predictor of crashes in this study, associated with more than a sevenfold increase in relative risk of severe injury (RR = 5.816,
p < 0.001). The substantial magnitude of this effect relative to the ADAS protective safety return on ADAS may be partially constrained by the prevalence of speeding behavior. Level 1–2 AEB systems are designed primarily to address perceptual and response failures under normal driving conditions; at speeds well above posted limits, the velocity reduction achievable through automated braking may be insufficient to prevent injury escalation, even when the system activates as intended. This does not imply that ADAS offers no benefit in speeding scenarios, but rather that the margin between the speed at which AEB intervenes and the speed at which severe injury becomes probable narrows considerably at higher operating velocities [
46]. Intersection-related crashes and nighttime conditions also significantly increase severity risk, reflecting the combined effects of conflict density and reduced visibility. These findings reinforce the role of human behavior and operating conditions as primary drivers of injury outcomes, even in the presence of vehicle-based safety technologies.
The lighting and temporal findings support a similar interpretation. Nighttime conditions significantly increase injury severity in the MNL model, and dark, unlighted environments are associated with elevated moderate injury risk. These effects are likely captured more than simple visibility reduction. On arterial corridors, nighttime conditions alter driver expectancy, gap judgment, detection of turning vehicles, and recognition of conflict points. They may also affect the effective operating range of camera-dependent perception systems and the quality of lane-marking or object detection, particularly under mixed lighting environments. The persistence of strong nighttime effects in the presence of ADAS therefore suggests that current systems do not fully overcome the perceptual disadvantages inherent to low-visibility arterial operation. This finding is consistent with studies reporting context-dependent degradation of ADAS performance under low-light and adverse environmental conditions, and it reinforces the importance of roadway lighting, signing, marking quality, and access management as complementary countermeasures rather than background conditions [
19,
20].
Moreover, roadway context showed different associations across injury levels. Urban roadway context was associated with a higher likelihood of moderate injury (RRR = 1.230,
p = 0.010), but a lower likelihood of severe injury (RRR = 0.517,
p = 0.004). This pattern likely reflects the greater number of conflicts in urban arterial segments, combined with lower operating speeds relative to rural segments. This result is consistent with national crash severity patterns showing higher fatality rates in rural areas due to higher impact speeds [
47]. This pattern may reflect differences in operating speeds. Rural arterials in the study area typically have posted speed limits of 55 mph or higher, whereas urban segments are generally posted at 45 mph or lower. Higher impact energies in rural crashes likely contribute to the increased injury risk. The fatality-specific model further indicates a higher risk of fatal outcomes outside urban areas. These findings suggest that the severity-mitigating benefits associated with Level 1 and Level 2 driver assistance systems may vary by roadway context, particularly between lower-speed urban environments and higher-speed rural arterials. The results are consistent with prior studies which document a disproportionate concentration of fatal and incapacitating injuries on rural roadways despite lower traffic volumes [
47,
48].
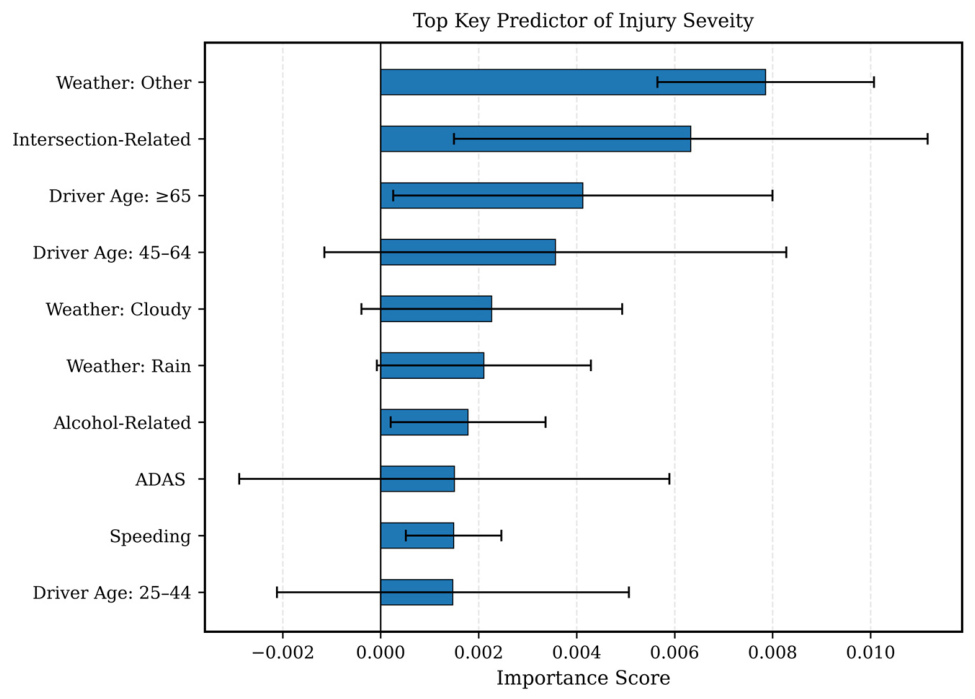
RF variable-importance results provide a complementary perspective on predictor relevance. Driver age, lighting condition, weather condition, intersection involvement, lane-departure involvement, and ADAS availability contributed to severity classification under the RF framework. Although these rankings do not indicate effect direction or statistical significance, they show that the main variables discussed from the MNL model also carried predictive information in a flexible nonparametric model. This strengthens the interpretation that injury severity on the corridor is shaped by a combination of driver, roadway, environmental, crash-mechanism, and vehicle-technology factors.
Several limitations should be considered when interpreting these findings. First, ADAS exposure was measured as feature availability based on VIN decoding, not confirmed system activation at the time of each crash. Although the probabilistic sensitivity analysis demonstrates directional stability across engagement probability assumptions, causal interpretation of the ADAS coefficient should be approached with caution. Future research incorporating event data recorder (EDR) outputs with crash records would enable analysis of confirmed system activation and stronger causal inference. Second, the restriction to model year 2017 and later vehicles inflated apparent ADAS prevalence in the sample relative to the true fleet distribution on the corridor, potentially compressing the statistical contrast between equipped and unequipped vehicle groups. Third, the binary ADAS indicator aggregates across substantial technological heterogeneity; AEB, LKA, FCW, and BSW systems have distinct operational envelopes, and their conflation into a single exposure variable may preclude attribution of the observed effect to any specific feature. Feature-level disaggregation in future studies would provide more actionable guidance for manufacturers and regulators. Fourth, the MNL model used in this study estimated fixed parameters across crash observations. This structure provides interpretable average associations between explanatory variables and injury severity outcomes, but it does not explicitly account for unobserved heterogeneity. In practice, the effects of ADAS availability, roadway context, driver behavior, lighting condition, crash mechanism, and vehicle characteristics may vary across crashes due to unobserved factors such as driver risk perception, traffic exposure, vehicle condition, ADAS system configuration, and crash dynamics [
49,
50]. More flexible modeling approaches, including random-parameter logit, mixed logit models, latent-class and other heterogeneity-aware frameworks, can address this limitation by allowing effects to vary across observations, crash context, or unobserved subgroups. Finally, the findings reflect the specific geometric, climatic, and traffic characteristics of an arterial corridor in the Florida Panhandle, and replication on corridors with different operational profiles is necessary before the magnitude of the estimated effects can be generalized. Longitudinal analysis tracking changes in ADAS penetration and corridor-level severity over time would also provide stronger quasi-experimental evidence on fleet-level safety returns.
6. Conclusions
This study evaluated the influence of ADAS on crash severity outcomes along an arterial highway corridor by integrating police-reported crash records with vehicle-level ADAS identification derived from NHTSA VIN decoding. Using a combination of multinomial logistic regression as the primary inferential model and machine learning-based classification, the study provides corridor-level evidence on how vehicle safety technology relates to injury outcomes in a complex arterial operating environment.
The results indicate that ADAS availability was associated with lower risk of severe injury (RRR = 0.414, p < 0.001), while no significant association was observed for moderate injury outcomes (RRR = 0.944, p = 0.515). This severity-selective pattern suggests that ADAS may be more strongly related to the mitigation of high-severity crash outcomes than a broad reduction across all injury categories. The absence of a significant moderate-injury association does not necessarily imply that ADAS provides no benefit at that level; rather, any protective signal for moderate injuries may be weaker, more heterogeneous, or not detectable given the available exposure measure and police-reported crash data.
The findings also show that vehicle technology operates within a broader behavioral and roadway safety system. Speeding, alcohol involvement, intersection-related crashes, dark–not-lighted conditions, and rural roadway context were each associated with elevated severe injury risk. Speeding and alcohol-related crashes produced large increases in severe injury risk, emphasizing that ADAS should be viewed as a complementary safety layer rather than a substitute for behavioral countermeasures, speed management, and roadway design improvements.
From an engineering and policy perspective, the results support an integrated safety strategy for arterial corridors. Wider ADAS technologies penetration may contribute to reducing severe injury outcomes, but its potential benefit is constrained by operating conditions such as excessive speed, impaired driving, nighttime visibility, and intersection conflict complexity. Therefore, vehicle-based safety technologies should be coordinated with infrastructure-based countermeasures, including speed management, improved lighting on unlit segments, access management, and intersection safety improvements.
Future research should prioritize linking event data recorder (EDR) activation logs with crash records to enable direct analysis of confirmed ADAS engagement, addressing the most fundamental limitation of availability-based exposure measures. Spatial analysis of crash severity clustering along the corridor, using kernel density estimation or geographically weighted regression, would identify specific intersection nodes or rural-to-urban transition zones where ADAS protection is most needed and most constrained by infrastructure incompatibility. Longitudinal analysis tracking changes in ADAS penetration and corridor-level injury severity over time would provide stronger quasi-experimental evidence on fleet-level safety returns as ADAS adoption continues to increase.