Article

The Relationship Between Safety Climate and Safety Performance in the Large-Scale Building Construction Industry in Ethiopia: A Structural Equation Model Using the NOSACQ-50 Tool

by
Teferi Abegaz
1,
Wakgari Deressa
2 and
Bente Elisabeth Moen
3,*
1
Department of Preventive Medicine, School of Public Health, Addis Ababa University, Addis Ababa P.O. Box 9086, Ethiopia
2
Departments of Epidemiology and Biostatistics, School of Public Health, Addis Ababa University, Addis Ababa P.O. Box 9086, Ethiopia
3
Centre for International Health, Department of Global Public Health and Primary Care, University of Bergen, 5021 Bergen, Norway
*
Author to whom correspondence should be addressed.
Safety 2025, 11(1), 28; https://doi.org/10.3390/safety11010028
Submission received: 1 November 2024 / Revised: 26 February 2025 / Accepted: 6 March 2025 / Published: 12 March 2025

Abstract

:
A cross-sectional study of safety climate and safety performance was performed in Ethiopian construction sites, among 1203 workers from 22 large-scale construction sites. The Nordic Safety Climate Questionnaire was administered using interviews. We developed a model to show the interrelations between safety climate and performance. This model was examined using factor analysis. Low scores for all seven safety climate dimensions were found, with values ranging from 2.33 to 3.08 and a mean of 2.70. Similarly, the mean score of the safety performance construct was 2.95 for safety participation and 3.58 for safety compliance. A strong positive correlation was found between safety climate and safety performance, and safety involvement accounted for 29.2% of the variance, while safety compliance accounted for 28.6% of the variance. The suggested association between self-reported injuries and safety climate was not confirmed. Nonetheless, Pearson correlation analysis demonstrated a statistically significant negative correlation with safety climate. In conclusion, low scores for all safety climate dimensions show that safety on construction sites must be improved. The safety climate positively influences employees’ safety behavior (safety compliance and safety participation) and minimizes occupational injuries.

1. Introduction

Construction sites in Ethiopia have experienced rapid development over the past decade. In 2018 alone, it saw an estimated growth of 16%, accounting for 12.5% of the Gross Domestic Product [1]. As the largest employment sector, it has created numerous job opportunities for unskilled, partially skilled, and skilled employees [1], with a steadily increasing demand for infrastructure.
The Ethiopian government has attracted both local and international contractors through significant investments in social housing projects [2]. Many construction companies rely heavily on an intensive labor force, which often works under challenging conditions [2]. However, the construction industry in Ethiopia generally lacks a comprehensive occupational health and safety program [3]. Health and safety are often given low priority, and inadequate information on safety gaps within the industry makes it difficult to fully understand the scope of the problem and to attract the necessary attention of policymakers [3]. According to the Labor Proclamation No. 1156/2019, the Ministry of Labour and Skills (MoLS) is the authority that shall control health and safety policy, enforcement, and development in all formal occupational settings, including the construction industry. However, construction sites do not receive sufficient attention from the MoLS [4].
Traditionally, it is perceived that most accidents and injuries result from unsafe actions of employees, a belief derived from the accident-proneness theory, which attributes accidents and injuries to individual traits and heredity [5]. However, focusing solely on individuals is no longer considered appropriate for workplace safety. Modern occupational health and safety theories consider organizational and management aspects to explain how the system functions [6].
These days, there is a growing understanding that industry-level systemic issues are the primary causes of construction accidents [7]. Numerous parties involved in construction projects influence decisions that could affect practice regarding safety among workers on building sites. The concepts of safety climate and safety performance are gaining global attention as proactive approaches [8]. Safety climate is defined as employees’ perceptions of safety in their work environment [9,10]; an effective organizational safety management system can achieve good safety performance in construction projects [11].

1.1. Safety Climate

It has become popular to measure work safety using safety climate metrics in the safety literature [12]. However, even after decades of research in this field, there remains significant uncertainty regarding the definitions and practical measurements of safety climate [13]. Some people use the terms safety climate and safety culture interchangeably [14,15], but they are distinct yet closely related concepts. “The construction safety culture initiates and maintains the construction safety climate” [16]. Safety culture at building sites represents the rules and values that help us in decision-making to make the workplace safer, whereas safety climate refers to how these rules and regulations are applied on construction sites [17]. Safety climate can be defined as follows:
(a)
A psychological phenomenon that usually refers to our current understanding of site safety;
(b)
Safety climate pays close attention to elusive issues like environmental and conditional factors;
(c)
Safety climate is a “snapshot” of safety culture and is a temporal phenomenon that is subject to change [18].
In a more comprehensive sense, safety climate is viewed as how a person experiences safety priority and the collective perceptions of employees regarding the policies, procedures, and safety practices in their work environment compared to other goals [19] (Table 1).
Researchers consider safety climate a key indicator of safety [10,20,21]; it clearly shows the policies and attitudes of employees regarding safety issues in the workplace. The use of this concept in the current literature increased significantly after the landmark study by Dov Zohar [22]. An employee’s experience and feeling of the manager’s safety attitudes is the most critical factor for the safety climate [22]. Using safety climate tools, a company can proactively assess how effectively dangers are identified and addressed in the workplace [6]. Several elements of the safety climate have been explored in previous literature [9,22,23]. These tools help organizations gauge employees’ perceptions of safety, identify potential hazards, and implement necessary improvements to enhance overall safety performance. By regularly evaluating the safety climate, companies can foster a safer work environment and reduce the likelihood of accidents and injuries.
Table 1. Summary of safety culture and safety climate definitions.
ReferencesSafety CultureSafety Climate
NORA Construction Sector Council (US) (2008) [24]Safety culture reflects the attitudes, values, and priorities of management and employees, as well as their their impact on the development, implementation, performance, oversight, and enforcement of safety and health in the workplace.Safety climate, on the other hand, is concerned with workers’ perceptions of the role of safety in the workplace and their attitudes toward safety.
CPWR (Gillen
et al. 2014) [25]
Deeply held but often unspoken safety-related beliefs, attitudes, and values interact with an organization’s systems, practices, people, and leadership to establish norms about how things are done in the organization. Safety culture is a subset of, and clearly influenced by, organizational culture. Organizations often have multiple cultures or subcultures, and this may be particularly true in construction.The shared perceptions of safety policies and procedures by workers of an organization at a given point in time,
particularly regarding the adequacy of safety and the consistency between actual conditions and espoused safety
policies and procedures. Homogeneous subgroups tend to develop shared perceptions, while between-group differences are not uncommon within an organization.
Patric et al. (2015) [26]Safety culture includes three aspects—psychological, behavioral, and corporate. The corporate dimension can be described as what the organization has, which is reflected in the organization’s policies, operating procedures, management systems, control systems, communication flows, and workflow systems. The psychological dimension is about how people feel and think about safety and safety management systems.The psychological dimension of safety culture actually refers to the safety climate of the organization, which encompasses the attitudes and perceptions of individuals and groups toward safety. This shows that safety climate is, in fact, part of safety culture.
NRC (2018) [27]The core values and behaviors result from a collective commitment by leaders and individuals to emphasize safety over
competing goals to ensure the protection of people and the environment.
-
Berglund et al. (2023) [28]Safety culture is the product of individual and group behaviors, attitudes, norms, and values, as well as perceptions and thoughts, that determine the commitment to, and style and proficiency of, an organization’s system and how its personnel act in terms of the company’s ongoing safety performance within construction site environments.-
Al-Bayati et al. (2024) [29]Construction safety culture is the collective behavior of upper management and safety personnel who establish the overarching safety policies and principles that shape the safety decision-making process and its resulting outcomes.The construction safety climate is the conduct exhibited by frontline supervisors and field workers, which serves as a visible manifestation of the organization’s safety culture.

1.2. Safety Performance

Traditionally, safety performance has been evaluated using accident and injury data; however, these methods are inadequate as they do not identify dangerous behaviors. A comprehensive framework that encompasses safety behavior and safety outcome elements has recently been proposed for calculating safety performance metrics [30].
Safety behaviors are the actual actions of individuals that can be observed at the worksite [31]. They are characterized by safety participation and safety compliance [19,32] and have been extensively used in recent safety literature [33,34,35]. Safety participation is a voluntary action that primarily enhances workplace safety rather than personal safety and involves behavior beyond the employee’s formal role [36]. Safety compliance, on the other hand, refers to the fundamental and required procedures that employees must follow to ensure minimum workplace safety. Safety compliance includes wearing personal protective equipment and adhering to safety rules and procedures [37]. In general, participation in safety procedures is voluntary, but compliance with safety procedures is mandatory [30].
There is little evidence of the Ethiopian construction industry’s safety performance in relation to health and safety management practices [3]. Existing studies adopt a reactive methodology, measuring work-related accidents based on their immediate causes [38,39]. Therefore, exploring existing health and safety management practices using the concepts of safety climate and the safety performance framework is imperative for effectively managing weaknesses in the system and their implications [8]. The main aim of this study is to examine the relationship between the dimensions of safety climate and safety performance in large-scale construction sites in Ethiopia.

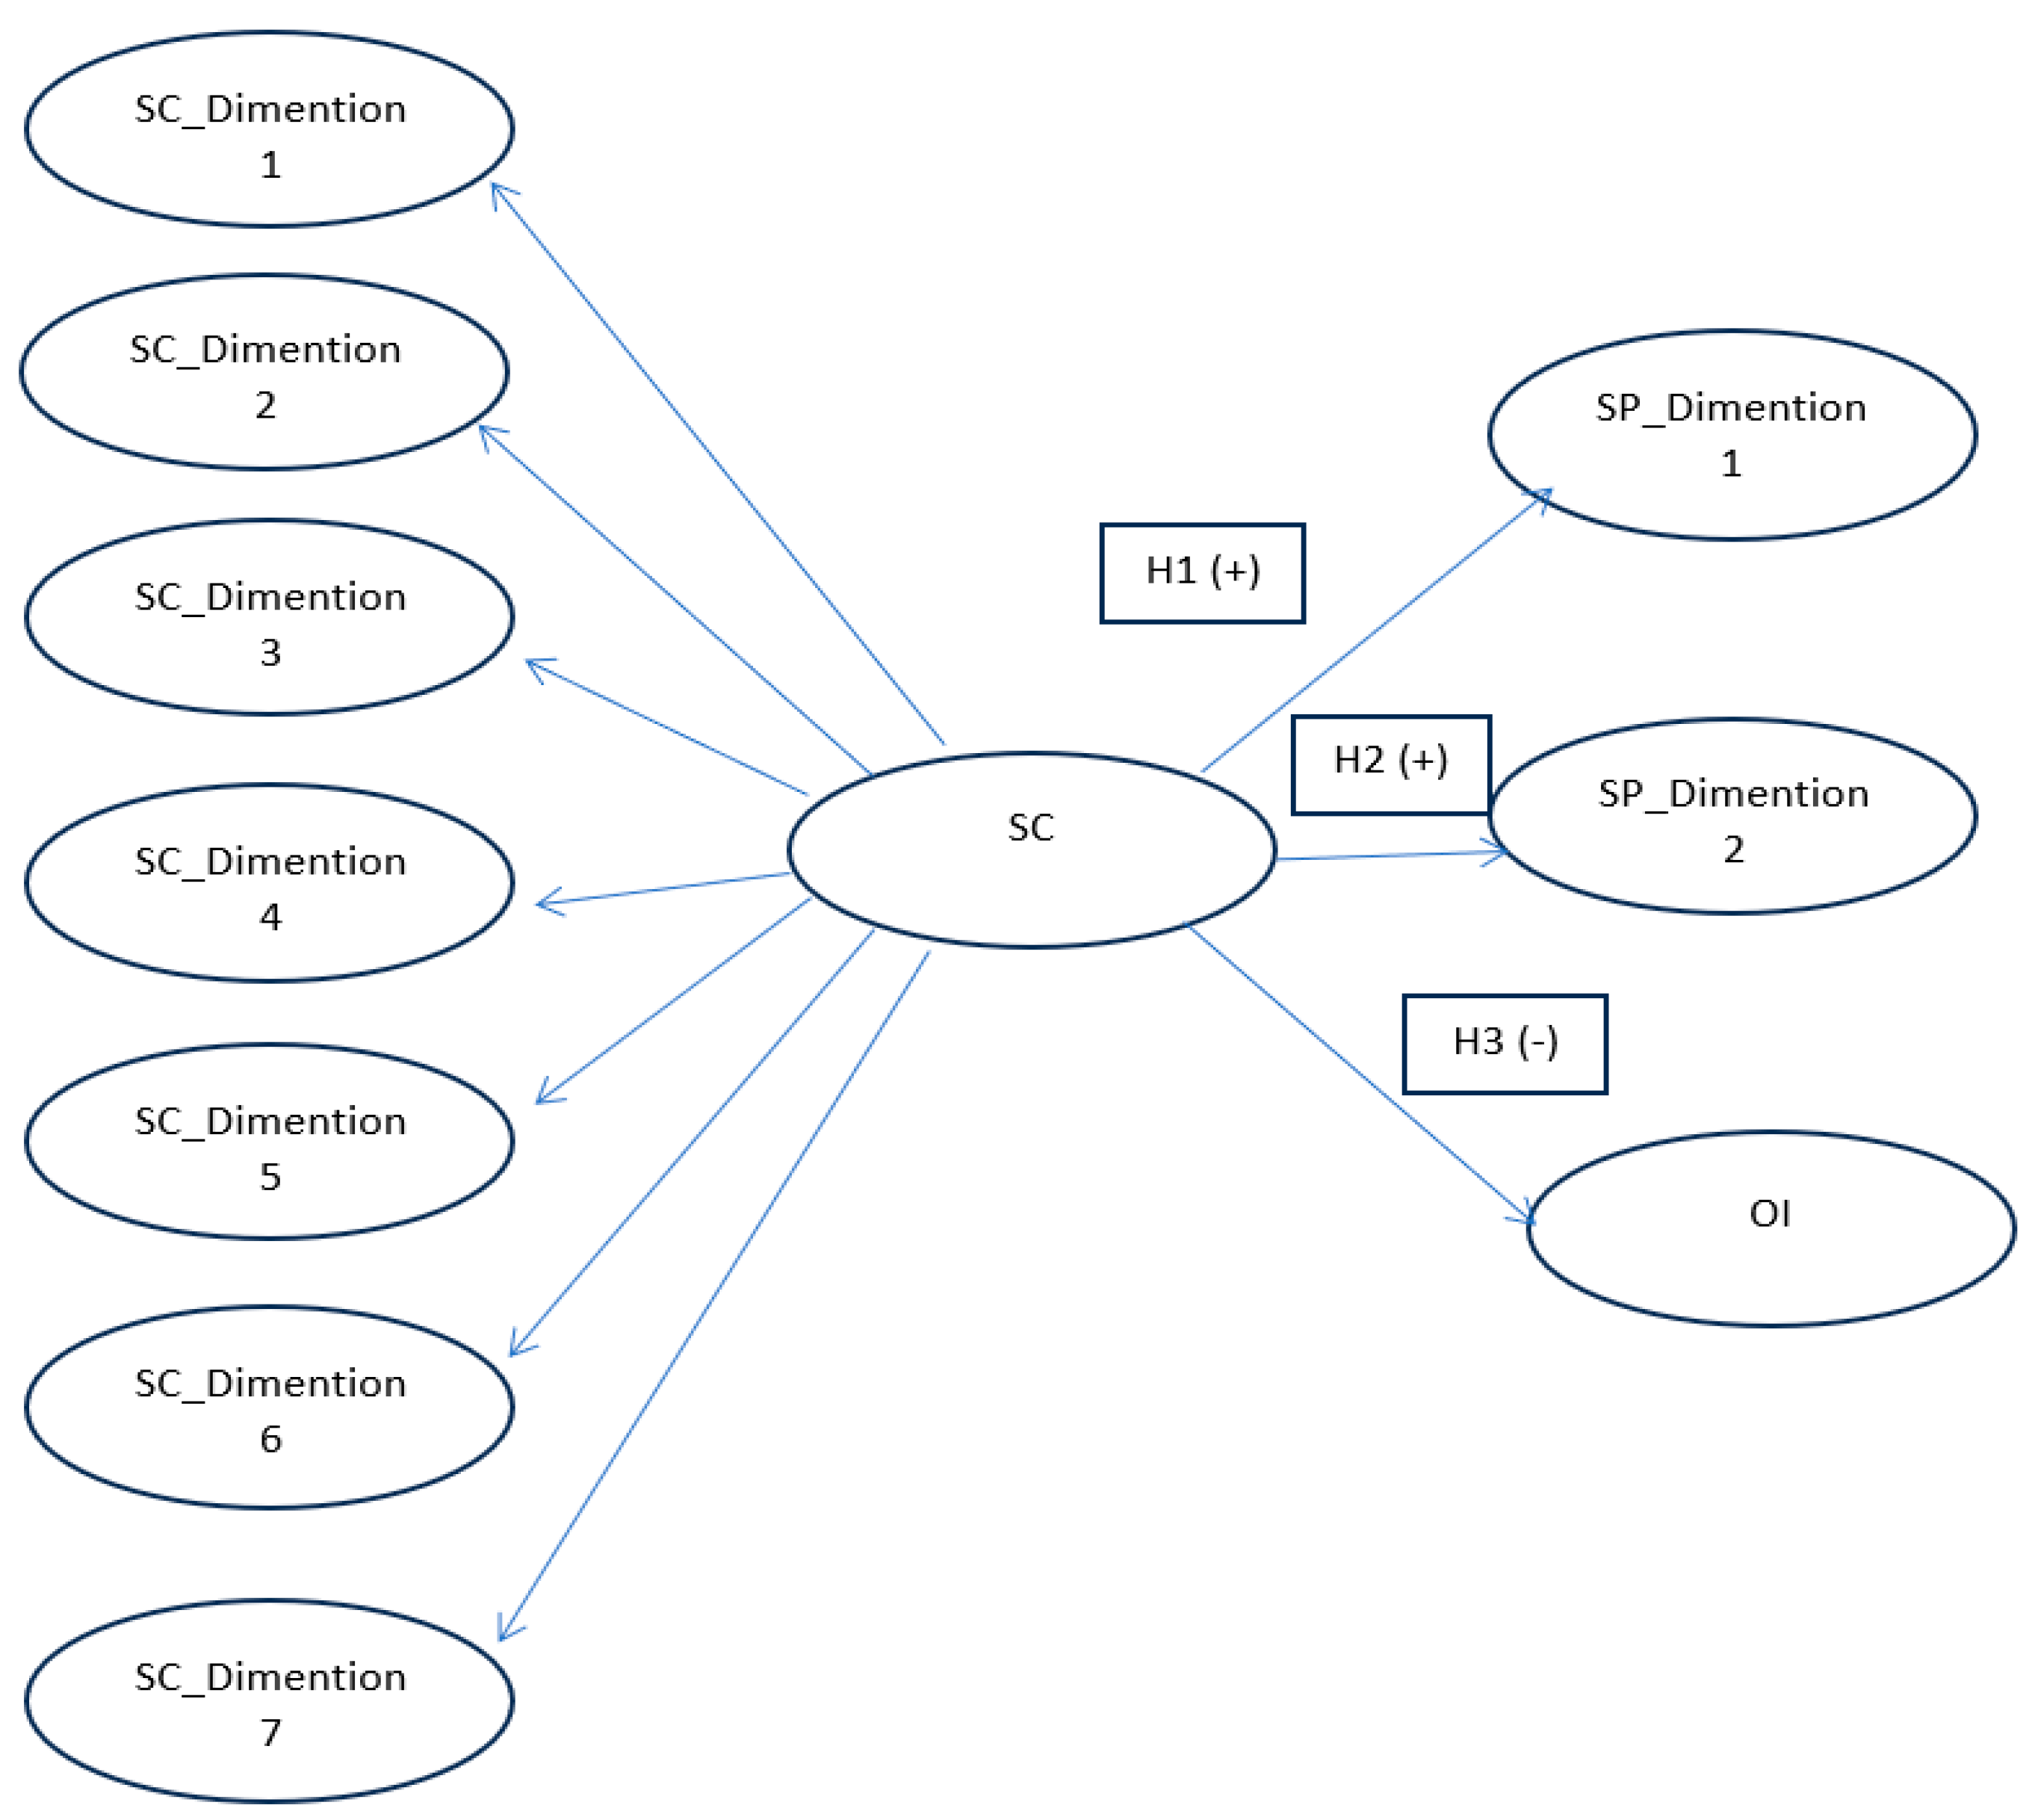
1.3. Research Hypothesis

The safety literature has long recognized the link between safety performance and safety climate. The better the safety climate, the higher the safety performance (safety participation and safety compliance) [34,36,37]. When safety perceptions are more favorable, employees are less likely to take risks and have a lower chance of injury [34,36]. However, this is not so evident in low-income settings, and the aim of this study was to determine such relations in the Ethiopian construction industry.
Hypothesis-1 (H01).
Safety climate has a significant positive relationship with safety participation (Safety performance, dimension 1) in the construction industry in Ethiopia.
Hypothesis-2 (H02).
Safety climate has a significant positive relationship with safety compliance (Safety performance, dimension 2) in the construction industry in Ethiopia.
Hypothesis-3 (H03).
Safety climate has a significant negative relationship with self-reported accidents/injuries (Safety performance, dimension 3) in the construction industry in Ethiopia.
The hypotheses are illustrated in Figure 1.

2. Materials and Methods

2.1. Questionnaire Design

So far, different safety climate tools have been developed and implemented in the safety literature. These include the Nordic Safety Climate Questionnaire (NOSACQ-50) [9], Zohar’s safety climate tools used in the safety climate factor model [40], the UK’s Health and Safety Executive (HSE) safety climate questionnaire [41], a 38-item multi-level safety climate scale [42], Safety Climate Index (SCI) survey developed by the Occupational Safety and Health Council (OSHC) of Hong Kong (Hon 2014), and six dimensions of safety climate based on Zou and Sunindijo’s framework [26].
Although various options for safety climate questionnaires are available in the literature, in this study, we considered the Nordic Safety Climate Questionnaire (NOSACQ-50). This is because of different reasons: The validity of the NOSACQ-50 questionnaire has been well tested by numerous researchers in different countries and contexts [9,43,44,45]. It has been translated into more than 25 languages, including Amharic [46]. More importantly, the NOSACQ-50 safety climate questionnaire was developed primarily for the construction industry (Table 2). Therefore, the NOSACQ-50 questionnaire was considered an appropriate instrument to measure the occupational safety climate of the large-scale building construction sector in Ethiopia. It is suitable for assessing the safety climate status and evaluating the effect of safety climate interventions [9].
In the questionnaire, there are 7 safety climate dimensions, comprising a total of 50 items. Of these, 22 items evaluate safety at the management level, and 28 items evaluate it at the worker’s level. Dimension_1: Management safety priority and commitment (9 items) indicates workers’ perceptions of the commitment of their managers toward safety in order to reward and promote safety at work. Dimension_2: Management safety empowerment (7 items) measures employees’ perceptions of management empowerment and support for their involvement in safety decision-making. Dimension_3: Management safety justice (6 items) determines the fairness with which workers feel their management handles employees involved in accidents. Dimension_4: Workers’ safety commitment (6 items) assesses how employees react to workplace safety by showing a commitment to safety, actively promoting safety, and being aware of one another’s safety. Dimension_5: Workers’ safety priority and risk non-acceptance (7 items) is used to evaluate the extent to which employees put safety before productivity objectives and avoid dangerous situations. Dimension_6: Workers’ safety communication, learning, and trust in co-workers’ safety competence (8 items) measures how workers trust each other and communicate safety matters. Dimension_7: Workers’ trust in the efficacy of safety systems (7 items) evaluates how workers assess their safety systems.
According to the NOSACQ-50 guidelines for evaluating subjects’ agreement, each item had a four-point scale ranging from 1 (strongly disagree), 2 (disagree), and 3 (agree) to 4 (strongly agree). Reversed scaling is also indicated as follows: 4 (strongly disagree), 3 (disagree), 2 (agree), and 1 (strongly agree). The mean score of each dimension is interpreted as follows: If the mean score is greater than 3.3, it is at a good level, and the companies should maintain this level and continue current practices. If the score falls between 3 and 3.3, it is a reasonably acceptable level, requiring just a little improvement. A score ranging from 2.7 to 2.99 suggests a need for improvement. Finally, if the average score is less than 2.7, this indicates a low level, and significant improvements are required [51].
The safety performance items adopted from previous studies include safety compliance (SP_Dimension 1), safety participation (SP_Dimension 2), and occupational injuries (OIs) [52,53]. In this study, twelve items were considered to measure safety performance. Of those, five items were used to measure the respondents’ level of participation in safety activities. Three of them were taken from Neal and Griffen [37], namely “I put in extra effort to improve the safety of the workplace”, “I promote the safety program within the organization”, and “I voluntarily carry out tasks or activities that help to improve workplace safety”. Additionally, two items were taken from De Armond et al. [30]: “I speak up and encourage others to get involved in safety issues” and” I attend non-mandatory safety-orientated training”.
On the other hand, four items were used to measure the level of safety compliance. Three items were taken from Neal and Griffen [37], which were “I use all the necessary safety equipment to do my job”, “I use the correct safety procedures for carrying out my job”, and “I ensure the highest levels of safety when I carry out my job”, and one item was taken from De Armond et al. [30]: “I appropriately report injuries, accidents, or illnesses”. A five-point Likert scale was adopted to measure the response to each item from 1 to 5, in terms of strongly disagree, disagree, neutral, agree, and strongly agree, respectively.
Three questions were added to assess the respondents’ self-reported injuries in the last 12 months, which include injuries without absence from work, injuries requiring less than three days’ absence from work, and injuries requiring more than three days’ absence from work [33,34]. These questions featured a 5-point ordinal scale (0 = Never; 1 = 1 time; 2 = 2–3 times; 3 = 4–5 times; 4 = Over 5 times).

2.2. Study Design and Population

A cross-sectional design was employed in 22 randomly selected large-scale construction sites operated in 5 cities in Ethiopia. A two-stage sampling approach was employed. First, construction sites were selected, and then individual participants were selected. Based on the total number of construction sites in the region, representative sites were taken proportionally from each region. Of the 121 construction sites, 22 were selected (12 from Addis Ababa city, 5 from Oromia Regional State, 3 from Amhara Regional State, and 2 from Sidama Regional State). Based on the worker lists detailing their respective departments obtained from the companies (sampling frame), study participants were chosen using a proportional-to-the-size approach. In total, there were 1203 individual workers, including site managers, safety engineers, supervisors, and all other front-line construction workers.

2.3. Data Collection

Survey data were collected through the administration of structured questionnaires during a face-to-face interview conducted by a data collector visiting the workplace. A questionnaire template was loaded onto each data collector’s smartphone with an Open Data Kit (ODK); a total of 20 experienced data collectors were involved in the data collection process. Each interview session took on average 15 to 20 min. The interview process was carried out in a private setting; no personal identification was recorded, and the information they provided was kept confidential. A data collection manual was developed, and training was given for two days including a practical demonstration. In the manual, a detailed description of the survey questionnaire was presented with an adequate explanation of each question to avoid ambiguity in interpretation in the questionnaire during the interview process.

2.4. Statistics and Data Analysis

The statistical data from the survey were examined using SPSS version 23 software. The data were screened for missing information, outliers, and coding problems. Since ODK standard software was used to obtain the data, none of it could be recognized. The data’s normality was checked using the Shapiro–Wilk normality test. The absolute kurtosis and skewness values were less than 62, indicating normality. Descriptive analysis was performed to calculate the mean and standard deviation and compare the values with the NOSACQ-50 grand database, which is the data archive collected globally using the NOSACQ-50 safety climate tool in different occupational settings. For comparison purposes, we grouped study participants into two management groups (site managers, safety engineers, and supervisors), and all the front-line skilled and non-skilled workers were categorized as workgroups. The final analysis was performed using SPSS Amos version 23 software, the preferred tool for model specification and prediction, in three steps by using explanatory factor analysis (EFA), confirmatory factor analysis (CFA), and structural equation modeling (SEM) techniques [54,55].
Explanatory factor analysis (EFA) was used to identify the factor structure of safety climate dimensions. Before EFA, the Kaiser–Mayer–Olkin (KMO) measure of sampling adequacy was determined, and Bartlett’s test of sphericity was conducted to evaluate the appropriateness of using the EFA method. The maximum likelihood technique with Promax rotation was employed to verify that the observed variables met the reliability and validity requirements. This technique is suggested when fitting a CFA is of interest to the researcher. Promax rotation was used because the data sample was sufficiently large (N = 1203).
Then, using a set of observable variables to assess covariance, CFA was used to construct and configure one or more theoretical models of dimensions. Each theoretical model suggests a set of latent variables.
Finally, to evaluate the hypothesized relationships between the latent and observed variables, structural equation modeling (SEM) was employed, which is a multivariate technique that allows for the estimation of multiple equations at the same time. SEM is a statistical modeling method that can also control independent and dependent variables, explaining all the proposed relationships.
The SEM model was tested in two stages to verify the measurement and structural models. The internal validity and reliability of the model were assessed using the average variance extracted (AVE) and construct reliability (CR). An AVE value over 0.50 and a CR value over 0.70 suggest good validity and reliability, respectively [56]. Because of the model’s complexity, internal validity and reliability were assessed first within every construct and then in an aggregated measurement model. For model evaluation, several frequently used fit indices were adopted, including the ratio of model chi-square to the degrees of freedom (_2/df), root mean square of approximation (RMSEA), goodness-of-fit (GFI), adjusted goodness-of-fit (AGFI), Tucker–Lewis’s index (TLI), and comparative fit index (CFI). A _2/df value less than 5 indicates an acceptable model fit to the data. RMSEA values of less than 0.05 indicate a good fit, and values ranging from 0.05 to 0.08 are acceptable. GFI, AGFI, TLI, and CFI values range from 0 to 1, where values over 0.80 indicate an acceptable model fit to the data.

3. Results

3.1. Socio-Demographic and Personal Characteristics of Participants

Out of a total of 1250 participants approached during the data collection, we received responses from 1203 participants for a response rate of 96.2%. As shown in Table 3, of the 1203 respondents, workgroups represented more than three-quarters (80.7%), and the rest (19.3%) were management groups. More than half (56%) were in the age range of 25 to 34 years. The majority of the participants, (88%) were male. A third (32%) of the participants had an educational status below secondary education. The majority (91%) of the participants had not participated in any formal safety training in the past year.

3.2. Descriptive Results of Safety Climate and Safety Performance

The mean, standard deviation, and reliability of the safety climate and safety performance factors were calculated (Table 4). The reliability of the safety climate items was calculated for each safety climate dimension, and the Cronbach’s alpha coefficient ranged from 0.75 for workers’ safety communication, learning, and trust in co-workers’ safety competency (Dim_6) to 0.91 for management safety priority and commitment (Dim_1). All of these were above the minimum recommended value of 0.7. The mean and standard deviation for all safety climate dimensions were 2.70 + 0.332. The lowest mean (2.33) and highest standard deviation (0.578) were among the management safety empowerment dimension. Among the safety performance dimensions, the mean score for safety compliance (3.58) was higher than for safety participation (2.95). However, the standard deviation was higher (0.970) for safety participation than for safety compliance (0.697). The mean value for occupational injuries was 0.45.
The Pearson correlation illustrated in Table 4 shows that the correlations among safety climate factors were statistically significant. Except for one dimension (“workers’ trust in the efficacy of safety systems” (SC Dimension 7)), all the safety climate dimensions were positively correlated with safety behavior (safety participation than safety compliance) and negatively correlated with occupational injuries.
The values of Cronbach’s coefficient alpha for all seven SC factors (Dim_1, Dim_2, Dim_3, Dim_4, Dim_5, Dim_6, and Dim_7) and three safety performance factors (SP_1, SP_2, and OI) were above the threshold of 0.7.
The mean and standard deviation of the safety climate scores varied among work and management groups (Table 5). A slightly larger value was reported among the management group compared with the workgroup. The mean value for safety climate items among both groups was below that of the grand database. According to the NOSACQ-50 interpretation guidelines, management safety priority and commitment (2.54), workers’ safety priority and risk non-acceptance (2.52), and management safety empowerment (2.33) were below the recommended minimum cutoff point.

3.3. Data Preparation for CFA

A KMO range of 0.60 and above is required to fit a high-quality measurement model [55]. The KMO value of 0.947 in this study suggests an excellent degree of sampling adequacy. Similarly, according to Bartlett’s test of sphericity, the minimum criterion for significant values for each of the constructs (p < 0.05) is acceptable. In the current study, Bartlett’s test of sphericity was significant (p < 0.000), indicating that the data were appropriate for factor analysis (Table 6).
During EFA, items with low commonalities (less than 0.40) were recommended to be omitted from further analysis. Therefore, the following variables were removed from the model: SCI_29, SPI_30, SPI_31, SPI_34, SPI_36, SPI_37, SPI_38, SPI_44, SPI_45, SPI_50, SPI_6, SPI_9, OI_1, OI_2, and OI_3. Furthermore, CFA allows factor loadings of 0.5 and higher. Accordingly, the following items were eliminated due to lower values: SCI_10, SCI_11, SCI_14, SCI_39, SCI_40, SCI_18, SCI_21, SCI_32, SPI_33, and SCI_35. Hence, 30 out of 50 safety climate indicators (SCIs) and 6 out of 9 safety performance indicators (SPIs) were considered in the CFA model. Since none of the three indicators measuring the accident/injury rate met the minimal requirements, they were omitted from the model.
Finally, an acceptable level of cumulative variance of 70.3% was obtained by fitting the model using the eight-factor structure that was created above the eigenvalue of one. The results of the EFA of SC factors were tabulated (Table S1). The indicator variables achieved the intended commonalities, and factor loadings were considered for the next analysis stage (Figure S1).

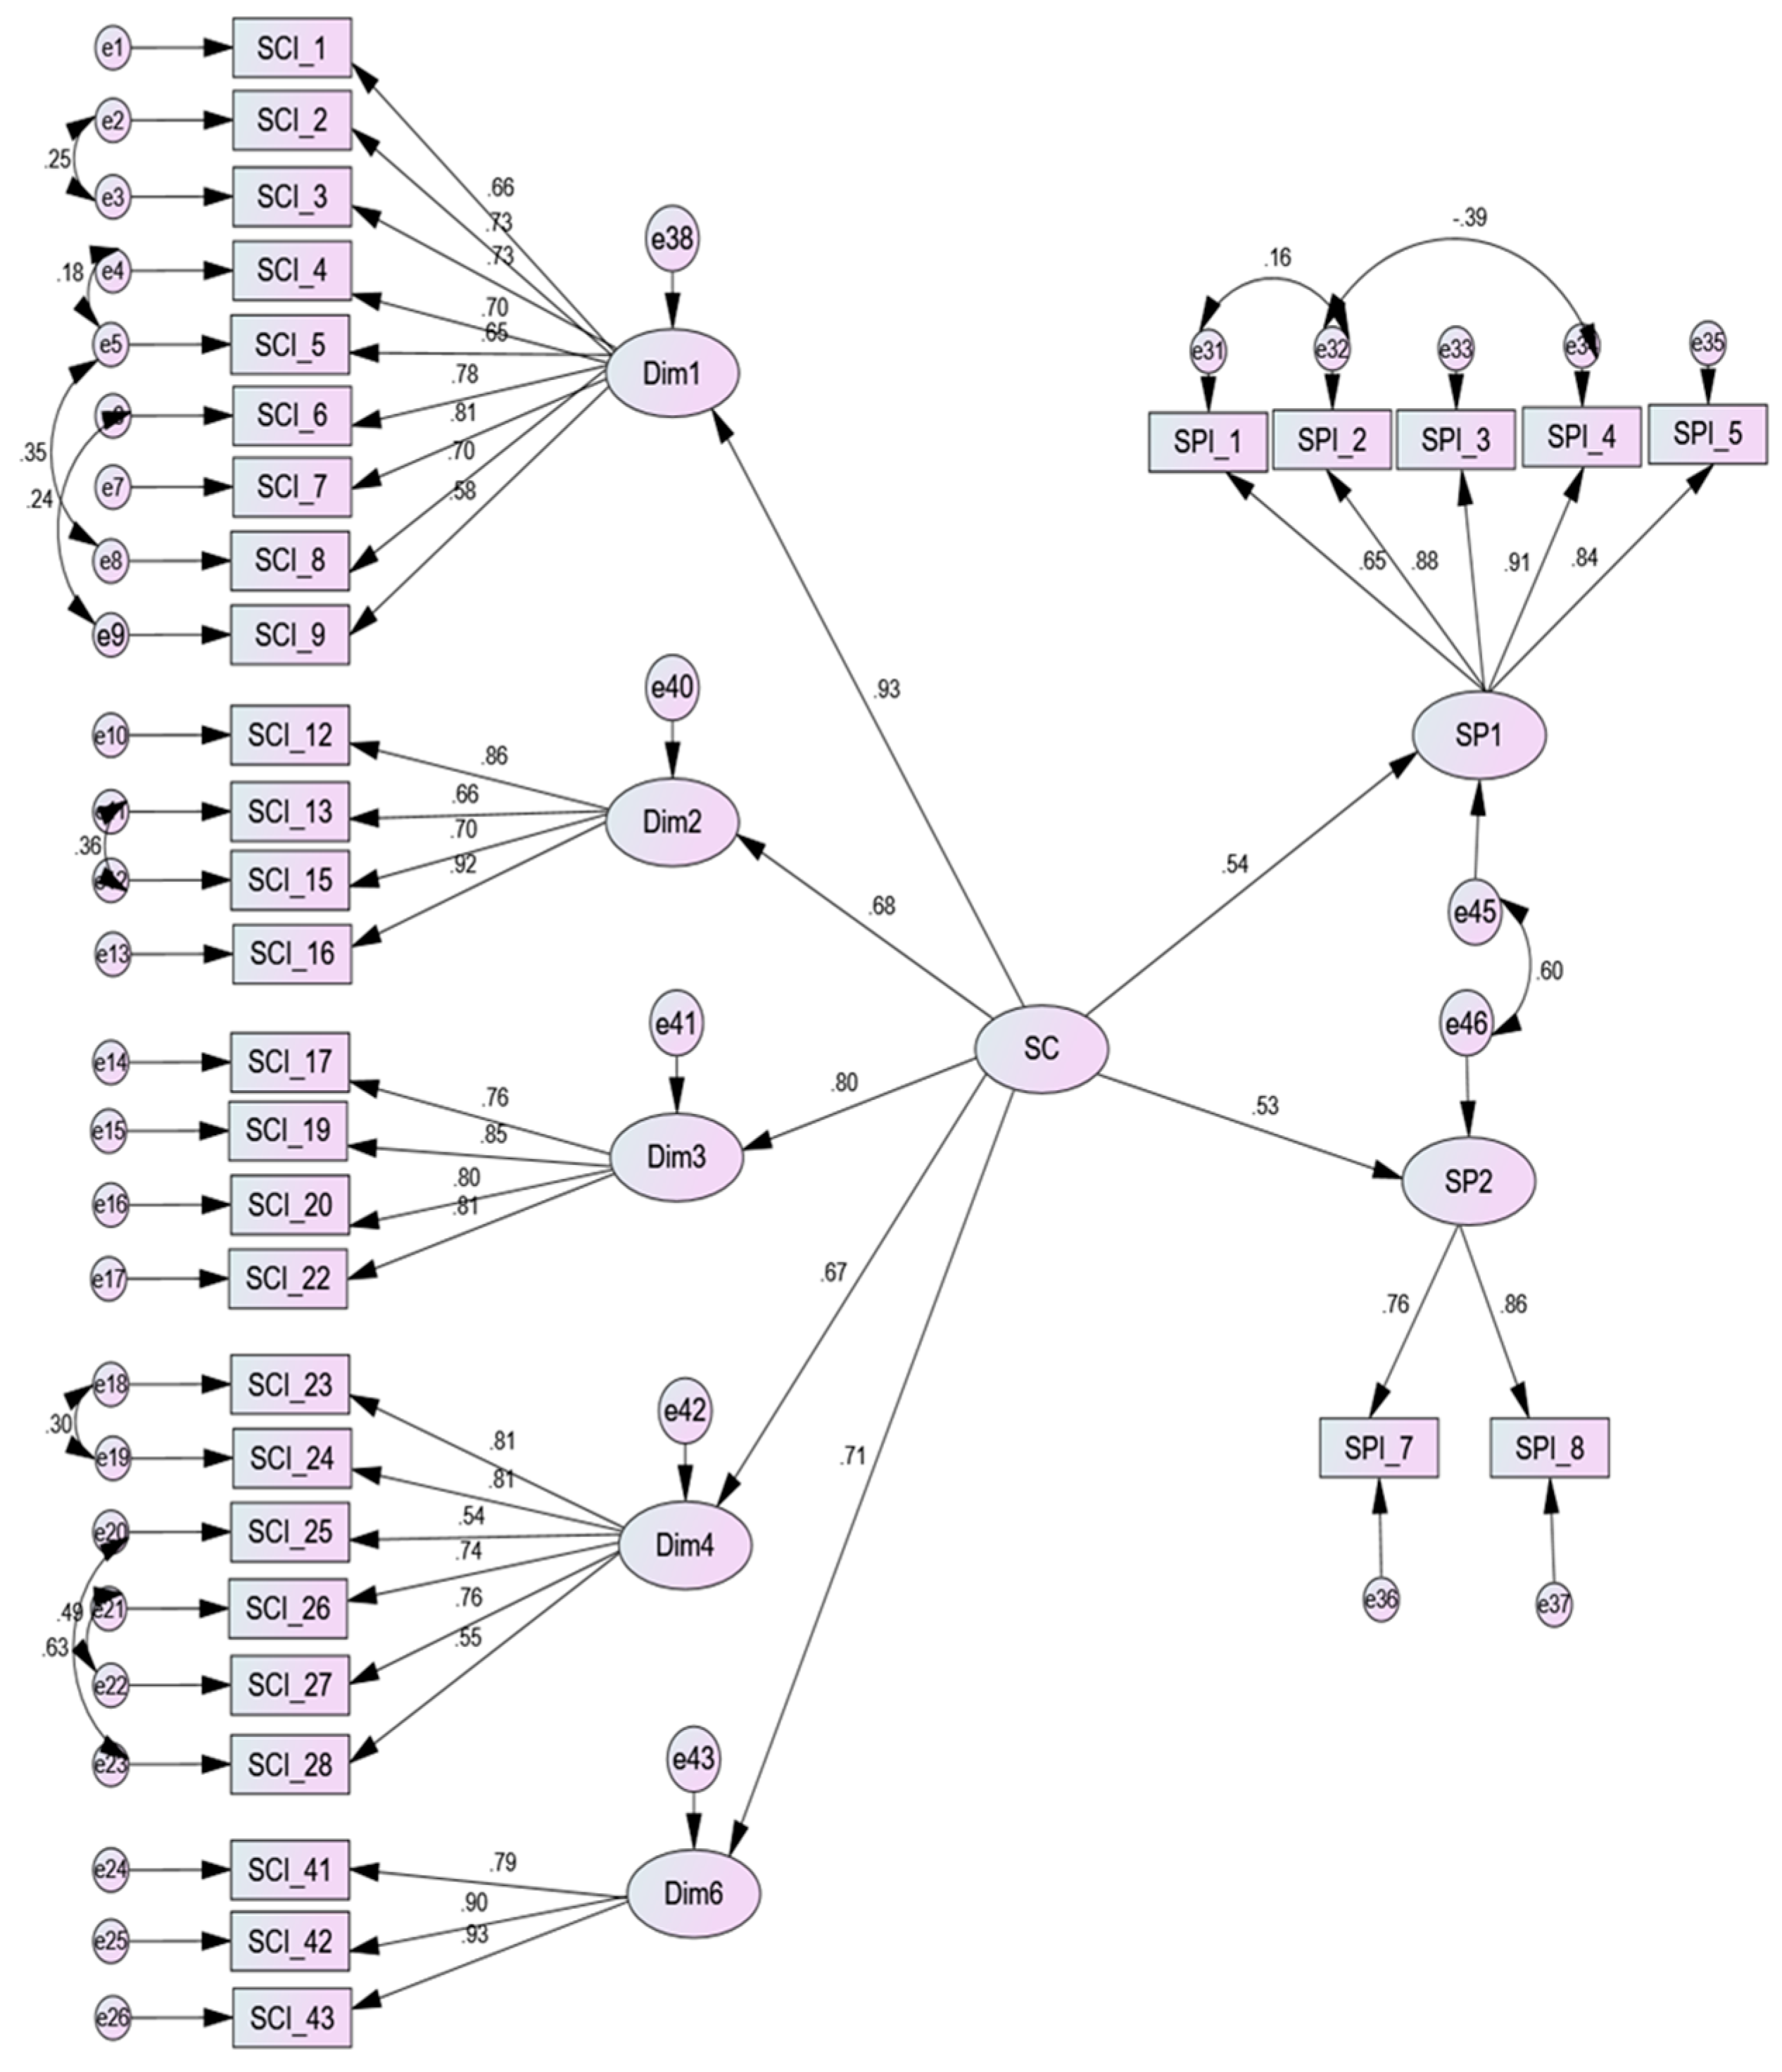
3.4. Model Evaluation Using CFA

The measurement quality and appropriateness of the suggested structural model were evaluated using CFA. Initially, a total of 8 latent constructs (dimensions) and 37 indicators among the 1203 verified samples were included in the analysis. However, due to a model validation issue, one safety climate dimension (Dim7) was removed from the final model as its Average Explained Variance (AEV) was below the recommended value of 0.5. Hence, in the final model, a total of 33 items in five safety climate (SC) dimensions and 7 items from the safety performance (SP) dimension were fitted using CFA.
Standard linear SEM was fitted using a maximum likelihood estimator because it is thought that the latent endogenous variables, latent exogenous variables, observed endogenous variables, and observed exogenous variables are all jointly distributed normally with a mean and variance matrix. Figure 2 shows the structural and measurement models. Almost all of the pathways between the first-order latent variables and the corresponding observed variables were significant according to a thorough examination of the measurement models, as they reached the desired values of standardized path coefficients (>0.5). Additionally, it was found that the two indicators of SP (SP1 and SP2) were strongly influenced by each of the five first-order latent variables of SC (Dim1, Dim2, Dim3, Dim4, and Dim6). Dim4_1 and Dim4_2 were combined and renamed to Dim4 in the CFA model since they were originally classified under the same dimension, while in the EFA model, they were considered separately. The parameter estimates and model fitness were unaffected by the merging process.
As indicated in Table 7 and Figure 2, all the loadings were above the minimum recommended value of 0.5 and squared multiple correlations (>0.25). All of them were statistically significant at a p-value <0.001.
As indicated in Figure 2, among the five safety climate dimensions retained in the final model, management safety priority and commitment explain the safety climate to a higher extent (9.3), followed by management safety justice (0.8).

3.5. Model Fitness Indices

The final model was fitted after correlating 11 error variables with higher modification indices: e2–e3, e4–e5, e5–e8, e6–e9, e11–e12, e18–e19, e20–e23, e21–e22, e31–e32, e32–e34, and e45–e46. Figure 3 illustrates these connections by plotting them among the observed variables’ residuals. The structural and measurement model achieves the desirable model fit of RMSEA = 0.059, GFI = 0.877, AGFI = 0.857, CFI = 0.925, NFI = 0.909, and TLI = 0.918, as illustrated in Table 8. In this scenario, the observed moments are the covariances between all pairings, and the all-model fitness indices indicate how well the model fits the data.

3.6. Validity and Reliability of the Measurement Model

As illustrated in Table 9, the reliability and validity of the final CFA models were assessed using recommended techniques. The reliability of the measurement model in CFA was checked using the composite reliability (CR); a value above the recommended value of 0.7 ensures reliability. In this study, the minimum CR value of 0.729 indicates good reliability.
Convergent validity measures how close each indicator is to explaining the latent construct. In this regard, the value of CR should be above 0.7, and the average variance extracted (AVE) value should be greater than 0.5. In addition, all CR values should be greater than the AVE value. As indicated in Table 9, all the values of CR and AVE were greater than the recommended limit, and all the values of CR were greater than AVE, which showed that the model had good convergent validity.
Discriminant validity shows how each latent construct differs and is assessed in two ways. The Average Shared Variance (ASV) should be less than the Maximum Shared Variance (MSV), and an MSV that is less than the AVE indicates the presence of discriminant validity. On the other hand, if the square root of the AVE is the highest value in the respective column (greater than the correlation between the construct and any other construct) according to the Fronell–Larcker criterion, the presence of discriminant validity can be assured. Both criteria were fulfilled, and thus the measurement model achieved discriminant validity (Table 9).
The non-existence of multi-collinearity was verified because the maximum correlation between the exogenous constructs (0.716) was less than the recommended value of 0.85.

3.7. Hypothesis Testing

We fitted the structural model using the maximum likelihood estimation method and a covariance matrix to assess the proposed relationships. The developed structural model of SC and SP accounts for age, education, and experience (Table 10).
The two hypothesized relationships (H1 and H2) were validated by the proposed model (Figure 1). The model depicts a significant positive correlation between SC and safety participation (H1). As illustrated in Table 10, the standardized path coefficient of 0.541 indicates that safety compliance increases by 0.541 standard deviations for every standard deviation increase in SC. Similarly, the Bentler–Raykov squared multiple correlation coefficient (0.292) showed that 29.2% of the variance in safety involvement was explained. A significant positive correlation was also seen in the relationship between SC and safety compliance (H2), with squared multiple correlations of 0.286 and standardized path coefficients of 0.535 indicating that 28.6% of the variation was explained.
There was a slight difference between the management group (Figure 3) and the workgroups (Figure 4). Among managers, safety involvement was explained more than safety compliance. On the other hand, safety compliance was explained more among workers than among managers. However, there were no differences in safety climate perceptions among men and women and within different age groups.
In this model, the relationship between SC and the number of self-reported accidents/injuries (H3) could not be tested as it could not be retained in the hypothesized model.
Figure 3 and Figure 4 show that there was some variation in the five safety climate dimensions that were kept in the final model with regard to the management groups and the workgroups. In the workgroup, management safety priority and commitment explain the safety climate dimensions more (0.94) than did the management group (0.88). Conversely, the safety climate is better explained by workers’ safety commitment in management groups (0.71) as compared to workgroups (0.67).

4. Discussion

The definitions of safety culture and safety climate, as well as their interrelationship, have been a topic of an ongoing debate in the academic literature as illustrated in Table 1 [29,57]. Research indicates that a positive safety culture within an organization tends to positively influence the safety climate [58]. Safety climate is often viewed as a measurable representation or reflection of safety culture through quantitative methods. However, it only provides insight into certain aspects of safety culture and is one of the few ways to gain a snapshot of it [57]. To truly understand what safety culture is, there is a need for qualitative research, such as participant observations, interviews, and document analysis conducted over an extended period [28]. Conversely, some researchers contend that safety climate measurements can serve as a reliable basis for evaluating safety culture and offer an accurate portrayal of an organization’s overall safety culture [59,60]. The construction safety climate refers to the overall attitudes, behaviors, and practices displayed by front-line supervisors and field workers concerning safety. It reflects how safety is prioritized and practiced within a construction site and serves as a visible manifestation of the broader safety culture within the organization [17,29]. Generally, there is a consensus in the research community that safety climate measurements, typically gathered through questionnaires, can provide valuable insights into critical aspects of safety culture [57]. Therefore, in this study, we utilized a quantitative approach by administering the Nordic Safety Climate Questionnaire [NOSACQ-50] to assess safety conditions in large-scale construction industries in Ethiopia.
The results show that the scores of the seven safety climate dimensions were low, ranging from 2.33 to 3.08, with a mean of 2.70. Similarly, the mean scores of the safety performance construct were 2.95 for safety participation and 3.58 for safety compliance. In the final SEM model, twenty-six (52%) items out of fifty and five safety climate dimensions out of the seven NOSACQ-50 safety climate dimensions were maintained. The model predicts a strong positive correlation between safety climate and safety performance constructs, with 29.2% of the variance in safety involvement and 28.6% of the variance in safety compliance. The proposed relationship between self-reported accidents/injuries and SC was not confirmed, as the variable could not be used in the model analysis. Nonetheless, the Pearson correlation shows a statistically significant negative correlation between self-reported injuries and SC. There were no differences in safety climate perceptions among men and women, and different age groups and educational statuses.
According to the NOSACQ-50 interpretation guidelines [51], a safety climate dimension with a score below 2.70 indicates a low level with a great need for improvement. In this regard, management safety priority and commitment (2.54), workers’ safety priority and risk non-acceptance (2.52), and management safety empowerment (2.33) were below the cut-off point. This indicates the need for high-level commitment and effort to improve safety climate conditions in the Ethiopian construction sector. Lack of management commitment to safety and employees not participating in the decision-making process might demotivate employees and increase their risk of suffering occupational injuries [38].
The mean scores for each safety climate dimension in the current study were generally low compared to the figure in the grand database and results from a study in the Saudi Arabian construction industry [61]. However, the trends in the mean scores among various safety climate dimensions were consistent with those in the grand database. Among workgroups, workers’ trust in the effectiveness of safety procedures (Dim7) shows a maximum score of 3.24 in the grand database and 3.06 in the current study. These results are also consistent with another study in the construction industry, where the highest score was 3.24 for Dim. 7 [45]. The same trend was reported among the management group, with a maximum score of 3.36 in the grand database and 3.17 in the current study for the same construct (Dim7). Similarly, the minimum values of the two reports were also consistent. Among the workgroups, management safety justice (Dim3) had the lowest score in both reports in the grand database (2.98) and in the current study (2.28). This consistency in the patterns of the mean score among different safety climate dimensions demonstrates that the NOSACQ-50 safety climate questionnaire is a useful instrument for evaluating safety climate conditions in various settings.
The low score of safety climate across all dimensions may be linked to a lack of appropriate on-the-job safety training. Results indicated that nearly 92% of participants had not received any safety training in the last 12 months. Many researchers have indicated safety training improves workers’ perceptions of safety and influences their safety behavior [19].
In the existing safety literature, it has been established that safety climate positively affects safety participation and safety compliance [33,52,62]. The findings of the current study demonstrate this fact. The structural model showed a statistically significant positive relationship between safety climate and safety participation (0.541) and safety climate and safety compliance (0.535) with a total variance of 29.2% and 28.6%, respectively. Therefore, the research hypothesis was strongly supported by the data.
The magnitude of the relationship between safety climate and safety performance (safety compliance and safety participation) has been debated in the current safety literature. Some researchers argue that safety climate is correlated more with safety participation than safety compliance [34,36]. A possible explanation for this is that workers regularly follow the safety laws and regulations because they are required to do so, and the safety climate has little influence on this kind of compulsory behavior. Conversely, other researchers argue that safety climate correlates more with safety compliance than safety participation [62]. The current study found that safety participation and safety compliance were almost equally correlated with the safety climate. These differences in the weight assigned to various SP indicators support the necessity of examining safety behavior in cross-cultural and cross-regional contexts.
In the current study, some safety climate dimensions had a greater impact on the safety performance indicators, as shown by the path coefficients (Figure 2) and percentage variances (Table 10). Management safety priority and commitment (Dim1) and management safety justice (Dim3) had higher effects on SP than other dimensions. Even though there was a lower mean score (2.54) for Dim 1, the effect on SC (0.933) was higher than others, explaining 87% of the variation in SC. This illustrates how SP was substantially enhanced with only a small change in the commitments of top management. A similar study provides substantial evidence for this fact [62].
In the current study, the hypothesized relationship between safety climate and the self-reported injury rate could not be validated because none of the three components of injury categories in the explanatory factor analysis (EFA) met the minimal requirements for factor loading (0.5) and communalities (0.4). Hence, we intend to fit another model in our upcoming paper to investigate the statistical association between safety climate and self-reported occupational injuries.
The study highlights the following practical implications. The safety climate score is generally low and can be linked to a lack of safety training, as the result indicates that more than 90% of employees did not receive any training in the last 12 months. Certain dimensions of the safety climate, such as management safety priority and commitment and management safety justice, have very low scores but provide a greater explanation of safety behavior. This suggests that employees’ safety behavior improves when they perceive that the management team is committed to safety. We believe this study is the first of its kind in Ethiopia and will motivate other researchers to conduct similar studies across different industries.

Strengths and Limitations of This Study

To our knowledge, this is the first study of its kind on the Ethiopian construction industry that investigates the relationship between safety climate and safety performance. The study includes five large cities with a geographically diverse population. We used a large sample of managers and workgroups. The final model achieved the desired goodness-of-fit indices, an acceptable degree of composite reliability, and convergent and discriminate validities. The application of the NOSACQ-50 safety climate questionnaire minimized the social desirability bias, as it assesses group-level common practices [63]. The tool has also been validated in a different context [9]. In this study, we considered 1203 study participants. It is known that a larger sample size usually yields a more accurate estimate because it reduces the effect of random variability within the sample.
However, the current study has some limitations. The study used cross-sectional data; hence, we were unable to establish causality and demonstrate how the safety climate changed over time, which would be accomplished using a longitudinal approach. A face-to-face interview approach was used in this study, and personal contact may influence the participants’ responses and introduce interviewer biases. However, interviews were necessary, as many construction workers do not have good writing skills. To minimize interviewer bias, we trained the data collectors to have a common understanding of the items and to implement a uniform interview approach. The number of reported accidents and injuries was lower than expected, which may be linked to the reliance on self-reported data, which may be influenced by recall bias, meaning the employees might not have remembered the event. This also might be due to fear, as the workers might have worried about the consequences of reporting negative information about their workplace. However, we did our best to minimize this bias by interviewing the employees in a private setting and keeping the data confidential.

5. Conclusions

The current study explores the underlying relationship between safety climate and safety performance. The mean score of the safety climate dimension was generally low compared with data from other countries. The low scores across all safety climate dimensions indicate that safety in the construction sector is often overlooked, necessitating substantial efforts to address this issue. The model predicts a strong positive correlation between safety climate and safety performance constructs. This finding suggests that management’s safety priorities and commitment significantly explain the variance in safety climate and safety performance. Therefore, special emphasis should be placed on improving management’s safety priorities and commitment.
The results of the safety climate model can assist decision-makers in the construction industry, designers, government agencies, and building contractors in improving safety performance. In particular, targeting improvements in low-scoring safety climate dimensions can lead to enhanced safety performance. This study contributes to the existing safety literature by showing the construction safety situation in a low-income context. It also demonstrates that the NOSACQ-50 safety climate questionnaire is a valid tool that can be applied in different contexts. Hence, the findings of the current study could be utilized in low-income settings. For future research, we recommend a study in a small-scale construction setting, as safety issues might be even more severe there than in the large-scale construction industry due to the lack of safety officers and other budget-related constraints. Conducting a longitudinal study would be a valuable future endeavor to ensure causality in the relationship between safety climate and safety performance in this sector. In addition, researchers indicate that the effect of safety culture on safety behavior can be mediated by safety climate; hence, we recommend further research to explore such linkages in the context of low-income settings. In addition, further studies using a qualitative approach will explore the overall implication of safety culture in construction industries.

Supplementary Materials

The following supporting information can be downloaded at: https://www.mdpi.com/article/10.3390/safety11010028/s1. Table S1: Explanatory factor analysis of SC and SP; Figure S1: Measurement model of SC and SP.

Author Contributions

Conceptualization: T.A.; methodology, T.A., W.D. and B.E.M.; validation: T.A., W.D. and B.E.M.; formal analysis: T.A.; investigation, T.A.; writing—original draft preparation: T.A.; writing—review and editing: T.A., W.D. and B.E.M.; supervision: W.D. and B.E.M.; project administration: W.D. and B.E.M.; funding acquisition: W.D. and B.E.M. All authors have read and agreed to the published version of the manuscript.

Funding

This research was funded by the Norwegian Program for Capacity Building in Higher Education and Research for Development (NORHED-II Safeworkers Project) (grant number: 69181).

Institutional Review Board Statement

This study was conducted according to the guidelines of the Declaration of Helsinki and approved by the Institutional Review Board of the College of Health Science, Addis Ababa University, with protocol number 099/22/SH. Permission for this study was also obtained from the construction companies.

Informed Consent Statement

The purpose of the study was communicated to all participants, and they were informed of their right to withdraw at any time. Every participant gave their informed consent, and we ensured that their information was kept private and confidential.

Data Availability Statement

The authors are willing to provide the raw data used in this study upon request.

Acknowledgments

We highly appreciate the management teams and workers of the large-scale construction industries for their permission to conduct this study and willingness to participate in interviews.

Conflicts of Interest

The authors declare that they have no competing interests.

References

  1. Mandefro, H.; Nkhonjera, M. Africa Housing Finance Yearbook (AHFY) Housing Finance Africa, Ethiopia; Centre for Affordable Housing Finance in Africa (CAHF): Johannesburg, South Africa, 2020. [Google Scholar]
  2. GBN. Partnership Ready Ethiopia: Construction. Global Business Network Program (GBN); Global Business Network Program (GBN): Bonn, Germany, 2020. [Google Scholar]
  3. Mengistu, D.G.; Mahesh, G. Challenges in developing the Ethiopian construction industry. Afr. J. Sci. Technol. Innov. Dev. 2020, 12, 373–384. [Google Scholar] [CrossRef]
  4. Tarkegn, G. Assessment of Safety and Health Laws and Enforcement Practice in Ethiopian Construction Industry: A Case of Selected High-Rise Building Projects in Addis Ababa. In Civil Engineering; Addis Ababa University: Addis Ababa, Ethiopia, 2020. [Google Scholar]
  5. Froggatt, P.; Smiley, J.A. The Concept of Accident Proneness: A Review. Brit. J. Ind. Med. 1964, 21, 1–12. [Google Scholar] [CrossRef] [PubMed]
  6. Reason, J. Human error: Models and management. BMJ 2000, 320, 768–770. [Google Scholar] [CrossRef]
  7. Osei-Asibey, D.; Ayarkwa, J.; Acheampong, A.; Adinyira, E.; Amoah, P. An Examination of Causes of Accidents and Hazards in the Ghanaian Construction Industry. Open J. Saf. Sci. Technol. 2021, 11, 66–88. [Google Scholar] [CrossRef]
  8. Schwatka, N.V.; Hecker, S.; Goldenhar, L.M. Defining and Measuring Safety Climate: A Review of the Construction Industry Literature. Ann. Occup. Hyg. 2016, 60, 537–550. [Google Scholar] [CrossRef] [PubMed]
  9. Kines, P.; Lappalainen, J.; Mikkelsen, K.L.; Olsen, E.; Pousette, A.; Tharaldsen, J.; Tómasson, K.; Törner, M. Nordic Safety Climate Questionnaire (NOSACQ-50): A new tool for diagnosing occupational safety climate. Int. J. Ind. Ergon. 2011, 41, 634–646. [Google Scholar] [CrossRef]
  10. Kvalheim, S.A.; Antonsen, S.; Haugen, S. Safety climate as an indicator for major accident risk: Can we use safety climate as an indicator on the plant level? Int. J. Disater Risk Reduct. 2016, 18, 23–31. [Google Scholar] [CrossRef]
  11. Khan, K.M.I.; Suguna, K.; Raghunath, P.N. A study on safety management in construction projects. Int. J. Eng. Sci. Innov. Technol. 2015, 4, 119–128. [Google Scholar]
  12. Han, B.; Son, S.; Kim, S. Measuring Safety Climate in the Construction Industry: A Systematic Literature Review. Sustainability 2021, 13, 10603. [Google Scholar] [CrossRef]
  13. Zohar, D. Safety climate and beyond: A multi-level multi-climate framework. Saf. Sci. 2008, 46, 376–387. [Google Scholar]
  14. Casey, T.; Griffin, M.A.; Harrison, H.F.; Neal, A. Safety climate and culture: Integrating psychological and systems perspectives. J. Occup. Health Psychol. 2017, 22, 341. [Google Scholar] [CrossRef] [PubMed]
  15. Petitta, L.; Probst, T.M.; Barbaranelli, C.; Ghezzi, V. Disentangling the roles of safety climate and safety culture: Multi-level effects on the relationship between supervisor enforcement and safety compliance. Accid. Anal. Prev. 2017, 99, 77–89. [Google Scholar] [CrossRef] [PubMed]
  16. Al-Bayati, A.J. Impact of Construction Safety Culture and Construction Safety Climate on Safety Behavior and Safety Motivation. Safety 2021, 7, 41. [Google Scholar] [CrossRef]
  17. Al-Bayati, A.J.; Albert, A.; Ford, G. Construction Safety Culture and Climate: Satisfying Necessity for an Industry Framework. Pract. Period. Struct. Des. Constr. 2019, 24, 04019028. [Google Scholar] [CrossRef]
  18. Wiegmann, D.A.; Zhang, H.; Thaden, T.L.v.; Sharma, G.; Gibbons, A.M. Safety culture: An integrative review. Int. J. Aviat. Psychol. 2004, 14, 117–134. [Google Scholar] [CrossRef]
  19. Griffin, M.A.; Neal, A. Perceptions of safety at work: A framework for linking safety climate to safety performance, knowledge, and motivation. J. Occup. Health Psychol. 2000, 5, 347–358. [Google Scholar] [CrossRef]
  20. Chen, Y.; McCabe, B.; Hyatt, D. Impact of individual resilience and safety climate on safety performance and psychological stress of construction workers: A case study of the Ontario construction industry. J. Saf. Res. 2017, 61, 167–176. [Google Scholar] [CrossRef]
  21. Ajslev, J.Z.N.; Sundstrup, E.; Jakobsen, M.; Kines, P.; Dyreborg, J.; Andersen, L.L. Is perception of safety climate a relevant predictor for occupational accidents? A prospective cohort study among blue-collar workers. Scand. J. Work Environ. Health 2018, 44, 370–376. [Google Scholar] [CrossRef]
  22. Zohar, D. Safety climate in industrial organizations: Theoretical and applied implications. J. Appl. Psychol. 1980, 65, 96–102. [Google Scholar] [CrossRef]
  23. Wu, C.; Song, X.; Wang, T.; Fang, D. Core Dimensions of the Construction Safety Climate for a Standardized Safety-Climate Measurement. J. Constr. Eng. Manag. 2015, 141, 04015018. [Google Scholar] [CrossRef]
  24. National Occupational Research Agenda (NORA) Construction Sector Council. National Construction Agenda: National Institute for Occupational Safety and Health, Center for Disease Control, Atlanta, USA; Center for Disease Control: Atlanta, GE, USA, 2008.
  25. Gillen, M.; Goldenhar, L.M.; Hecker, S.; Schneider, S. Safety Culture and Climate in Construction: Bridging the Gap Between Research and Practice; Center for Construction Research and Training: Silver Spring, MD, USA, 2014. [Google Scholar]
  26. Zou, P.X.; Sunindijo, R.Y. Strategic Safety Management in Construction and Engineering; John Wiley & Sons, Ltd.: Hoboken, NJ, USA, 2015. [Google Scholar] [CrossRef]
  27. NCR (US Nuclear Regulatory Commission). Safety Culture; NCR: Atlanta, GA, USA, 2018.
  28. Berglund, L.; Johansson, J.; Johansson, M.; Nygren, M.; Stenberg, M. Exploring safety culture research in the construction industry. Work 2023, 76, 549–560. [Google Scholar] [CrossRef]
  29. Al-Bayati, A.J.; Karakhan, A.A.; Alzarrad, A. Quantifying the mediating effect of frontline supervisors on workers’ safety actions: A construction safety culture focus. Pract. Period. Struct. Des. Constr. 2024, 29, 04024025. [Google Scholar] [CrossRef]
  30. DeArmond, S.; Smith, A.E.; Wilson, C.L.; Chen, P.Y.; Cigularov, K.P. Individual safety performance in the construction industry: Development and validation of two short scales. Accid. Anal. Prev. 2011, 43, 948–954. [Google Scholar] [CrossRef]
  31. Borman, W.C.; Motowidlo, S.J. Expanding the criterion domain to include elements of contextual performance. In Personnel Selection in Organizations; Schmitt, N., Borman, W.C., Eds.; Psychology Faculty Publications: California, CA, USA, 1993; pp. 71–98. [Google Scholar]
  32. Neal, A.; Griffin, M.A.; Hart, P.M. The impact of organizational climate on safety climate and individual behavior. Saf. Sci. 2000, 34, 99–109. [Google Scholar] [CrossRef]
  33. Hon, C.K.; Chan, A.P.; Yam, M.C. Relationships between safety climate and safety performance of building repair, maintenance, minor alteration, and addition (RMAA) works. Saf. Sci. 2014, 65, 10–19. [Google Scholar] [CrossRef]
  34. Christian, M.S.; Bradley, J.C.; Wallace, J.C.; Burke, M.J. Workplace safety: A meta-analysis of the roles of person and situation factors. J. Appl. Psychol. 2009, 94, 1103–1127. [Google Scholar] [CrossRef] [PubMed]
  35. Hertanto, A.; Erwandi, D.; Widanarko, B.; Tejamaya, M. Relationship between Safety Climate and Safety Behavior in Company X in Indonesia. Saf. Sci. 2023, 9, 89. [Google Scholar] [CrossRef]
  36. Clarke, S. The relationship between safety climate and safety performance: A meta-analytic review. J. Occup. Health Psychol. 2006, 11, 315–327. [Google Scholar] [CrossRef]
  37. Neal, A.; Griffin, M.A. A study of the lagged relationships among safety climate, safety motivation, safety behavior, and accidents at the individual and group levels. J. Appl. Psychol. 2006, 91, 946–953. [Google Scholar] [CrossRef]
  38. Yosef, T.; Sineshaw, E.; Shifera, N. Occupational injuries and contributing factors among industry park construction workers in Northwest Ethiopia. Front. Public Health 2023, 10, 1060755. [Google Scholar] [CrossRef]
  39. Berhanu, F.; Gebrehiwot, M.; Gizaw, Z. Workplace injury and associated factors among construction workers in Gondar town, Northwest Ethiopia. BMC Musculoskelet. Disord. 2019, 20, 523. [Google Scholar] [CrossRef]
  40. Zohar, D. Safety Climate: Conceptual and Measurement Issues. In Handbook of Occupational Health Psychology; Quick, J.C., Tetrick, L.E., Eds.; American Psychological Association: Washington, DC, USA, 2003. [Google Scholar]
  41. Davies, F.; Spencer, R.; Dooley, K. Summary Guide to Safety Climate Tools; HSE Books: Norwich, UK, 2001. [Google Scholar]
  42. Meliá, J.L.; Mearns, K.; Silva, S.A.; Lima, M.L. Safety climate responses and the perceived risk of accidents in the construction industry. Saf. Sci. 2008, 46, 949–958. [Google Scholar] [CrossRef]
  43. Namian, M.; Albert, A.; Zuluaga, C.M.; Behm, M. Role of safety training: Impact on hazard recognition and safety risk perception. J. Constr. Eng. Manag. 2016, 142, 04016073. [Google Scholar] [CrossRef]
  44. Yousefi, Y.; Jahangiri, M.; Choobineh, A.; Tabatabaei, H.; Keshavarzi, S.; Shams, A.; Mohammadi, Y. Validity Assessment of the Persian Version of the Nordic Safety Climate Questionnaire (NOSACQ-50): A Case Study in a Steel Company. Saf. Health Work 2016, 7, 326–330. [Google Scholar] [CrossRef] [PubMed]
  45. Marin, L.S.; Lipscomb, H.; Cifuentes, M.; Punnett, L. Perceptions of safety climate across construction personnel: Associations with injury rates. Saf. Sci. 2019, 118, 487–496. [Google Scholar] [CrossRef]
  46. Kines, P. NOSACQ-50—Safety Climate Questionnaire [Online]; NRCWE: National Research Centre for the Working Environment: København, Denmark, 2017.
  47. Fang, D.; Chen, Y.; Wong, L. Safety Climate in Construction Industry: A Case Study in Hong Kong. J. Constr. Eng. Manag. 2006, 132, 573–584. [Google Scholar] [CrossRef]
  48. Lingard, H.; Cooke, T.; Blismas, N. Do perceptions of supervisors’ safety responses mediate the relationship between perceptions of the organizational safety climate and incident rates in the construction supply chain? J. Constr. Eng. Manag. 2012, 138, 234–241. [Google Scholar] [CrossRef]
  49. Li, Q.; Ji, C.; Yuan, J.; Han, R. Developing dimensions and key indicators for the safety climate within China’s construction teams: A questionnaire survey on construction sites in Nanjing. Saf. Sci. 2016, 93, 266–276. [Google Scholar] [CrossRef]
  50. Chen, W.T.; Merrett, H.C.; Huang, Y.-H.; Lu, S.T.; Sun, W.C.; Li, Y. Exploring the Multilevel Perception of Safety Climate on Taiwanese Construction Sites. Sustainability 2019, 11, 4596. [Google Scholar] [CrossRef]
  51. NFA. How to Use NOSACQ-50. Interpreting the Nordic Occupational Safety Climate Questionnaire NOSACQ50 Results (2017, February 27); Nationale Forskningscenter for Arbejdsmiljø (NFA) (National Research Centre for the Working Environment): Copenhagen, Denmark, 2017.
  52. Nadhim, E.A.; Hon, C.; Xia, B.; Stewart, I.; Fang, D. Investigating the Relationships between Safety Climate and Safety Performance Indicators in Retrofitting Works. Constr. Econ. Build. 2018, 18, 110–129. [Google Scholar] [CrossRef]
  53. Mohamed, S. Safety climate in construction site environments. J. Constr. Eng. Manag. 2002, 128, 375–384. [Google Scholar] [CrossRef]
  54. Blunch, N.J. Introduction to Structural Equation Modelling Using SPSS and AMOS; SAGE Publications Ltd.: Thousand Oaks, CA, USA, 2008. [Google Scholar]
  55. Thakkar, J.J. Structural Equation Modelling Application for Research and Practice (with AMOS and R); Springer: Singapore, 2020. [Google Scholar]
  56. Hair, J.F.J.; Black, W.C.; Babin, B.J.; Anderson, R.E. Multivariate Data Analysis, 7th ed.; Pearson Prentice Hall: Upper Saddle River, NJ, USA, 2010. [Google Scholar]
  57. Fang, D.; Wu, H. Development of a Safety Culture Interaction (SCI) model for construction projects. Saf. Sci. 2013, 57, 138–149. [Google Scholar] [CrossRef]
  58. Erkal, E.D.O.; Hallowell, M.R.; Bhandari, S. Practical assessment of potential predictors of serious injuries and fatalities in construction. J. Constr. Eng. Manag. 2021, 147, 04021129. [Google Scholar] [CrossRef]
  59. Chen, Q.; Jin, R. Multilevel safety culture and climate survey for assessing new safety program. J. Constr. Eng. Manag. 2013, 139, 805–817. [Google Scholar] [CrossRef]
  60. Teo, E.; Feng, Y. The role of safety climate in predicting safety culture on construction sites. Arch. Sci. Rev. 2009, 52, 5–16. [Google Scholar] [CrossRef]
  61. Alamoudi, M. The Integration of NOSACQ-50 with Importance-Performance Analysis Technique to Evaluate and Analyze Safety Climate Dimensions in the Construction Sector in Saudi Arabia. Buildings 2022, 12, 1855. [Google Scholar] [CrossRef]
  62. Zahoor, H.; Chan, A.P.C.; Utama, W.P.; Zafar, R.G.A.I. Modeling the Relationship between Safety Climate and Safety Performance in a Developing Construction Industry: A Cross-Cultural Validation Study. Int. J. Environ. Res. Public Health 2017, 14, 351. [Google Scholar] [CrossRef]
  63. Lappalainen, J. Measuring Safety Climate in Shipping Companies. J. Marit. Res. 2017, 14, 19–26. [Google Scholar]
Figure 1. Conceptual and hypothesized model relating to safety climate and safety performance. SC_Dimention 1 = management safety priority and commitment, SC_Dimention 2 = management safety empowerment, SC_Dimention 3 = management safety justice, SC_Dimention 4 = workers’ safety commitment, SC_Dimention 5 = workers’ safety priority and risk non-acceptance, SC_Dimention 6 = workers’ safety communication, learning, and trust in co-workers’ safety competence, SC_Dimention 7 = workers’ trust in the efficacy of safety systems, SC = safety climate, SP = safety performance, OI = occupational injury, H = hypothesis, (+) = positive relation, (-) = negative relation.
Safety 11 00028 g001
Figure 2. Structural equation model of SC and SP (as inspired by earlier findings).
Safety 11 00028 g002
Figure 3. Structural equation model of SC and SP among management groups.
Safety 11 00028 g003
Figure 4. Structural equation model of SC and SP among workgroups.
Safety 11 00028 g004
Table 2. Summary of safety climate questionnaires developed for the construction industry.
No. of DimensionsDimensions IncludedNo. of ItemsReferences
10Safety attitude and management commitment, safety consultation and safety training, supervisor role and workmate role, risk-taking behavior, safety resources, appraisal of safety procedures and work risks, improper safety procedures, worker involvement, workmate influence, and competence78Fang et al. (2006) [47]
7Management safety priority, commitment, and competence; management safety empowerment; management safety regulations; worker safety commitment; worker safety priority and risk non-acceptance; safety communication, learning, and trust in co-worker safety competence; and worker trust in the efficacy of safety systems50Kines et al. (2011) [9]
6Top management commitment to safety,
organizational priority placed on safety, supervisors’ safety actions, supervisors’ safety expectations, coworkers’ actual safety response, and coworkers’ ideal safety response
-Lingard et al. (2012) [48]
6Management commitment, safety communication, rules and procedures, supportive environment, personal accountability, and training58Zou et al. (2015) [26]
6Workers’ self-perception of safety,
worker involvement in safety,
co-workers’ interaction, safety environment, safety management involvement, and safety Personnel support
23Li et al. (2016) [49]
5Safety attitude, safety training and policies, risk decision-making, safety commitment and
communication, and workmate mutual care
33Chen et al. (2019) [50]
Table 3. Socio-demographic characteristics of large-scale construction industry workers.
VariablesResponseFrequency%
Injury
(N = 1203)
Yes42935.7
No77464.3
Injury categories
(N = 429)
Injury of more than three days of absenteeism15035.0
Injury of one to three days of absenteeism27929.4
Injury without absenteeism15335.6
Frequency of injury (N = 429)Once36083.9
Twice419.6
More than twice286.5
The pattern of activities during the accident (N = 429)Actual task38990.7
Movement/transit409.3
Nature of injury (More than one option is possible)
(N = 531)
Abrasion/laceration17633.1
Dislocation/fracture7213.6
Cut24245.6
Eye injury234.3
Others183.4
Body parts injured (More than one option is possible)
(N = 656)
Head and neck567.8
Eye238.5
Upper extremities14221.6
Lower extremities30546.5
Chest and abdomen11918.1
Others111.7
Table 4. Mean, standard deviation, and correlations of the safety climate and safety performance dimensions.
DimensionMeanSDCorrelation
Dim_1Dim_2Dim_3Dim_4Dim_5Dim_6Dim_7SP_1SP_2OI
Dim_12.540.5651
Dim_22.330.5780.770 **1
Dim_32.710.5520.726 **0.644 **1
Dim_43.010.4440.386 **0.262 **0.334 **1
Dim_52.520.4490.552 **0.477 **0.543 **0.396 **1
Dim_62.710.3530.583 **0.553 **0.518 **0.519 **0.407 **1
Dim_73.080.350−0.015−0.0450.0440.155 **−0.0490.0341
SP_12.950.9700.468 **0.444 **0.382 **0.241 **0.377 **0.415 **−0.124 **1
SP_23.430.7150.518 **0.471 **0.424 **0.364 **0.372 **0.498 **−0.067 *0.684 **1
OI0.450.708−0.221 **−0.172 **−0.230 **−0.116 **−0.202 **−0.159 **0.139 **−0.229 **−0.278 **1
** Correlation is significant at the 0.01 level (two-tailed). * Correlation is significant at the 0.05 level (two-tailed). Dim_1 to Dim_7 are safety climate dimensions; SP_1, SP_2 and OI are safety performance dimensions.
Table 5. Comparison of NOSACQ-50 dimensions in the current study and the grand database based on the role of workers. Revised data for the grand database 20 December 2023.
NOSACQ-50 DimensionsMeanStandard
Deviation
VarianceCronbach’s
Alpha
MeanStandard
Deviation
VarianceCronbach’s
Alpha
Grand database- Workers (n = 72,428)This study- Workers (n = 971)
Dim_1—Management safety priority and ability 3.08 0.50 0.25 0.86 2.50 0.74 0.55 0.91
Dim_2—Management safety empowerment 2.98 0.49 0.24 0.84 2.28 0.72 0.52 0.91
Dim_3—Management safety justice 3.00 0.50 0.25 0.80 2.66 0.71 0.50 0.88
Dim_4—Worker safety commitment 3.19 0.47 0.22 0.76 3.01 0.58 0.34 0.83
Dim_5—Worker safety priority and risk non-acceptance 2.99 0.51 0.26 0.77 2.49 0.71 0.51 0.74
Dim_6—Peer safety communication, learning, and trust in safety ability 3.16 0.42 0.18 0.84 2.70 0.57 0.34 0.75
Dim_7—Workers trust in the efficacy of safety systems 3.24 0.45 0.20 0.82 3.06 0.52 0.27 0.80
Grand database- Leaders (managers & supervisors) (n = 22,767)This study- Leaders (managers & supervisors) (n = 232)
Dim_1—Management safety priority and ability 3.28 0.46 0.21 0.85 2.73 0.81 0.52 0.88
Dim_2—Management safety empowerment 3.18 0.46 0.22 0.84 2.51 0.71 0.51 0.88
Dim_3—Management safety justice 3.22 0.48 0.23 0.81 2.93 0.63 0.40 0.83
Dim_4—Worker safety commitment 3.29 0.46 0.21 0.76 3.02 0.63 0.40 0.86
Dim_5—Worker safety priority and risk non-acceptance 3.16 0.50 0.25 0.79 2.66 0.69 0.48 0.75
Dim_6—Peer safety communication, learning, and trust in safety ability 3.29 0.46 0.21 0.85 2.78 0.58 0.35 0.77
Dim_7—Workers trust in the efficacy of safety systems 3.36 0.44 0.19 0.84 3.17 0.51 0.26 0.80
Table 6. Results of KMO and Bartlett tests for safety climate and safety behavior dimensions.
DimensionSafety
Climate
Safety
Behavior
Both
Kaiser–Meyer–Olkin (measure of sampling adequacy)0.9430.8950.947
Bartlett’s Sphericity TestChi-squared Distribution Approximation34,750.1216717.85143,156.239
Degree of Freedom1225361711
Significancep = 0.000p = 0.000p = 0.000
Table 7. Confirmatory factor analysis of the SC and SP measurement model (*** = <0.001).
Standardized Factor LoadingsStandard Errorz-Valuep-Value
Dim 1SCI_10.662
SCI_20.7280.04228.338***
SCI_30.7320.04328.537***
SCI_40.7020.05126.994***
SCI_50.6540.04724.511***
SCI_60.7820.04031.440***
SCI_70.8070.03932.953***
SCI_80.7000.04326.888***
SCI_90.5790.04321.042***
Dim2
SCI_120.863
SCI_130.6640.03126.083***
SCI_150.6990.02928.140***
SCI_160.9200.02542.155***
Dim3
SCI_170.762
SCI_190.8460.03134.991***
SCI_200.8050.03332.455***
SCI_220.8150.03133.055***
Dim4
SCI_230.805
SCI_240.8100.02536.385***
SCI_250.5380.03518.070***
SCI_260.7440.02524.887***
SCI_270.7650.02625.680***
SCI_280.5470.03318.405***
Dim6
SCI_410.793
SCI_420.8970.02639.661***
SCI_430.9260.02641.458***
SP1
SPI_10.662
SPI_50.8350.04429.127***
SPI_40.9120.04331.813***
SPI_30.8900.04431.115***
SPI_20.8810.04132.601***
SP2
SPI_70.761
SPI_80.8620.04127.417***
Table 8. Goodness-of-fit statistics from confirmatory factor analysis.
IndicesAbbreviationsObserved ValuesRecommended Criteria
Chi-squareχ22515.0 (p < 0.000)p < 0.05
Normed Chi-squareχ2/df5.20<3 is good
<5 is acceptable
Root mean square error of approximationRMSEA0.059<0.05 good fit
<0.08 acceptable fit
Comparative fit indexCFI0.925>0.95 good fit
>0.90 acceptable fit
Goodness-of-fit indexGFI0.877>0.9 good fit
Adjusted GFIAGFI0.857>0.8 good fit
Tucker–Lewis indexTLI0.9180 < TLI < 1
A value close to 1 indicates a good fit
Table 9. Validity and reliability of the CFA.
CRAVEMSVASVSP1SP2Dim4Dim6Dim3Dim2Dim1
SP10.9230.7070.3230.1750.841
SP20.7950.6610.1690.1650.7160.813
Dim40.8570.5050.1320.0630.3650.3610.711
Dim60.9060.7640.1060.0470.3860.3820.4810.877
Dim30.8820.6530.0670.0440.4320.4280.5390.5710.808
Dim20.8790.6300.1260.0440.3690.3660.4610.4880.5470.794
Dim10.9000.5010.0360.0290.5040.4990.6290.6660.7460.6380.710
CR: composite reliability, AVE: average variance extracted, MSV: Maximum Shared Variance; ASV: Average Shared Variance.
Table 10. Confirmatory factor analysis of the SC and SP structural model and explained variance. Bentler–Raykov squared multiple correlation coefficient.
GroupsIndicatorsSP Structural Model
Dim1Dim2Dim3Dim4Dim6SP1SP2
OverallLoading0.9330.6840.8000.6750.7140.5410.535
Squared Multiple Correlation0.8700.4670.6390.4550.5090.2920.286
Management
group
Loading0.8790.6840.7590.7110.7230.5500.493
Squared Multiple Correlation0.7730.4670.5760.5060.5230.3030.243
WorkgroupLoading0.9390.6710.8010.6710.7040.5300.545
Squared Multiple Correlation0.8810.4500.6420.4500.4960.2810.297
Disclaimer/Publisher’s Note: The statements, opinions and data contained in all publications are solely those of the individual author(s) and contributor(s) and not of MDPI and/or the editor(s). MDPI and/or the editor(s) disclaim responsibility for any injury to people or property resulting from any ideas, methods, instructions or products referred to in the content.

