
Big-Volume SliceGAN for Improving a Synthetic 3D Microstructure Image of Additive-Manufactured TYPE 316L Steel


 ,
, 
 , ,
, ,  and
and 
Abstract
1. Introduction
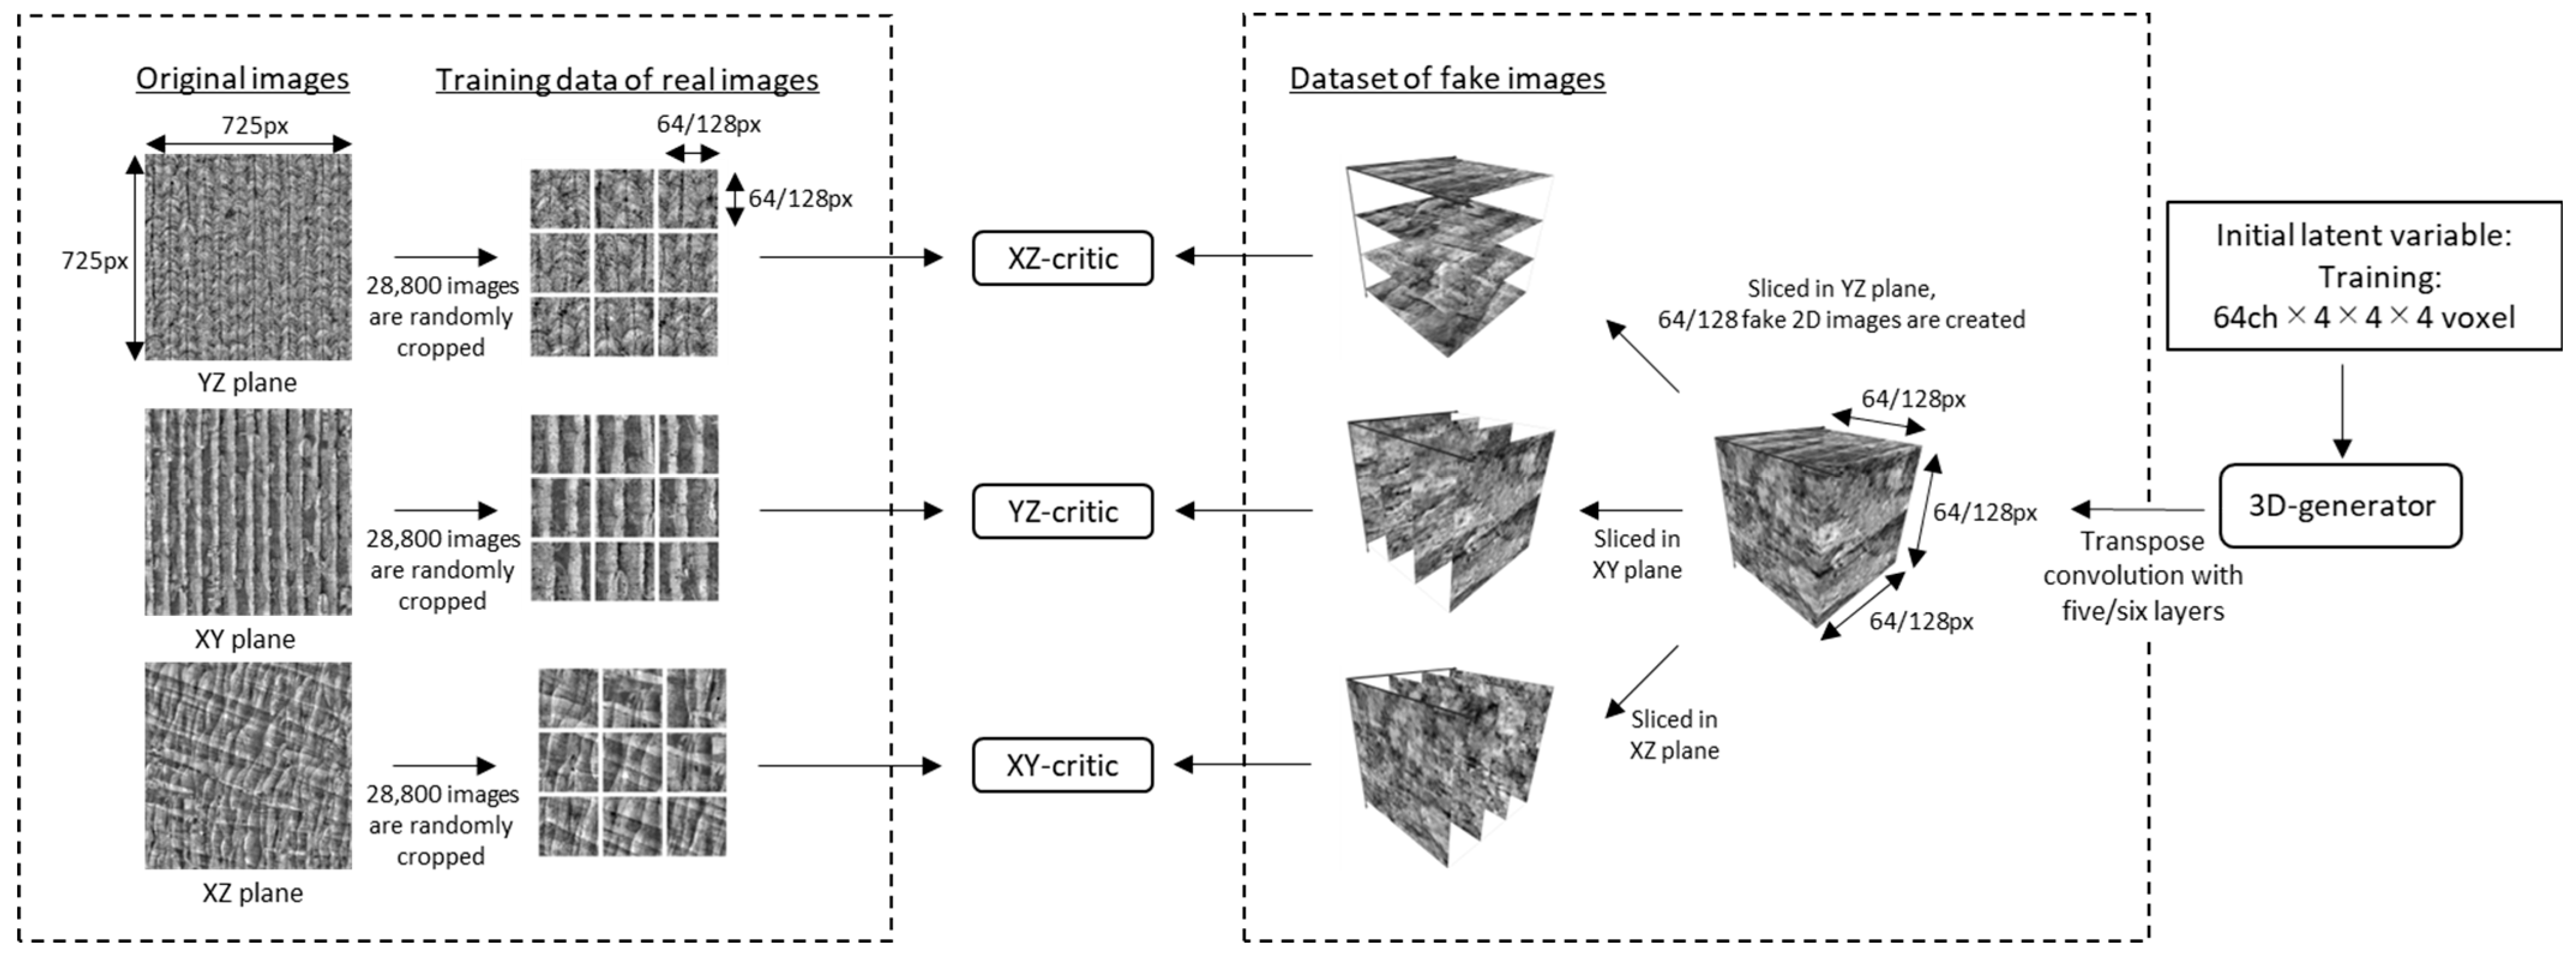
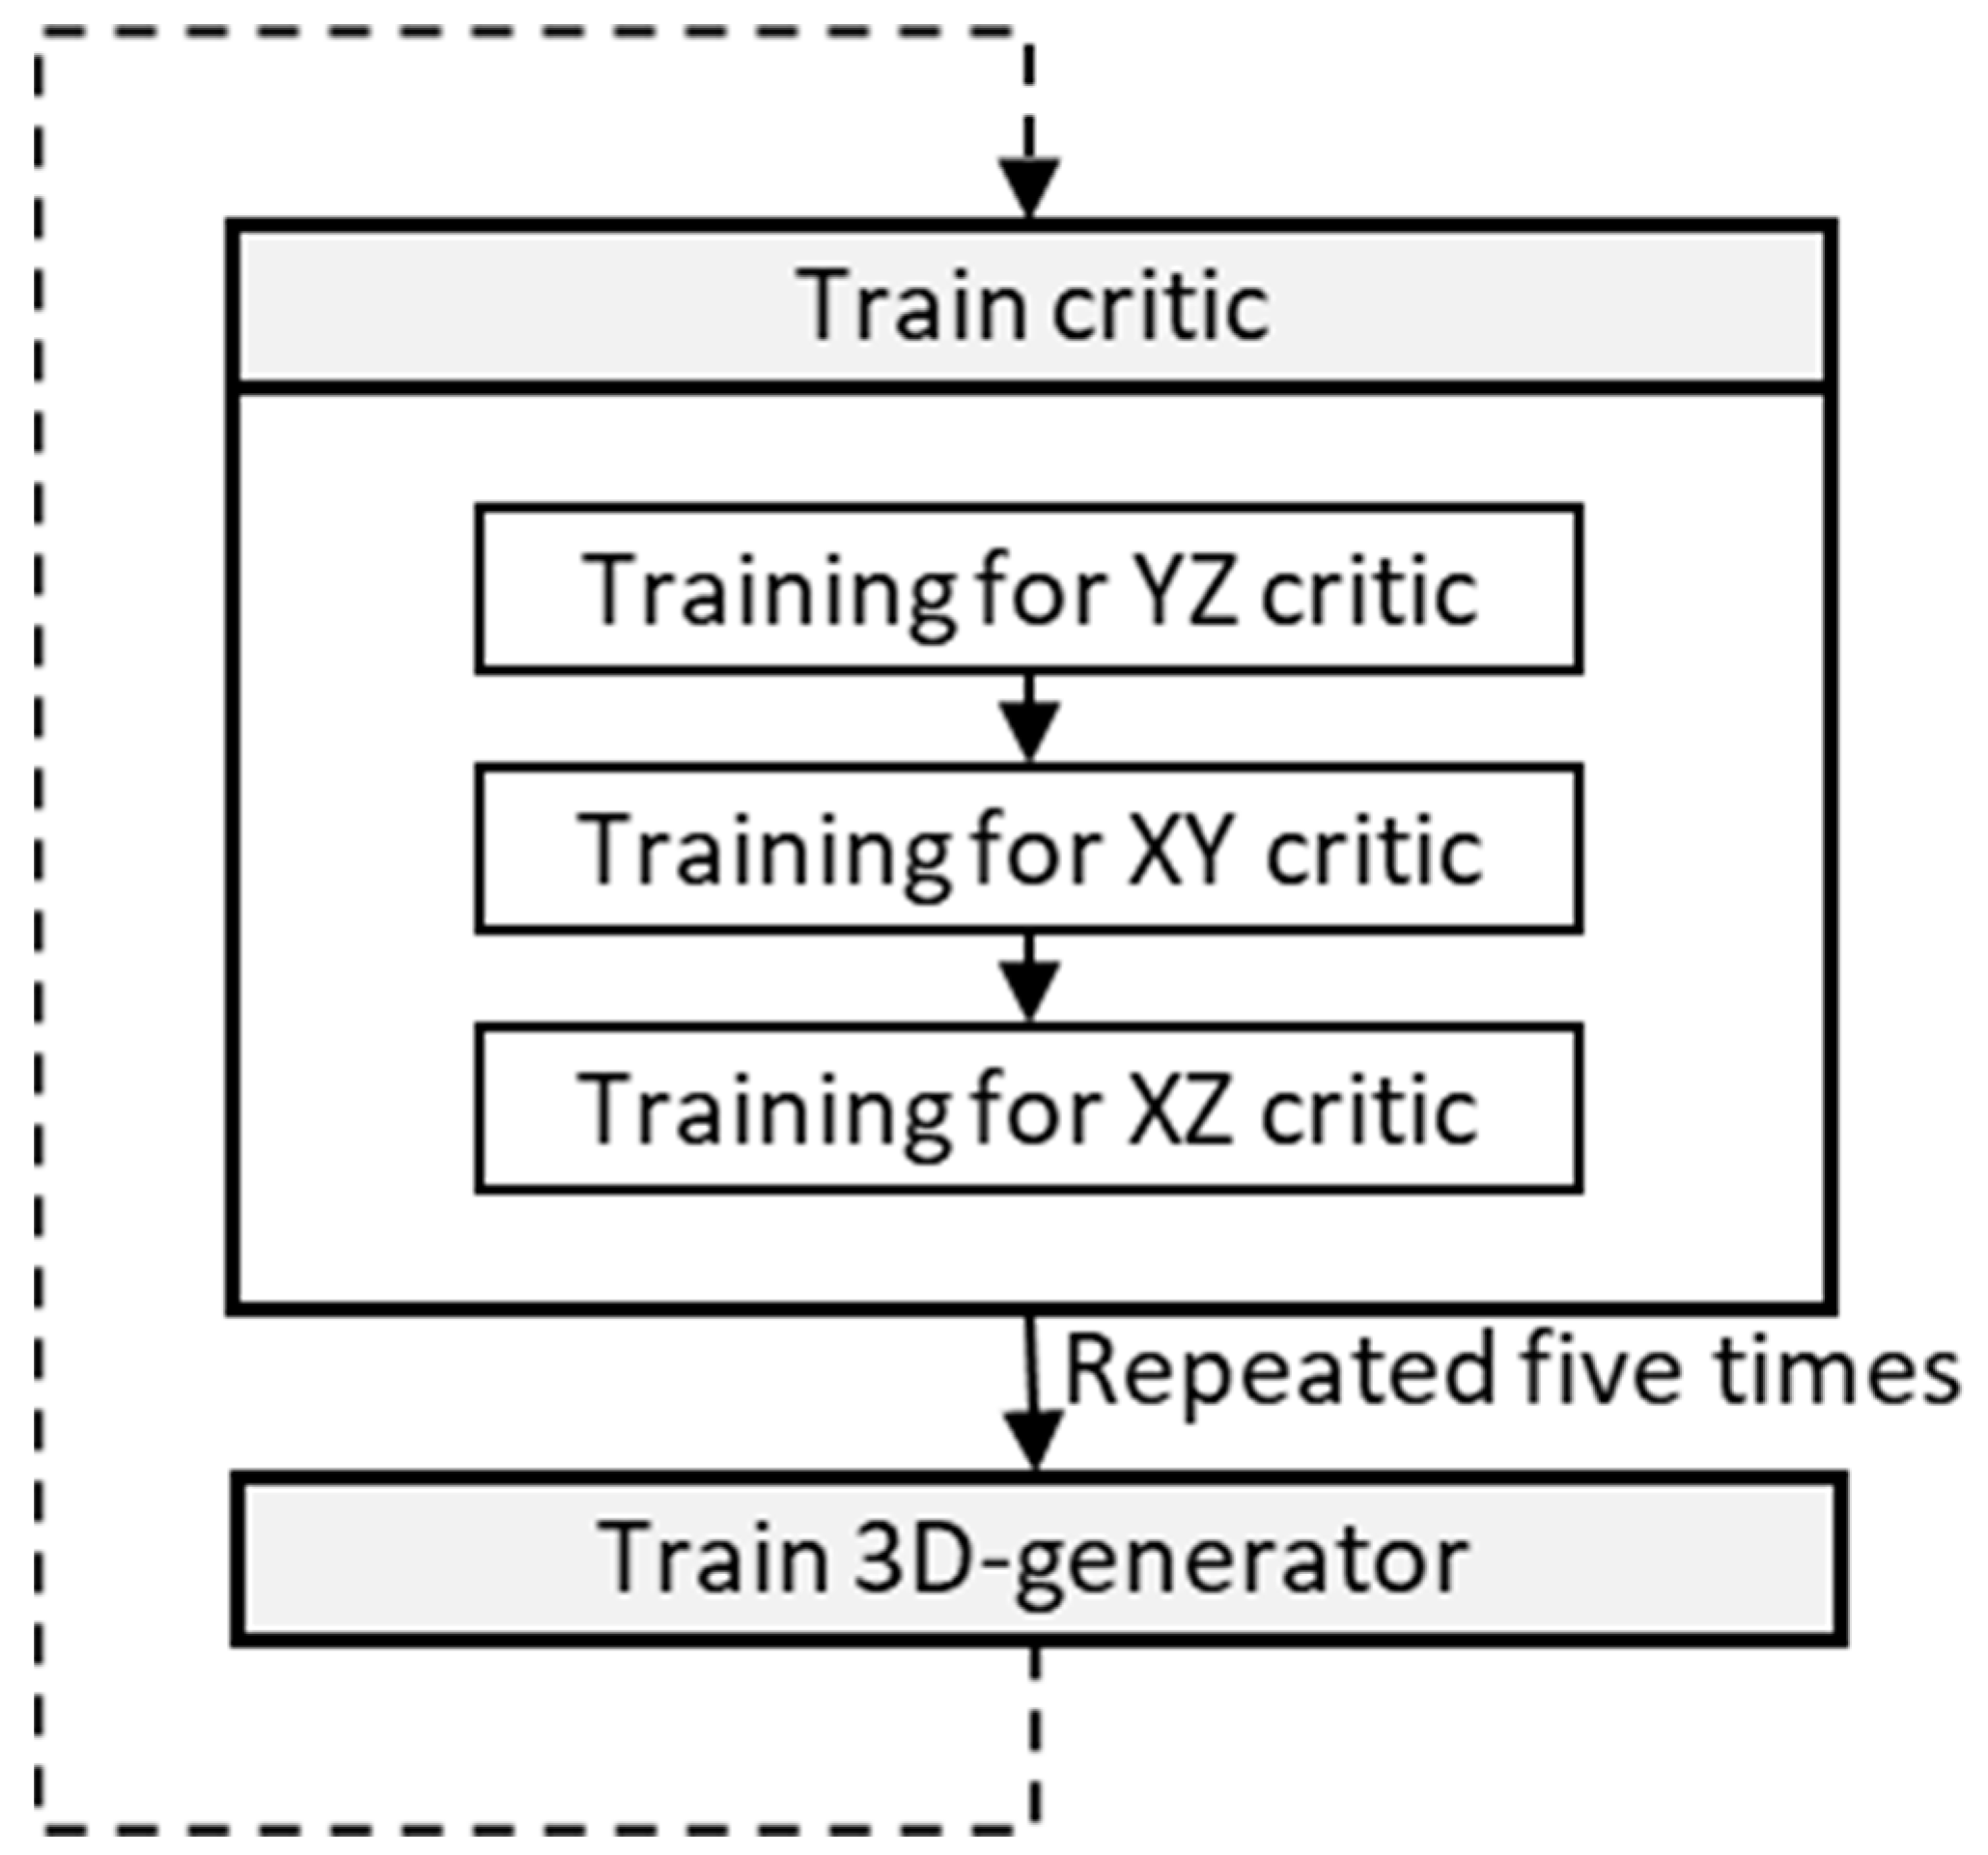
2. Modified Architecture of SliceGAN
3. 3D Synthetic Image Quality Evaluation
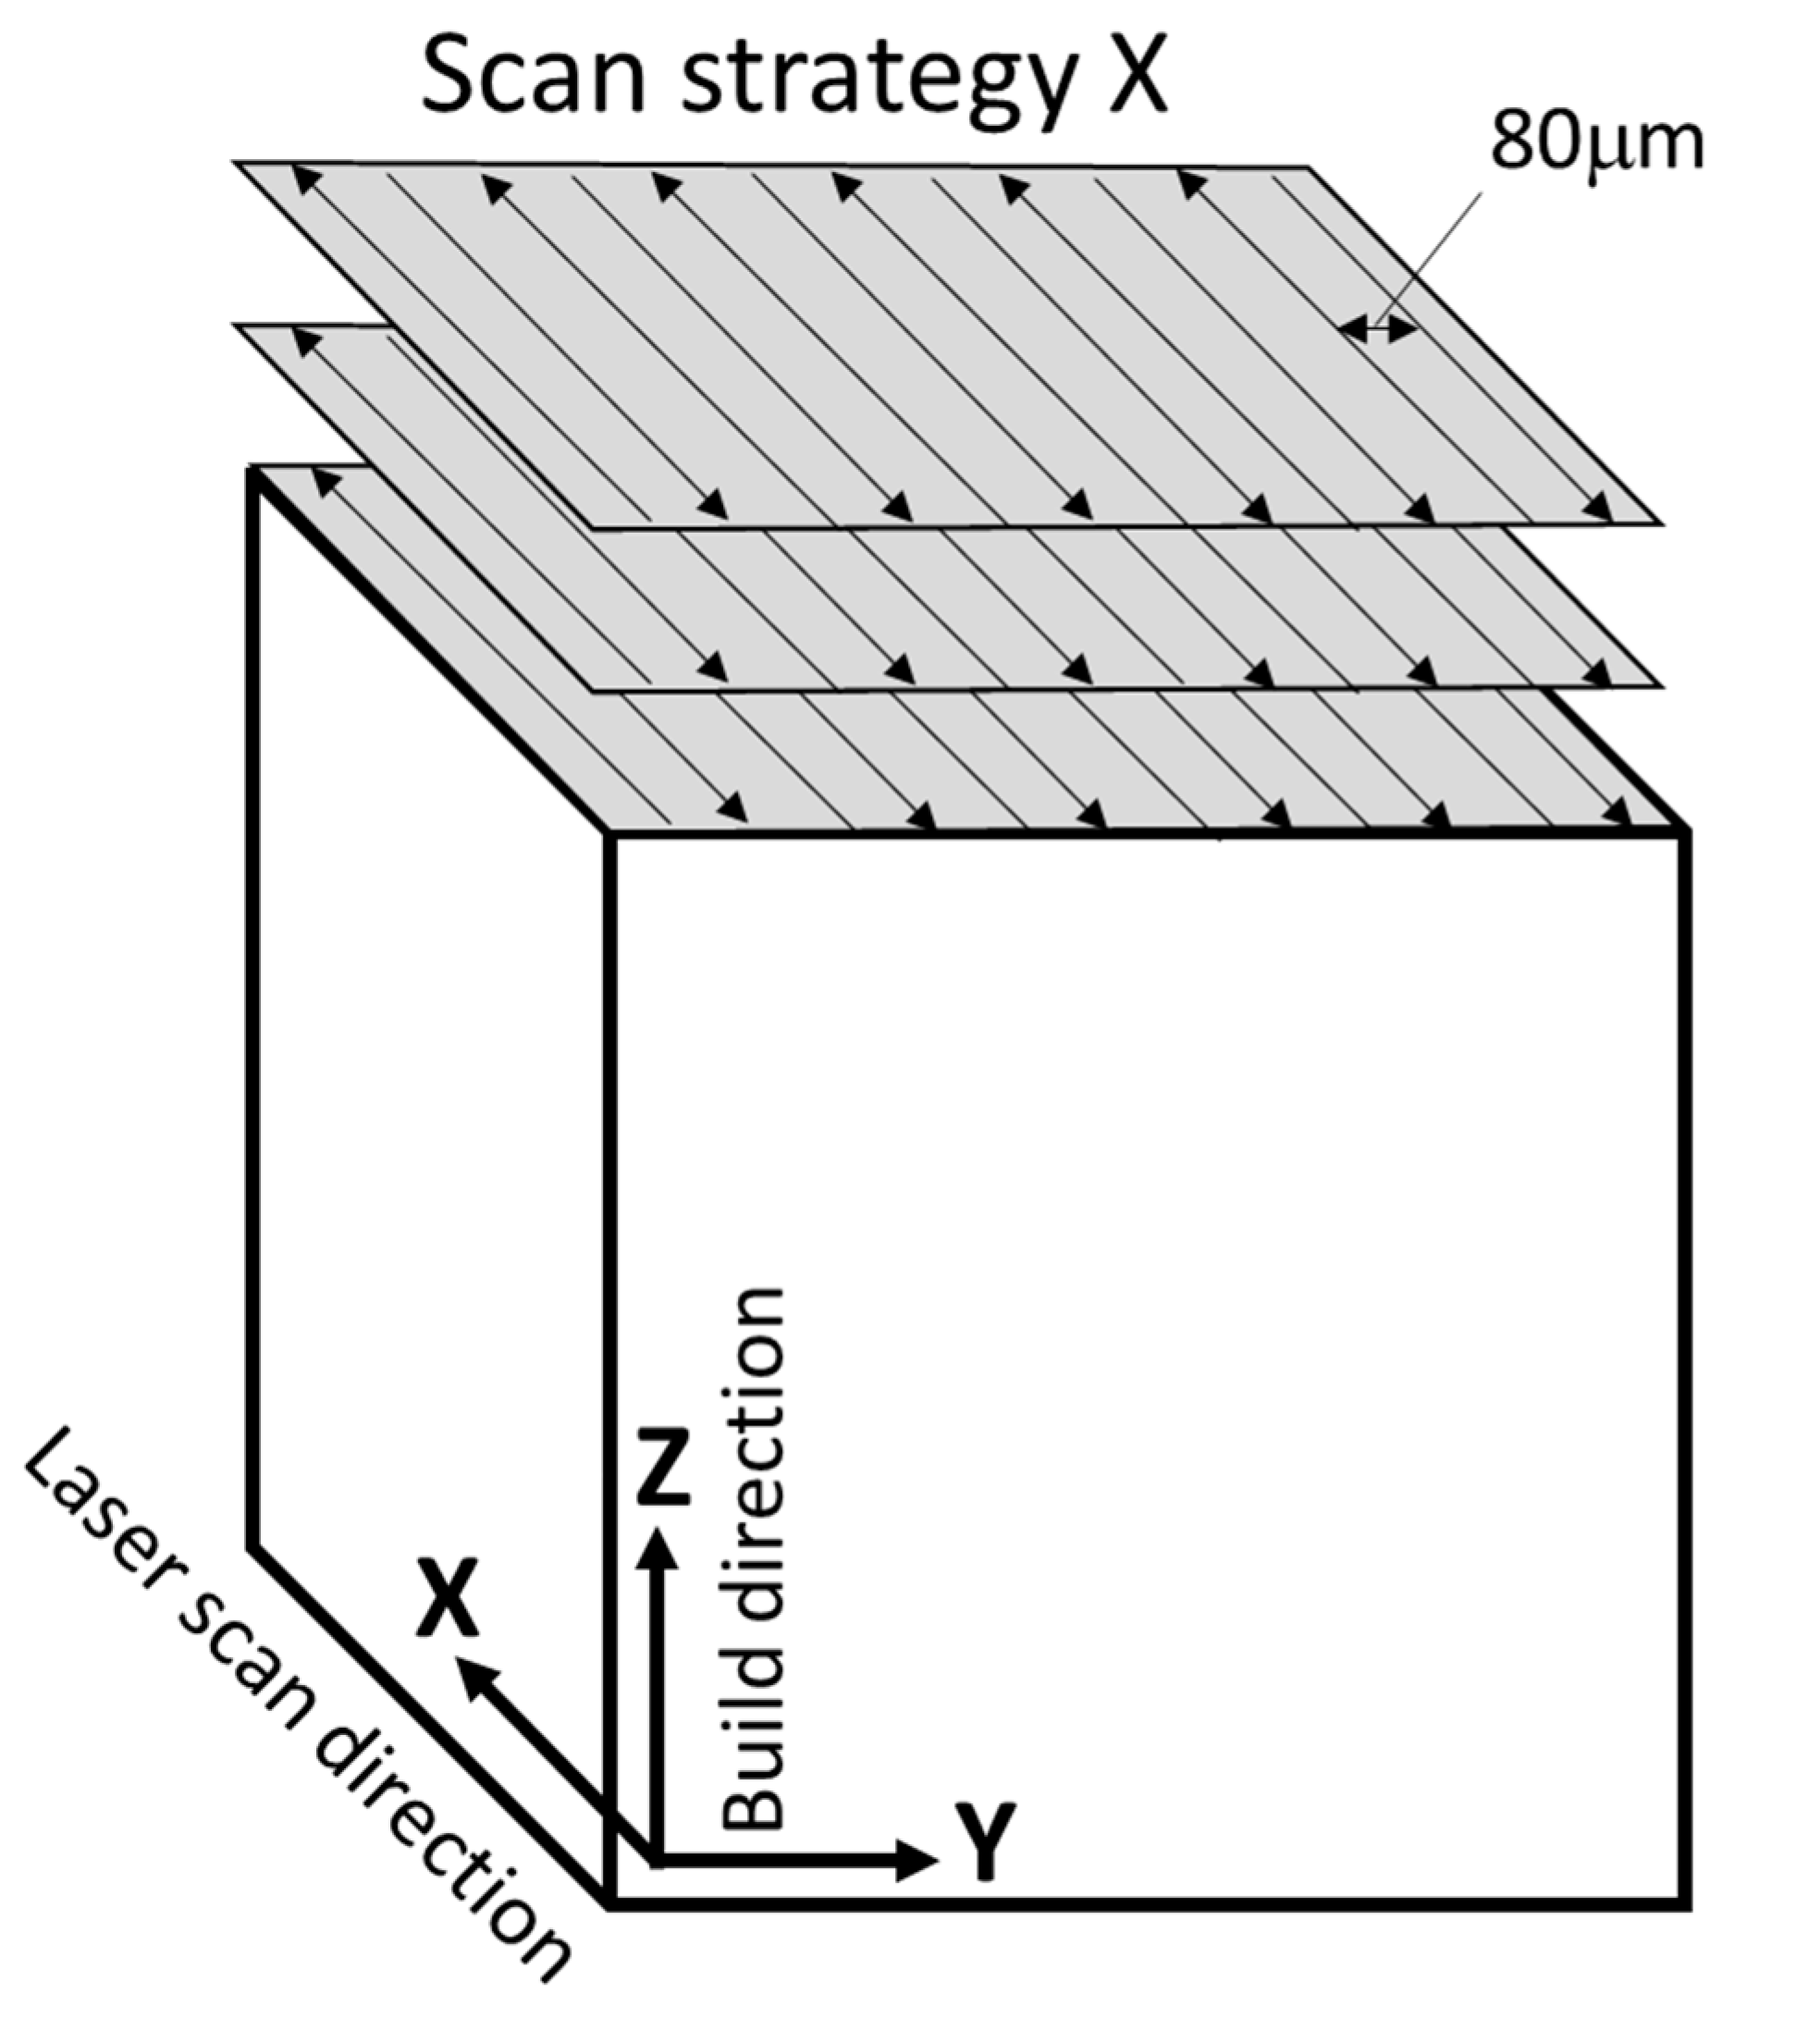
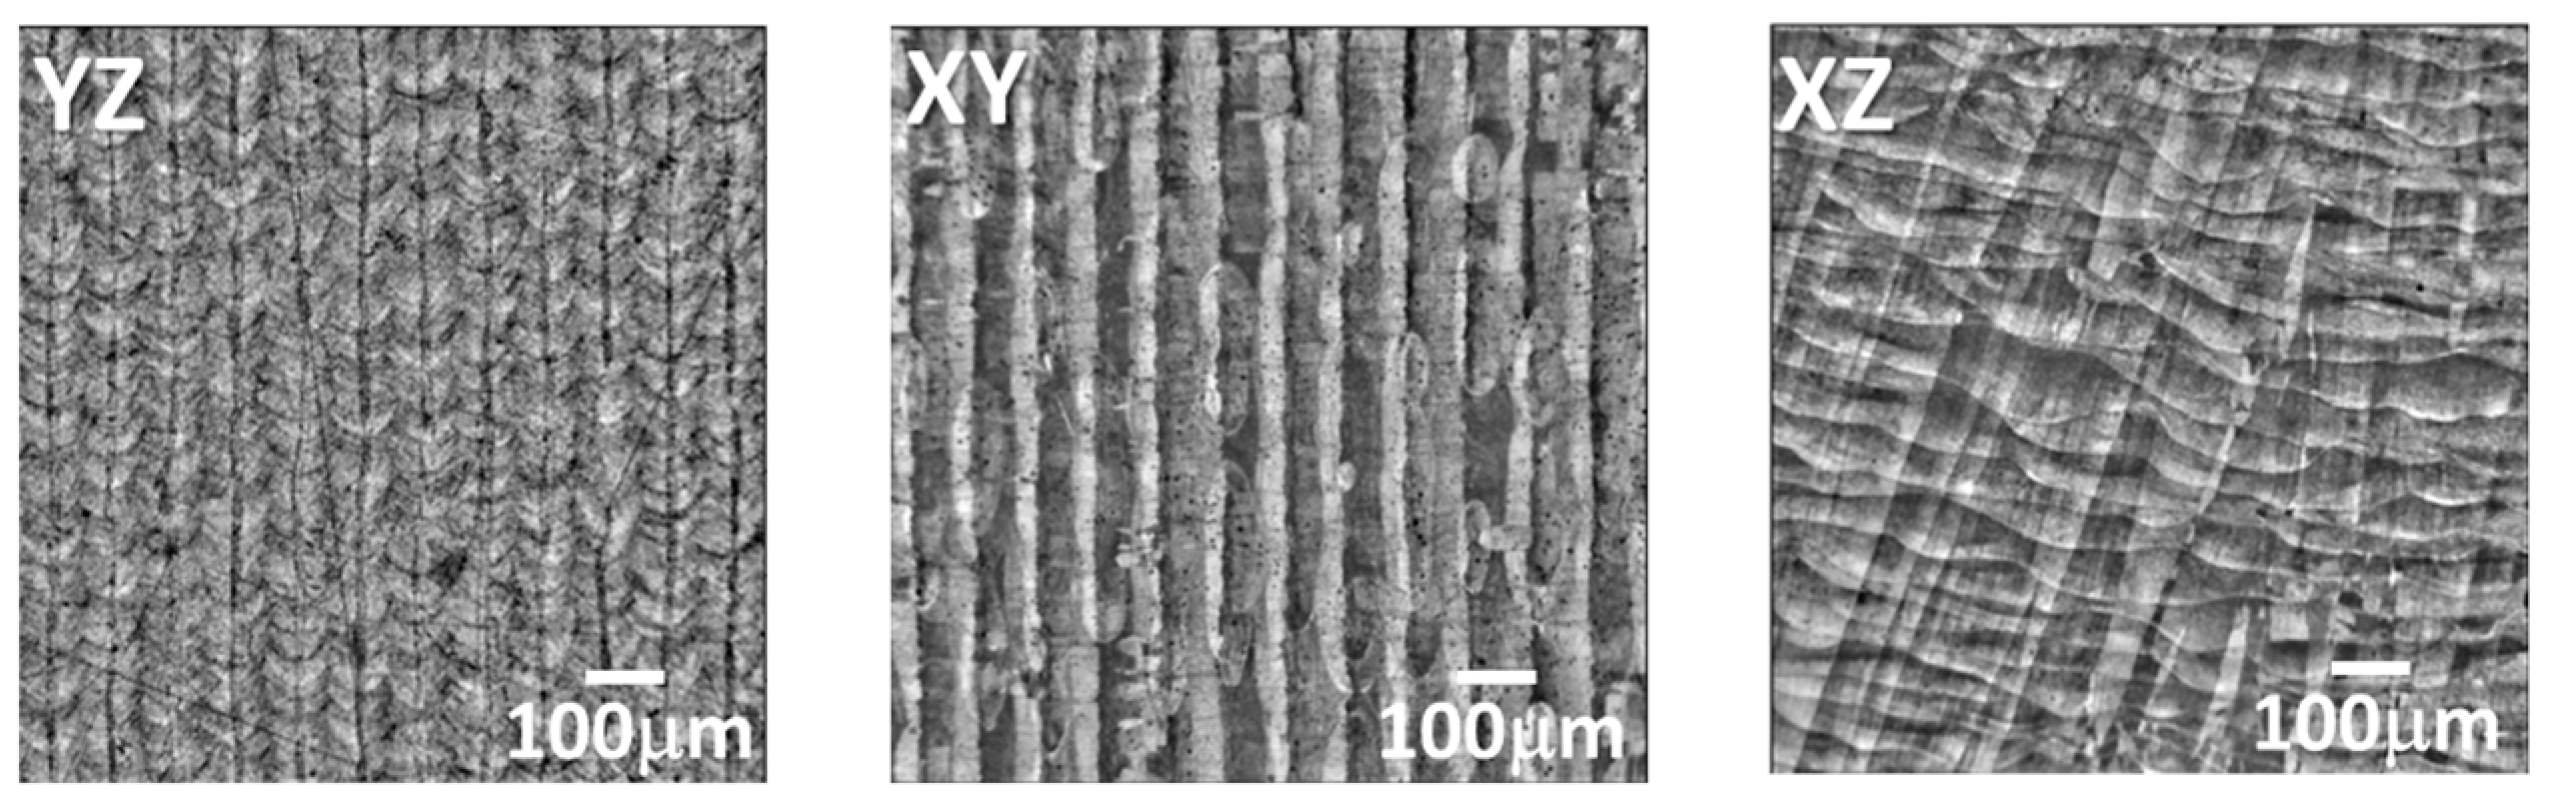
4. Materials
5. Discussion
6. Conclusions
Author Contributions
Funding
Institutional Review Board Statement
Informed Consent Statement
Data Availability Statement
Conflicts of Interest
References
- Zaefferer, S.; Wright, S.I.; Raabe, D. Three-dimensional orientation microscopy in a focused ion beam-scanning microscope: A new dimension of microstructure characterization. Met. Mater. Trans. 2008, 39a, 374–389. [Google Scholar] [CrossRef]
- Adachi, Y.; Sato, N.; Ojima, M.; Nakayama, M.; Wang, Y.T. Development of fully automated serial-sectioning 3D microscope and topological approach to pearlite and dual-phase microstructure in steels. In Proceedings of the First International Conference on 3D Materials Science at Seven Springs; Springer: Philadelphia, PA, USA, 2012. [Google Scholar]
- Withers, P.J.; Bouman, C.; Carmignato, S.; Cnudde, V.; Grimaldi, D.; Hagen, C.K.; Maire, E.; Manley, M.; Plessis, A.D.; Stock, S.R. X-ray computed tomography. Nat. Rev. Methods Prim. 2021, 1, 18. [Google Scholar] [CrossRef]
- Kench, S.; Cooper, S.J. Generating three-dimensional structures from a two-dimensional slice with generative adversarial network-based dimensionality expansion. Nat. Mach. Intell. 2021, 3, 299–305. [Google Scholar] [CrossRef]
- Goodfellow, I.; Pouget-Abadie, J.; Mirza, M.; Xu, B.; Warde-Farley, D.; Ozair, S.; Courville, A.; Bengio, Y. Generative adversarial networks. Adv. Neural Inf. Process. Syst. 2014, 27, 2672. [Google Scholar] [CrossRef]
- Kingma, D.P.; Welling, M. An introduction to variational autoencoders. FNT Mach. Learn. 2019, 12, 307–392. [Google Scholar] [CrossRef]
- Gulrajani, I.; Ahmed, F.; Arjovsky, M.; Dumoulin, V.; Courville, A. Improved Training of Wasserstein GANs. arXiv 2017, arXiv:1704.00028. [Google Scholar]
- Sugiura, K.; Ogawa, T.; Adachi, Y. Hourly work of 3D microstructural visualization of dual phase steels by SliceGAN. Adv. Theory Simul. 2022, 5, 2200132. [Google Scholar] [CrossRef]
- Sun, S.-H.; Ishimoto, T.; Hagihara, K.; Tsutsumi, Y.; Hanawa, T.; Nakano, T. Excellent mechanical and corrosion properties of austenitic stainless steel with a unique crystallographic lamellar microstructure via selective laser melting. Scr. Mater. 2019, 159, 89–93. [Google Scholar] [CrossRef]
- Box, G.E.P.; Jenkins, G.M.; Reinsel, G.C. Time Series Analysis. In Forecasting and Control, 3rd ed.; Prentice Hall: Hoboken, NJ, USA, 1994. [Google Scholar]
- Heideman, M.T.; Johnson, D.H.; Burrus, C.S. Gauss and the history of the fast Fourier transform. Arch. Hist. Exact Sci. 1985, 34, 265–277. [Google Scholar] [CrossRef]
- Ishimoto, T.; Hagihara, K.; Hisamoto, K.; Sun, S.-H.; Nakano, T. Crystallographic texture control of beta-type Ti–15Mo–5Zr–3Al alloy by selective laser melting for the development of novel implants with a biocompatible low Young’s modulus. Scr. Mater. 2017, 132, 34–38. [Google Scholar] [CrossRef]
- Sun, S.-H.; Hagihara, K.; Nakano, T. Effect of scanning strategy on texture formation in Ni-25 at%Mo alloys fabricated by selective laser melting. Mater. Des. 2018, 140, 307–316. [Google Scholar] [CrossRef]
- Hagihara, K.; Nakano, T.; Suzuki, M.; Ishimoto, T.; Sun, S.H. Successful additive manufacturing of MoSi2 including crystallographic texture and shape control. J. Alloys Compd. 2017, 696, 67–72. [Google Scholar] [CrossRef]
- Nagase, T.; Hori, T.; Todai, M.; Sun, S.-H.; Nakano, T. Additive manufacturing of dense components in beta-titanium alloys with crystallographic texture from a mixture of pure metallic element powders. Mater. Des. 2019, 173, 107771. [Google Scholar] [CrossRef]
- Wang, Z.L.; Ogawa, T.; Adachi, Y. Property predictions for dual-phase steels using persistent homology and machine learning. Adv. Theory Simul. 2020, 3, 1900227. [Google Scholar] [CrossRef]


| Generator | |||
|---|---|---|---|
| Layer | Function | Kernel, Stride, Padding | Output Shape |
| Input | - | - | 64 × 4 × 4 × 4 |
| 1 | ConvTranspose3d | 4, 2, 2 | 512 × 6 × 6 × 6 |
| BatchNorm3d | - | ||
| ReLU | - | ||
| 2 | ConvTranspose3d | 4, 2, 2 | 256 × 10 × 10 × 10 |
| BatchNorm3d | - | ||
| ReLU | - | ||
| 3 | ConvTranspose3d | 4, 2, 2 | |
| BatchNorm3d | - | 128 × 18 × 18 × 18 | |
| ReLU | - | ||
| 4 | ConvTranspose3d | 4, 2, 2 | 64 × 34 × 34 × 34 |
| BatchNorm3d | - | ||
| ReLU | - | ||
| 5 | ConvTranspose3d | 4, 2, 3 | 1 × 64 × 64 × 64 |
| tanh | - | ||
| Critic | |||
| Layer | Function | Kernel, Stride, Padding | Output Shape |
| Input | - | - | 1×64×64 |
| 1 | Conv2d | 4, 2, 1 | 64×32×32 |
| ReLU | - | ||
| 2 | Conv2d | 4, 2, 1 | 128×16×16 |
| ReLU | - | ||
| 3 | Conv2d | 4, 2, 1 | 256×8×8 |
| ReLU | - | ||
| 4 | Conv2d | 4, 2, 1 | 512×4×4 |
| ReLU | - | ||
| 5 | Conv2d | 4, 2, 0 | 1×1×1 |
| Generator | |||
|---|---|---|---|
| Layer | Function | Kernel, Stride, Padding | Output Shape |
| Input | - | - | 64 × 4 × 4 × 4 |
| 1 | ConvTranspose3d | 4, 2, 2 | 512 × 6 × 6 × 6 |
| BatchNorm3d | - | ||
| ReLU | - | ||
| 2 | ConvTranspose3d | 4, 2, 2 | 256 × 10 × 10 × 10 |
| BatchNorm3d | - | ||
| ReLU | - | ||
| 3 | ConvTranspose3d | 4, 2, 2 | |
| BatchNorm3d | - | 128 × 18 × 18 × 18 | |
| ReLU | - | ||
| 4 | ConvTranspose3d | 4, 2, 2 | 64 × 34 × 34 × 34 |
| BatchNorm3d | - | ||
| ReLU | - | ||
| 5 | ConvTranspose3d | 4, 2, 2 | 32 × 66 × 66 × 66 |
| BatchNorm3d | - | ||
| ReLU | - | ||
| 6 | ConvTranspose3d | 4, 2, 3 | 1 × 128 × 128 × 128 |
| tanh | - | ||
| Critic | |||
| Layer | Function | Kernel, Stride, Padding | Output Shape |
| Input | - | - | 1 × 128 × 128 |
| 1 | Conv2d | 4, 2, 1 | 32 × 66 × 66 |
| ReLU | - | ||
| 2 | Conv2d | 4, 2, 1 | 64 × 32 × 32 |
| ReLU | - | ||
| 3 | Conv2d | 4, 2, 1 | 128 × 16 × 16 |
| ReLU | - | ||
| 4 | Conv2d | 4, 2, 1 | 256 × 8 × 8 |
| ReLU | - | ||
| 5 | Conv2d | 4, 2, 1 | 512 × 4 × 4 |
| ReLU | - | ||
| 6 | Conv2d | 4, 2, 0 | 1 × 1 × 1 |
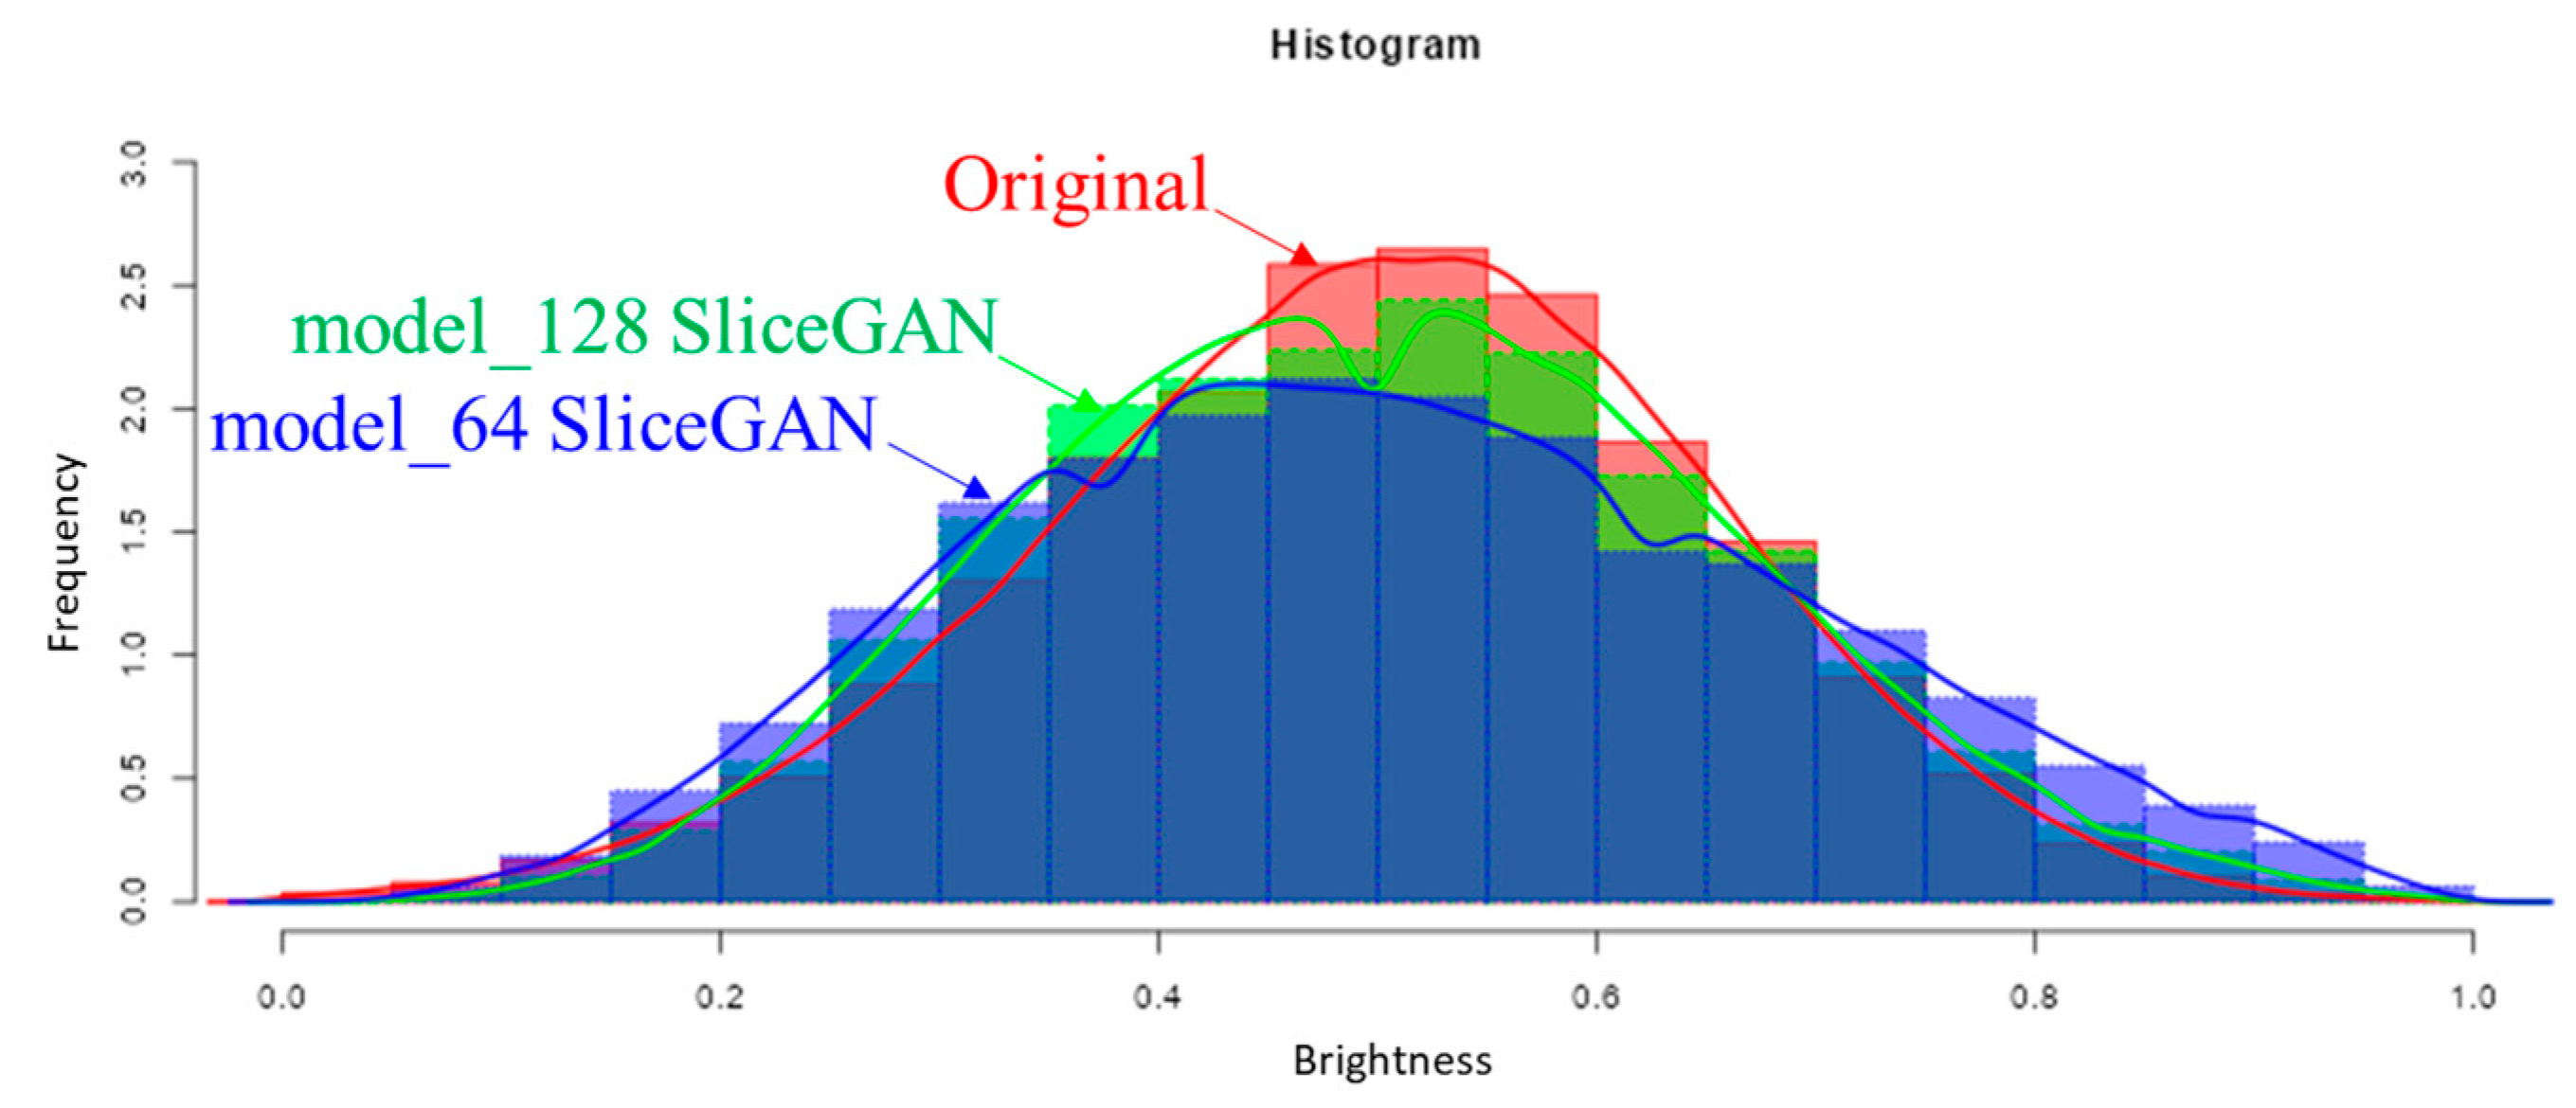
| Mean | Standard Deviation | |
|---|---|---|
| Original image (YZ section) | 0.5001 | 0.1521 |
| Model_64 SliceGAN image (YZ section) | 0.5045 ± 0.0067 | 0.1789 ± 0.047 |
| Model_128 SliceGAN image (YZ section) | 0.5007 ± 0.0082 | 0.1552 ± 0.067 |
Disclaimer/Publisher’s Note: The statements, opinions and data contained in all publications are solely those of the individual author(s) and contributor(s) and not of MDPI and/or the editor(s). MDPI and/or the editor(s) disclaim responsibility for any injury to people or property resulting from any ideas, methods, instructions or products referred to in the content. |
© 2023 by the authors. Licensee MDPI, Basel, Switzerland. This article is an open access article distributed under the terms and conditions of the Creative Commons Attribution (CC BY) license (https://creativecommons.org/licenses/by/4.0/).
Share and Cite
Sugiura, K.; Ogawa, T.; Adachi, Y.; Sun, F.; Suzuki, A.; Yamanaka, A.; Nakada, N.; Ishimoto, T.; Nakano, T.; Koizumi, Y. Big-Volume SliceGAN for Improving a Synthetic 3D Microstructure Image of Additive-Manufactured TYPE 316L Steel. J. Imaging 2023, 9, 90. https://doi.org/10.3390/jimaging9050090
Sugiura K, Ogawa T, Adachi Y, Sun F, Suzuki A, Yamanaka A, Nakada N, Ishimoto T, Nakano T, Koizumi Y. Big-Volume SliceGAN for Improving a Synthetic 3D Microstructure Image of Additive-Manufactured TYPE 316L Steel. Journal of Imaging. 2023; 9(5):90. https://doi.org/10.3390/jimaging9050090
Chicago/Turabian StyleSugiura, Keiya, Toshio Ogawa, Yoshitaka Adachi, Fei Sun, Asuka Suzuki, Akinori Yamanaka, Nobuo Nakada, Takuya Ishimoto, Takayoshi Nakano, and Yuichiro Koizumi. 2023. "Big-Volume SliceGAN for Improving a Synthetic 3D Microstructure Image of Additive-Manufactured TYPE 316L Steel" Journal of Imaging 9, no. 5: 90. https://doi.org/10.3390/jimaging9050090
APA StyleSugiura, K., Ogawa, T., Adachi, Y., Sun, F., Suzuki, A., Yamanaka, A., Nakada, N., Ishimoto, T., Nakano, T., & Koizumi, Y. (2023). Big-Volume SliceGAN for Improving a Synthetic 3D Microstructure Image of Additive-Manufactured TYPE 316L Steel. Journal of Imaging, 9(5), 90. https://doi.org/10.3390/jimaging9050090